 Lian Zong1
 Yuanjian Yang
 Yubin Li
- 1Collaborative Innovation Centre on Forecast and Evaluation of Meteorological Disasters, School of Atmospheric Physics, Nanjing University of Information Science and Technology, Nanjing, China
- 2Department of Atmospheric Science, School of Environmental Studies, China University of Geosciences, Wuhan, China
- 3Laboratory for Climate Studies, National Climate Center, China Meteorological Administration, Beijing, China
- 4Chinese Academy of Meteorological Sciences, China Meteorological Administration, Beijing, China
Large-scale modifications to urban underlying surfaces owing to rapid urbanization have led to stronger urban heat island (UHI) effects and more frequent urban heat wave (HW) events. Based on observations of automatic weather stations in Beijing during the summers of 2014–2020, we studied the interaction between HW events and the UHI effect. Results showed that the UHI intensity (UHII) was significantly aggravated (by 0.55°C) during HW periods compared to non-heat wave (NHW) periods. Considering the strong impact of unfavorable weather conditions and altered land use on the urban thermal environment, we evaluated the modulation of HW events and the UHI effect by wind speed and local climatic zones (LCZs). Wind speeds in urban areas were weakened due to the obstruction of dense high-rise buildings, which favored the occurrence of HW events. In detail, 35 HW events occurred over the LCZ1 of a dense high-rise building area under low wind speed conditions, which was much higher than that in other LCZ types and under high wind speed conditions (< 30 HW events). The latent heat flux in rural areas has increased more due to the presence of sufficient water availability and more vegetation, while the increase in heat flux in urban areas is mainly in the form of sensible heat flux, resulting in stronger UHI effect during HW periods. Compared to NHW periods, lower boundary layer and wind speed in the HW events weakened the convective mixing of air, further expanding the temperature gap between urban and rural areas. Note that LCZP type with its high-density vegetation and water bodies in the urban park area generally exhibited, was found to have a mitigating effect on the UHI, whilst at the same time increasing the frequency and duration of HW events during HW periods. Synergies between HWs and the UHI amplify both the spatial and temporal coverage of high-temperature events, which in turn exposes urban residents to additional heat stress and seriously threatens their health. The findings have important implications for HWs and UHII forecasts, as well as for scientific guidance on decision-making to improve the thermal environment and to adjust the energy structure.
Introduction
Economies around the world are developing rapidly with global economic integration. Meanwhile, the processes of urbanization and industrialization are also accelerating year by year. Due to increases in population density, immense changes in land use, increases in anthropogenic heat emissions, and reduced green space have led to strong urban heat island (UHI) effects (Yang et al., 2016; Li et al., 2020). This phenomenon, manifested by enhanced air/surface temperature in urban areas compared to their rural surrounding areas (Oke and Maxwell, 1975; Roth, 2007), is one of the key characteristics of urban climates. The UHI effect has become one of the primary factors affecting the urban ecological environment, with important impacts on extreme climate events, human health, and economic losses (Ren, 2015; Rizwan et al., 2008; Yang et al., 2019; Luo and Lau, 2018; Luo and Lau, 2019).
As the capital of China, Beijing is one of the fastest developing metropolizes in recent decades. A significant UHI phenomenon has been induced in Beijing by its rapid urbanization in the past few decades (Liu et al., 2007; Zheng et al., 2018; Yang et al., 2020b). Liu et al. (2007) studied the interannual variation of the near-surface UHI intensity (UHII) during 1977–2000 in Beijing and found that the temperature rise in urban areas was greater than in rural areas. Based on long-term temperature observations from 1967 to 2016, Huang and Lu (2018) reported that the UHII had increased significantly, with a growth rate of about 0.29°C/10a, in those 50 years. Many studies have also pointed out that, usually, the UHII in Beijing is stronger in winter and weaker in summer (Xie et al., 2006; Yang et al., 2013); while in terms of daily variation, it tends to be stronger at night than during the day (Ren et al., 2007; Huang and Lu, 2018).
In the context of global warming, extreme high-temperature events are increasing in both frequency and duration (Meehl and Tebaldi, 2004; Yang et al., 2017; Lehner et al., 2018). The superimposed effect of heat waves (HWs) and UHIs causes more days and areas to experience high-temperature events, which poses a serious threat to the health of urban dwellers owing to intensified and prolonged heat exposure (Tan et al., 2010; Chew et al., 2021). Li et al. (2015) revealed that the UHII is enhanced during HW periods compared to non-HW (NHW) periods in Beijing. Also, consistent synergies between UHIs and HWs have been reported in western Sydney (Khan et al., 2020), Seoul (Ngarambe et al., 2020), Singapore (Mughal et al., 2020), and Rome (Zinzi et al., 2020). Regarding the factors modulating UHIs and HWs, they are complex and vary both spatially and temporally, but can broadly be categorized into natural-type factors (local topography, synoptic weather, meteorological factors such as wind speed, cloud cover, relative humidity, etc.) and anthropogenic-type factors (i.e., anthropogenic activities such as emissions of anthropogenic heat and aerosols, as well as land use/land cover changes related to rapid urbanization, etc.) (Li et al., 2015; Ngarambe et al., 2020; Zinzi et al., 2020). To some extent, buildings, the surface composition, and pavements also affect the exchanges of heat in cities (Shahidan et al., 2012; Wong et al., 2017; He, 2019). Therefore, the synergies between UHIs and HWs are highly localized. In most previous studies, the air temperature at a single urban site has been used to represent the air temperature of an entire city. Clearly, this is flawed, as the temperature at a meteorological station can only represent the temperature of its immediate surroundings, and different meteorological stations in large cities might differ completely in terms of their underlying surface types. Therefore, it is difficult to make generalizations on this basis.
Accordingly, in this study, we took local climate zones [LCZs—a new and systematic classification of field sites for heat island studies (Stewart and Oke, 2012)] around the selected automatic weather stations into account. Besides, we also considered the impact of wind speed, since it has a certain heat dissipation effect on different building structures and urban forms (Uehara et al., 2000; Wang Q. et al., 2020). Based on the data from the selected automatic weather stations in Beijing during the summer seasons of 2014–2020, we explored how LCZs, together with wind speed, modulate the UHI and HWs in Beijing.
Data and Methods
Summertime hourly meteorological data (surface air temperature and wind speed) during 2014–2020, for 10 urban sites and 7 rural sites, were retrieved from automatic weather stations in Beijing (http://data.cma.cn/en). As the capital of China, Beijing has experienced large-scale and rapid changes to its urban environment in the past few decades, with the urban space having expanded mainly in suburban areas in the most recent decade (Li et al., 2021). Therefore, an important selection criterion was applied in that, during the study period (2014–2020), urban stations had to be within the urban center (considered here as within or near the Fifth Ring Road), and rural stations had to be far away from major construction areas (Figure 1; Table 1). The selection of urban and rural stations refers to the method of previous studies (Yang et al., 2013; Shi et al., 2015; Shi et al., 2021). The method described by Xu et al. (2013) was used for quality control and homogenization of the daily meteorological data.
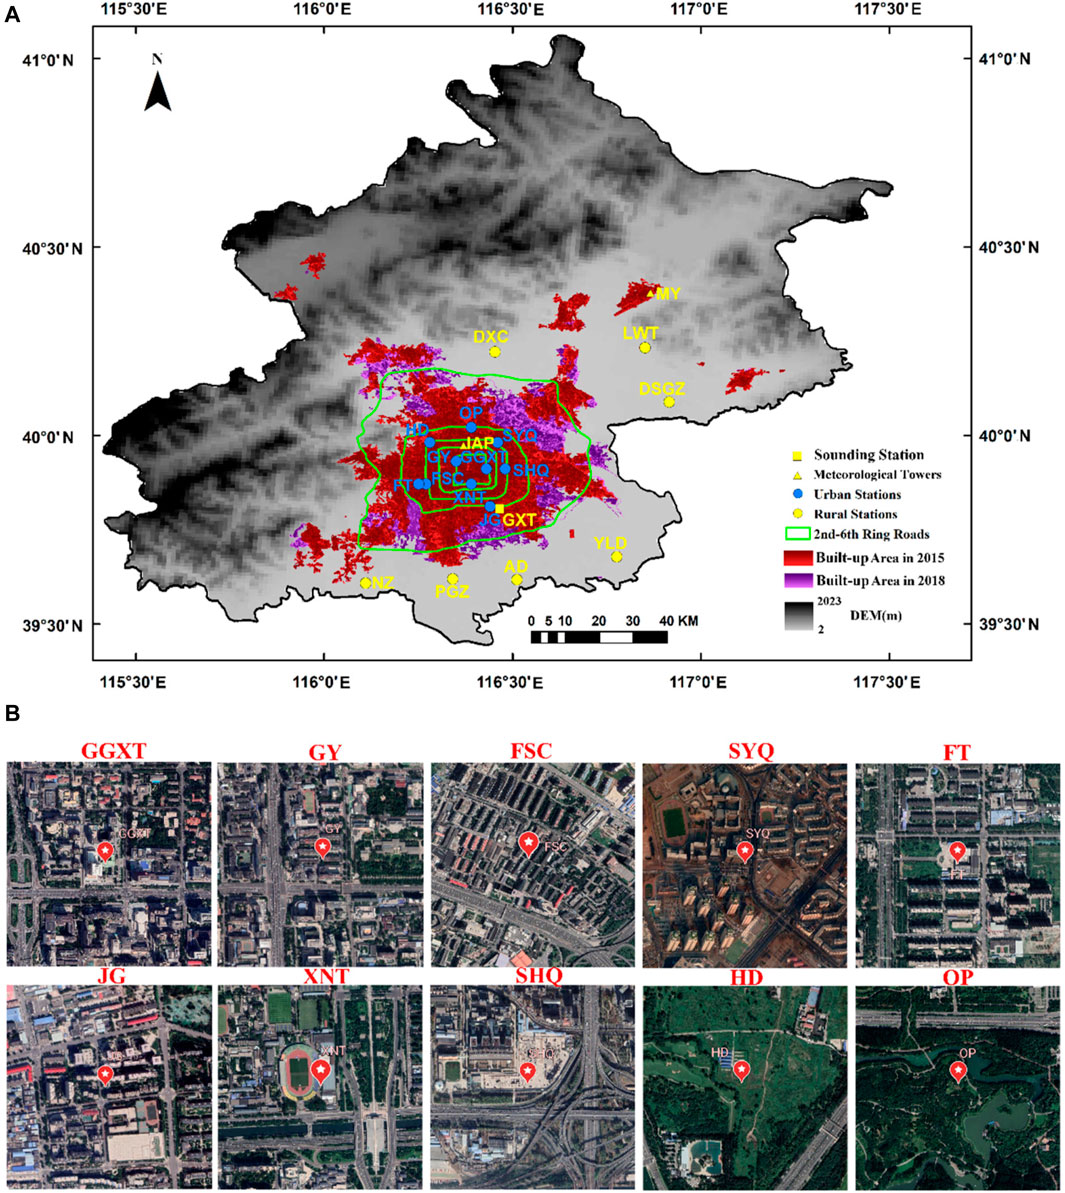
FIGURE 1. (A) Geographical locations of reference stations within the boundaries of Beijing. (B) Google Earth images of urban stations. The built-up areas data can be accessed at https://zenodo.org/record/4034161#.YFc56driuUl.
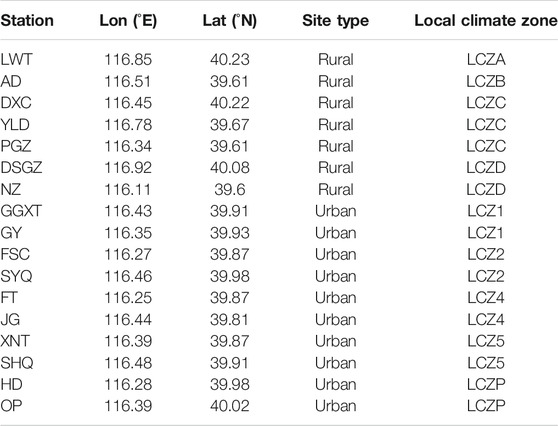
TABLE 1. Geographical locations of the reference stations.
In this study, we defined UHII as the difference between the surface air temperature at each urban site and the surface air temperature averaged over rural sites. Countries and regions around the world adopt different methods to study high-temperature HW events, and the standards for defining high-temperature HWs also vary greatly. HW events are usually identified as cases in which the daily maximum temperature reaches or exceeds a certain threshold for several consecutive days. The threshold for high temperature can be a relative value or an absolute threshold (Ngarambe et al., 2020). In this paper, an HW event is defined as when the daily maximum temperature exceeds 35°C for three consecutive days or more, as described by Yao et al. (2020).
To explore the potential impact of urban forms and land-cover types on the interaction between the UHI and HWs, we obtained the LCZ category of each reference station based on the LCZ dataset produced by the Institute of Urban Meteorology, China Meteorological Administration, Beijing. The fine-scale underlying surface data were derived in SAGA GIS by a random forest classification of the Landsat eight satellite data in 2018 according to the workflow provided by the World Urban Database and Access Portal Tools. This LCZ dataset for Beijing consists of 17 LCZ types with significant differences based on the characteristics of the underlying surface of the urban climate proposed in previous studies (Stewart and Oke, 2012; Stewart et al., 2014). In particular, owing to the rapid urbanization of the city, we defined a special category, LCZH, to classify regions composed of a large number of construction areas. Exploring the thermal environment of urban green spaces as well can help to get a better understanding of their contribution to urban environment and a more comprehensive view on urban thermal environment. Therefore, we also defined the underlying surface of the green space and forest park in the urban as a new type of LCZP to distinguish between the greenery within and outside city. We chose the five most common categories of LCZ (i.e., LCZ1, LCZ2, LCZ4, LCZ5, and LCZP) in the Beijing urban area. Two urban stations for each chosen LCZ were selected in this study (see Figure 1 and Table 1 for their geographical locations). To ensure that the impact of urbanization changes on the reference stations was minimized, an important criterion was employed in that urban stations had to be within or near the 5th Ring Road and remote from LCZH. It is important to emphasize that green space was found in both urban and rural areas, and they had similar underlying surface structures, but a major difference between them was that urban LCZP was mostly forest parkland in the urban center, and there were still urban buildings around it, while the rural green space was far away from urban built-up areas and the thermal impact of human activities was smaller. It is worth noting that this provides strong evidence that green space and vegetation in the city help to effectively alleviate the UHI effect (Doick et al., 2014; Zhou et al., 2019).
Besides, we also referred to observational heat flux data during an HW event (2016.07.09–2016.07.11) and an NHW event (2016.07.06–2016.07.08) at an urban site (Institute of Atmospheric Physics Tower, IAP, at 47 m) and rural site (Miyun Tower, MY, at 36 m) (specific locations are shown in Figure 1A). Similarly, sounding profiles at 0800, 1400, and 2000 LST at Guanxiangtai (GXT) station (see Figure 1A) during this period were used to calculate the boundary layer height (BLH). Furthermore, to study the potential effect of wind speeds on the UHI and HWs, wind speeds were classified into three categories [low (0–0.74 m/s), medium (0.75–1.44 m/s) and high (1.45–11.7 m/s)] using the k-means clustering algorithm. Finally, we employed analysis of variance (ANOVA) tests to assess the UHII differences under different wind speed and LCZ categories, and the statistical significance was tested at a 0.001 confidence level.
Results
UHII Differences Between HW and NHW Periods
Figure 2 shows that the summer UHII in Beijing was strong at night and in the early morning, and weak during the daytime in 2014–2020, which is similar to the results of previous studies (Xie et al., 2006; Liu et al., 2007; Yang et al., 2013). In general, the diurnal variation of summer UHII displays a U-shaped fluctuation. The 7-years average UHII during HW and NHW periods ranged from 0.55 to 2.53°C and from 0.28 to 1.72°C, respectively. Overall, the average UHII during HW periods was larger than that during NHW periods. Moreover, the impact of urbanization on HW events cannot be ignored. With the acceleration of urbanization, urban and suburban stations have experienced varying degrees of warming, which has not only led to a more extensive UHI effect, but also caused more HW events with long durations in urban areas compared to rural areas (Tan et al., 2010; see also Supplementary Figure S1).
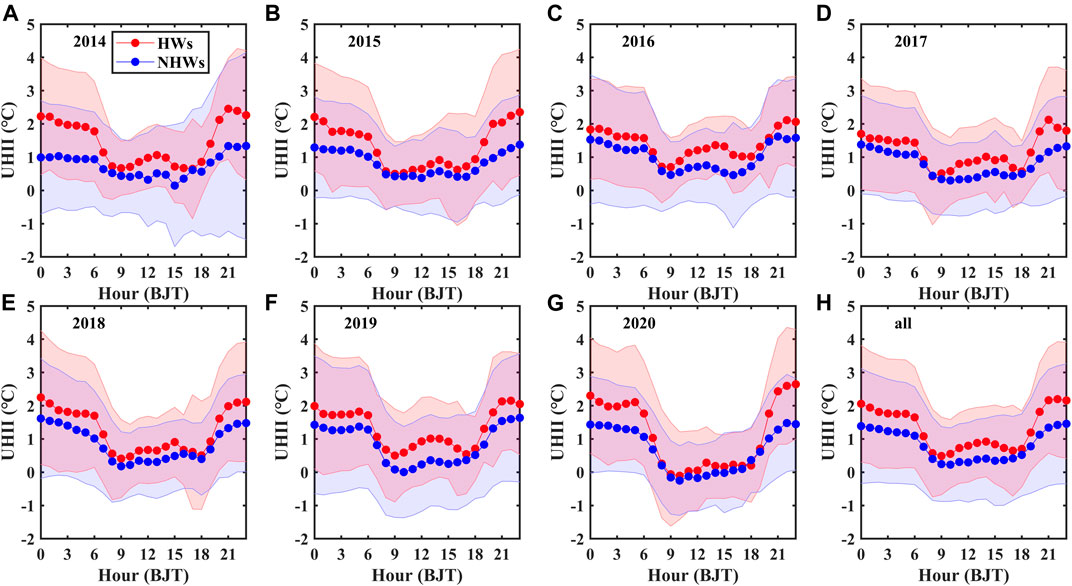
FIGURE 2. Diurnal variation of UHII between HW and NHW periods during summertime (June–August) 2014–2020. HW and NHW periods are indicated by red and blue, respectively. Lines denote average UHII values and shaded areas present the standard deviation of the average UHII values according to all urban reference stations.
In addition, the diurnal cycles of maximum UHII among all urban stations are also shown, to detect the relationship between hourly maximum UHII and HW events (Supplementary Figure S2). Similarly, the average maximum UHII during HW periods was stronger than during NHW periods. To further analyze the difference in UHII between HW and NHW periods, we calculated ΔUHII as the UHII during HW periods minus the UHII during NHW periods, and the diurnal variation of ΔUHII is shown in Figure 3. The ΔUHII reached up to 1.77 and 1.67°C in 2015 and 2020, respectively. While ΔUHII usually reached a minimum at 0900 and 1800 LST, the peak often occurred at noon or at midnight. The diurnal variation of ΔUHII roughly followed a “W” shape. In general, the diurnal variation of ΔmaxUHII is consistent with that of ΔUHII, and are mainly modulated by anthropogenic heat emissions, aerosols, atmospheric circulation, etc. (Zheng et al., 2018; Zheng et al., 2020; Yang et al., 2020a). The HW–NHW differences in UHII suggest that UHII can be amplified by HW events, and then the enhancement of UHII can feed back positively to HWs (Luo and Lau, 2018; Ngarambe et al., 2020).
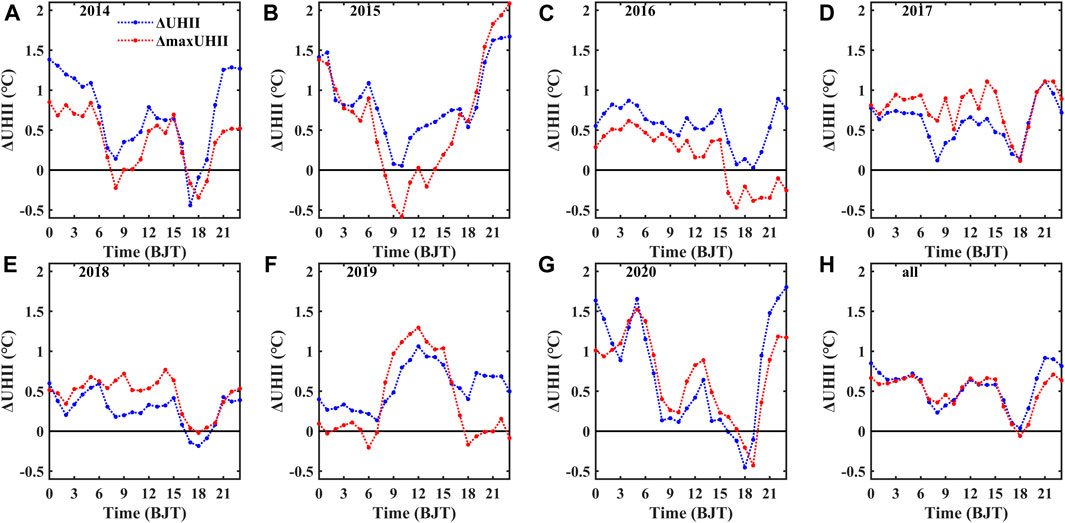
FIGURE 3. Diurnal differences in UHII between HW and NHW periods during summertime (June–August) 2014–2020. Red lines present average maximum UHII values, and blue lines present average UHII values according to all urban reference stations.
Modulation of HWs and UHII by Wind Speed
To assess the influence of wind speed on HWs and UHII, we applied k-means clustering to the wind speed data and divided the results into three categories—namely, high, medium, and low. The numbers of HW events under these different wind speed categories for each urban station are shown in Figure 4 (see also Supplementary Figure S3 for the durations of HW events under different wind speed categories for each urban station). Under high wind speeds, the highest number of HW events (6) was at station SYQ, out of a total of 19 HW days. The number of occurrences of HW events at GGXT, HD, and OP was 0. During medium wind speed periods, 5 out of 10 urban stations experienced more than 10 HW events, the average duration of which was more than 35 days. SHQ had 20 HW events (72 days). As for periods of low wind speed, the number of HW events at GGXT (25) was much higher than at other stations, and much longer (average of 109 days). At many stations, there were fewer HW events under low wind speeds, which may have been due to the smaller threshold difference between the low and medium wind speed categories.
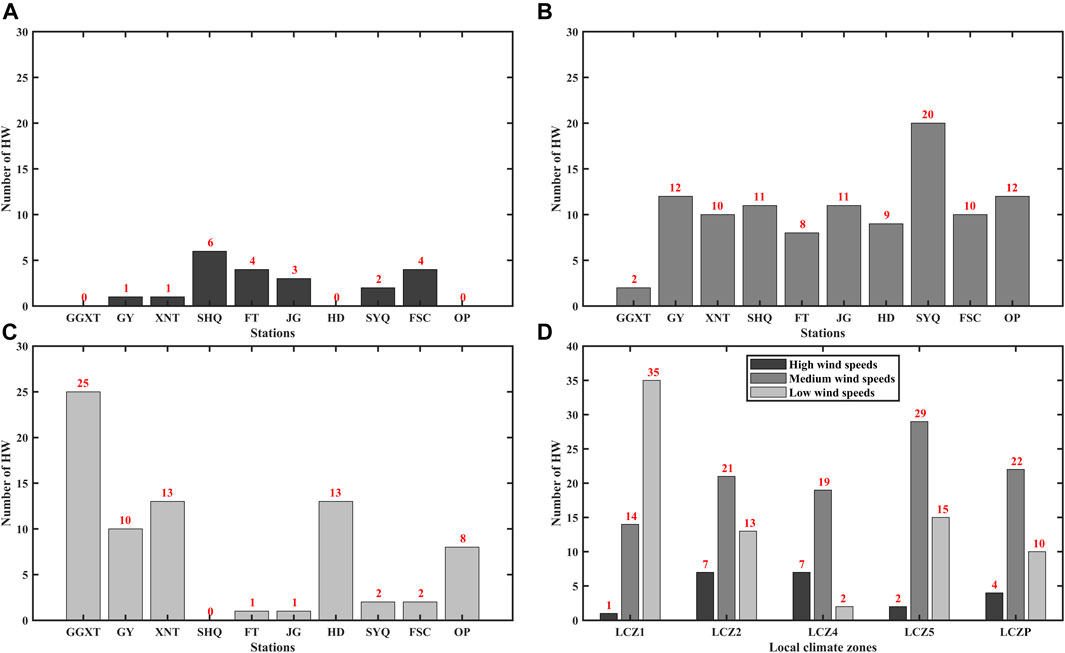
FIGURE 4. Number of HW events under different wind speed conditions at each urban station during 2014–2020: (A) high wind speeds; (B) medium wind speeds; (C) low wind speeds; (D) wind speeds per LCZ.
Figure 5 depicts the UHII values under for each urban station and all urban stations under different wind speed categories. The average UHII value under high, medium and low wind speed was 0.82, 0.85 and 0.99°C, respectively. Based on ANOVA, the average UHII difference of the three wind speed groups was statistically significant, with F (6418) = 18.46 and p < 0.001. Under high wind speeds, the UHIIs of SYQ, FT and SHQ were significantly higher than at other stations. This may have been due to the low number of wind speed samples at these stations; plus, even those samples classified into the high wind speed category were closer to the lower bound of the qualifying range.
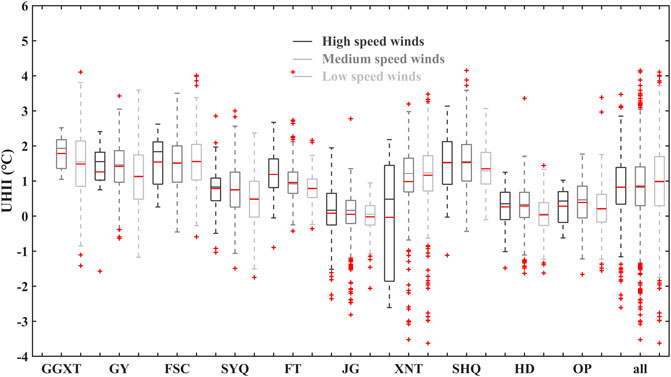
FIGURE 5. Box-and-whisker plots of the UHII values under different wind speed conditions at each urban station during 2014–2020. In the plots, the central box represents the values from the lower to upper quartile (25th to 75th percentile). The vertical line extends from the maximum to the minimum value. The middle black solid line represents the median, the middle red solid line represents the average, and the red plus signs represent outliers.
Modulations of HWs and UHII by the LCZs
To explore how the LCZs modulate HW events and UHI effects, we quantified the HW events and UHII values under each LCZ category. Two urban stations for each category of LCZ were included, and the specific LCZ types of each urban station can be seen in Table 1. It is worth mentioning that LCZ1 stands for a dense high-rise building area, and LCZ2 for a dense middle-rise building area, LCZ4 for an open high-rise building area, LCZ5 for an open mid-rise building area, and LCZP for a sparse tree area.
As shown in Figure 6, in the 7 years of the study period, there were 46, 37, 26, 41 and 32 HW events in LCZ1, LCZ2, LCZ4, LCZ5, and LCZP, with durations of 205, 148, 101, 171, and 135 days, respectively. It is clear that the number and duration of HW events under LCZ1, LCZ2, and LCZ4 was significantly decreasing. It strongly proves that the LCZs have a very positive regulatory effect on HW events. In dense high-rise-building areas, HW events occur more frequently and last longer. Compared with LCZ1 and LCZ2, LCZ4, LCZ5, and LCZP have a lower building density and a relatively small building height to width ratio, which may reduce the duration and frequency of HW events (Ngarambe et al., 2020). Surprisingly, the number of HW events in LCZ5 was higher than in LCZ2 and LCZ4. Why this was the case is further discussed in the next section.
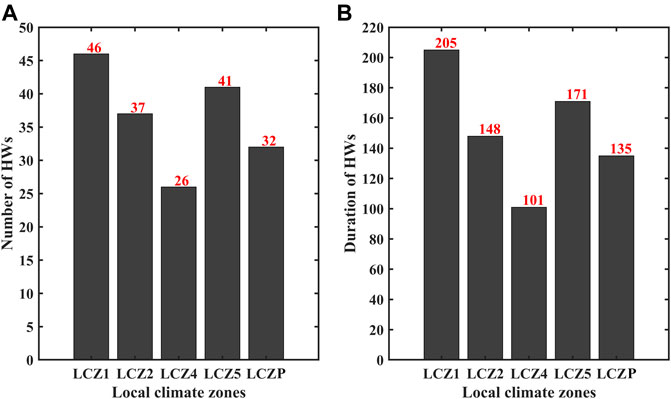
FIGURE 6. Number and duration of HW events under each LCZ.
Furthermore, ANOVA was employed to test the differences in the UHII levels under the five LCZs, giving a result of F (6423) = 498.64 and p < 0.001. The UHII levels under the five LCZs varied significantly. The largest mean UHII value was found in LCZ1, which was 1.38°C. The average UHII of LCZ2, LCZ4, LCZ5, and LCZP was 1.14, 0.51, 1.28 and 0.29°C, respectively. The UHII under LCZ1, LCZ2, LCZ4, and LCZP depended strongly on the characteristics of the underlying surface. Similar to what was found for HW events, the UHII under LCZ5 was also higher than under LCZ2 and LCZ4 (Figure 7).
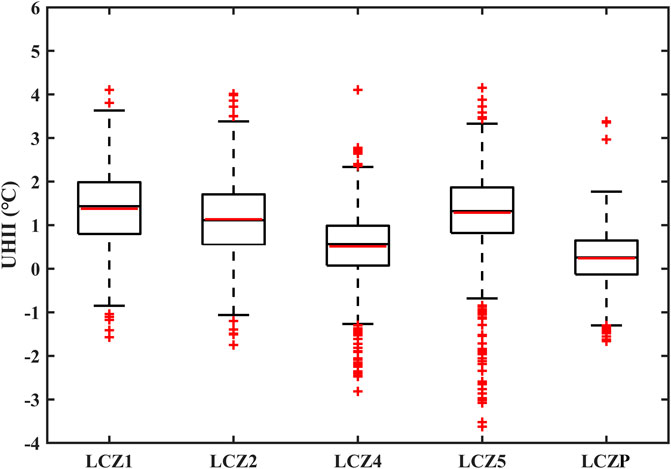
FIGURE 7. Box-and-whisker plots of the UHII values under each LCZ.
Discussion
In UHII Differences Between HW and NHW Periods we analyzed the daily variation of UHII during HW and NHW periods in the summers of 2014–2020. The difference between them was also calculated. We found that the UHII during HW periods was significantly stronger than during NHW periods. This means that, compared to NHW periods, the urban heat during HW periods increased more than in rural areas, resulting in a stronger UHI effect. In general, the surface receives more shortwave and longwave radiation during HW periods than NHW periods (Supplementary Figure S5; Hong et al., 2018). Additionally, the latent heat flux in rural areas has increased more due to the presence of sufficient water availability and more vegetation, while the increase in heat flux in urban areas is mainly in the form of sensible heat flux (Li et al., 2015; Zheng et al., 2018; see also Figure 8, and Supplementary Figure S6). Coupled with the high-pressure controlled during the HW period, the downdraft restrained the boundary layer development (Tressol et al., 2008). Similarly, relative to the NHW period, lower BLH during the HW period was observed in the present work (Figure 9), which was not conducive to convective mixing. Moreover, due to the unique underlying city canopy-layer structure with good thermal conductivity and large heat capacity (Stewart and Oke, 2012; Ren, 2015; Wang L. et al., 2020), the increase in net heat flux was more over urban areas than rural areas (i.e., Δ QN, Rural<Δ QN, Urban in Figure 10), resulting in stronger UHI effect during HW periods. In addition, the demand for water and electricity for heatstroke prevention and cooling during HW periods has soared, which may increase anthropogenic heat emissions in the urban. As a result, the temperature of dry air in urban areas will rise more than humid air in rural areas, causing a wider temperature gap between urban and rural areas under HW conditions. In general, the schematics of mechanisms of HW events enhancing UHI effect can be summarized in Figure 10. In the present work, the daily variation of ΔUHII between HW and NHW periods roughly followed a W-shaped curve, with the troughs appearing at 0800 and 1800 LST. Interestingly, at around 1800 LST, the interaction between HWs and UHII was almost negligible (ΔUHII between HW and NHW periods was zero or close to zero). As shown in Figure 8, the difference in radiation flux between HW and NHW periods, both in urban and rural areas, was also approximately zero, resulting in little difference in the temperature increase between urban and rural areas.
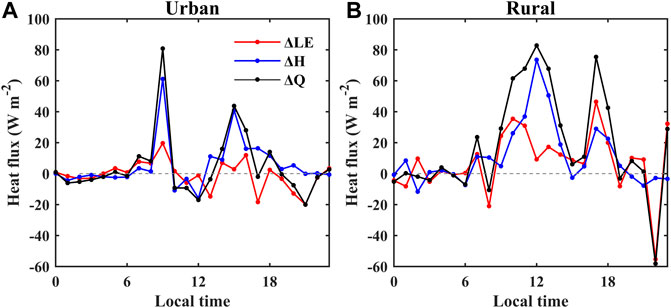
FIGURE 8. The differences of heat flux at urban station (IAP) and rural station (MY) between HW days (2016.07.06–2016.07.08) and NHW days (2016.07.09–2016.07.11). LE: latent heat flux, H: sensible heat flux, to calculate Q as LE + H, ΔLE = LEHWS-LENHWS, ΔH = HHWS-HNHWS, ΔQ = QHWS-QNHWS.
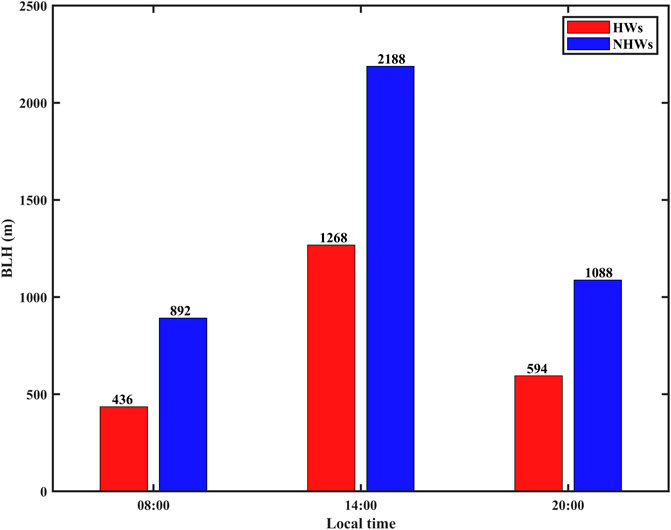
FIGURE 9. The averaged BLH during a case for 2016.07.06–2016.07.11, included both HW days (2016.07.06–2016.07.08) and NHW days (2016.07.09–2016.07.11).
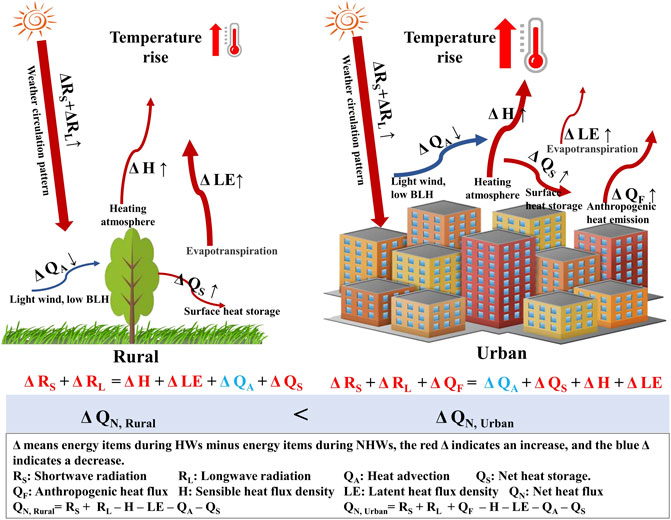
FIGURE 10. Schematics of mechanisms of HW events enhancing UHI effect.
Moreover, in view of the impact of weather conditions and land-use characteristics on the urban thermal environment, we evaluated the influences of wind speed and LCZs on HW events and UHII. It was found that, when the surface temperature increases rapidly and the horizontal wind speed is low, this is conducive to the formation of HW events with a high-pressure anticyclone controlled by a prevailing downdraft and stable atmosphere (Tressol et al., 2008). Wind speed plays an important role in local heat exchange (Tong and Leung, 2012), wherein reduced horizontal advection cooling could promote an increased UHII (Figure 5 indicates that UHII under low wind speeds was higher than under medium or high wind speeds). The characteristics of surface land use and the spatial configuration of urban buildings are also likely to be responsible for enhancing the UHII during HW periods. Bare soil and vegetation in rural areas might favor soil evapotranspirative cooling. On the contrary, less water content due to pavements and buildings restrains evapotranspiration in urban areas. As a result, there will be a greater frequency of HW events and a stronger UHI effect in dense high-rise-building areas such as LCZ1, LCZ2, LCZ4, LCZ5, etc. However, in the present study, the results for LCZ5 conflicted with this assertion. In this respect, it should be noted that XNT is located close to the Beijing South Second Ring Road, and SHQ is near the East Fourth Ring Road, close to the most complex overpass in Beijing (Figure 1B). Vast heat emissions caused by traffic may therefore have been partly responsible for high-temperature events and strong UHI effects under LCZ5.
Note that LCZP experienced many more and longer HWs than other LCZs. Usually, LCZP is composed of low-density plants, and its vegetation and green spaces alleviate the overall UHII considerably owing to higher rates of evaporation causing surface cooling (Doick et al., 2014; Zhou et al., 2019). However, numerous studies have established that cooler surfaces caused by a higher proportion of green space and associated additional irrigation increased the risk from HW events over the North China Plain (Kang and Eltahir, 2018; Krakauer et al., 2020). In this study, the LCZP at OP station, with high-density vegetation and water bodies, was similar to an irrigation area. In the early stage of an HW event, due to the evapotranspiration of water bodies and vegetation, a large amount of heat is stored, and then this enormous quantity of heat might be emitted into the air in the form of sensible heat (Figure 8), resulting in a sharp rise in temperature (Stap et al., 2014; Teuling et al., 2010). The evaporation of vegetation and water effectively suppresses the increase in the surrounding air temperature during the initial period. However, this process will eventually accelerate the consumption of soil moisture, and then dissipate more heat to the air, leading to increased temperature, especially in HW periods with strong solar radiation. In addition, Zhao et al. (2014) observed that the cooling efficiency of UHIs was reduced by 58% in humid areas with more vegetation, and Feinberg (2021) believed that, in this case, water vapor, as a greenhouse gas, can double the direct radiative forcing to heat the air. As a result, it is more conducive to increasing the occurrence of HW events. Although the effects of vegetation and water bodies on the process of radiation transmission are highly complex, we observed two opposite effects on the urban thermal environment. On the one hand, in general, green space and water bodies in the urban area had a mitigating effect on the UHI phenomenon. On the other hand, during HW periods, they also increased the frequency and duration of HW events. Elucidating the physical mechanism involved here is worthy of further study via numerical experiments.
There was a clear correlation between wind speed and the LCZ categories, and this is because wind speed may be weakened due to the obstruction of dense high-rise buildings (the distributions of wind speed under different LCZ categories are shown in Supplementary Figure S4). Therefore, HW events and UHI effects are regulated by LCZs in combination with wind speed. Table 2 shows the influence of wind speed and LCZs on UHII via two-way ANOVA. It is clear that, under the interactive effect of wind speed and LCZs, the average UHII difference was significant [F (8) = 16.42, p < 0.001]. This is robust proof of a co-regulatory effect of LCZ type and wind speed on UHII, and that the LCZ is more sensitive to the regulation of UHII. In addition, Figures 4D, 11 present the number of HW events and the distribution of UHII under different wind speed periods for each LCZ, which to some extent can separate the effects from wind speed and LZCs. When considering the impact of LCZs only on HW events, there were clear gaps in the frequency and duration of HW events under different LCZs. It shows that, under a specific wind speed category, HW events in dense high-rise-building areas have a higher frequency and longer duration. High-frequency and long-duration HW events are more likely to happen under lower wind speeds in a certain LCZ area.

TABLE 2. Two-way analysis of variance between wind speed and LCZs to UHII.
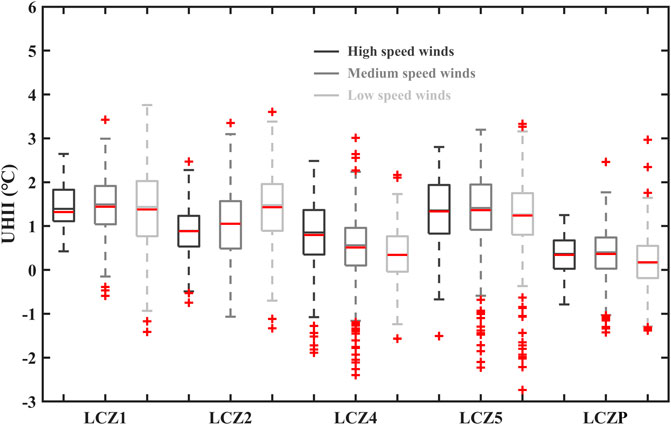
FIGURE 11. Box-and-whisker plots of the UHII values under different wind speed categories in each LCZ.
Our work still has a few limitations. For example, relative humidity, cloud cover, precipitation, and other meteorological factors also have an impact on the UHI effect, which may affect the interaction between HWs and UHII. In addition, the atmospheric circulation situation, anthropogenic heat emissions, and the impact of aerosols on the balance of surface radiation are other potential influencing factors of HW events and UHI effects (Li et al., 2015; Yang et al., 2020b; Ngarambe et al., 2020; Zinzi et al., 2020). Therefore, future studies should also consider these factors to explore their influences on HW events and the UHI effect.
Conclusion
Based on the observations of automatic weather stations in Beijing during the summers of 2014–2020, the joint effects of wind speed and LCZs on urban extreme high-temperature events and the UHI effect were explored. Results showed that UHII was significantly aggravated during HW periods compared to NHW periods. Wind speeds in urban areas were weakened due to the obstruction of dense high-rise buildings, which favored the occurrence of HW events. During HW periods, both rural and urban surfaces received more shortwave and longwave radiation, resulting in increased heat storage. The latent heat flux in rural areas has increased more due to the presence of sufficient water availability and more vegetation, while the increase in heat flux in urban areas is mainly in the form of sensible heat flux. Moreover, due to city canopy-layer structure with good thermal conductivity and large heat capacity, the increase in net heat flux was more over urban areas than rural areas, resulting in stronger UHI effect during HW periods. Lower boundary layer and wind speed in the HW events have weakened the convective mixing of air, which would further expand the temperature gap between urban and rural areas, compared to NHW periods. Meanwhile, LCZP in the urban park area, with its water bodies and vegetation, was found to play unique roles in HWs and UHII as follows: On the one hand, in general, green space and water bodies in urban areas can have a mitigating effect on the UHI phenomenon. On the other hand, during HW periods, they can also increase the frequency and duration of HW events.
In general, synergies between HWs and UHI amplify both the spatial and temporal coverage of high-temperature events, which in turn exposes urban residents to additional heat stress and seriously threatens their health. The present work can lend support to the prediction of extreme high-temperature events and UHI effects in megacities like Beijing. Our findings have important implications for HWs and UHII forecasts, as well as for scientific guidance on decision-making to improve the thermal environment and to adjust the energy structure.
Data Availability Statement
The original contributions presented in the study are included in the article/Supplementary Material, further inquiries can be directed to the corresponding author.
Author Contributions
Conceptualization, YY; methodology, LZ and YY; software, LZ and SL; formal analysis, LZ, SL, and YY; data curation, LZ, YZ, and MY; writing—original draft preparation, LZ; writing—review and editing, LZ, MY, YL, GR, and YY; supervision, YY; funding acquisition, YY. All authors have read and agreed to the published version of the manuscript.
Funding
This study was supported by the National Natural Science Foundation of China (42061134009, 42075072, and 41575010) and the Beijing Natural Science Foundation (8202022 and 8171002).
Conflict of Interest
The authors declare that the research was conducted in the absence of any commercial or financial relationships that could be construed as a potential conflict of interest.
Acknowledgments
The authors also thank the Meteorological Information Centre of the China Meteorological Administration for providing meteorological data (http://data.cma.cn/site/index.html)
Supplementary Material
The Supplementary Material for this article can be found online at: https://www.frontiersin.org/articles/10.3389/feart.2021.673786/full#supplementary-material
References
Chew, L. W., Liu, X., Li, X. X., and Norford, L. K. (2021). Interaction Between Heat Wave and Urban Heat Island: A Case Study in a Tropical Coastal City, Singapore. Atmos. Res. 247, 105134. doi:10.1016/j.atmosres.2020.105134
Doick, K. J., Peace, A., and Hutchings, T. R. (2014). The Role of One Large Greenspace in Mitigating London's Nocturnal Urban Heat Island. Sci. Total Environ. 493, 662–671. doi:10.1016/j.scitotenv.2014.06.048
Feinberg, A. (2021). Urban Heat Island Local GHG Water-Vapor Feedback Concerns Requiring Albedo Management. ResearchGate. doi:10.13140/RG.2.2.20529.81766/5
He, B.-J. (2019). Towards the Next Generation of green Building for Urban Heat Island Mitigation: Zero UHI Impact Building. Sustainable Cities Soc. 50 (di), 101647. doi:10.1016/j.scs.2019.101647
Hong, J.-S., Yeh, S.-W., and Seo, K.-H. (2018). Diagnosing Physical Mechanisms Leading to Pure Heat Waves versus Pure Tropical Nights over the Korean Peninsula. J. Geophys. Res. Atmos. 123 (14), 7149–7160. doi:10.1029/2018JD028360
Huang, Q. F., and Lu, Y. Q. (2018). Long-term Trend of Urban Heat Island Intensity and Climatological Affecting Mechanism in Beijing City. Sci. Geogr. Sin. 38 (10), 1715–1723. doi:10.13249/j.cnki.sgs.2018.10.016
Kang, S., and Eltahir, E. A. B. (2018). North China Plain Threatened by Deadly Heatwaves Due to Climate Change and Irrigation. Nat. Commun. 9 (1), 1–9. doi:10.1038/s41467-018-05252-y
Khan, H. S., Paolini, R., Santamouris, M., and Caccetta, P. (2020). Exploring the Synergies between Urban Overheating and Heatwaves (HWS) in Western Sydney. Energies 13 (2), 470. doi:10.3390/en13020470
Krakauer, N. Y., Cook, B. I., and Puma, M. J. (2020). Effect of Irrigation on Humid Heat Extremes. Environ. Res. Lett. 15 (9), 094010. doi:10.1088/1748-9326/ab9ecf
Lehner, F., Deser, C., and Sanderson, B. M. (2018). Future Risk of Record-Breaking Summer Temperatures and its Mitigation. Climatic Change 146 (3–4), 363–375. doi:10.1007/s10584-016-1616-2
Li, D., Sun, T., Liu, M., Yang, L., Wang, L., and Gao, Z. (2015). Contrasting Responses of Urban and Rural Surface Energy Budgets to Heat Waves Explain Synergies between Urban Heat Islands and Heat Waves. Environ. Res. Lett. 10 (5), 054009–054010. doi:10.1088/1748-9326/10/5/054009
Li, Y., Schubert, S., Kropp, J. P., and Rybski, D. (2020). On the Influence of Density and Morphology on the Urban Heat Island Intensity. Nat. Commun. 11, 2647. doi:10.1038/s41467-020-16461-9
Li, Y., Ye, H., Sun, X., Zheng, J., and Meng, D. (2021). Coupling Analysis of the Thermal Landscape and Environmental Carrying Capacity of Urban Expansion in Beijing (China) over the Past 35 Years. Sustainability 13, 584. doi:10.3390/su13020584
Liu, W., Ji, C., Zhong, J., Jiang, X., and Zheng, Z. (2007). Temporal Characteristics of the Beijing Urban Heat Island. Theor. Appl. Climatol. 87 (1–4), 213–221. doi:10.1007/s00704-005-0192-6
Luo, M., and Lau, N.-C. (2018). Increasing Heat Stress in Urban Areas of Eastern China: Acceleration by Urbanization. Geophys. Res. Lett. 45 (23), 13060–13069. doi:10.1029/2018gl080306
Luo, M., and Lau, N.-C. (2019). Urban Expansion and Drying Climate in an Urban Agglomeration of east China. Geophys. Res. Lett. 46 (2), 6868–6877. doi:10.1029/2019gl082736
Meehl, G. A., and Tebaldi, C. (2004). More Intense, More Frequent, and Longer Lasting Heat Waves in the 21st Century. Science 305, 994–997. doi:10.1126/science.1098704
Mughal, M. O., Li, X., and Norford, L. K. (2020). Urban Climate Urban Heat Island Mitigation in Singapore: Evaluation Using WRF / Multilayer Urban Canopy Model and Local Climate Zones. Urban Clim. 34, 100714. doi:10.1016/j.uclim.2020.100714
Ngarambe, J., Nganyiyimana, J., Kim, I., Santamouris, M., and Yun, G. Y. (2020). Synergies between Urban Heat Island and Heat Waves in Seoul: The Role of Wind Speed and Land Use Characteristics. PLoS One 15 (12), e0243571. doi:10.1371/journal.pone.0243571
Oke, T. R., and Maxwell, G. B. (1975). Urban Heat Island Dynamics in Montreal and Vancouver. Atmos. Environ. (1967) 9 (2), 191–200. doi:10.1016/0004-6981(75)90067-0
Ren, G.-Y. (2015). Urbanization as a Major Driver of Urban Climate Change. Adv. Clim. Change Res. 6 (1), 1–6. doi:10.1016/j.accre.2015.08.003
Ren, G. Y., Chu, Z. Y., Chen, Z. H., and Ren, Y. Y. (2007). Implications of Temporal Change in Urban Heat Island Intensity Observed at Beijing and Wuhan Stations. Geophys. Res. Lett. 34 (5), 1–5. doi:10.1029/2006GL027927
Rizwan, A. M., Dennis, L. Y. C., and Liu, C. (2008). A Review on the Generation, Determination and Mitigation of Urban Heat Island. J. Environ. Sci. 20 (1), 120–128. doi:10.1016/S1001-0742(08)60019-4
Roth, M. (2007). Review of Urban Climate Research in (Sub)tropical Regions. Int. J. Climatol. 27, 1859–1873. doi:10.1002/joc.1591
Shahidan, M. F., Jones, P. J., Gwilliam, J., and Salleh, E. (2012). An Evaluation of Outdoor and Building Environment Cooling Achieved through Combination Modification of Trees with Ground Materials. Building Environ. 58, 245–257. doi:10.1016/j.buildenv.2012.07.012
Shi, T., Huang, Y., Sun, D., Lu, G., and Yang, Y. (2021). A New Method for Correcting Urbanization-Induced Bias in Surface Air Temperature Observations: Insights From Comparative Site-Relocation Data. Front. Environ. Sci. 9, 625418. doi:10.3389/fenvs.2021.625418
Shi, T., Huang, Y., Wang, H., Shi, C.-E., and Yang, Y.-J. (2015). Influence of Urbanization on the thermal Environment of Meteorological Station: Satellite Observed Evidence. Adv. Clim. Change Res. 6, 715. doi:10.1016/j.accre.2015.07.001
Stap, L. B., Van Den Hurk, B. J. J. M., Van Heerwaarden, C. C., and Neggers, R. A. J. (2014). Modeled Contrast in the Response of the Surface Energy Balance to Heat Waves for forest and Grassland. J. Hydrometeorol. 15 (3), 973–989. doi:10.1175/JHM-D-13-029.1
Stewart, I. D., Oke, T. R., and Krayenhoff, E. S. (2014). Evaluation of the 'local Climate Zone' Scheme Using Temperature Observations and Model Simulations. Int. J. Climatol. 34 (4), 1062–1080. doi:10.1002/joc.3746
Stewart, I. D., and Oke, T. R. (2012). Local Climate Zones for Urban Temperature Studies. Bull. Am. Meteorol. Soc. 93 (12), 1879–1900. doi:10.1175/BAMS-D-11-00019.1
Tan, J., Zheng, Y., Tang, X., Guo, C., Li, L., Song, G., et al. (2010). The Urban Heat Island and its Impact on Heat Waves and Human Health in Shanghai. Int. J. Biometeorol. 54 (1), 75–84. doi:10.1007/s00484-009-0256-x
Teuling, A. J., Seneviratne, S. I., Stöckli, R., Reichstein, M., Moors, E., Ciais, P., et al. (2010). Contrasting Response of European forest and Grassland Energy Exchange to Heatwaves. Nat. Geosci 3 (10), 722–727. doi:10.1038/ngeo950
Tong, N. Y. O., and Leung, D. Y. C. (2012). Effects of Building Aspect Ratio, Diurnal Heating Scenario, and Wind Speed on Reactive Pollutant Dispersion in Urban Street Canyons. J. Environ. Sci. 24 (12), 2091–2103. doi:10.1016/S1001-0742(11)60971-6
Tressol, M., Ordonez, C., Zbinden, R., Brioude, J., Thouret, V., Mari, C., et al. (2008). Air Pollution during the 2003 European Heat Wave as Seen by MOZAIC Airliners. Atmos. Chem. Phys. 8 (8), 2133–2150. doi:10.5194/acp-8-2133-2008
Uehara, K., Murakami, S., Oikawa, S., and Wakamatsu, S. (2000). Wind Tunnel Experiments on How thermal Stratification Affects Flow in and above Urban Street Canyons. Atmos. Environ. 34 (10), 1553–1562. doi:10.1016/S1352-2310(99)00410-0
Wang, L., Fan, S., Hu, F., Miao, S., Yang, A., Li, Y., et al. (2020). Vertical Gradient Variations in Radiation Budget and Heat Fluxes in the Urban Boundary Layer: A Comparison Study between Polluted and Clean Air Episodes in Beijing during Winter. J. Geophys. Res. Atmos. 125. doi:10.1029/2020JD032478
Wang, Q., Hang, J., Fan, Y., and Li, Y. (2020). Urban Plume Characteristics under Various Wind Speed, Heat Flux, and Stratification Conditions. Atmos. Environ. 239 (3), 117774. doi:10.1016/j.atmosenv.2020.117774
Wong, L. P., Alias, H., Aghamohammadi, N., Aghazadeh, S., and Nik Sulaiman, N. M. (2017). Urban Heat Island Experience, Control Measures and Health Impact: A Survey Among Working Community in the City of Kuala Lumpur. Sustainable Cities Soc. 35, 660–668. doi:10.1016/j.scs.2017.09.026
Xie, Z., Cui, J. L., Chen, D. G., and Hu, B. K. (2006). The Annual, Seasonal and Monthly Characteristics of Diurnal Variation of Urban Heat Island Intensity in Beijing. Clim. Environ. Res. 11 (1), 69–75. (in Chinese).
Xu, W., Li, Q., Wang, X. L., Yang, S., Cao, L., and Feng, Y. (2013). Homogenization of Chinese Daily Surface Air Temperatures and Analysis of Trends in the Extreme Temperature Indices. J. Geophys. Res. Atmos. 118 (17), 9708–9720. doi:10.1002/jgrd.50791
Yang, J., Hu, L., and Wang, C. (2019). Population Dynamics Modify Urban Residents' Exposure to Extreme Temperatures across the United States. Sci. Adv. 5 (12), eaay3452. doi:10.1126/sciadv.aay3452
Yang, J., Wang, Z. H., and Kaloush, K. E. (2016). Effect of Pavement thermal Properties on Mitigating Urban Heat Islands: A Multi-Scale Modeling Case Study in Phoenix. Building Environ. 108 (11), 110–121. doi:10.1016/j.buildenv.2016.08.021
Yang, P., Ren, G., and Liu, W. (2013). Spatial and Temporal Characteristics of Beijing Urban Heat Island Intensity. J. Appl. Meteorol. Climatol. 52 (8), 1803–1816. doi:10.1175/JAMC-D-12-0125.1
Yang, X., Leung, L. R., Zhao, N., Zhao, C., Qian, Y., Hu, K., et al. (2017). Contribution of Urbanization to the Increase of Extreme Heat Events in an Urban Agglomeration in east China. Geophys. Res. Lett. 44 (13), 6940–6950. doi:10.1002/2017gl074084
Yang, Y., Fan, S., Wang, L., Gao, Z., Zhang, Y., Zou, H., et al. (2020a). Diurnal Evolution of the Wintertime Boundary Layer in Urban Beijing, China: Insights from Doppler Lidar and a 325-m Meteorological Tower. Remote Sensing 12, 3935. doi:10.3390/rs12233935
Yang, Y., Zheng, Z., Yim, S. Y. L., Roth, M., Ren, G., Gao, Z., et al. (2020b). PM 2.5 Pollution Modulates Wintertime Urban Heat Island Intensity in the Beijing‐Tianjin‐Hebei Megalopolis, China. Geophys. Res. Lett. 47 (1), 1–12. doi:10.1029/2019GL084288
Yao, J., Sun, X., Tang, J., Ji, Y., Xu, Y., and Yang, X.-Q. (2020). Summer Regional Pentad Heat Wave in Eastern China and Their Possible Causes. Front. Earth Sci. 8 (11), 511. doi:10.3389/feart.2020.598027
Zhao, L., Lee, X., Smith, R. B., and Oleson, K. (2014). Strong Contributions of Local Background Climate to Urban Heat Islands. Nature 511 (7508), 216–219. doi:10.1038/nature13462
Zheng, Z., Ren, G., Wang, H., Dou, J., Gao, Z., Duan, C., et al. (2018). Relationship between Fine-Particle Pollution and the Urban Heat Island in Beijing, China: Observational Evidence. Boundary-layer Meteorol. 169 (1), 93–113. doi:10.1007/s10546-018-0362-6
Zheng, Z., Zhao, C., Lolli, S., Wang, X., Wang, Y., Ma, X., et al. (2020). Diurnal Variation of Summer Precipitation Modulated by Air Pollution: Observational Evidences in the Beijing Metropolitan Area. Environ. Res. Lett. 15, 094053. doi:10.1088/1748-9326/ab99fc
Zhou, W., Shen, X., Cao, F., and Sun, Y. (2019). Effects of Area and Shape of Greenspace on Urban Cooling in Nanjing, China. J. Urban Plan. Dev. 145 (4), 04019016. doi:10.1061/(asce)up.1943-5444.0000520
Keywords: urban heat island, heat wave events, local climatic zones, wind speed, urbanization
Citation: Zong L, Liu S, Yang Y, Ren G, Yu M, Zhang Y and Li Y (2021) Synergistic Influence of Local Climate Zones and Wind Speeds on the Urban Heat Island and Heat Waves in the Megacity of Beijing, China. Front. Earth Sci. 9:673786. doi: 10.3389/feart.2021.673786
Received: 28 February 2021; Accepted: 25 May 2021;
Published: 09 June 2021.
Edited by:
Wei Zhang, Utah State University, United StatesReviewed by:
Yunfei Li, Potsdam Institute for Climate Impact Research (PIK), GermanyXianXiang Li, Sun Yat-Sen University, China
Copyright © 2021 Zong, Liu, Yang, Ren, Yu, Zhang and Li. This is an open-access article distributed under the terms of the Creative Commons Attribution License (CC BY). The use, distribution or reproduction in other forums is permitted, provided the original author(s) and the copyright owner(s) are credited and that the original publication in this journal is cited, in accordance with accepted academic practice. No use, distribution or reproduction is permitted which does not comply with these terms.
*Correspondence: Yuanjian Yang, eXlqMTk4NUBtYWlsLnVzdGMuZWR1LmNu