 Yao Zhang
 Xianwei Meng
 Peng Xia2*
- 1College of Marine Geosciences, Ocean University of China, Qingdao, China
- 2Key Laboratory of Marine Geology and Metallogeny, First Institute of Oceanography, Ministry of Natural Resources, Qingdao, China
- 3Laboratory for Marine Geology and Environment, Qingdao National Laboratory for Marine Science and Technology, Qingdao, China
- 4School of Earth and Ocean Sciences, University of Victoria, Victoria, BC, Canada
Mangroves, a blue carbon ecosystem between land and ocean in the (sub)tropics, are sensitive to changes in climate and the sea level. It is imperative to reconstruct the historical dynamics of their development to predict the fate of mangrove ecosystems in the backdrop of rapid global changes. This study analyzes records of the sources of organic matter from sediment core Q43 of Qinzhou Bay in tropical China by using the endmember mixing model based on stable organic carbon isotopes and C/N ratio. Mangrove-derived organic matter (MOM) is regarded as a reliable indicator for reconstructing the historical development of mangroves. The variations in MOM in Qinzhou Bay over the past ∼3,000 cal yr BP indicate that mangrove forests underwent two periods of flourishment: ∼2,200–1,750 cal yr BP and ∼1,370–600 cal yr BP, as well as three periods of deterioration: ∼3,000–2,200 cal yr BP, ∼1,750–1,370 cal yr BP, and ∼600–0 cal yr BP. Of factors that might have been influential, changes in the relative sea level and the regional hydrological environment (e.g., seawater temperature, salinity, and hydrodynamic conditions) did not appear to have notable effects on mangrove flourishing/degradation. However, climate change, especially the variation in air temperature, formed the primary factor controlling mangrove development. The stages of mangrove flourishing/deterioration corresponded to the warm/cold periods of the climate, respectively. Noteworthy is that the rapid rise in air temperature during the Anthropocene warm period should have promoted mangrove development, but the increasing intensity of human activity has reversed this tendency leading to the degradation of mangroves.
Introduction
Mangroves inhabit intertidal zones in tropical and subtropical regions, and control exchanges of materials at the interfaces of the land, marine, and atmosphere ecosystems (Woodroffe et al., 2016; Hatje et al., 2020). They provide multiple ecosystem services, such as mitigating coastal erosion from waves and wind, guaranteeing fishery resources and food security for coastal inhabitants, and aiding in the protection of adjacent seagrass and coral reef ecosystems (Duke et al., 2007; Nellemann et al., 2009; Lee et al., 2014; Himes-Cornell et al., 2018; Hatje et al., 2020). More importantly, mangrove forests are efficient producers, capturers, and sinks of carbon (Jennerjahn and Ittekot, 2002; Duarte et al., 2005; Alongi, 2014; Jennerjahn, 2021). Hence, they play a disproportionately important role in global carbon cycling, and are key blue carbon sinks that can contribute to climate change mitigation (Duke et al., 2007; Duarte et al., 2013; Duarte and Arabia, 2017; Alongi, 2020; Sasmito et al., 2020).
However, mangrove forests are sensitive and vulnerable to environmental changes, e.g., climate change and fluctuations in the sea level (Ellison and Stoddart, 1991; Alongi, 2008; Ellison, 2008; Jennerjahn, 2012; Ellison, 2014; Lovelock et al., 2015; Woodroffe et al., 2016). Mangroves can migrate to landward/seaward regions with the rise/fall in the relative sea level (RSL) (Ellison and Stoddart, 1991; Woodroffe et al., 2016). A rapid change in the RSL can result in the decline or even the disappearance of mangrove habitats. Low-intensity rainfall can also lead to mangrove degradation through reductions in freshwater runoff, fluvial sediment, and nutrient inputs (Alongi, 2008; Gilman et al., 2008). High-frequency winter cooling events induced by variations in the intensity of the monsoon can also prevent mangrove development (Meng et al., 2016a). Likewise, high-temperature events can result in hypersaline conditions with high evaporation rates (Gilman et al., 2008), which lead to mangrove degradation. In addition, anthropogenic threats, such as pollution, overexploitation, and the conversion of patterns of land use (Bao et al., 2013; Friess et al., 2019; Veettil et al., 2019), have vastly impacted mangrove dynamics, especially since the Anthropocene.
The world at present is characterized by a rapid sea level rise, rapid warming, frequent extreme climate events, and an increasing population. Therefore, to predict the fate of mangrove ecosystems under this rapidly changing environment, it is imperative to understand how they have changed or disappeared in the past (Valiela et al., 2001), by reconstructing historical mangrove dynamics through useful indicators recorded in sediments (Gonneea et al., 2004; Ellison, 2008; França et al., 2013; Cohen et al., 2016; Meng et al., 2017; Xia et al., 2019; Vaughn et al., 2021).
Tropical or subtropical Asia, a region that features a unique climate system (Asian monsoon) and a long history of human civilization, holds most of the world’s mangrove forests along its winding and long coastline (Giri et al., 2011). Hence, it is an ideal selection to study the mangrove development and its responses to natural and anthropogenic factors. In this study, we use records of organic matter (OM) sources from sediment core Q43 of Qinzhou Bay (Figure 1) in tropical China to reconstruct the history of mangrove development over the past 3,000 years. The aim is to answer the question of how mangrove forests respond to changes in the sea level, climate (air temperature and rainfall), hydrological environment (seawater temperature, salinity, and hydrodynamic conditions), and anthropogenic activities.
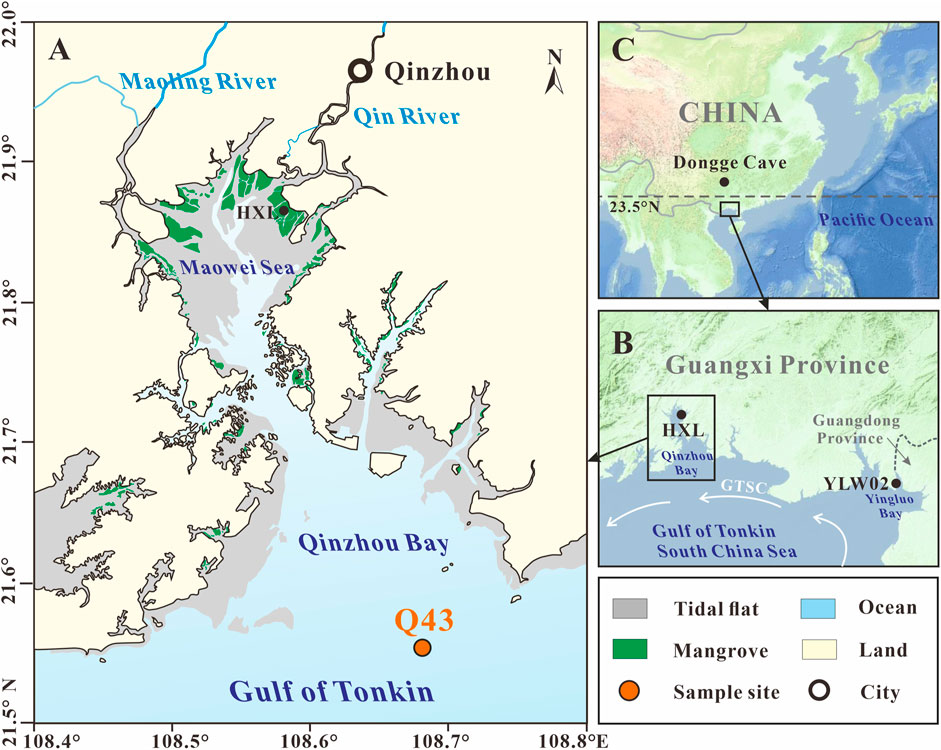
FIGURE 1. Locations of the (A) sediment core Q43 in Qinzhou Bay, (B) northern Gulf of Tonkin, (C) tropical China. The referenced sites contain HXL in Qinzhou Bay (Xia et al., 2019), YLW02 in Yingluo Bay (Meng et al., 2017), and Dongge Cave in SW China (Wang et al., 2005). GTSC: Gulf of Tonkin Surface Current (Liu et al., 2016).
Materials and Methods
Study Area and Sampling Site
Qinzhou Bay is located in the northern Gulf of Tonkin (Figure 1B) in tropical China (Figure 1C), and is divided into an inner zone (Maowei Sea) and an outer zone by a narrow channel (Figure 1A). Two small tropical rivers, the Maoling River and the Qin River, debouching into the Qinzhou Bay. Most of the intertidal zone of the Maowei Sea and adjacent coasts are occupied by mangrove forests. The Maowei Sea Mangrove Nature Reserve was established by the local government in 2005. The mangrove forests are generally 1–4 m high and exhibit a zonal distribution from the upper (Bruguiera gymnorrhiza and Rhizophora stylosa), middle (Kandelia candel and Egiceras corniculatum), and lower (Avicennia marina) tidal flats (Li et al., 2008).
The study area is characterized by tropical monsoonal climate. The mean annual air temperature is 22.4°C, and ranges from 0.8 to 37.4°C. The average annual rainfall is 2,150 mm, 80–85% of which falls during the summer rainy season (April–September). The region experiences an irregular diurnal tide with a mean tidal range of 2.5 m (Meng and Zhang, 2014). The features of the seawater, which are affected only by monsoonal rainfall, are relatively stable, with a mean temperature of 23.5°C, salinity of 20–23‰, and pH of 7.6–7.8 (Fan et al., 2005). The anticlockwise Gulf of Tonkin Surface Current (GTSC) controls the regional hydrologic system (Liu et al., 2016).
The sediment core Q43 (108°40.49′E, 21°32.73′N), which is 150 cm long, was collected from Qinzhou Bay at a depth of 9 m in May 2009 using a gravity piston corer (Figure 1A). The core is located in the center of the outer zone of Qinzhou Bay, and thus its sedimentary records best reflect the history of mangrove development for the entire Qinzhou Bay. According to the sedimentary features, the core can be visually divided into two sections: the lower section (150–100 cm) is characterized by dark yellowish-brown sandy sediments and lower water concentration, and the upper section (150–0 cm) is mainly composed of finer dark gray sand-silt-clay and contains many fragmentized shells at 5–6, 56–57, and 86–88 cm. There is no clear hiatus between the upper and lower sections. The sediment core was sectioned by stainless steel cutters at intervals of 2 cm within 24 h of collection. All sediment subsamples were freeze-dried for 72 h at −55°C, and were then packed in sealed polyethylene bags and stored in a desiccator at room temperature for subsequent analyses.
Laboratory Analyses
Shells from six horizons were selected for accelerator mass spectrometry (AMS) 14C dating measurement at the Beta Analyses Company in FL, United States (Table 1). The conventional radiocarbon ages were corrected by a regional carbon reservoir age of 10 ± 50 years (Southon et al., 2002) and converted into calibrated calendar years by the program Calib 7.1 with Marine 13 calibration curves (Reimer et al., 2013). All calibrated ages were reported in years before 1950 CE (yr BP) and in cal yr BP with a precision of 2σ.

TABLE 1. List of AMS 14C ages from core Q43.
The grain size distribution was measured by using a Malvern Mastersizer 2000 laser particle analyzer (Malvern, Inc., United Kingdom), at a measurement range of 0.02–2,000 μm and a size resolution of 0.01 φ after removing the OM and carbonate fractions by adding 15 ml 3% H2O2 and 5 ml 10% hydrochloric acid (HCl), respectively. All sample preparation and measurements were completed at the Key Laboratory of Marine Geology and Metallogeny of the First Institute of Oceanography, China Ministry of Natural Resources.
The freeze-dried sediment samples were treated with 1 N of HCl for 24 h at room temperature (25°C) to remove inorganic carbon. Then, they were rinsed by ultra-pure water several times until pH 7, and left to dry at 50°C for 72 h. Approximately 30–40 mg of homogenized dry sediments were carefully placed in tin capsules and crimp-sealed for analysis. The contents of stable organic carbon isotope (13Corg), total organic carbon (TOC), and total nitrogen (TN) were determined for all subsamples by a Delta Plus XP mass spectrometer (Thermo Scientific, Bremen, Germany), and by a Vario EL-III Elemental Analyzer (Elementar, Hanau, Germany) in continuous flow mode at the Stable Isotope Laboratory of College of Resources and Environmental Sciences of the China Agricultural University (Beijing). The results are reported in standard delta notation (δ) using permitted units (‰):
where δ (‰) represents the stable isotope value of organic carbon and R is the 13C/12C ratio. The reference standard used for carbon is the Vienna PeeDee Belemnite (VPDB) standard. The analytical precisions of 13Corg, TOC, and TN were ±0.2‰, ±0.02 wt. %, and ±0.005 wt. %, respectively. The C/N ratio was calculated by the atomic (molar) ratio of TOC to TN.
Endmember Mixing Models for Discriminating Organic Matter Sources
The endmember mixing model is a classical method by which the proportional contributions of different sources to a mixture OM can be quantified (Dittmar et al., 2001; Gonneea et al., 2004). Models based on δ13C and/or C/N have been widely used to identify the sources of OM in the sediments or suspended solids of different ecosystems, such as rivers (Liu et al., 2019; Zhang et al., 2021), lakes (Dong et al., 2020), and ocean (Gonneea et al., 2004; Xia et al., 2015; Meng et al., 2016b, 2017). The formulae for the ternary mixing model based on δ13C and C/N are as follows:
where A, B, and C are the potential OM endmembers, and f represents the percentage of contribution of each endmember. The values of δ13C and C/N of the endmembers are discussed in Potential Sources of Organic Matter and Their Endmember Values. When the OM in a sample is a mixture of two sources, it should be explained by using a binary mixing model with δ13C:
Results
Chronological Results and Sedimentary Rates
Calibrated radiocarbon ages at depths of 6, 27, 57, 81, 101, and 122 cm produced ages of 285, 862, 1,398, 1,731, 2,147, and 3,162 cal yr BP, respectively, and no age inversion was observed (Table 1). Downcore ages were calculated by linear interpolation between the dated sediment layers. Based on the ratio of the depth intervals to the time spans, the sedimentation rates of the core sections 0–6, 6–27, 27–57, 57–81, 81–101, and 101–149 cm were about 21.1, 36.4, 56.0, 72.1, 48.0, and 47.3 cm kyr−1, respectively (Figure 2), with a mean value of 47.12 cm kyr−1. The sedimentation rates in core Q43 are similar to the vertical accretion of mangrove forests reported by other researchers in tropical China (Meng et al., 2017; Xia et al., 2019), Puerto Rico (Cohen et al., 2016), and the Amazon Region (França et al., 2013).
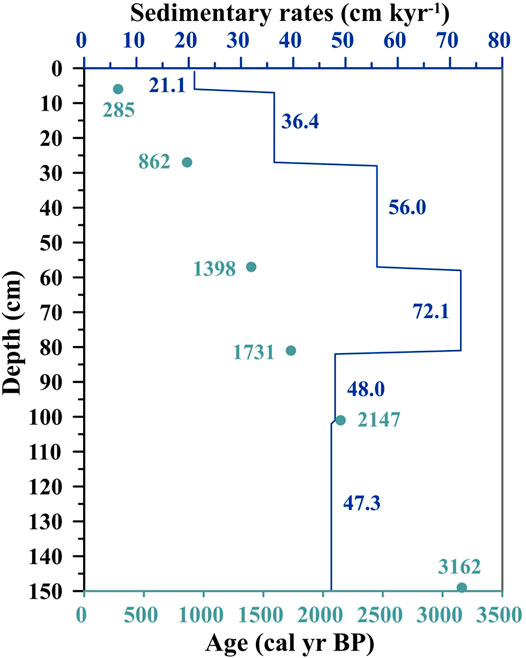
FIGURE 2. Plots of Depth vs. Age and Sedimentary rates from core Q43.
Features of Grain Size, Total Organic Carbon, Total Nitrogen, C/N Ratio, and δ13Corg
The values of and variations in the grain size, TOC, TN, C/N ratio, and δ13Corg are shown in Figures 3A–F. The proportions of sand, silt, and clay in the entire core were 58.6 ± 14.9%, 24.1 ± 8.1%, and 17.3 ± 7.6%, respectively. The mean grain size (Mz) varied from 0.5 to 6.1 φ, with an average of 4.0 ± 1.6 φ. The TOC and TN contents were 0.67 ± 0.27% and 0.04 ± 0.02%, ranging between 0.16–1.3% and 0.01–0.08%, respectively. TOC was significantly and positively correlated with TN (TOC = 9.06 × TN + 0.25, R2 = 0.52, p < 0.01), and the short intercept implies that the impact of inorganic nitrogen could be neglected (Goñi et al., 1998). The C/N value varied from 9.9 to 43.0 with a mean value of 19.0 ± 7.8. The average δ13Corg value was −24.7 ± 0.6‰, ranging from −26.0 to −23.1‰. On the whole, the grain size and δ13Corg showed a finer trend and an increasing tendency since ∼3,000 cal yr BP, respectively, while the TOC, TN, and C/N collectively exhibited an abrupt change during 1,370–600 cal yr BP. Based on these vertical variations in the sediment core, it can be divided into three sections: the upper section (600–0 cal yr BP), middle section (1,370–600 cal yr BP), and lower section (3,000–1,370 cal yr BP).
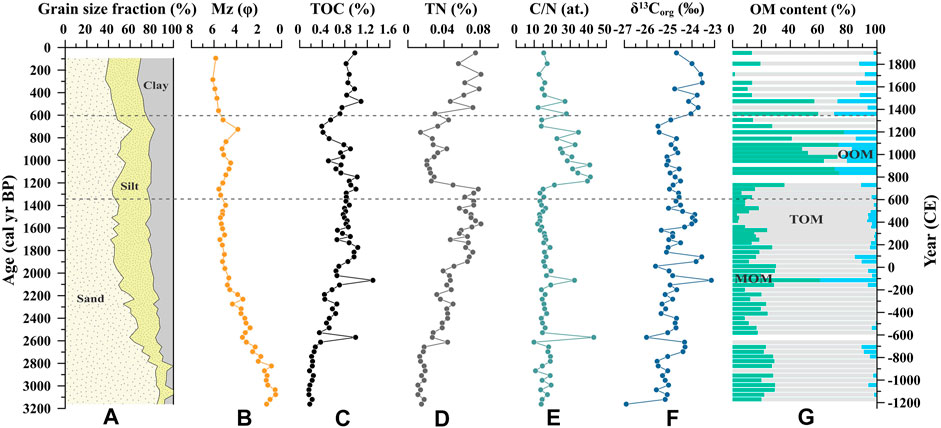
FIGURE 3. Variations in the (A) grain size fraction, (B) mean grain size (Mz), (C) total organic carbon (TOC) and (D) total nitrogen contents (TN), (E) C/N ratio, (F) stable organic carbon isotope (δ13Corg), and (G) composition of organic matter (OM) source in sediment core Q43. TOM, MOM, and OOM represent terrestrial organic matter, mangrove-derived organic matter, and oceanic organic matter, respectively.
In the upper section, all of the indices were relatively stable. The minimum grain size and the highest positive δ13Corg appeared in this section, with mean values of −24.0 ± 0.4‰, and 5.8 ± 0.2 φ, respectively. However, most of the indicators, especially TOC, TN, and the C/N ratio, were abnormal in the middle section. The C/N ratio was as high as 27.3 ± 9. In the lower section, TOC, TN, and δ13Corg showed an increasing trend, whereas the grain size became finer and the C/N ratio was relatively stable. The maximum grain size and lowest TOC content occurred in this section, with mean values of 3.4 ± 1.6 φ and 0.61 ± 0.28%, respectively.
Potential Sources of Organic Matter and Their Endmember Values
In general, the OM stored in marine sediments originates from autochthonous (i.e., marine production) and allochthonous contributions (i.e., terrestrial input). However, mangrove forests are also a significant contributor to the OM in mangrove coasts and adjacent seas. For example, a previous study in Qinzhou Bay reported that ∼27% of the sedimentary OM derived from mangroves (Meng et al., 2016a). Therefore, mangrove forests, terrestrial matter, and marine production can be considered the potential endmembers of the sources of sedimentary OM in Qinzhou Bay (Figure 4A).
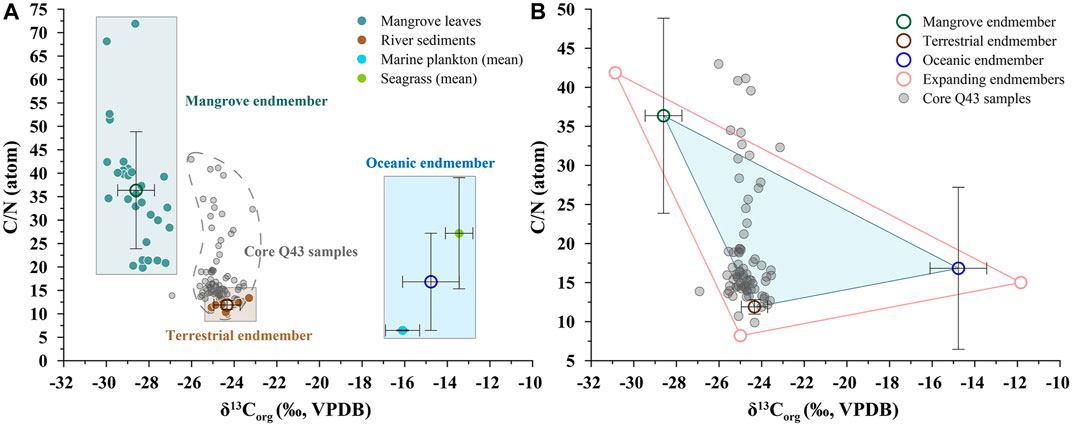
FIGURE 4. Scatter diagrams of δ13Corg vs. C/N for (A) endmembers of organic matter (OM) sources and (B) core Q43 samples with the ternary mixing model. The shadow areas in (A) represent the ranges of mangrove, terrestrial (Xia et al., 2015; Meng et al., 2016b), and oceanic endmembers (Xue et al., 2009; Xia et al., 2015; Qiu, unpublished data). The error bars show the standard deviation of the endmember values. The pink empty circles in (B) are endmember values with the tolerance interval expanded by 25%.
Mangrove roots and leaf litter are important contributors to carbon stocks in mangrove sediments (Duarte et al., 2005; Bouillon et al., 2008; Alongi, 2014). However, recent studies have shown that the values of δ13Corg and C/N of the roots are generally within the range of, or overlap, those of leaf litter (Kusumaningtyas et al., 2019; Sasmito et al., 2020). Therefore, the values of δ13Corg and C/N of mangrove leaves can be regarded as endmember values of mangrove production. The average δ13Corg and C/N values of the leaves of different mangrove species (n = 30) collected along the Guangxi coasts were −28.6 ± 0.9‰ and 36.4 ± 12.5 (Xia et al., 2015; Meng et al., 2016b), respectively, and are consistent with those from Hainan Island in tropical China (Herbeck et al., 2011). They can thus be reasonably regarded as the endmember in this study.
Riverine inputs, especially in small tropical catchments, contribute a large amount of terrestrial OM flux that reaches the ocean (Moyer et al., 2013; Hernes et al., 2017). In the study region, there are two small tropical rivers, i.e., the Maoling River and the Qin River, debouching into the Qinzhou Bay. Thus, their riverine sediments (n = 6) can represent the terrestrial endmember of OM sources in this study with average values of −24.3 ± 0.6‰ for δ13Corg and 11.9 ± 0.9 for C/N (Xia et al., 2015; Meng et al., 2016b).
Seagrass is widely distributed in the coastal waters of Guangxi, China (Meng and Zhang, 2014), and should be considered an important part of marine production. According to previous studies, seagrass collected from Guangxi coasts (n = 19) has an average δ13Corg of −13.5 ± 0.6‰ and C/N of 27.2 ± 11.9 (Qiu, unpublished data), while marine plankton collected from the northern South China Sea (Xue et al., 2009; Xia et al., 2015) has an average δ13Corg of −16.1 ± 0.8‰ and C/N of 6.5 ± 0.1. The oceanic endmember values (δ13Corg, −14.8 ± 1.3‰; C/N, 16.8 ± 10.4) of OM sources can be reasonably determined from these values.
Quantitative Estimation for Organic Matter Sources
Considering the indeterminacy of endmember values and isotopic fractionation effects in the endmember mixing model, a tolerance interval is introduced to the model, and it can be determined by the standard deviations and mean values of each endmember (Dittmar et al., 2001; Gonneea et al., 2004). When the original ternary plot was expanded by a tolerance interval of 25%, more than 90% of the samples could be explained in terms of the endmember mixing model (Figure 4B), which confirms the feasibility of using this method to discriminate among the sources of OM. Notably, samples that fell outside the strict validity (i.e., original triangle in blue) of the model, but were within the expanded area (in pink), should be treated with their corresponding binary mixing model based on δ13Corg.
According to the above methods, the contributions of terrestrial organic matter (TOM), mangrove-derived organic matter (MOM), and oceanic organic matter (OOM) to OM sources of sediment core Q43 were determined (Figure 3G). TOM was the largest OM contributor with a mean value of 68.6 ± 27.6%, followed by MOM with a mean value of 24.3 ± 19.7%, and OOM with a mean value of 7.1 ± 9.3%. Like the other indicators, the compositions of the OM sources can be roughly divided into three sections: the upper section (600–0 cal yr BP), middle section (1,370–600 cal yr BP), and lower section (3,000–1,370 cal yr BP). The MOM occupied the largest proportion of OM in the middle section with mean value of 48.7 ± 23.4%.
Discussion
Effectiveness of Mangrove-Derived Organic Matter for Tracing Mangrove Development
Traditionally, the pollen content of mangroves is one of the most direct and effective proxies for tracing mangrove evaluation (Gonneea et al., 2004; Ellison, 2008; Li et al., 2008). However, the MOM has been used to successfully reconstruct the histories of mangrove development at different time scales (from the Anthropocene to the Holocene) in different regions around the world, e.g., the western coast of peninsular India (Caratini et al., 1994), Flamenco Lagoon in Puerto Rico (França et al., 2013), Gulf of Tonkin in tropical China (Meng et al., 2016b), and the Amazon estuary of northern Brazil (Cohen et al., 2016). A recent study has shown a relatively consistent tendency of variation and significant positive correlations (0.68–0.89, p < 0.01) between the MOM and mangrove pollen from mangrove sediment cores in different regions (Xia et al., 2021). Consequently, MOM is a reliable proxy for reconstructing regional mangrove development. This index has a more significant potential to recover high-resolution mangrove development, owing to its easily fine-cut sampling and cheaper cost of equipment, than pollen and biomarkers (Xia et al., 2021).
Mangrove Development Over the Past 3,000 Years
According to the variations in MOM, mangrove development in the Qinzhou Bay since ∼3,000 cal yr BP can be detailedly divided into five stages (Figures 2G, 5A). The MOM contributions were higher during the periods ∼2,200–1,750 and ∼1,370–600 cal yr BP, which indicates that the mangrove forest was flourishing. However, MOM contributions were lower in the periods ∼3,000–2,200, ∼1,750–1,370, and ∼600–0 cal yr BP, indicating that the forest had been deteriorating in these periods. To sum up, mangrove forests in Qinzhou Bay underwent two periods of flourishing and three periods of degradation over the last ∼3,000 years. Notably, the period of the greatest flourishing was ∼1,370–600 cal yr BP, with the highest MOM content of 48.7 ± 23.4%.
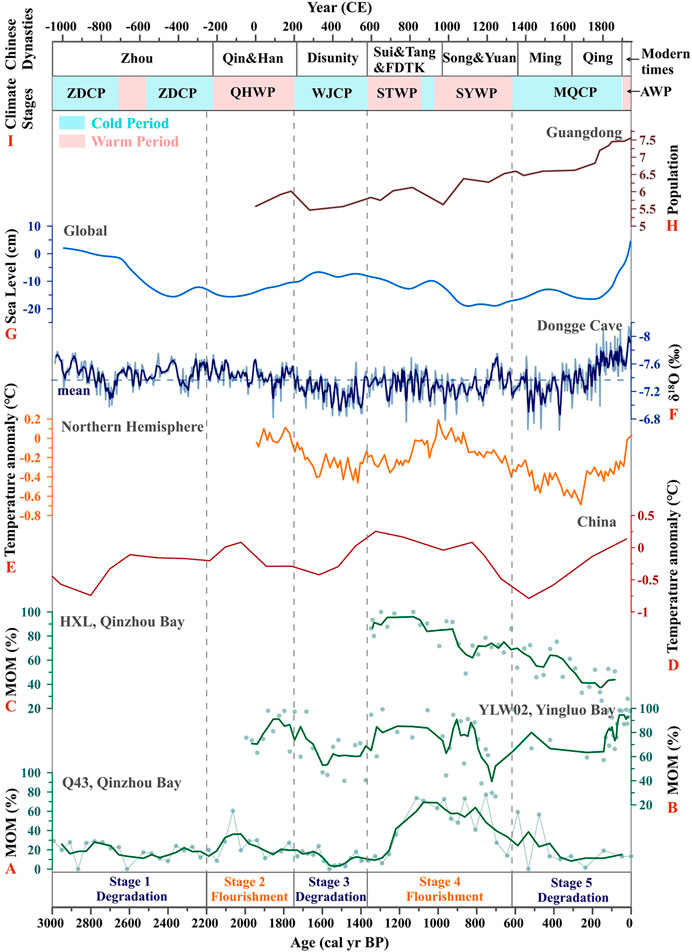
FIGURE 5. Comparisons between changes in mangrove-derived organic matter (MOM) and natural and anthropogenic records: (A–C) variations in MOM from the Q43 (this study), YLW02 (Meng et al., 2017), and HXL (Xia et al., 2019) cores, respectively, in Guangxi coasts; (D–E) temperature anomaly in China (Hou and Fang, 2011) and the Northern Hemispheric (Ljungqvist, 2010); (F) stalagmite δ18O records from Dongge Cave, SW China (Wang et al., 2005); (G) variation in the global sea level over the past 3,000 cal yr BP (Kemp et al., 2018; Miller et al., 2020) (H) population changes in Guangdong Province (logarithmic (base 10) scale (Zhao and Xie, 1988; Huang et al., 2018)); (I) Chinese dynasties and climatic stages (Zhu, 1973; Ge et al., 2014). The latter includes the Zhou Dynasty cold period (ZDCP), Qin-Han warm period (QHWP), Wei-Jin cold period (WJCP), Sui-Tang warm period (STWP), Song-Yuan warm period (SYWP), Ming-Qing cold period (MQCP), and Anthropocene warm period (AWP). The stages (Stage 1–Stage 5) of mangrove development in Qinzhou Bay are divided by vertical broken lines.
Factors Affecting Mangrove Development
From the Holocene to the Anthropocene, mangrove development (i.e., flourishing or degradation) was mainly impacted by two aspects. One is the so-called natural agents such as the sea level, climate (air temperature and rainfall), and the hydrological environment (seawater temperature, salinity, hydrodynamic conditions). Another facet is anthropogenic activities. In this section, we analyzed the factors affecting mangrove development through the comparisons between changes in MOM and natural and anthropogenic records (Figure 5). Meanwhile, a visualized model of mangrove development in Qinzhou Bay, tropical China, over the past 3,000 years has been provided (Figure 6).
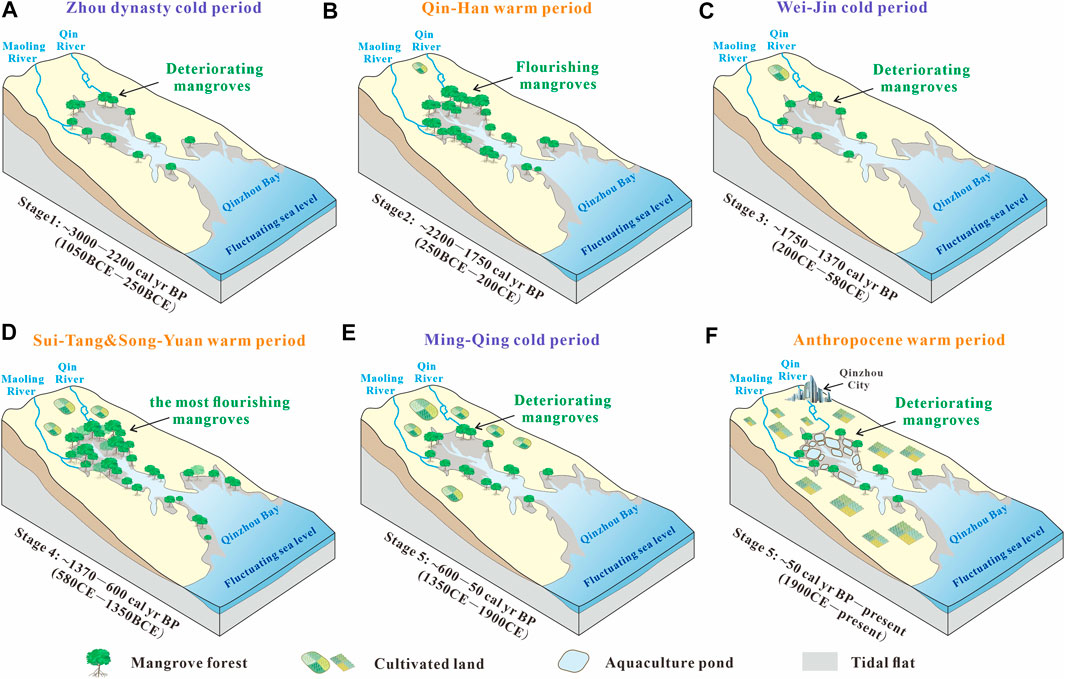
FIGURE 6. Model of mangrove development in (A–F) different stages in Qinzhou Bay, tropical China, over the past 3000 years.
Relative Sea Level
Mangrove habitats occur on intertidal shorelines in the tropics and subtropics, and are sensitive to changes in the RSL, i.e., they can migrate to landward/seaward regions with RSL rise/fall (Ellison and Stoddart, 1991; Woodroffe et al., 2016). These consequences primarily depend on the balance between changes in the relative sea level and the state of the mangrove substrate (sedimentation/erosion rate) (Ellison 2008; Soares, 2009; Cohen et al., 2016). However, rapid changes in the RSL can upset this balance, leading to a decline in or even the disappearance of mangrove habitats. Previous studies on worldwide mangrove development during the entire Holocene have shown that the landward migration and communities succession of mangrove forests occurred from the Early to Middle Holocene, the period in which the RSL rose quickly (Parkinson et al., 1994; Gilman et al., 2007; Gilman et al., 2008; Li et al., 2012), while most mangrove forests developed in situ over the Late Holocene with a relatively stable RSL (Urrego et al., 2013; Cohen et al., 2016). According to the variation in sea level over the past 3,000 cal yr BP (Kemp et al., 2018; Miller et al., 2020), the sea level in each stage of mangrove development in Qinzhou Bay varied from 0.004 to 0.37 mm yr−1 (Figure 5G). Compared with the vast fluctuation in the RSL in the Early Holocene or even the Last Glacial Period, the changes in RSL have been relatively flat since 3,000 cal yr BP, which implies that mangroves had sufficient capacity to adapt to these changes. Notably, in the Late Holocene, the sea level rose rapidly in the last 200 years. In this case, the mangrove forests still had the ability to keep pace with the RSL rise and avoid inundation via the vertical accumulation of sediments (Lovelock et al., 2015). A previous study on Yingluo Bay in tropical China showed that mangroves had not been impacted by RSL over the last 150 years (Xia et al., 2015; Meng et al., 2017). The persistence of most worldwide mangroves also implies an ability to cope with high rates of rises in the RSL. Further research suggests that mangrove forests in sites with low sedimentary supply and tidal range may be submerged as early as 2,070 (Lovelock et al., 2015). Consequently, the changes in RSL should not have been the primary factor influencing mangrove development in Qinzhou Bay over the last 3,000 cal yr BP.
Hydrological Environment
Mangrove development can be impacted by the regional hydrological environment, such as the hydrodynamic conditions, surface seawater temperature (SST), and salinity. Variations in hydrodynamic conditions are mainly impacted by changes in the climate, RSL, and terrain. However, mangrove forests have the capacity to resist changes in hydrodynamic conditions (e.g., increased wave energy) owing to their dense and complex aerial root systems (e.g., such as prop roots and pneumatophores) (Duke et al., 2007). Previous studies on the Qinzhou and Yingluo bays collectively indicate that mangrove development was little influenced by the hydrodynamic conditions during the Late Holocene (Meng et al., 2017; Xia et al., 2019). Thus, this factor does not require excessive consideration in this study.
The SST is dominated by air temperature through air-sea interactions. Similar to the air temperature, an increased SST is beneficial for mangrove growth provided the temperature does not exceed its thresholds (Ellison, 2008; Gilman et al., 2008). The study area is located in Qinzhou Bay (Figure 1), and its seawater salinity is primarily diluted by freshwater input from the Maoling and Qin rivers. Decreased precipitation can result in a decrease in groundwater discharge and surface freshwater water input (Duke et al., 1998), and can cause an increase in seawater salinity. Increased salinity is likely to cause a conversion of upper tidal zones to hypersaline flats, which poses a significant threat to the mangrove habitats (Gilman et al., 2008). On the whole, the effects of the SST and salinity on mangrove development ultimately depend on air temperature and rainfall, owing to the coupling relationship between them.
Air Temperature and Rainfall
As observed in most global locations, mangroves are prone to inhabit lower latitudes with higher temperature and precipitation (Duke et al., 1998; Giri et al., 2011). For instance, the same mangrove species (e.g., Rhizophora sp.) can reach up to 30 m in the Amazon region (0.7°S; Matos et al., 2020), whereas its average height in Guangxi (∼21°N) is merely about 3 m. Therefore, air temperature and rainfall are expected to control mangrove development by impacting their diversity, productivity, and area (Ellison, 2008; Gilman et al., 2008; Friess et al., 2019).
In Guangxi Province, SW China, rainfall is controlled by the East Asian summer monsoon (EASM), changes in which during the Holocene can be reconstructed by high-resolution stalagmite δ18O records from the Dongge Cave in SW China (Figures 1C, 5F; Wang et al., 2005). The negative excursion of δ18O value indicates a general increase in the strength of the EASM and rainfall, and vice versa. If rainfall is the main factor controlling the development of local mangroves, sections of the negative excursion of the δ18O value should correspond to periods of mangroves flourishing. Our results show that stages of relatively negative excursion of δ18O (∼2,200–1,750 and ∼1,370–600 cal yr BP) correspond to the periods of mangrove flourishing (Stage 2 and Stage 4), while sections with positive δ18O (∼1,750–1,370 and ∼600–200 cal yr BP) correspond to the periods of mangrove deterioration (Stage 3 and early Stage 5). However, these corresponding relationships are not prominent, and the stages of negative excursion of δ18O (∼3,000–2,200 and ∼200–0 cal yr BP) unconventionally correspond to the periods of deterioration of mangroves (Stage 1 and late Stage 5). Therefore, rainfall induced by the EASM may not have been the dominant factor in mangrove development since 3,000 cal yr BP. In other words, mangrove development can, but only in part, be ascribed to changes in rainfall.
Previous study has reconstructed Holocene temperature anomaly in China (Figure 5D; Hou and Fang, 2011), and have found that its tendency is consistent with temperature variation in the Northern Hemisphere over the last two millennia (Figure 5E; Ljungqvist, 2010). Based on the reconstructed temperature changes and historical records, the China’s climate can be roughly divided into three cold periods and four warm periods (Figure 5I; Zhu, 1973; Ge et al., 2014). The cold periods mainly include the Zhou Dynasty cold period (ZDCP), Wei-Jin cold period (WJCP, i.e., Dark Ages Cold Period), and Ming-Qing cold period (MQCP, i.e., Little Ice Age), while the warm periods mainly contain the Qin-Han warm period (QHWP), Sui-Tang warm period (STWP), Song-Yuan warm period (SYWP, i.e., Medieval Warm Period), and Anthropocene warm period (AWP). If air temperature is the main factor controlling mangrove development, these cold/warm climate periods ought to correspond to the stages of mangrove deterioration/flourishing, respectively. Our results show that the three periods of mangrove deterioration (stages 1, 3, and 5) approximately correspond to the ZDCP, WJCP, and MQCP, whereas the two periods of mangrove flourishing (stages 2 and 4) approximately correspond to the QHWP and STWP-SYWP, respectively (Figure 5). Notably, the STWP is one of the warmest period in Chinese climate history (Ge et al., 2014), which promoted the appearances of two famous flourishing ages (i.e., the Zhen Guan and Kai Yuan periods) in Chinese history. Owing to the collective occurrences of the STWP and SYWP in Stage 4 (∼1,370–600 cal yr BP), this stage featured the greatest flourishing of mangroves since 3,000 cal yr BP, although a transitory cold period occurred in the middle. Overall, the variation in air temperature is undoubtedly the dominant factor controlling mangrove development in Qinzhou Bay over the last 3,000 cal yr BP (Figures 6A–E). Corresponding relationships between the stages of mangrove development and temperature periods in Qinzhou Bay (Figures 1A,B, 5C; Xia et al., 2019) and Yingluo Bay (Figures 1B, 5B; Meng et al., 2017), tropical China, were very similar to our results, which further proves the controlling role of temperature in mangrove development.
However, another problem worth discussing is that the last warm period (AWP) corresponds to a stage of mangrove deterioration (late Stage 5), which implies that other factors might have influenced mangrove development.
Human Activities
Preindustrial mangrove utilization likely did not alter the extent and habitat quality of mangrove forests to a substantial degree, but the effects of human beings on mangrove resources have increased in the past few centuries and peaked in the 20th century (Friess et al., 2019). As much as 35% of the world’s mangrove areas had been lost by the 1980s and 1990s (Valiela et al., 2001). Human threats on mangrove dynamics include pollution, overexploitation, and conversion to aquaculture and agriculture (Bao et al., 2013; Friess et al., 2019; Veettil et al., 2019). In Guangxi, the population has rapidly risen over the last two centuries, similar to that in an adjacent province, Guangdong (Figure 5H; Zhao and Xie, 1988). With the population growth, the mangroves area abruptly decreased from 23,904 to 9,351 ha by 1955 (Fan, 1995), of which 97.6% was converted into aquaculture ponds (Chen et al., 2009). These realities explain the persistent mangrove degradation in late Stage 5 (∼50 cal yr BP to present), i.e., the rapid temperature rise should have promoted mangroves flourishment during the AWP just as in other warm periods in history, but this was reversed by the increase in the intensity of human activities, especially the expansion of aquaculture ponds (Figure 6F). Likewise, mangrove degradation occurred at a site (HXL) located in mangrove interior of the Qinzhou Bay during the AWP (Figures 1A,B, 5C; Xia et al., 2019). Interestingly, the records of core YLW02 showed that mangroves were flourishing in Yingluo Bay during the AWP (Figures 1B, 5B; Meng et al., 2017). Yingluo Bay is located far from industrial areas, city centers, and river basins, such that population-related negative disturbances can be ignored (Xia et al., 2015). Therefore, mangrove development in Yingluo Bay has continued to be controlled by temperature rather than human activities since the Anthropocene.
Conclusion
The contributions of terrestrial organic matter, MOM, and oceanic organic matter to OM sources of sediment core Q43 were quantified here by using endmember mixing models based on δ13C and C/N. The MOM is considered a reliable proxy for reconstructing regional mangrove development. The variations in MOM in Qinzhou Bay over the past ∼3,000 cal yr BP indicate that the mangrove forests underwent two periods of flourishing: ∼2,200–1,750 cal yr BP (Stage 2) and ∼1,370–600 cal yr BP (Stage 4), and three periods of deterioration: ∼3,000–2,200 cal yr BP (Stage 1), ∼1,750–1,370 cal yr BP (Stage 3), and ∼600–0 cal yr BP (Stage 5). Of the potential factors that impact mangrove development, the RSL changes and the regional hydrological environment (e.g., seawater temperature, salinity, and hydrodynamic conditions) did not have notable effects on mangrove flourishing/degradation. However, climate change, especially variations in the air temperature variations, was the primary factor controlling mangrove development. The stages of mangrove flourishing/deterioration corresponded to warm/cold periods of the Chinese climate, respectively. Notably, the rapid air temperature rise should have promoted mangrove development during the AWP, just as in other warm periods in history, but this trend was reversed by the increase in the intensity of human activities, especially the expansion of aquaculture ponds.
Data Availability Statement
The raw data supporting the conclusion of this article will be made available by the authors, without undue reservation.
Author Contributions
YZ contributed to laboratory analysis, data analysis, and manuscript writing; XM contributed to project design and method establishment; PX and ZL contributed to field investigation and laboratory analysis; All authors have reviewed the manuscript.
Funding
This work was supported by the National Natural Science Foundation of China (Grant Nos. 41976068 and 41576061).
Conflict of Interest
The authors declare that the research was conducted in the absence of any commercial or financial relationships that could be construed as a potential conflict of interest.
The reviewer (LL) declared a shared affiliation with several of the authors, (XM, PX, ZL), to the handling editor at time of review.
Acknowledgments
We are grateful to Guanglong Qiu from the Guangxi Mangrove Research Center for providing raw data of seagrass.
References
Alongi, D. M. (2014). Carbon Cycling and Storage in Mangrove Forests. Annu. Rev. Mar. Sci. 6, 195–219. doi:10.1146/annurev-marine-010213-135020
Alongi, D. M. (2020). Global Significance of Mangrove Blue Carbon in Climate Change Mitigation (Version 1). Sci 2, 57. doi:10.3390/sci2030057
Alongi, D. M. (2008). Mangrove Forests: Resilience, Protection From Tsunamis, and Responses to Global Climate Change. Estuar. Coast. Shelf Sci. 76, 1–13. doi:10.1016/j.ecss.2007.08.024
Bao, H., Wu, Y., Unger, D., Du, J., Herbeck, L. S., and Zhang, J. (2013). Impact of the Conversion of Mangroves Into Aquaculture Ponds on the Sedimentary Organic Matter Composition in a Tidal Flat Estuary (Hainan Island, China). Cont. Shelf Res. 57, 82–91. doi:10.1016/j.csr.2012.06.016
Bouillon, S., Boregs, A. V., Castañda-Moya, E., Diele, K., Dittmar, T., Duke, N. C., et al. (2008). Mangrove Production and Carbon Sinks: A Revision of Global Budget Estimates. Glob. Biogeochem. Cycles 22, 1–12. doi:10.1029/2007gb003052
Caratini, C., Bentaleb, I., Fontugne, M., Morzadec-Kerfourn, M. T., Pascal, J. P., and Tissot, C. (1994). A Less Humid Climate Since ca. 3500 yr B.P. from Marine Cores Off Karwar, Western India. Palaeogeogr. Palaeoclimatol. Palaeoecol. 109 (2–4), 371–384. doi:10.1016/0031-0182(94)90186-4
Chen, L., Wang, W., Zhang, Y., and Lin, G. (2009). Recent Progresses in Mangrove Conservation, Restoration and Research in China. J. Plant Ecol. 2 (2), 45–54. doi:10.1093/jpe/rtp009
Cohen, M. C. L., Lara, R. J., Cuevas, E., Oliveras, E. M., and Da Silveira Sternberg, L. (2016). Effects of Sea-Level Rise and Climatic Changes on Mangroves from Southwestern Littoral of Puerto Rico During the Middle and Late Holocene. Catena 143, 187–200. doi:10.1016/j.catena.2016.03.041
Dittmar, T., Lara, R. J., and Kattner, G. (2001). River or Mangrove? Tracing Major Organic Matter Sources in Tropical Brazilian Coastal Waters. Mar. Chem. 73 (3–4), 253–271. doi:10.1016/s0304-4203(00)00110-9
Dong, Y., Li, Y., Kong, F., Zhang, J., and Xi, M. (2020). Source, Structural Characteristics and Ecological Indication of Dissolved Organic Matter Extracted From Sediments in the Primary Tributaries of the Dagu River. Ecol. Indic. 109, 105776. doi:10.1016/j.ecolind.2019.105776
Duarte, C. M., and Arabia, S. (2017). Reviews and Syntheses: Hidden Forests, the Role of Vegetated Coastal Habitats in the Ocean Carbon Budget. Biogeosciences 14, 301–310. doi:10.5194/bg-14-301-2017
Duarte, C. M., Losada, I. J., Hendriks, I. E., Mazarrasa, I., and Marbà, N. (2013). The Role of Coastal Plant Communities for Climate Change Mitigation and Adaptation. Nat. Clim. Change 3, 961–968. doi:10.1038/nclimate1970
Duarte, C. M., Middelburg, J. J., and Caraco, N. (2005). Major Role of Marine Vegetation on the Oceanic Carbon Cycle. Biogeosciences 2, 1–8. doi:10.5194/bg-2-1-2005
Duke, N. C., Ball, M. C., and Ellison, J. C. (1998). Factors Influencing Biodiversity and Distributional Gradients in Mangroves. Glob. Ecol. Biogeogr. Lett. 7 (1), 27–47. doi:10.2307/2997695
Duke, N. C., Meynecke, J.-O., Dittmann, S., Ellison, A. M., Anger, K., Berger, U., et al. (2007). A World Without Mangroves? Science 317, 41b–42b. doi:10.1126/science.317.5834.41b
Ellison, J. C. (2008). Long-Term Retrospection on Mangrove Development Using Sediment Cores and Pollen Analysis: A Review. Aquat. Bot. 89, 93–104. doi:10.1016/j.aquabot.2008.02.007
Ellison, J. C., and Stoddart, D. R. (1991). Mangrove Ecosystem Collapse During Predicted Sea-Level Rise: Holocene Analogues and Implications. J. Coast. Res. 7 (1), 151–165. doi:10.2307/4297812
Ellison, J. C. (2014). Vulnerability Assessment of Mangroves to Climate Change and Sea-Level Rise Impacts. Wet. Ecol. Manag. 23, 115–137. doi:10.1007/s11273-014-9397-8
Fan, H. Q. (1995). Mangrove Resources, Human Disturbance and Rehabilitation Action in China. Chin. Biodiv. 3 (Suppl. 1), 49–54.
França, M. C., Francisquini, M. I., Cohen, M. C. L., and Pessenda, L. C. R. (2013). Inter-Proxy Evidence for the Development of the Amazonian Mangroves During the Holocene. Veg. Hist. Archaeobot. 23 (5), 527–542. doi:10.1007/s00334-013-0420-4
Friess, D. A., Rogers, K., Lovelock, C. E., Krauss, K. W., Hamilton, S. E., Lee, S. Y., et al. (2019). The State of the World's Mangrove Forests: Past, Present, and Future. Annu. Rev. Environ. Resour. 44, 89–115. doi:10.1146/annurev-environ-101718-033302
Ge, Q., Fang, X., and Zheng, J. (2014). Learning From the Historical Impacts of Climatic Change in China. Adv. Earth Sci. 29, 23–29. doi:10.11867/j.issn.1001-8166.2014.01.0023
Gilman, E., Ellison, J., and Coleman, R. (2007). Assessment of Mangrove Response to Projected Relative Sea-Level Rise and Recent Historical Reconstruction of Shoreline Position. Environ. Monit. Assess. 124, 105–130. doi:10.1007/s10661-006-9212-y
Gilman, E. L., Ellison, J., Duke, N. C., and Field, C. (2008). Threats to Mangroves From Climate Change and Adaptation Options: A Review. Aquat. Bot. 89, 237–250. doi:10.1016/j.aquabot.2007.12.009
Giri, C., Ochieng, E., Tieszen, L. L., Zhu, Z., Singh, A., Loveland, T., et al. (2011). Status and Distribution of Mangrove Forests of the World Using Earth Observation Satellite Data. Glob. Ecol. Biogeogr. 20, 154–159. doi:10.1111/j.1466-8238.2010.00584.x
Goñi, M. A., Ruttenberg, K. C., and Eglinton, T. I. (1998). A Reassessment of the Sources and Importance of Land-Derived Organic Matter in Surface Sediments from the Gulf of Mexico. Geochim. Cosmochim. Acta 62 (18), 3055–3075. doi:10.1016/s0016-7037(98)00217-8
Gonneea, M. E., Paytan, A., and Herrera-Silveira, J. A. (2004). Tracing Organic Matter Sources and Carbon Burial in Mangrove Sediments Over the Past 160 Years. Estuar. Coast. Shelf Sci. 61, 211–227. doi:10.1016/j.ecss.2004.04.015
Hatje, V., Masqué, P., Patire, V. F., Dórea, A., and Barros, F. (2020). Blue Carbon Stocks, Accumulation Rates, and Associated Spatial Variability in Brazilian Mangroves. Limnol. Oceanogr. 1, 1–14. doi:10.1002/lno.11607
Herbeck, L. S., Unger, D., Krumme, U., Liu, S. M., and Jennerjahn, T. C. (2011). Typhoon-Induced Precipitation Impact on Nutrient and Suspended Matter Dynamics of a Tropical Estuary Affected by Human Activities in Hainan, China. Estuar. Coast. Shelf Sci. 93, 375–388. doi:10.1016/j.ecss.2011.05.004
Hernes, P. J., Dyda, R. Y., and McDowell, W. H. (2017). Connecting Tropical River DOM and POM to the Landscape With Lignin. Geochim. Cosmochim. Acta 219, 143–159. doi:10.1016/j.gca.2017.09.028
Himes-Cornell, A., Grose, S. O., and Pendleton, L. (2018). Mangrove Ecosystem Service Values and Methodological Approaches to Valuation: Where Do We Stand?. Front. Mar. Sci. 5, 376. doi:10.3389/fmars.2018.00376
Hou, G. L., and Fang, X. Q. (2011). Characteristics of Holocene Temperature Change in China Prog. Geogr. 30 (9), 1075–1080. [in Chinese with English abstract]. doi:10.11820/dlkxjz.2011.09.001
Fan, H. Q., Chen, G. H., He, B. Y., and Mo, Z. C. (Editors) (2005). Coastal Wetland and Management of Shankou Mangroves. (Beijing, China: China Ocean Press), 35–89.
Huang, C., Zeng, T., Ye, F., Xie, L., Wang, Z., Wei, G., et al. (2018). Natural and Anthropogenic Impacts on Environmental Changes Over the Past 7500 Years Based on the Multi-Proxy Study of Shelf Sediments in the Northern South China Sea. Quat. Sci. Rev. 197, 35–48. doi:10.1016/j.quascirev.2018.08.005
Jennerjahn, T. C. (2012). Biogeochemical Response of Tropical Coastal Systems to Present and Past Environmental Change. Earth Sci. Rev. 114, 19–41. doi:10.1016/j.earscirev.2012.04.005
Jennerjahn, T. C., and Ittekkot, V. (2002). Relevance of Mangroves for the Production and Deposition of Organic Matter Along Tropical Continental Margins. Sci. Nat. 89, 23–30. doi:10.1007/s00114-001-0283-x
Jennerjahn, T. C. (2021). Relevance and Magnitude of 'Blue Carbon' Storage in Mangrove Sediments: Carbon Accumulation Rates vs. Stocks, Sources vs. Sinks. Estuar. Coast. Shelf Sci. 248, 107156. doi:10.1016/j.ecss.2020.107156
Kemp, A. C., Wright, A. J., Edwards, R. J., Barnett, R. L., Brain, M. J., Kopp, R. E., et al. (2018). Relative Sea-Level Change in Newfoundland, Canada During the Past ∼3000 Years. Quat. Sci. Rev. 201, 89–110. doi:10.1016/j.quascirev.2018.10.012
Kusumaningtyas, M. A., Hutahaean, A. A., Fischer, H. W., Pérez-Mayo, M., Ransby, D., and Jennerjahn, T. C. (2019). Variability in the Organic Carbon Stocks, Sources, and Accumulation Rates of Indonesian Mangrove Ecosystems. Estuar. Coast. Shelf Sci. 218, 310–323. doi:10.1016/j.ecss.2018.12.007
Lee, S. Y., Primavera, J. H., Dahdouh-Guebas, F., McKee, K., Bosire, J. O., Cannicci, S., et al. (2014). Ecological Role and Services of Tropical Mangrove Ecosystems: a Reassessment. Glob. Ecol. Biogeogr. 23, 726–743. doi:10.1111/geb.12155
Li, Z., Saito, Y., Mao, L., Tamura, T., Li, Z., Song, B., et al. (2012). Mid-Holocene Mangrove Succession and its Response to Sea-Level Change in the Upper Mekong River Delta, Cambodia. Quat. Res. 78, 386–399. doi:10.1016/j.yqres.2012.07.001
Li, Z., Zhang, Z., Li, J., Zhang, Y., Li, Z., Liu, L., et al. (2008). Pollen Distribution in Surface Sediments of a Mangrove System, Yingluo Bay, Guangxi, China. Rev. Palaeobot. Palynol. 152, 21–31. doi:10.1016/j.revpalbo.2008.04.001
Liu, Y., Wang, X., Wen, Q., and Zhu, N. (2019). Identifying Sources and Variations of Organic Matter in an Urban River in Beijing, China Using Stable Isotope Analysis. Ecol. Indic. 102, 783–790. doi:10.1016/j.ecolind.2019.03.023
Liu, Z., Zhao, Y., Colin, C., Stattegger, K., Wiesner, M. G., Huh, C.-A., et al. (2016). Source-to-Sink Transport Processes of Fluvial Sediments in the South China Sea. Earth Sci. Rev. 153, 238–273. doi:10.1016/j.earscirev.2015.08.005
Ljungqvist, F. C. (2010). A New Reconstruction of Temperature Variability in the Extra‐Tropical Northern Hemisphere during the Last Two Millennia. Geogr. Ann. Ser. A. Phys. Geogr. 92 (3), 339–351. doi:10.1111/j.1468-0459.2010.00399.x
Lovelock, C. E., Cahoon, D. R., Friess, D. A., Guntenspergen, G. R., Krauss, K. W., Reef, R., et al. (2015). The Vulnerability of Indo-Pacific Mangrove Forests to Sea-Level Rise. Nature 526, 559–563. doi:10.1038/nature15538
Matos, C. R. L., Berrêdo, J. F., Machado, W., Sanders, C. J., Metzger, E., and Cohen, M. C. L. (2020). Carbon and Nutrient Accumulation in Tropical Mangrove Creeks, Amazon Region. Mar. Geol. 429, 106317. doi:10.1016/j.margeo.2020.106317
Meng, X., Xia, P., Li, Z., and Liu, L. (2016a). Mangrove Forest Degradation Indicated by Mangrove-Derived Organic Matter in the Qinzhou Bay, Guangxi, China, and its Response to the Asian Monsoon During the Holocene Climatic Optimum. Acta Oceanol. Sin. 35, 95–100. doi:10.1007/s13131-015-0778-5
Meng, X., Xia, P., Li, Z., and Meng, D. (2016b). Mangrove Degradation and Response to Anthropogenic Disturbance in the Maowei Sea (SW China) Since 1926 AD: Mangrove-Derived OM and Pollen. Org. Geochem. 98, 166–175. doi:10.1016/j.orggeochem.2016.06.001
Meng, X., Xia, P., Li, Z., and Meng, D. (2017). Mangrove Development and its Response to Asian Monsoon in the Yingluo Bay (SW China) Over the Last 2000 Years. Estuar. Coasts 40, 540–552. doi:10.1007/s12237-016-0156-3
Meng, X. W., and Zhang, C. Z. (2014). Basic Situations of Marine Environment and Resources in Guangxi. (Beijing, China: China Ocean Press), 5–22.
Miller, K. G., Schmelz, W. J., Browning, J. V., Kopp, R. E., Mountain, G. S., and Wright, J. D. (2020). Ancient Sea Level as Key to the Future. Oceanography 33, 32–41. doi:10.5670/oceanog.2020.224
Moyer, R. P., Bauer, J. E., and Grottoli, A. G. (2013). Carbon Isotope Biogeochemistry of Tropical Small Mountainous River, Estuarine, and Coastal Systems of Puerto Rico. Biogeochemistry 112 (13), 589–612. doi:10.1007/s10533-012-9751-y
Nellemann, C., Corcoran, E., Duarte, C., Valdes, L., Young, C. D., Fonseca, L., et al. (2009). Blue Carbon: The Role of Healthy Oceans in Binding Carbon. (Arendal, Norway: United Nations Environment Programme), 11–65.
Parkinson, R. W., Delaune, R. D., and White, J. R. (1994). Holocene Sea-Level Rise and the Fate of Mangrove Forests Within the Wider Caribbean Region. J. Coast. Res. 10, 1077–1086. doi:10.2307/4298297
Reimer, P. J., Bard, E., Bayliss, A., Beck, J. W., Blackwell, P. G., Ramsey, C. B., et al. (2013). IntCal13 and Marine13 Radiocarbon Age Calibration Curves 0-50,000 Years Cal BP. Radiocarbon 55, 1869–1887. doi:10.2458/azu_js_rc.55.16947
Sasmito, S. D., Kuzyakov, Y., Lubis, A. A., Murdiyarso, D., Hutley, L. B., Bachri, S., et al. (2020). Organic Carbon Burial and Sources in Soils of Coastal Mudflat and Mangrove Ecosystems. Catena 187, 104414. doi:10.1016/j.catena.2019.104414
Soares, M. L. G. (2009). A Conceptual Model for the Responses of Mangrove Forests to Sea Level Rise. J. Coast. Res. 56, 267–271. doi:10.2307/25737579
Southon, J., Kashgarian, M., Fontugne, M., Metivier, B., and W-S Yim, W. (2002). Marine Reservoir Corrections for the Indian Ocean and Southeast Asia. Radiocarbon 44, 167–180. doi:10.1017/s0033822200064778
Urrego, L. E., Correa-Metrio, A., González, C., Castaño, A. R., and Yokoyama, Y. (2013). Contrasting Responses of Two Caribbean Mangroves to Sea-Level Rise in the Guajira Peninsula (Colombian Caribbean). Palaeogeogr. Palaeoclimatol. Palaeoecol. 370, 92–102. doi:10.1016/j.palaeo.2012.11.023
Valiela, I., Bowen, J. L., and York, J. K. (2001). Mangrove Forests: One of the World's Threatened Major Tropical Environments. BioScience 51 (10), 807–815. doi:10.1641/0006-3568(2001)051[0807:mfootw]2.0.co;2
Vaughn, D. R., Bianchi, T. S., Shields, M. R., Kenney, W. F., and Osborne, T. Z. (2021). Blue Carbon Soil Stock Development and Estimates Within Northern Florida Wetlands. Front. Earth Sci. 9, 552721. doi:10.3389/feart.2021.552721
Veettil, B. K., Ward, R. D., Quang, N. X., Trang, N. T. T., and Giang, T. H. (2019). Mangroves of Vietnam: Historical Development, Current State of Research and Future Threats. Estuar. Coast. Shelf Sci. 218, 212–236. doi:10.1016/j.ecss.2018.12.021
Wang, Y., Cheng, H., Edwards, R. L., He, Y., Kong, X., An, Z., et al. (2005). The Holocene Asian Monsoon: Links to Solar Changes and North Atlantic Climate. Science 308, 854–857. doi:10.1126/science.1106296
Woodroffe, C. D., Rogers, K., McKee, K. L., Lovelock, C. E., Mendelssohn, I. A., and Saintilan, N. (2016). Mangrove Sedimentation and Response to Relative Sea-Level Rise. Annu. Rev. Mar. Sci. 8, 243–266. doi:10.1146/annurev-marine-122414-034025
Xia, P., Meng, X., Li, Z., Feng, A., Yin, P., and Zhang, Y. (2015). Mangrove Development and its Response to Environmental Change in Yingluo Bay (SW China) During the Last 150 years: Stable Carbon Isotopes and Mangrove Pollen. Org. Geochem. 85, 32–41. doi:10.1016/j.orggeochem.2015.04.003
Xia, P., Meng, X., Li, Z., Zhi, P., Zhao, M., and Wang, E. (2019). Late Holocene Mangrove Development and Response to Sea Level Change in the Northwestern South China Sea. Acta Oceanol. Sin. 38, 111–120. doi:10.1007/s13131-019-1359-9
Xia, P., Meng, X., Zhang, Y., Zhang, J., Li, Z., and Wang, W. (2021). The Potential of Mangrove-Derived Organic Matter in Sediments for Tracing Mangrove Development During the Holocene. Estuar. Coast. 44, 1020–1035. doi:10.1007/s12237-020-00826-w
Xue, B., Yan, C., Lu, H., and Bai, Y. (2009). Mangrove-Derived Organic Carbon in Sediment from Zhangjiang Estuary (China) Mangrove Wetland. J. Coast. Res. 254, 949–956. doi:10.2112/08-1047.1
Zhang, Y., Meng, X., Bai, Y., Wang, X., Xia, P., Yang, G., et al. (2021). Sources and Features of Particulate Organic Matter in Tropical Small Mountainous Rivers (SW China) Under the Effects of Anthropogenic Activities. Ecol. Indic. 125, 107471. doi:10.1016/j.ecolind.2021.107471
Keywords: organic matter source, mangrove-derived organic matter, mangrove development, air temperature, anthropogenic activity, late Holocene
Citation: Zhang Y, Meng X, Xia P and Li Z (2021) Response of Mangrove Development to Air Temperature Variation Over the Past 3000 Years in Qinzhou Bay, Tropical China. Front. Earth Sci. 9:678189. doi: 10.3389/feart.2021.678189
Received: 09 March 2021; Accepted: 05 May 2021;
Published: 25 May 2021.
Edited by:
Min-Te Chen, National Taiwan Ocean University, TaiwanReviewed by:
Lejun Liu, Ministry of Natural Resources, ChinaChuanxiu Luo, Chinese Academy of Sciences (CAS), China
Hasrizal Shaari, University of Malaysia Terengganu, Malaysia
Copyright © 2021 Zhang, Meng, Xia and Li. This is an open-access article distributed under the terms of the Creative Commons Attribution License (CC BY). The use, distribution or reproduction in other forums is permitted, provided the original author(s) and the copyright owner(s) are credited and that the original publication in this journal is cited, in accordance with accepted academic practice. No use, distribution or reproduction is permitted which does not comply with these terms.
*Correspondence: Xianwei Meng, bXh3QGZpby5vcmcuY24= Peng Xia, cGVuZ3hpYUBmaW8ub3JnLmNu
†Present address: Zhen Li, Department of Earth, Ocean and Atmospheric Sciences, University of British Columbia, Vancouver, BC, Canada