 Francesca Di Luccio1*
 Patricia Persaud2
 Luigi Cucci1
 Alessandra Esposito1
 Roberto Carniel3
 Guillermo Cortés3
 Danilo Galluzzo4
 Robert W. Clayton5
 Guido Ventura1,6
- 1Istituto Nazionale di Geofisica e Vulcanologia, Rome, Italy
- 2Department of Geology and Geophysics, Louisiana State University, Baton Rouge, LA, United States
- 3Dipartimento Politecnico di Ingegneria e Architettura, Università degli Studi di Udine, Udine, Italy
- 4Istituto Nazionale di Geofisica e Vulcanologia, Osservatorio Vesuviano, Napoli, Italy
- 5Seismological Laboratory, California Institute of Technology, Pasadena, CA, United States
- 6Istituto per lo Studio degli impatti Antropici e Sostenibilitá in ambiente marino (IAS), Capo Granitola, Trapani, Italy
Seismic activity in volcanic settings could be the signature of processes that include magma dynamics, hydrothermal activity and geodynamics. The main goal of this study is to analyze the seismicity of Lipari Island (Southern Tyrrhenian Sea) to characterize the dynamic processes such as the interaction between pre-existing structures and hydrothermal processes affecting the Aeolian Islands. We deployed a dense seismic array of 48 autonomous 3-component nodes. For the first time, Lipari and its hydrothermal field are investigated by a seismic array recording continuously for about a month in late 2018 with a 0.1–1.5 km station spacing. We investigate the distribution and evolution of the seismicity over the full time of the experiment using self-organized maps and automatic algorithms. We show that the sea wave motion strongly influences the background seismic noise. Using an automatic template matching approach, we detect and locate a seismic swarm offshore the western coast of Lipari. This swarm, made of transient-like signals also recognized by array and polarization analyses in the time and frequency domains, is possibly associated with the activation of a NE-SW fault. We also found the occurrence of hybrid events close to the onshore Lipari hydrothermal system. These events suggest the involvement of hot hydrothermal fluids moving along pre-existing fractures. Seismological analyses of one month of data detect signals related to the regional tectonics, hydrothermal system and sea dynamics in Lipari Island.
Introduction
Seismicity in volcanic areas is commonly analyzed to understand the dynamic processes occurring at different scales and to monitor the seismic hazard. In subduction zones seismic signals include purely tectonic events, tremors due to hydrothermalism, magma migration or plate interaction, volcano-tectonic events, swarms and transients (Eiler, 2003). Therefore it is important to identify the source of the different types of signals also from a volcanic and seismic hazard perspective, particularly where monitoring systems are poorly developed or lacking. The southern Tyrrhenian Sea-Calabrian Arc-Ionian Sea subduction setting is characterized by the volcanic arc including Lipari, Vulcano and Salina islands, which form a NNW-SSE elongated volcanic ridge crossing the central portion of the Aeolian Archipelago (Figures 1A,B) (De Astis et al., 2003). The volcanic ridge formed in Quaternary times along the Aeolian Tindari-Letojanni (ATL) fault system, a Subduction-Transform-Edge Propagator (STEP) fault that bounds the western edge of the subduction of the Ionian Sea below the Calabrian Arc and transfers stress across northeastern Sicily (Govers and Wortel, 2005; Billi et al., 2006; Scarfì et al., 2018).
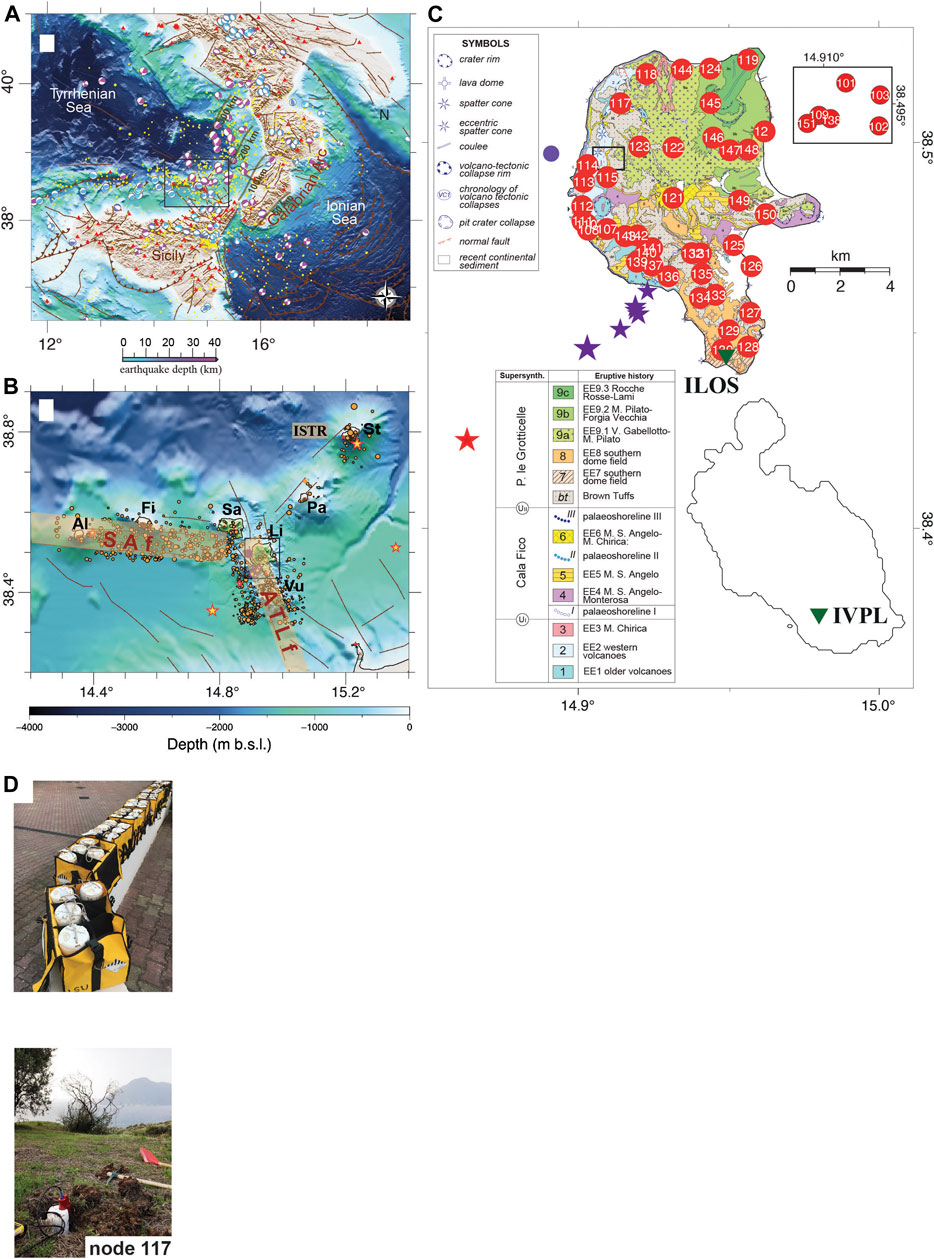
FIGURE 1. (A) Map of Southern Italy. The main faults and thrusts (brown lines) are from Palano et al. (2015). Slab isodepths at 50, 100, 200 and 300 km are shown with gray lines. Red triangles are the broadband seismic stations of the INGV permanent network (http://cnt.rm.ingv.it/instruments/network/IV). The 2000–2019 seismicity from the INGV seismic catalog (http://iside.rm.ingv.it/) is shown as yellow dots. Regional Centroid Moment Tensor solutions (http://rcmt2.bo.ingv.it/) for events larger than 4.5 are color-coded by depth. The black rectangle outlines the area shown in (B), where the main tectonic structures are shown: SAf = the Sisifo-Alicudi fault system; ATLf = the Aeolian-Tindari-Letojanni fault system. From west to east, the Aeolian islands are also labeled: Al = Alicudi; Fi = Filicudi; Sa = Salina; Li = Lipari; Vu = Vulcano; Pa = Panarea; St = Stromboli. ISTR is the tyde station at Stromboli island. The Aeolian seismicity (orange circles) is from Gruppo Analisi Dati Sismici (2021) (http://sismoweb.ct.ingv.it/maps/eq_maps/sicily/catalogue.php). Red stars are the Aeolian earthquakes that occurred during the Lipari array acquisition time. Purple circle and stars to the west of Lipari Island, inside the black box, are the events located in this study and shown in panel (C). Bathymetric data in (A) and (B) are from Ryan et al. (2009). (C) The Lipari-Vulcano complex. The geological map of Lipari Island is modified after Forni et al. (2013). Red circles indicate the locations of the seismic nodes and their ID numbers. Inset in the upper right corner shows an expanded view of the seismic nodes in the fumaroles area (indicated by a black rectangle). ILOS on Lipari and IVPL on Vulcano are permanent stations. The purple circle is the very shallow event of 26 October 2018, while the purple stars indicate the seismic swarm from 4 November 2018, whose main shock was originally located at the red star to the south-west (https://www.ct.ingv.it/). (D) Photos of the nodes on the day of the removal (top) and a typical node installation (bottom) are shown.
The ATL is a complex and heterogeneous crustal discontinuity consisting of a broad NNW-SSE- to NW-SE-trending fault system that cuts the south-western flank of Lipari and Salina, borders both the western and eastern flanks of Vulcano and extends southward to the Ionian coast of Sicily (Figure 1B) (Palano et al., 2015). The Sisifo-Alicudi (SA) fault forms the eastern boundary of an E-W-trending transpressional belt which extends from far west in the southern Tyrrhenian Sea (Figure 1A) to Lipari-Vulcano (Figure 1B) absorbing a portion of the Africa-Eurasia convergence rate (Palano et al., 2012). A large number of geological and geophysical observations have suggested that magma channeling and uprising in western and central Aeolian Islands have been controlled by the SA (∼1.3 Myr) and the ATL fault systems (∼0.4 Myr; De Astis et al., 2003; Ventura et al., 2013). Spatial distribution of crustal earthquake clusters along both tectonic structures and the largest events occurred in 1978 (M5.6) and 1980 (M5.7) on ATL and SA, respectively (Neri et al., 1996). Focal mechanisms of earthquakes are consistent with right-lateral slip in NNW-SSE direction in response to a strike-slip stress regime characterized by a N-S compression (Cintorrino et al., 2019). Deep events, down to 200 km, also occur to the east of ATL and are associated with the Ionian subduction zone (Milano et al., 1994).
Ground deformation measurements (Bonaccorso, 2002; Mattia et al., 2008; Esposito et al., 2015) indicate the N-S contraction of Lipari and Vulcano and an overall subsidence with rates decreasing from the northernmost GPS stations to the southernmost ones. Recent studies (Alparone et al., 2019; Cintorrino et al., 2019) show that the surface ground deformation is explained by the joint contribution of regional (tectonic, ATL) and local (magmatic, a deflating source located under Vulcano at a depth of ∼4 km) sources. Furthermore, archaeological data indicate that the southern sector of Lipari has been undergoing subsidence for the last 2,100 years at rates of up to ∼11 mm/yr (Anzidei et al., 2016; Anzidei et al., 2017).
In the last decades, a number of studies based on seismic reflection, marine morpho-structural and bathymetric data (Favalli et al., 2005; Argnani et al., 2007; Bortoluzzi et al., 2010; Cultrera et al., 2017) have mapped main fault segments, therefore providing constraints on the structural trends and tectonic arrangement of the southern Tyrrhenian region. These data, complemented with the structural data on land, have shown that Lipari and Vulcano are primary controlled by NNW to NW-SE strike-slip faults, coupled with secondary NE-SW and N-S striking faults (Mazzuoli et al., 1995; Ventura et al., 1999; De Astis et al., 2003; Ruch et al., 2016). Moreover, the N-S faults control the location of the shallow magmatic reservoirs responsible for the more recent (<55 kyr) volcanism at Lipari and Vulcano (Ventura et al., 1999; Ruch et al., 2016). In the case of Lipari, volcanism occurred between 267 ka and 1,220 AD (Forni et al., 2013) on a 20 km thick continental crust (Ventura et al., 1999; Calò et al., 2013). Volcanic activity developed in three main phases: 1) the early activity (267 ka to about 150 ka), mainly focused in the western sector, with the eruption of lava flows and scorias; 2) the 119–81 ka volcanism concentrated in the central sector with the emplacements of lavas and pyroclastics (Monte S. Angelo and Monte Chirica volcanoes, close to the 121 and 145 nodes, respectively, Figure 1C); 3) the more recent volcanism, 42 ka to 1,220 AD, affected the southern and eastern sectors and comprises pyroclastic fall and flow deposits, lava flows and domes, the latter concentrated in the southern sector. The last eruption occurred in the NE corner of the island with the formation of a rhyolitic pumice cone and the emplacement of obsidian lava. A hydrothermal field is located in Lipari’s western sector, where hydrothermal activity is concentrated on faults and fractures that align along a N-S direction (Ruch et al., 2016; Cucci et al., 2017). Hydrothermal output mainly consists of CO2 of magmatic origin (Cioni et al., 1998). Although the last volcanic eruption in Lipari occurred in 1,220 AD, volcanic features such as hot springs and fumaroles observed at the surface prove that volcanism is still active (Cioni et al., 1998). Very few studies have focused on the Lipari hydrothermal system, among them Bruno et al. (2000) observed that the fluid circulation concentrates along the ENE-trending faults located near the Terme di San Calogero resort (south of the fumaroles area shown in Figure 1C). Cucci et al. (2017), analyzing the gypsum-filled vein networks in the kaolin area (outlined black square in Figure 1C), have concluded that the decrease of the fluid discharge in hydrothermal fields may reflect pressurization at depth potentially preceding hydrothermal explosions. Fumaroles and hot water, along with a kaolin-dominated alteration zone, describe the N-S hydrothermal belt that is characterized by magmatic CO2 with equilibrium temperatures of 170–180°C and SO42− up to 780 ppm (Cioni et al., 1988). The more recent, still active surface hydrothermal alteration episode started at about 27 ka with temperatures up to 90°C. The presence of active structures has also been related to anomalies in the spatial distribution of soil gas emissions (Camarda et al., 2016). The hydrothermal activity accounts for the shallow depth of the magnetic bottom (Curie isotherm) at Lipari, which is at about 1 km depth (De Ritis et al., 2013). The spatial distribution of the seismicity and the shallow Curie isotherm led De Ritis et al. (2013) to put forward the hypothesis of the existence of a “soft” layer due to melts and/or high temperature fluids beneath Lipari.
Methods and Results
To investigate the seismicity in Lipari, we carried out a passive seismic experiment from October 16 to November 14, 2018. We deployed a nodal seismic array of 48 FairfieldNodal ZLand three-component nodes (stations) with a 5 Hz low-corner frequency, nominal sensitivity of 78.7 Vm−1 s−1 and battery life of about one month (Di Luccio et al., 2019).
All the nodes, placed at distances between 0.1 and 1.5 km on the island (Figure 1C), recorded continuously at a 4 ms sampling rate. Nodes were buried beneath a few centimeters of soil allowing the GPS signal to arrive at each node for time synchronization; most of them were installed on the street side, others were placed with homeowners, hotel owners, at the Lipari Observatory and Lipari Museum (Figure 1D). Site selection was done before the deployment that took two days and was completed by two groups, each composed of two persons. The deployment and retrieval of the cable-free node system was faster than it would have been with a cabled system, and also cheaper in terms of costs and personnel required. Each node is a complete recording system, including the data logger, a flash memory card and the GPS, without any required connection to any external device, once it has been programmed for the specific acquisition in the laboratory.
The Lipari array recorded over 300 Gb of data, including local and distant earthquakes, as for instance the October 25, 2018 Mw6.8 Peloponnese event and its aftershocks (Di Luccio et al., 2019). This is the first time that such a dense seismic array has been deployed on Lipari Island. In Figure 2 one-day station plots show the quality of the recorded data as well as the day and night noise level.
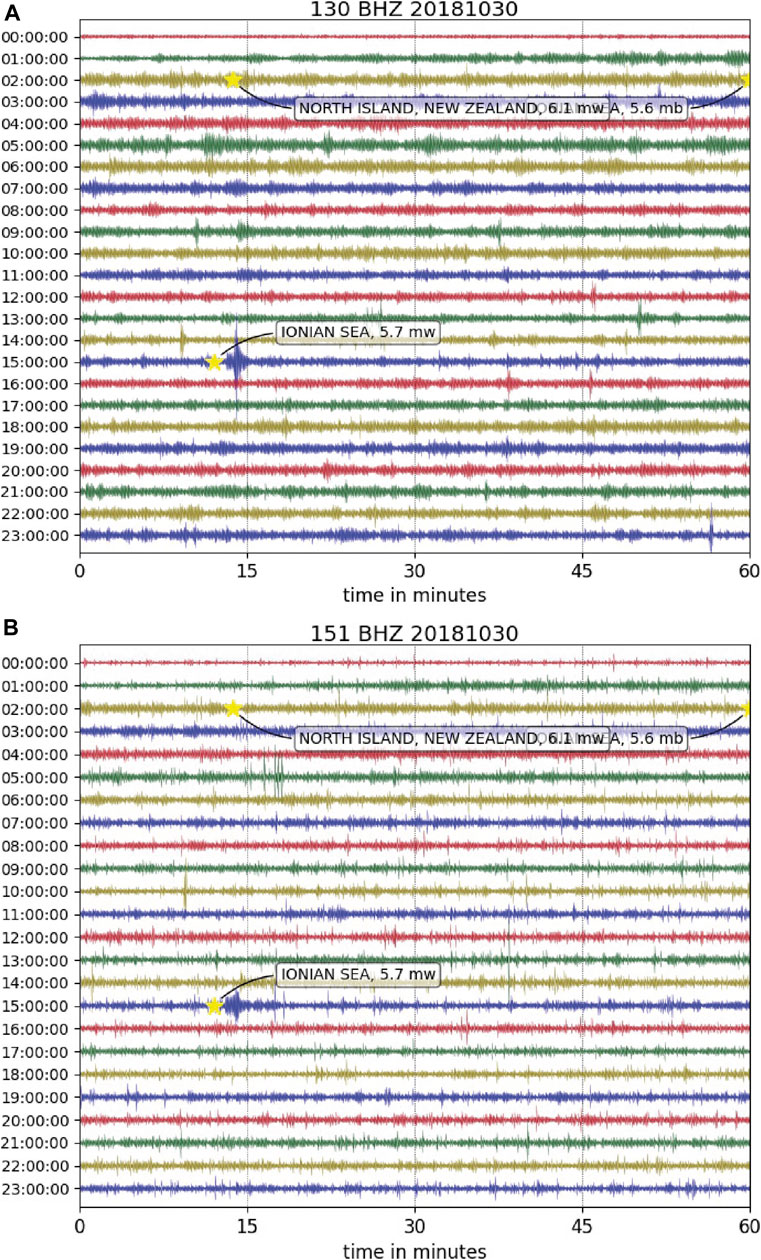
FIGURE 2. Day-plots for 30 October, 2018 showing the vertical component of stations 130 (top) and 151 (bottom). P-arrivals of the teleseismic events with magnitude larger than 5.5 that occurred on the same day are also indicated with the yellow stars. Node locations are shown in Figure 1C.
Preliminary Data Inspection and Automatic Event Detection
Data plots of October 30, 2018 show very noisy waveforms at the nodes in the western and southern Lipari (Figure 2) with respect to other days in which the noise level is quite low, at day and night times. Permanent stations, ILOS at Lipari and IVPL at Vulcano (Figure 1C for location) show the same pattern on the same day.
For fast event detection, we run a coincidence trigger algorithm on the whole dataset based on a classical Short Term Average/Long Term Average (STA/LTA) waveform amplitude (Allen, 1978). The automatic coincidence-triggering procedure has been tested using different combinations of parameters of STA, LTA, the trigger threshold level and station coincidence, in order to find the best values to reduce the number of false alarms and to include signals with low SNR. Following Trnkoczy (2002) and in order to detect the local events that eventually occurred during the one month of recording, we set STA = 0.4 s, LTA = 20 s; thresholds of trigger on and off are 4 and 1, respectively, and the station coincidence is set to 30. The STA/LTA procedure has been applied to the 1-h long vertical components of all nodes using the ObsPy code (Beyreuther et al., 2010). Results of this analysis are shown and discussed in detail later in Figure 5. Although the automatic triggering procedure does not allow us to discriminate among the different types of events, it is interesting that it detected at least four periods of “anomalous seismicity” in late 2018, precisely October 22, 25–27, 30–31 and November 2, 4–6.
To further investigate the overall signal properties, we compute the spectral parametrization of the whole dataset from 19 October to 13 November in terms of central frequency and shape factor of the power spectra (Kramer, 1996) for each node. The application of this methodology provides an effective image of the entire time record in a few seconds, as successfully applied in other volcanic settings (Galluzzo et al., 2020). In Figure 3, we plot spectral results for node 117 which shows an anomalous pattern similar to the one described above, both in terms of central frequency and shape factor of the spectra. A central frequency of 7–8 Hz corresponding to a shape factor of 0.4 is observed in the continuous record around 30 October, although other days show significant minima in the central frequency.
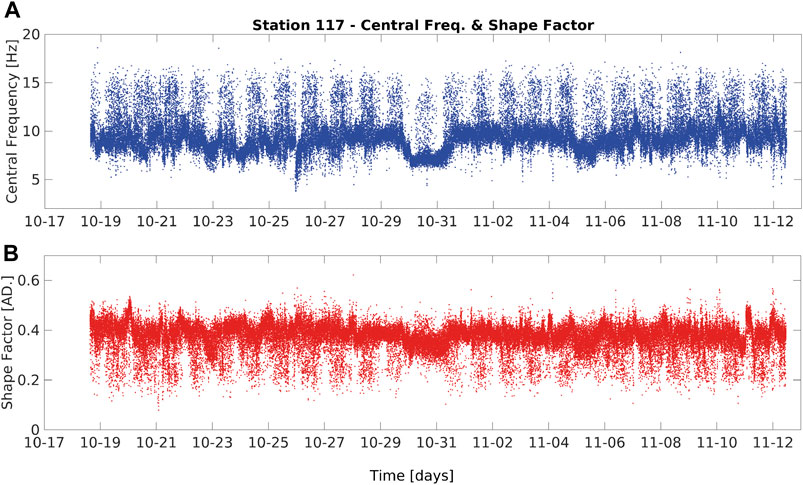
FIGURE 3. Spectral parametrization of the dataset recorded from 19 October to 13 November 2018 at node 117, in terms of central frequency (top) and shape factor (bottom).
Further insights into the anomalous periods are given in the next sections, where we discuss different approaches that have been used to study the seismic signals recorded during the Lipari array acquisition time. The evolution of the seismicity for selected stations is also discussed below.
Machine Learning Approaches
The continuous seismic signal, which can be seen as seismic noise or tremor also depending on the SNR (Carniel, 2010) is very information-rich due to its persistence and memory (Jaquet and Carniel, 2003; Jaquet et al., 2006). We apply unsupervized and supervised machine learning techniques to rapidly identify possible coherent regimes in the continuous seismic stream at Lipari. This allows us to identify discrete volcano-seismic events in terms of feature vectors based on amplitude, shape and frequencies (Carniel, 2014; Carniel and Guzman, 2021, for a review). Supervised tools need a model previously trained on a catalog of labeled data, and they are therefore more suitable to detect and classify discrete events (Malfante et al., 2018). They can be considered an evolution of the concept of template matching in which similar events are detected on the basis of the similarity with given examples (templates). Template matching is often used to detect aftershocks (Peng and Zhao, 2009), but also in volcano seismology to detect VT swarms (Passarelli et al., 2018), to characterize pre-eruptive sequences (Lengliné et al., 2016) or Long Period subevent multiplets (Matoza et al., 2015). The unsupervized approach on the other hand is usually more useful for tackling the analysis of continuous data (Seydoux et al., 2020). The first task is to recognize the possible presence of coherent regimes in the Lipari dataset.
Self-Organized Maps and Cluster Analysis
A suitable approach to unsupervized classification of continuous seismic data is provided by Kohonen maps or Self Organizing Maps (SOM) (Kohonen, 2001), a type of Artificial Neural Network aimed at producing a 2D discretized representation of the feature vector space that describes the data as several clusters or subspaces of vectors with similar values. The unsupervized training is based on a combination of competitive and collaborative learning, using a neighborhood function to preserve the input topological properties. In volcano-seismology, SOM have been applied to several volcanoes in New Zealand, such as Raoul Island (Carniel et al., 2013a), Ruapehu (Carniel et al., 2013b) and Tongariro (Jolly et al., 2014). In the last two cases a hierarchical clustering was applied to the results of SOM to provide a simpler categorization of different regimes. A similar approach was applied to the Etna volcanic tremor (Messina and Langer, 2011). The determination of the number of clusters to be used is not straightforward, although several criteria can facilitate the choice, such as elbow, silhouette, gap statistics and other heuristics (Carniel and Guzman, 2021). We used SOM routines based on the SOMPY Python library (Moosavi et al., 2014).
Each data stream collected by the Lipari array is parametrized as a sequence of vectors describing consecutive data segments of 1-min with 31 static features (10 statistical, 11 characterizing the waveform shape and 10 determining the distribution of the cepstral energy) and another 31 dynamic components (the time derivative of the static components). Those feature vectors are then classified and clustered using an unsupervized SOM. Results are shown in Figure 4 using 10 clusters. Time evolution shows coherent appearance and disappearance of clusters indicated by the number on the vertical axis. Cluster colors are only used to facilitate the visualization of the cluster evolution in time. In the time period of October 30–31, frames are mostly classified in only a few clusters. This “anomalous” behavior does not seem to be correlated with rainfall, temperature and wind conditions which are also shown for comparison in Figure 4. Differently from what was observed on the near Stromboli island (Figure 1B for location) (Carniel and Tárraga, 2006), there is no evident correlation of regime transitions (shown as vertical lines in Figure 4) with the INGV earthquake catalog (http://iside.rm.ingv.it/); this because no significant seismicity was recorded in the time frame of the Lipari experiment (stars in Figure 1B).
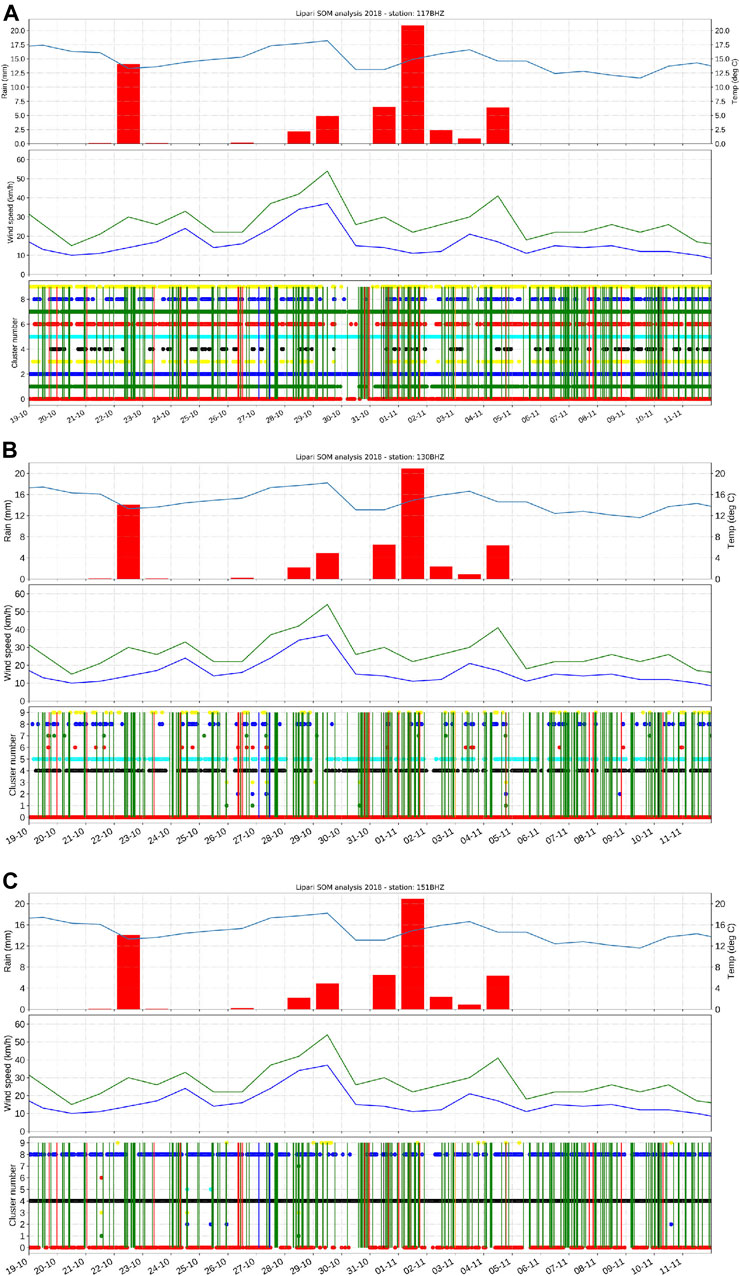
FIGURE 4. 1-min long frames for stations 117 (top), 130 (middle) and 151 (bottom). Time evolution (horizontal axis) shows coherent appearance and disappearance of clusters, indicated by the number on the vertical axis. Cluster colors are only used to facilitate following their time evolution. Note the “anomalous” period of 30 October–1 November 2018, where frames are mostly classified in only a few clusters. Cluster numbers do not correlate with weather data as shown in the top panels of each figure.
Seismicity Evolution From Supervised Recognition Systems
As we mentioned above, to detect and classify discrete seismic events of the different classes we use the supervised Machine Learning approach. Volcano Seismic Recognition (VSR) systems are generally trained on a single station of a single volcano, decreasing their efficiency when used to recognize events from another station, in a different eruptive scenario or at different volcanoes. However, in the case of Lipari a catalog of previously manually labeled events is not available for training. This is a common situation at many volcanoes that are poorly monitored or lack recent volcanic activity. Specifically for these cases, an innovative, multi-volcano approach was developed by the recent EU funded VULCAN.ears project (Cortés et al., 2021). A Volcano-Independent VSR (VI.VSR) system was proposed, in which universal recognition models are trained with data of several volcanoes to become portable and robust. The VI.VSR technology represents therefore a major breakthrough, as on one side the approach remains conceptually supervised (as it requires labeled data in order to build class models), but in practice it becomes virtually unsupervized, because the models used are already trained through labeled data recorded at other volcanoes.
To study the evolution of the seismic activity, after a careful inspection of the seismic signal at different stations, we run an algorithm on the vertical components of the recordings to automatically detect and classify (recognition stage) volcano-seismic events at the following stations (Figure 1C for station location): 117, the best station in terms of SNR after a visual inspection, in the north-western sector of Lipari on tuffs; 151, in the fumarole field; and 130, the southernmost and one of the most noisy stations.
The VI.VSR approach aims to automatically search typical seismic events in continuous data streams recorded at any volcano (Cortés et al., 2021). The VI.VSR algorithm requires previously modeling of each different type of seismic events or classes prior to recognizing them. To achieve the volcano-independent feature, robust state-of-the-art Hidden Markov Models are built analyzing thousands of manually classified events from different volcanoes, different stations and different epochs (Cortés et al., 2009), resulting in convenient volcano-independent model sets. To characterize the seismicity of Lipari Island we need to select among the available model sets those that most closely resemble the expected type of seismicity found in the observed signals. Our first trial uses two VI.VSR model sets: 1) the “closed-vent” one, composed of data recorded at three well-studied volcanoes, all with a closed-vent, specifically the Cotopaxi, in the Andes in Ecuador, La Grande Soufrière, in the Guadeloupe Island, and Deception Island, in Antarctica, and, 2) the VI.VSR “Deception” models, with labeled data gathered at different locations of Deception Island in the 1995, 1998 and 2009 field campaigns (Carmona et al., 2014). If one event “X” is found to belong to one class “C,” it means that, according to a given VI.VSR model set, “X” will statistically belong to the class “C” instead of the class “D” of the same set. This approach recognizes lots of events even in noisy data with the same probability of occurrence as those with clean and high SNR events (Cortés et al., 2019). Nevertheless, in low SNR conditions, the reliability of the detection and classification tasks is much lower than in the case of high SNR data.
Once the VI.VSR has terminated, we manually inspect the “anomalous” time windows where specific events have been found. Results of this analysis are shown in Figure 5. Different volcano-seismic classes have been automatically detected. LPs are long-period events, which are very commonly observed in active volcanoes, but are not easily interpreted. These signals can be explained by different proposed models that include oscillations of sub-horizontal gas-filled cracks (Molina et al., 2004), stick–slip magma motion (Iverson, 2008), fluid-driven flow (Julian, 1994) and slow ruptures (Harrington and Brodsky, 2007; Bean et al., 2014). TECs are signals assigned to purely tectonic events; and VTs are related to volcano-tectonic models. Figure 5 suggests that signals on days October 22, 26 and 30 and November 4–5 are worth further investigating.
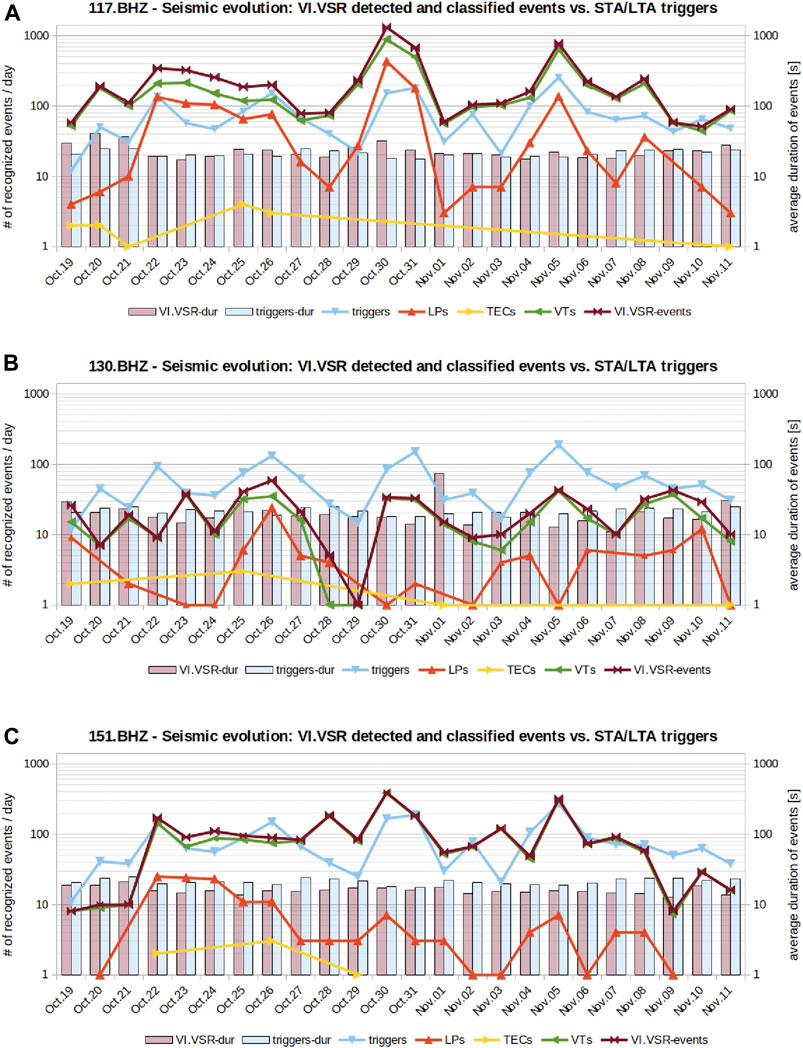
FIGURE 5. Seismic evolution for nodes 117 (top), 130 (middle), 151 (bottom) (see Figure 1 for locations). Plot of the type and duration of events (long periods – LPs, tectonics – TECs and volcano-tectonic – VTs earthquakes) automatically recognized by the Volcano-Independent Seismic Recognition (VI.VSR) system. For comparison the number and duration of the event triggers found by the classic STA/LTA algorithm are also shown. The VI.VSR classified and STA/LTA detected events show a similar pattern in all stations.
To explain the “anomalous” behavior of the seismic signals as derived from a classical STA/LTA approach, from the SOM and cluster analysis, we compare the sea level as measured nearby Lipari, at the closest station ISTR (Figure 6) of Ginostra (about 40 km NE of Lipari), located in western Stromboli (Figure 1B for locations). In Figure 6 it is straightforward to note a clear correlation between the seismic signal and the pattern of hydrometric level recorded at Ginostra. In particular, a remarkable increase of the seismic noise is associated with periods of larger oscillations of the sea level, as observed between October 22 and 23, and between October 29 and 31. This correlation is poor at station 117 and remarkable at stations 138 and 130. Interestingly, for the duration of the experiment, the sea wave height due to storms is likely causing the high noise observed in the cluster analysis and in the evolution of the seismic signal as well as in the day-plots shown in the previous section (Figure 2). In addition, it is also worth noting that node 130 is noisier than nodes 117 and 138 (which is located in the hydrothermal area). Furthermore, the relatively low noise at station 117 seems to be of anthropic origin, as it always recurs on a daily pattern.
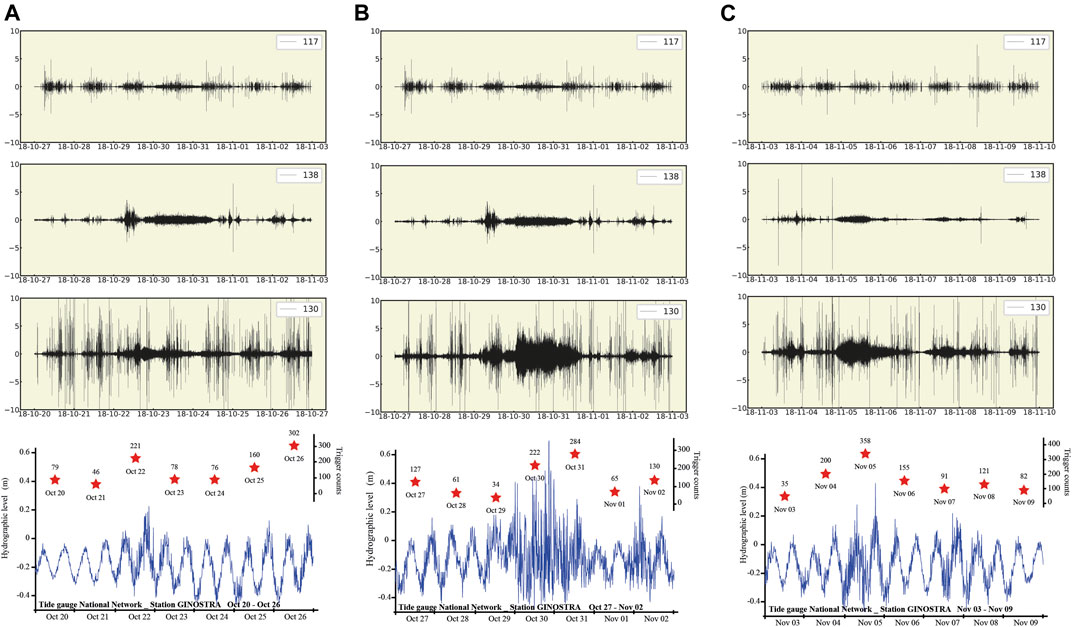
FIGURE 6. Plots of seismic signal at three different nodes (117, 138 and 130) and height of the sea wave at the tide gauge of Ginostra (ISTR) (https://www.mareografico.it) for three-time intervals in 2018: (A) 20 to 26 October 2018; (B) 27 October to 2 November 2018; (C) 3 to 9 November 2018. Red stars indicate the daily trigger counts recorded during each period. See text for details.
Seismological Analysis
We focus on two kinds of signals that are clearly observed at most stations and can help in understanding the dynamics of Lipari: the volcano-tectonic (VT) events, which are a common feature in volcanic and tectonically active areas, and the hybrid monochromatic signals, which are usually seismic transients produced by magmatic and/or hydrothermal fluids (Ohminato, 2006; Chouet and Matoza, 2013). A hybrid event is defined as a signal with a clear onset typical of VT events and a harmonic coda characteristic of LP signals, so a hybrid event is related to a shear-failure triggering mechanism and to a resonance effect created by a fluid-filled crack (Lahr et al., 1994).
In light of the results from previous analyses, we chose to closely inspect the waveform data of 4 November, since the INGV-OE bulletin (http://sismoweb.ct.ingv.it/maps/eq_maps/sicily/catalogue.php) reported a ML1.1 earthquake at 18:44 UTC located offshore the western coasts of Lipari and Vulcano (Figure 7A). A record section of the VT event at the Lipari array is shown Figure 7B, where traces are normalized by the global maximum. This small event was preceded and followed by even smaller events as shown in Figure 7C along with the spectrograms in 10 min long time windows, where most of the seismic energy is above 4 Hz.
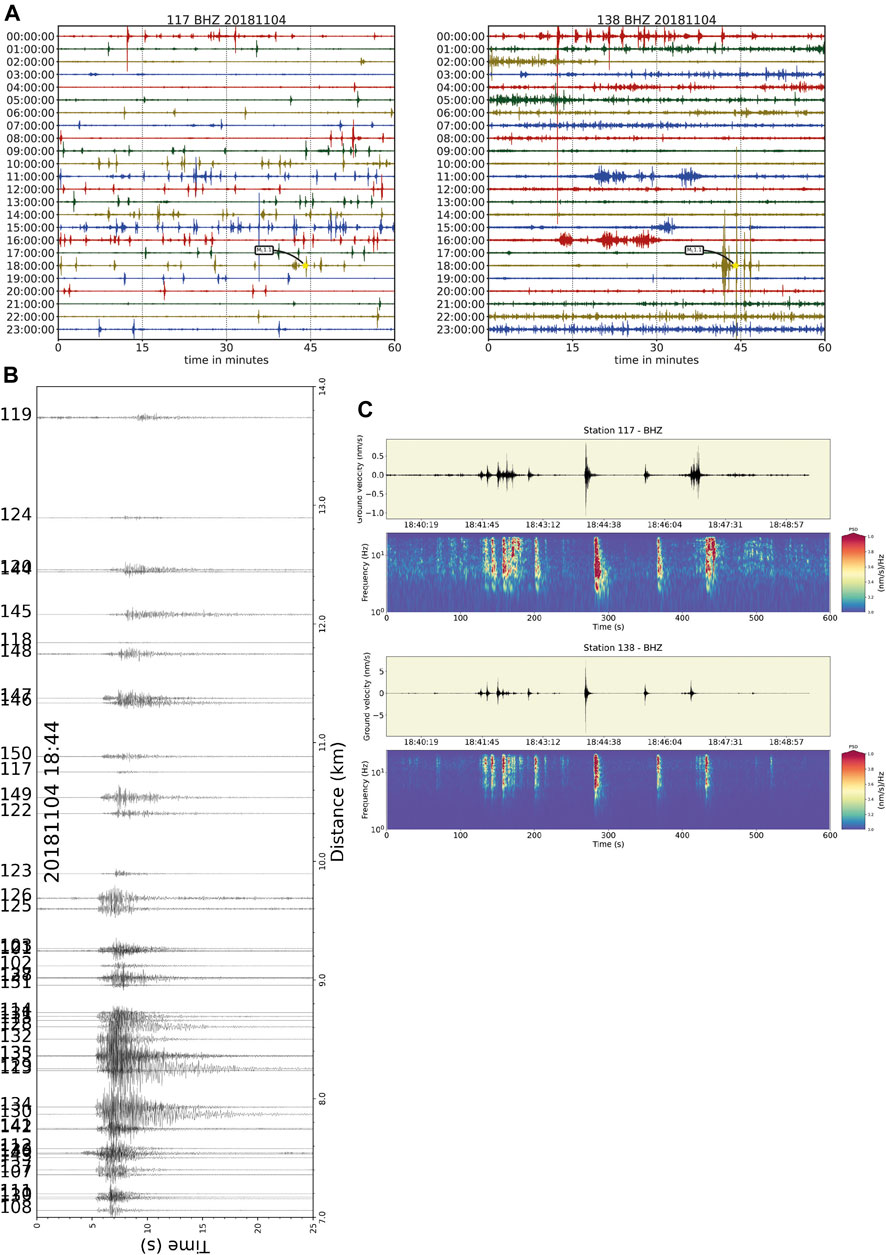
FIGURE 7. (A) Day-plots for 4 November 2018 are shown side by side for stations 117 and 138. The ML1.1 earthquake that occurred at 18:44 UTC southwest of Lipari Island and ∼8 km away from Vulcano is also shown (more details in the text). (B) Record section of the ML1.1 event. Distance scale is exaggerated to improve the visualization. (C) Ground velocities (top of each subplot) and spectrograms (bottom) of the 4 November 2018 event at 117 and 138. Spectrograms are computed using a 2 s window length for the fft with 80% overlap.
We apply a multi-station detection of swarm earthquakes with multiple templates (Figure 8A) to possibly detect other VT signals that occurred closely in time and space. The detector algorithm cross-correlates the data stream with each of the template streams. Defining the similarity as the mean of all cross-correlation functions for each template, if the similarity is above a certain threshold then a detection is triggered. The procedure uses a SciPy function (Virtanen et al., 2020) whose parameters are the cross-correlation threshold, which defines the detection of a new event, and the distance between detections in seconds. These two parameters are fixed to 0.4 and 10 s, respectively. The detection is carried out on the vertical component of the data, band-passed between 3 and 10 Hz for stations located in the hydrothermal area and in western portion of Lipari. In a first run, we use 1 h of data recorded on 4 November from 18:00 UTC when the ML1.1 occurred at 18:44 UTC offshore the western coast of Lipari-Vulcano. Then we also select the event at 18:42:47 UTC since it shows 90% similarity for all stations. Using these two events as templates, we are able to detect the seismic swarm that occurred on 4 November and find the hypocentral locations of those with a similarity above 90%. The automatic detections of the swarm are listed in Supplementary Table S1 (top). Then, we manually picked the ∼580 P and S arrivals at the Lipari array stations as well as at the permanent stations of ILOS and IVPL to build a phase file that is used as input for the Hypoinverse location algorithm (Klein, 2014), along with a 1D velocity model available for the Lipari-Vulcano region (Ventura et al., 1999). Hypocentral locations are shown in Figure 1B (white diamonds) and listed in Supplementary Table S1 (bottom), where ML is estimated using the Hutton and Boore (1987). The occurrence of the seismic swarm on 4 November is also confirmed by the array analysis discussed in the next paragraph.
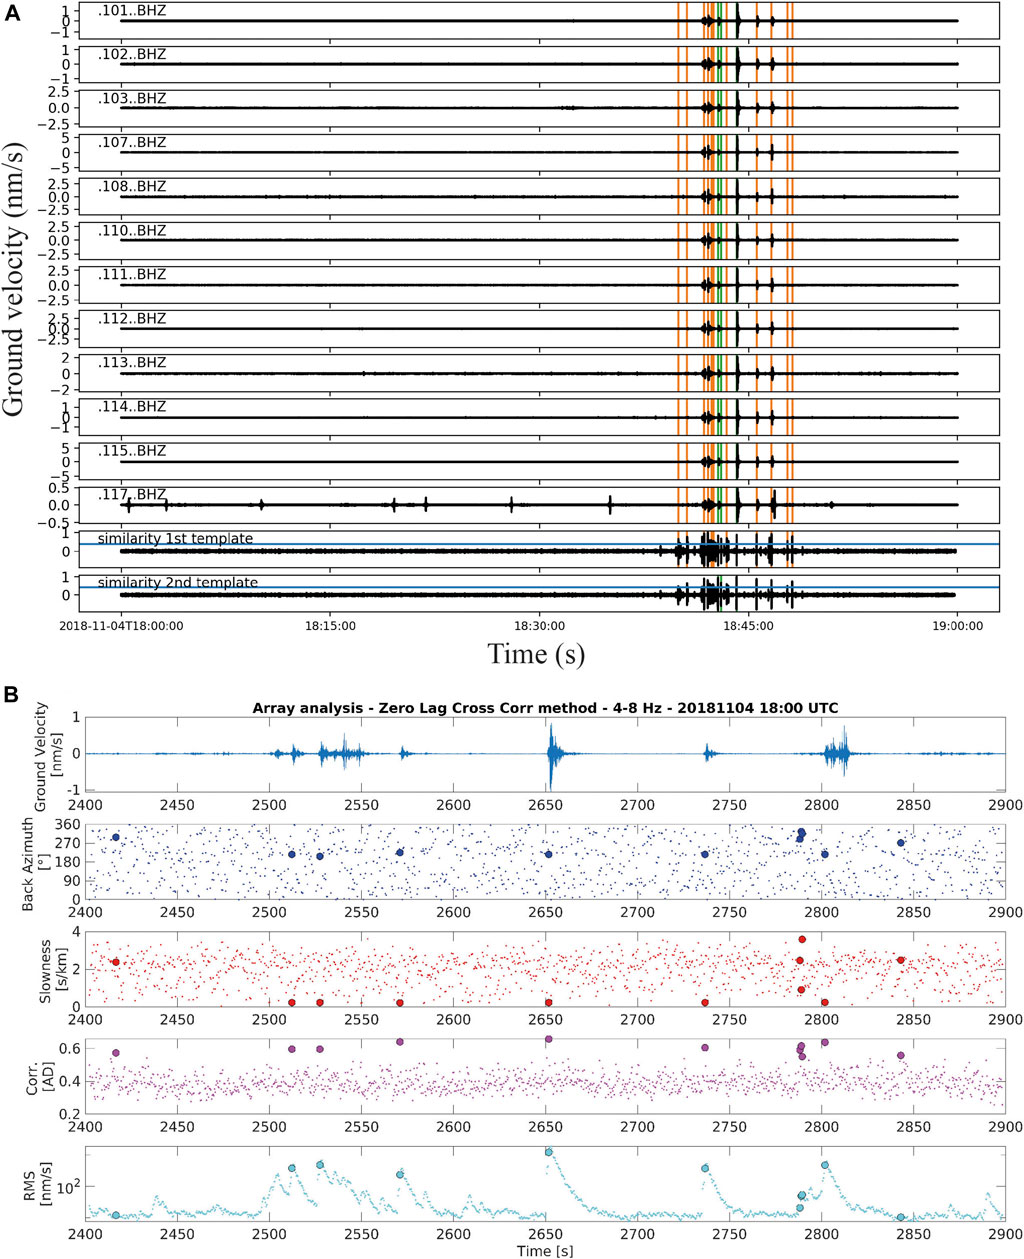
FIGURE 8. (A) Example of the detection algorithm applied to a 1-h record of the vertical component of selected stations. The stations are labeled in the upper left of each panel. The similarity template plots are also shown. The orange and green vertical lines are the beginning and end, respectively, of the detection window, while the blue horizontal line indicates the detection height. (B) Array analysis of the swarm recorded on 4 November 2018 in the time window 18:40–18:48 (top). Back-azimuth, slowness, correlation coefficient and RMS of the data are shown. Larger circles show back-azimuth, slowness and RMS of the data relative to correlation coefficients larger than 0.6.
On 26 October at 02:36 UTC the event shown in Figure 9 was recorded at most stations located in a NNW-SSE aligned area in western Lipari, on the oldest lithologies affected by active hydrothermal processes. We classified this event as a hybrid event because the P phase is clearly picked, whereas the S arrivals cannot be detected. The dominant frequency is ∼5 Hz. Applying the same location procedure used above, we located the 26 October event offshore node 114, ∼2 km west of the hydrothermal field, at very shallow depth (<1 km), which may explain the clear surface waves following the onset of the initial waveform.
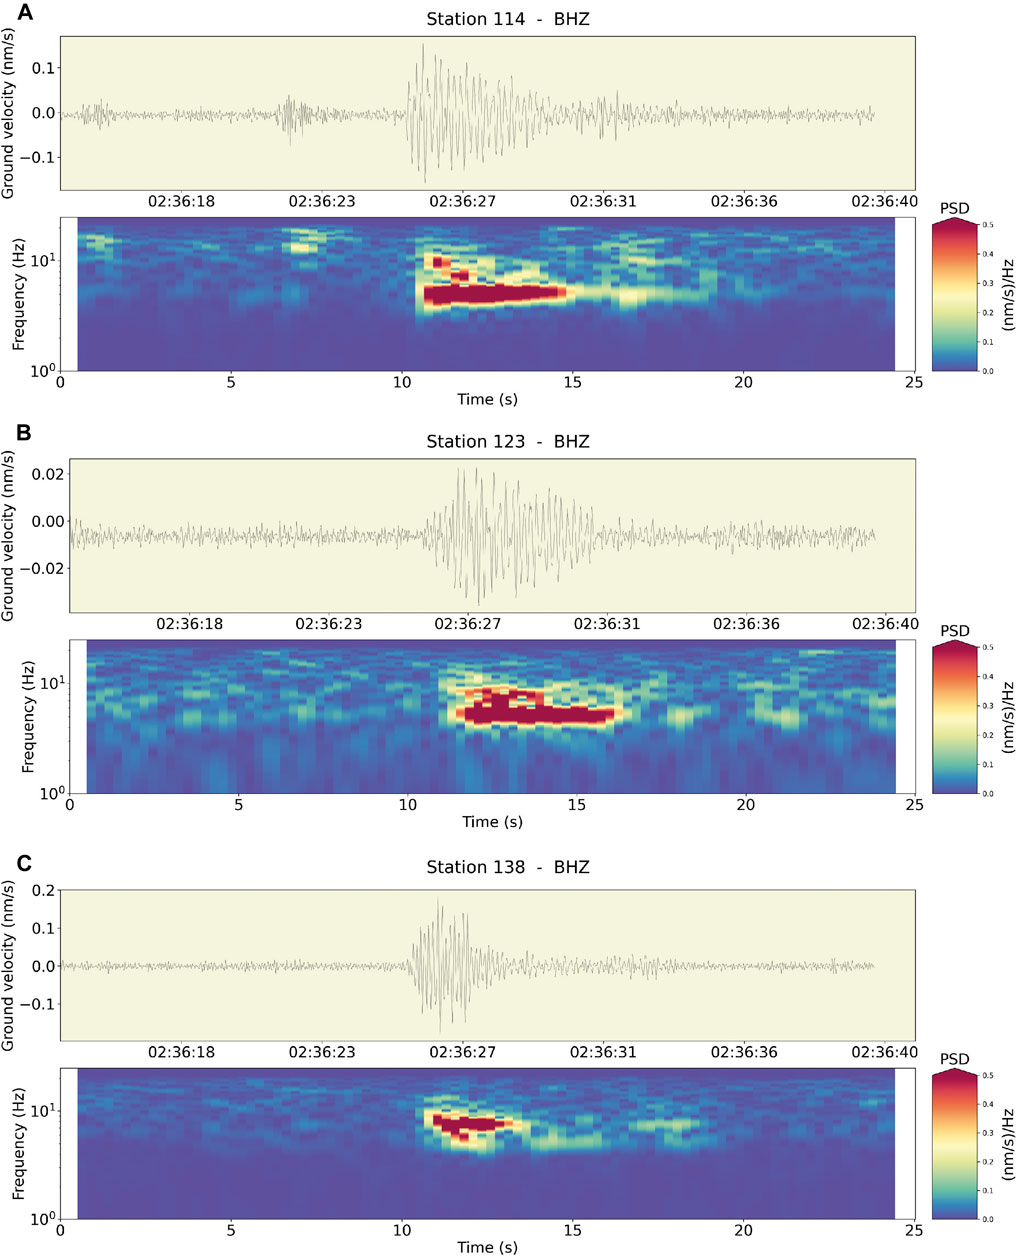
FIGURE 9. Ground velocity waveforms for the 26 October 2018 02:36 UTC event (top) and corresponding spectrograms (bottom) for stations 114, 123 and 138.
Array Analysis
We use seismic array techniques as a tool for detecting, analyzing and locating the complexities of the seismic wavefield in Lipari. The application of array processing methods requires high signal coherence across the array, because the inhomogeneous geology and topography of the sites can produce significant differences in the observed waveforms. The array resolution depends on its geometry, in particular on its aperture. The larger the array aperture the more coherent is the observed signal and the higher is the slowness resolution.
Considering the different types of observed seismic signals discussed above, we applied array analysis techniques in the time (Zero Lag Cross Correlation, ZLCC) and frequency domain (high resolution method, Capon, 1969). The analysis of array data in the frequency domain is a useful tool to highlight coherent signals of small amplitude in well-defined frequency bands originating from one or more sources, which can be identified in terms of slowness and back-azimuth of the propagation field (La Rocca and Galluzzo, 2017). For the application of array techniques, a subset of stations (SUBA) was selected in a restricted area close to the degassing area. SUBA consists of stations 101, 102, 103, 138, 151 and 115.
Time Domain
As described earlier, a small swarm of VT events was identified on November 4, 2018, for which the most energetic seismic event (ML 1.1) was located about 4 km away from the SUBA subarray (southwest direction) at a depth of about 5 km (Supplementary Table S1, bottom). The multichannel analysis technique was applied to 10-min long signals from the events that were filtered in the 6–8 Hz band. Results in Figure 8B show that the signal windows characterized by higher correlation values (cross-correlation > 0.6, indicated by larger circles in the figure) identify back-azimuths in the range [210°, 220°] and slowness of 0.2 s/km. Furthermore, in correspondence of the more correlated signals, the RMS curve (bottom in Figure 8B) shows some relative maxima in amplitude and indicates the presence of transients with amplitudes above the seismic noise.
Frequency Domain
The clustering analysis and the frequency content observed in the day-plots highlight evident anomalies in specific time periods. In particular, as previously noted, 30 October was one of the anomalous days; therefore we investigated the possible presence of coherent tremor in the seismic wavefield. To this aim, a high-resolution array method was applied to the signals of SUBA for the whole day of 30 October at the frequency of 8 Hz. Results in Figure 10 show that where the coherence is larger than 0.6 (larger circles), the propagation vector (back-azimuth and slowness distribution) is not well-defined and therefore the presence of a coherent tremor wavefield generated in the island cannot be proved for this particular day.
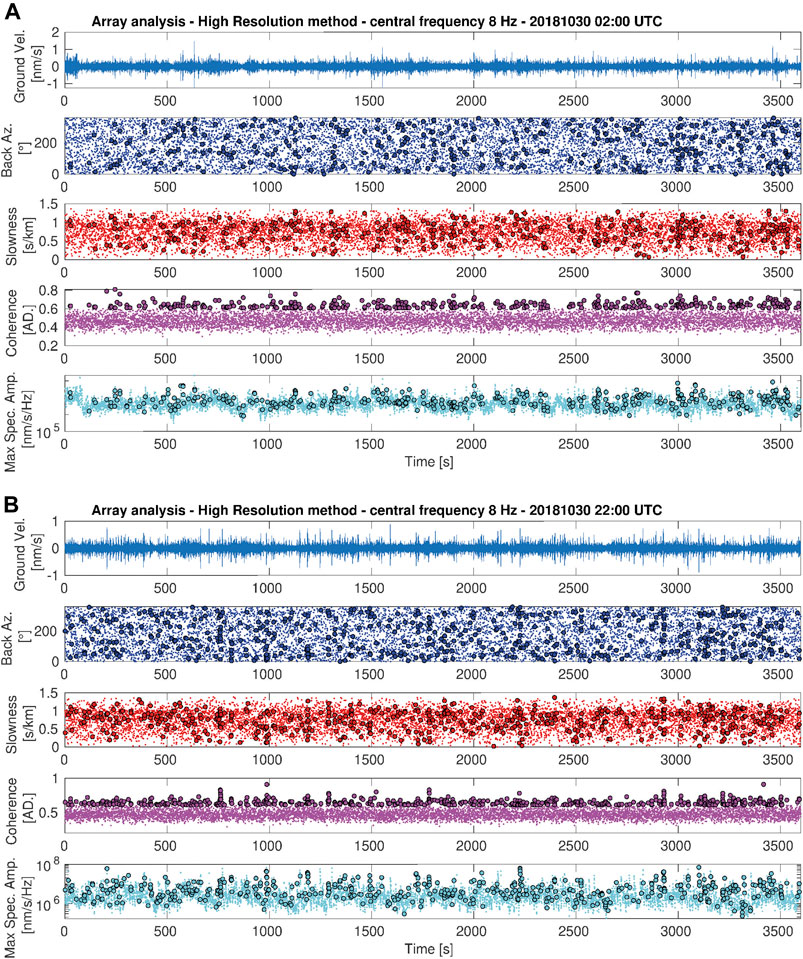
FIGURE 10. High resolution array analysis for 1-h signal at 02:00 UTC (top) and 22:00 UTC (bottom) for 30 October 2018 at the SUBA stations (101, 102, 103, 138, 151 and 115 in Figure 1C). Larger colored circles show back-azimuth, slowness and spectral amplitude values for coherence estimates larger than 0.6.
Discussion and Conclusion
We investigated the seismicity of Lipari Island by using different techniques on a one month dataset recorded by a 48 node array (Di Luccio et al., 2019). We located a seismic swarm that occurred on November 4, 2018 off the western coast of Lipari (Figure 1C) where the volcano-tectonic events define a NE-SW striking rupture zone. According to the structural model of Lipari proposed by Mazzuoli et al. (1995), faults with NE-SW strike represent second-order shears moving in response to the strike-slip movements of the main, NNW-SSE striking ATL shear zone. Swarms with similar characteristics in the frequency and time domains to those detected at Lipari have been observed in other volcanic and hydrothermal areas, such as Nisyros, Greece (Caliro et al., 2005), where both VT and long period events are related to fluid migration caused by the reactivation of pre-existing fractures (Caliro et al., 2005). The occurrence of swarms in other active volcanic and tectonic areas has been related to hydrothermal alteration of rocks weakened by water-rich CO2 solutions. In these weak microfractured zones, swarms can occur by stress accumulation or triggered by pore pressure changes (Heinicke et al., 2009).
The hybrid event that occurred in Lipari on October 26, 2018 has been located near node 114, close to the hydrothermal field (Figure 1C), at very shallow depth (<1 km). This depth corresponds to that of the magnetic bottom below Lipari, where the 500°C isotherm is supposed to be located (De Ritis et al., 2013). Therefore the source mechanism of the October 26, 2018 event could be explained as due to a fluid-filled crack process in agreement with observations in laboratory experiments (Julian, 1994; Fazio et al., 2017), which may account for the distinctive surface waves packet following the onset of the initial waveform. Seismic signals with similar characteristics in time and frequency domains have been recorded in the hydrothermal areas of Vulcano Island, south of Lipari and interpreted as due to fluid migration processes (Alparone et al., 2010). Hybrid earthquakes have been also detected close to the hydrothermal system of Deception Island, related to the local response of the volcanic complex to regional tectonics (Carmona et al., 2012). According to Harrington and Brodsky (2007) shallow events like that of October 26, 2018 at Lipari could be also due to shallow tectonic sources combined with low rupture velocities, without excluding the possible involvement of fluids. We conclude that the shallow Lipari earthquake is associated with the dynamics of the local hydrothermal system and, in particular, with fluid pressurization within pre-existing cracks. Field evidence of such processes in the Lipari hydrothermal area is provided by the occurrence of gypsum-filled cracks formed by the pressurized injection of brine-type fluids along a N-S striking fault zone (Cucci et al., 2017). The shallow depth of the magnetic bottom (De Ritis et al., 2013), the equilibrium temperature of hydrothermal fluids (170–180°C; Cioni et al., 1988) and the active gas emissions from fumaroles suggest the involvement of high temperature fluids.
The increase in seismic noise detected on October 22, 26 and 30 and November 4 and 5 during periods of sea wave heights indicates that Lipari is subjected to shaking during storms. Generally, sea cliffs are zones mainly exposed to the ground motion generated by the direct sea wave impact and nearshore wave period (Adams et al., 2005). During storm events, microcracking episodes can generate microseismic ground displacements that reduce the rock cohesion. This does not occur during periods of normal sea level (Adams et al., 2005; Brain et al., 2014). Such weakening may act as an additional driver to coastal erosion processes, favoring cliff collapse as observed in Southern California (Young et al., 2016). These phenomena are also common on Lipari and mostly affect the eastern coast of the island (https://www.geologidisicilia.it/public/bollettino/pdf/giugno-2016.pdf).
The main conclusions of this study are:
• Lipari is a dynamically active volcanic area as derived from seismological analysis, implying the importance of the systematic survey of the seismic activity and the geochemical monitoring, which can provide useful information for the overall comprehension of the seismic signals. The day plots, cluster analysis and the time evolution of the seismicity in one month of data show that sea wave dynamics, in terms of wave height and frequency of occurrence, causes an increase of the background seismic noise due to the shaking of the island.
• Single frequency and volcano-tectonic events suggest the occurrence of brittle deformation and fluid involvement in the earthquake generation mechanism. Such activity could be explained by the dynamics of the hydrothermal fluids within the NNW-SSE to NE-SW striking deformation belt affecting the western sector of the island. We have shown that seismic swarms, which are common in volcanic and hydrothermal areas, are also a typical feature of the Aeolian Islands. The availability of a dense array allowed us to better constrain the locations of the November 4, 2018 swarm that occurred on a secondary fault of the main NNW-SSE shear zone in the south-western offshore. Thus, we suggest that a dense seismic network operating for a longer time window would give the opportunity to study in detail the seismic wavefield, in terms of its kinematics and dynamics, its correlation with the pre-existing tectonic structures and the interaction with the neighboring Vulcano Island.
Seismological and cluster analyses suggest the coeval action of different processes such as hydrothermal fluid migration, regional tectonics, sea erosion and subsequent cliff instabilities in volcanic islands. In the Southern Tyrrhenian Sea the detailed investigation of seismic signals at the local scale allows us to infer interesting features of the distribution and evolution of the seismicity in one month of recordings. We propose that a monitoring system combining geochemical campaigns, tide gauge and seismic arrays like the one adopted here could contribute to better evaluate the progressive weakening of the rocks and study the steps needed to reduce the hazard related to rock instabilities in coastal areas (Ramalho et al., 2013). In conclusion, integrating measurements from both seismic and geochemical monitoring systems at Lipari will allow for a full investigation of the dynamics affecting the area with direct benefits for hazard evaluation.
Data Availability Statement
The raw data supporting the conclusions of this article will be made available by the authors, without undue reservation.
Author Contributions
FD and PP conceived the study. FD, LC, AE and GV deployed the Lipari array. RWC and PP downloaded the full dataset and generated the 1-h SAC files for the analysis. FD, LC and AE carried out the seismological analysis. RC computed the SOM and cluster analysis. GC computed the automatic evolution of seismic data. DG applied the array techniques to seismic data. FD wrote a preliminary draft of the manuscript, with contributions and suggestions from all authors. All authors contributed to the interpretation and discussion of the results and to the final version of the manuscript.
Funding
This research was supported and funded by the Istituto Nazionale di Geofisica e Vulcanologia, sezione di Roma 1 and partially supported by the Department of Geology and Geophysics of the Louisiana State University. AE was funded by Istituto Nazionale di Geofisica e Vulcanologia, sezione ONT. PP was supported as a 2020-21 fellow of the Radcliffe Institute for Advanced Study at Harvard University. The VSR software development has been funded from EU Horizon 2020 under the Marie Sklodowska-Curie Grant Agreement No. (74249) (VULCAN.ears).
Conflict of Interest
The authors declare that the research was conducted in the absence of any commercial or financial relationships that could be construed as a potential conflict of interest.
Acknowledgments
We thank Comune di Lipari for hosting the experiment; INGV–OE of Catania and Lipari Observatory (L. Pruiti) for the logistical support. We are grateful to R. Vilardo and M. Martinelli of the Polo Museale di Lipari, Regione Sicilia, the Hotel Antea, CO.MARK and Tenuta Castellaro, Alessandro (grocery store) di Acquacalda, for hosting some nodes of the experiment. LSU students R. Ajala and E. McCullison assisted with the deployment setup and preparation of the nodes. FD would like to thank: F. Alves Pereira for his invaluable help in ObsPy (Beyreuther et al., 2010) scripting, M. Palano and L. Scognamiglio, for useful discussions about the tectonics of the southern Tyrrhenian region, and A. Ursino for the list of earthquakes of the Aeolian seismic bulletin for the period October 16th to November 15th, 2018. Seismological analyses have been partially done using ObsPy (Beyreuther et al., 2010). Some figures were done using GMT 6.0 (Wessel et al., 2019). We thank the Guest Associate Editor, JG, LD, an anonymous reviewer and the Chief Editor V. Acocella for useful comments.
Supplementary Material
The Supplementary Material for this article can be found online at: https://www.frontiersin.org/articles/10.3389/feart.2021.678581/full#supplementary-material
References
Adams, P. N., Storlazzi, C. D., and Anderson, R. S. (2005). Nearshore Wave-Induced Cyclical Flexing of Sea Cliffs. J. Geophys. Res. 110, F02002. doi:10.1029/2004JF000217
Allen, R. V. (1978). Automatic Earthquake Recognition and Timing from Single Traces. Bull. Seismol. Soc. Am. 68 (5), 1521–1532.
Alparone, S., Bonforte, A., Gambino, S., Guglielmino, F., Obrizzo, F., and Velardita, R. (2019). Dynamics of Vulcano Island (Tyrrhenian Sea, Italy) Investigated by Long-Term (40 Years) Geophysical Data. Earth-Science Rev. 190, 521–535. doi:10.1016/j.earscirev.2019.01.002,
Alparone, S., Cannata, A., Gambino, S., Gresta, S., Milluzzo, V., and Montalto, P. (2010). Time-space Variation of Volcano-Seismic Events at La Fossa (Vulcano, Aeolian Islands, Italy): New Insights into Seismic Sources in a Hydrothermal System. Bull. Volcanol. 72 (7), 803–816. doi:10.1007/s00445-010-0367-6
Anzidei, M., Bosman, A., Carluccio, R., Casalbore, D., D'Ajello Caracciolo, F., Esposito, A., et al. (2017). Flooding Scenarios Due to Land Subsidence and Sea-Level Rise: a Case Study for Lipari Island (Italy). Terra Nova 29 (1), 44–51. doi:10.1111/ter.12246
Anzidei, M., Bosman, A., Casalbore, D., Tusa, S., and La Rocca, R. (2016). New Insights on the Subsidence of Lipari Island (Aeolian Islands, Southern Italy) from the Submerged Roman Age Pier at Marina Lunga. Quat. Int. 401, 162–173. doi:10.1016/j.quaint.2015.07.003
Argnani, A., Serpelloni, E., and Bonazzi, C. (2007). Pattern of Deformation Around the central Aeolian Islands: Evidence from Multichannel Seismics and GPS Data. Terra Nova 19, 317–323. doi:10.1111/j.1365-3121.2007.00753.x
Bean, C. J., De Barros, L., Lokmer, I., Métaxian, J.-P., O’Brien, G., and Murphy, S. (2014). Long-period Seismicity in the Shallow Volcanic Edifice Formed from Slow-Rupture Earthquakes. Nat. Geosci. 7, 71–75. doi:10.1038/ngeo2027
Beyreuther, M., Barsch, R., Krischer, L., Megies, T., Behr, Y., and Wassermann, J. (2010). ObsPy: A Python Toolbox for Seismology. Seismological Res. Lett. 81 (3), 530–533. doi:10.1785/gssrl.81.3.530
Billi, A., Barberi, G., Faccenna, C., Neri, G., Pepe, F., and Sulli, A. (2006). Tectonics and Seismicity of the Tindari Fault System, Southern Italy: Crustal Deformations at the Transition between Ongoing Contractional and Extensional Domains Located above the Edge of a Subducting Slab. Tectonics 25, a–n. doi:10.1029/2004TC001763
Bonaccorso, A. (2002). Ground Deformation of the Southern Sector of the Aeolian Islands Volcanicarc from Geodetic Data. Tectonophysics 351, 181–192. doi:10.1016/S0040-1951(02)00163-4
Bortoluzzi, G., Ligi, M., Romagnoli, C., Cocchi, L., Casalbore, D., Sgroi, T., et al. (2010). Interactions between Volcanism and Tectonics in the Western Aeolian Sector, Southern Tyrrhenian Sea. Geophys. J. Int. 183, 64–78. doi:10.1111/j.1365-246X.2010.04729.x
Brain, M. J., Rosser, N. J., Norman, E. C., and Petley, D. N. (2014). Are Microseismic Ground Displacements a Significant Geomorphic Agent?. Geomorphology 207, 161–173. doi:10.1016/j.geomorph.2013.11.002
Bruno, P. P. G., Paoletti, V., Grimaldi, M., and Rapolla, A. (2000). Geophysical Exploration for Geothermal Low Enthalpy Resources in Lipari Island. Italy. J. Volcanol. Geotherm. Res. 98 (1-4), 173–188. doi:10.1016/s0377-0273(99)00183-3
Caliro, S., Chiodini, G., Galluzzo, D., Granieri, D., La Rocca, M., Saccorotti, G., et al. (2005). Recent Activity of Nisyros Volcano (Greece) Inferred from Structural, Geochemical and Seismological Data. Bull. Volcanol. 67, 358–369. doi:10.1007/s00445-004-0381-7
Calò, M., Parisi, L., and Luzio, D. (2013). Lithospheric P- and S-Wave Velocity Models of the Sicilian Area Using WAM Tomography: Procedure and Assessments. Geophys. J. Int. 195, 625–649. doi:10.1093/gji/ggt252
Camarda, M., De Gregorio, S., Di Martino, R. M. R., and Favara, R. (2016). Temporal and Spatial Correlations between Soil CO2 Flux and Crustal Stress. J. Geophys. Res. Solid Earth 121, 7071–7085. doi:10.1002/2016JB013297
Capon, J. (1969). High-resolution Frequency-Wavenumber Spectrum Analysis. Proc. IEEE 57, 1408–1418. doi:10.1109/PROC1969.727810.1109/proc.1969.7278
Carmona, E., Almendros, J., Martín, R., Cortés, G., Alguacil, G., Moreno, J., et al. (2014). Advances in Seismic Monitoring at Deception Island Volcano (Antarctica) since the International Polar Year. Ann. Geophys. 57, 3. doi:10.4401/ag-6378
Carmona, E., Almendros, J., Serrano, I., Stich, D., and Ibáñez, J. M. (2012). Results of Seismic Monitoring Surveys at Deception Island Volcano (Antarctica), from 1999-2011. Antarctic Sci. 24, 485–499. doi:10.1017/s0954102012000314
Carniel, R. (2010). Comments on the Paper ‘Automatic Detection and Discrimination of Volcanic Tremors and Tectonic Earthquakes: An Application to Ambrym Volcano, Vanuatu’ by Daniel Rouland, Denis Legrand, Mikhail Zhizhin and Sylvie Vergniolle. J. Volcanol. Geotherm. Res. 181 (1-3), 61–62. doi:10.1016/j.jvolgeores.2009.05.009
Carniel, R., Barbui, L., and Jolly, A. D. (2013a). Detecting Dynamical Regimes by Self-Organizing Map (SOM) Analysis: An Example from the March 2006 Phreatic Eruption at Raoul Island, New Zealand Kermadec Arc. Boll. Geofis. Teor. Appl. 54 (1), 39–52. doi:10.4430/bgta0077
Carniel, R. (2014). Characterization of Volcanic Regimes and Identification of Significant Transitions Using Geophysical Data: a Review. Bull. Volcanol. 76, 848. doi:10.1007/s00445-014-0848-0
Carniel, R., Jolly, A. D., and Barbui, L. (2013b). Analysis of Phreatic Events at Ruapehu Volcano, New Zealand Using a New SOM Approach. J. Volcanology Geothermal Res. 254, 69–79. doi:10.1016/j.jvolgeores.2012.12.026
Carniel, R., and Raquel Guzmán, S. (2021). “Machine Learning in Volcanology: A Review,” in Volcanoes, Update in Volcanology. Editor K. Nemeth. London: IntechOpen doi:10.5772/intechopen.94217
Carniel, R., and Tárraga, M. (2006). Can Tectonic Events Change Volcanic Tremor at Stromboli? Geophys. Res. Lett. 33, 20. doi:10.1029/2006GL027690
Chouet, B. A., and Matoza, R. S. (2013). A Multi-Decadal View of Seismic Methods for Detecting Precursors of Magma Movement and Eruption. J. Volcanology Geothermal Res. 252, 108–175. doi:10.1016/j.jvolgeores.2012.11.013
Cintorrino, A. A., Palano, M., and Viccaro, M. (2019). Magmatic and Tectonic Sources at Vulcano (Aeolian Islands, SouthernItaly): A Geodetic Model Based on Two Decades of GPS Observations. J. Volcanol. Geoth. Res. 388, 106689. doi:10.1016/j.volgeores.2019.106689
Cioni, R., Corazza, E., Magro, G., Guidi, M., and Marini, L. (1988). Reactive and Inert Gases in Low Temperature Fumaroles (Aeolian Islands, Italy). Rendiconti Societa Italiana di Mineralogia e Petrologia 43, 1003–1011.
Cortés, G., Arambula, R., Gutiérrez, L., Benítez, C., Ibáñez, J., Lesage, P., et al. (2009). Evaluating Robustness of a HMM-Based Classification System of Volcano-Seismic Events at Colima and Popocatepetl Volcanoes. IEEE Int. IGARSS 2, 1012–1015. doi:10.1109/IGARSS.2009.5418275
Cortés, G., Carniel, R., Ángeles Mendoza, M., and Lesage, P. (2019). Standardization of Noisy Volcanoseismic Waveforms as a Key Step toward Station‐Independent, Robust Automatic Recognition. Seismological Res. Lett. 90 (2A), 581–590. doi:10.1785/0220180334
Cortés, G., Carniel, R., Lesage, P., Mendoza, M. Á., and Della Lucia, I. (2021). Practical Volcano-independent Recognition of Seismic Events: VULCAN.Ears Project. Front. Earth Sci. 8, 702. doi:10.3389/feart.2020.616676
Cucci, L., Di Luccio, F., Esposito, A., and Ventura, G. (2017). Vein Networks in Hydrothermal Systems Provide Constraints for the Monitoring of Active Volcanoes. Sci. Rep. 7, 146. doi:10.1038/s41598-017-00230-8
Cultrera, F., Barreca, G., Ferranti, L., Monaco, C., Pepe, F., Passaro, S., et al. (2017). Structural Architecture and Active Deformation Pattern in the Northern Sector of the Aeolian-Tindari-Letojanni Fault System (SE Tyrrhenian Sea-NE Sicily) from Integrated Analysis of Field, marine Geophysical, Seismological and Geodetic Data. Int. J. Gastroentol. 136, 399–417. doi:10.3301/IJG.2016.17
De Astis, G., Ventura, G., and Vilardo, G. (2003). Geodynamic Significance of the Aeolian Volcanism (Southern Tyrrhenian Sea, Italy) in Light of Structural, Seismological, and Geochemical Data. Tectonics 22, a–n. doi:10.1029/2003TC001506
De Ritis, R., Ravat, D., Ventura, G., and Chiappini, M. (2013). Curie Isotherm Depth from Aeromagnetic Data Constraining Shallow Heat Source Depths in the central Aeolian Ridge (Southern Tyrrhenian Sea, Italy). Bull. Volcanol. 75. doi:10.1007/s00445-013-0710-9
Di Luccio, F., Persaud, P., Cucci, L., Esposito, A., Ventura, G., and Clayton, R. (2019). Seismic Sensors Probe Lipari's Underground Plumbing. Eos 100 (July 15, 2019). doi:10.1029/2019EO125333
Eiler, J. (2003). Inside the Subduction Factory. Geophys. Monogr. Ser. 138 311 Washington, D. C.: AGU. doi:10.1029/GM138
Esposito, A., Pietrantonio, G., Bruno, V., Anzidei, M., Bonforte, A., Guglielmino, F., et al. (2015). Eighteen Years of GPS Surveys in the Aeolian Islands (Southern Italy): Open Data Archive and Velocity Field. Ann. Geophys 58, S0439. doi:10.4401/ag-6823
Favalli, M., Karárson, D., Mazzuoli, R., Pareschi, M. T., and Ventura, G. (2005). Volcanic Geomorphology and Tectonics of the Aeolian Archipelago (Southern Italy) Based on Integrated DEM Data. Bull. Volcanol. 68, 157–170. doi:10.1007/s00445-005-0429-310.1007/s00445-005-0011-z
Fazio, M., Benson, P. M., and Vinciguerra, S. (2017). On the Generation Mechanisms of Fluid‐driven Seismic Signals Related to Volcano‐tectonics. Geophys. Res. Lett. 44, 734–742. doi:10.1002/2016GL070919
Forni, F., Lucchi, F., Peccerillo, A., Tranne, C. A., Rossi, P. L., and Frezzotti, M. L. (2013). “Chapter 10 Stratigraphy and Geological Evolution of the Lipari Volcanic Complex (central Aeolian Archipelago),” in The Aeolian Islands Volcanoes. Editors F. Lucchi, A. Peccerillo, J. Keller, C. A. Tranne, and P. L. Rossi (London: Geol. Soc. London, Memoirs), 37, 213–279. doi:10.1144/M37.210.1144/m37.10
Galluzzo, D., Nardone, L., La Rocca, M., Esposito, A. M., Di Maio, R., et al. (2020). Statistical Moments of Power Spectrum: a Fast Tool for the Classification of Seismic Events Recorded on Volcanoes. Adv. Geosci. 52, 67–74. doi:10.5194/adgeo-52-67-2020
Govers, R., and Wortel, M. J. R. (2005). Lithosphere Tearing at STEP Faults: Response to Edges of Subduction Zones. Earth Planet. Sci. Lett. 236 (1), 505–523. doi:10.1016/j.epsl.2005.03.022
Gruppo Analisi Dati Sismici (2021). Catalogo dei terremoti della Sicilia Orientale - Calabria Meridionale (1999-2021). Catania: INGV. Available at: http://sismoweb.ct.ingv.it/maps/eq_maps/sicily/catalogue.php.
Harrington, R. M., and Brodsky, E. E. (2007). Volcanic Hybrid Earthquakes that Are Brittle-Failure Events. Geophys. Res. Lett. 34, L06308. doi:10.1029/2006GL028714
Heinicke, J., Gaupp, R., Götze, J., Koch, U., Konietzky, H., et al. (2009). Hydrothermal Alteration as a Trigger Mechanism for Earthquake Swarms: the Vogtland/NW Bohemia Region as a Case Study. Geophys. J. Int. 178, 1–13. doi:10.1111/j.1365-246X.2009.04138.x
Hutton, J., and Boore, M. (1987). The ML Scale in Southern California. Bull. Seismol. Soc. Am. 77, 2074–2094.
Iverson, R. M. (2008). Dynamics of Seismogenic Volcanic Extrusion Resisted by a Solid Surface Plug, Mount St. Helens, 2004-2005 ” US Geol. Surv. Prof. Pap. 1750, 425–460. doi:10.3133/pp175021
Jaquet, O., and Carniel, R. (2003). Multivariate Stochastic Modelling: towards Forecasts of Paroxysmal Phases at Stromboli. J. Volcanology Geothermal Res. 128, 261–271. doi:10.1016/s0377-0273(03)00259-2
Jaquet, O., Sparks, R. S. J., and Carniel, R. (2006). “Magma Memory Recorded by Statistics of Volcanic Explosions at the Soufrière Hills Volcano, Montserrat,” in Statistics in Volcanology. Special Publications of IAVCEI. Editors H. M. Mader, S. G. Coles, C. B. Connor, and L. J. Connor (London: Geological Society), 1, 175–184.
Jolly, A. D., Jousset, P., Lyons, J. J., Carniel, R., Fournier, N., Fry, B., et al. (2014). Seismo-acoustic Evidence for an Avalanche Driven Phreatic Eruption through a Beheaded Hydrothermal System: an Example from the 2012 Tongariro Eruption. J. Volcanology Geothermal Res. 286, 331–347. doi:10.1016/j.jvolgeores.2014.04.007
Julian, B. R. (1994). Volcanic Tremor: Nonlinear Excitation by Fluid Flow. J. Geophys. Res. 99, 11859–11877. doi:10.1029/93JB03129
Klein, F. W. (2014). User’s Guide to HYPOINVERSE-2000, a FORTRAN Program to Solve for Earthquake Locations and Magnitudes (Open File Report 02-171. Menlo Park, CA: U.S. Geological Survey.
Kramer, S. L. (1996). Geotechnical Earthquake Engineering. Upper Saddle River: PrenticeHall Civil Engineering and Engineering Mechanics Series, 653.
La Rocca, M., and Galluzzo, D. (2017). Detection of Volcanic Earthquakes and Tremor in Campi Flegrei. Bull. Geofis. Teor. Appl. 58, 303–312. doi:10.4430/bgta0201
Lahr, J. C., Chouet, B. A., Stephens, C. D., Power, J. A., and Page, R. A. (1994). Earthquake Classification, Location, and Error Analysis in a Volcanic Environment: Implications for the Magmatic System of the 1989-1990 Eruptions at Redoubt Volcano, Alaska. J. Volcanology Geothermal Res. 62, 137–151. doi:10.1016/0377-0273(94)90031-0
Lengliné, O., Duputel, Z., and Ferrazzini, V. (2016). Uncovering the hidden signature of a magmatic recharge at Piton de la Fournaise volcano using small earthquakes. Geophys. Res. Lett. 43, 4255–4262. doi:10.1002/2016GL068383
Malfante, M., Dalla Mura, M., Métaxian, J.-P., Mars, J. I., Macedo, O., and Inza, A. (2018). Machine Learning for Volcano-Seismic Signals: Challenges and Perspectives. IEEE Signal. Process. Mag. 35 (2), 20–30. doi:10.1109/MSP.2017.2779166
Matoza, R. S., Chouet, B. A., Dawson, P. B., Shearer, P. M., Haney, M. M., Waite, G. P., et al. (2015). Source Mechanism of Small Long‐period Events at Mount St. Helens in July 2005 Using Template Matching, Phase‐weighted Stacking, and Full‐waveform Inversion. J. Geophys. Res. Solid Earth 120, 6351–6364. doi:10.1002/2015JB012279
Mattia, M., Palano, M., Bruno, V., Cannavò, F., Bonaccorso, A., and Gresta, S. (2008). Tectonic Features of the Lipari-Vulcano Complex (Aeolian Archipelago, Italy) from 10 Years (1996-2006) of GPS Data. Terra Nova. 20, 370–377. doi:10.1111/j.1365-3121.2008.00830.x
Mazzuoli, R., Tortorici, L., and Ventura, G. (1995). Oblique Rifting in Salina, Lipari and Vulcano Islands (Aeolian Islands, Southern Italy). Terra Nova 7, 444–452. doi:10.1111/j.1365-3121.1995.tb00540.x
Messina, A., and Langer, H. (2011). Pattern Recognition of Volcanic Tremor Data on Mt. Etna (Italy) with KKAnalysis-A Software Program for Unsupervised Classification. Comput. Geosciences 37 (7), 953–961. doi:10.1016/j.cageo.2011.03.015
Milano, G., Vilardo, G., and Luongo, G. (1994). Continental Collision and basin Opening in Southern Italy: a New Plate Subduction in the Tyrrhenian Sea?. Tectonophysics 230 (3-4), 249–264. doi:10.1016/0040-1951(94)90139-2
Molina, I., Kumagai, H., Yepes, H., and Moosavi, V. (2004). Resonances of a Volcanic Conduit Triggered by Repetitive Injections of an Ash-Laden gasComputing with Contextual Numbers. Geophys. Res. Lett.J. Machine Learn. Res. 31, L03603. doi:10.1007/978-3-642-56927-2
Ohminato, T. (2006). Characteristics and Source Modeling of Broadband Seismic Signals Associated with the Hydrothermal System at Satsuma-Iwojima Volcano, Japan. J. Volcanology Geothermal Res. 158, 467–490. doi:10.1016/j.jvolgeores.2006.08.004
Palano, M., Ferranti, L., Monaco, C., Mattia, M., Aloisi, M., Bruno, V., et al. (2012). GPS Velocity and Strain fields in Sicily and Southern Calabria, Italy: Updated Geodetic Constraints on Tectonic Block Interaction in the central Mediterranean. J. Geophys. Res. 117, a–n. doi:10.1029/2012JB009254
Palano, M., Schiavone, D., Loddo, M., Neri, M., Presti, D., Quarto, R., et al. (2015). Active Upper Crust Deformation Pattern along the Southern Edge of the Tyrrhenian Subduction Zone (NE Sicily): Insights from a Multidisciplinary Approach. Tectonophysics 657, 205–218. doi:10.1016/j.tecto.2015.07.005
Passarelli, L., Heryandoko, N., Cesca, S., Rivalta, E., Rasmid, S., Rohadi, S., et al. (2018). Magmatic or Not Magmatic? the 2015-2016 Seismic Swarm at the Long-Dormant Jailolo Volcano, West Halmahera, Indonesia. Front. Earth Sci. 6, 79. doi:10.3389/feart.2018.00079
Peng, Z., and Zhao, P. (2009). Migration of Early Aftershocks Following the 2004 Parkfield Earthquake. Nat. Geosci. 2 (12), 877–881. doi:10.1038/NGEO697
Ramalho, R. S., Quartau, R., Trenhaile, A. S., Mitchell, N. C., Woodroffe, C. D., and Ávila, S. P. (2013). Coastal Evolution on Volcanic Oceanic Islands: A Complex Interplay between Volcanism, Erosion, Sedimentation, Sea-Level Change and Biogenic Production. Earth-Science Rev. 127, 140–170. doi:10.1016/j.earscirev.2013.10.007
Ruch, J., Vezzoli, L., De Rosa, R., Di Lorenzo, R., and Acocella, V. (2016). Magmatic Control along a Strike-Slip Volcanic Arc: the central Aeolian Arc (Italy). Tectonics 35, 407–424. doi:10.1002/2015tc004060
Ryan, W. B. F., Carbotte, S. M., Coplan, J. O., O'Hara, S., Melkonian, A., Arko, R., et al. (2009). Global Multi-Resolution Topography Synthesis. Geochem. Geophys. Geosyst. 10, a–n. doi:10.1029/2008GC002332
Scarfì, L., Barberi, G., Barreca, G., Cannavò, F., Koulakov, I., and Patanè, D. (2018). Slab Narrowing in the Central Mediterranean: the Calabro-Ionian Subduction Zone as Imaged by High Resolution Seismic Tomography. Sci. Rep. 8, 5178. doi:10.1038/s41598-018-23543-8
Seydoux, L., Balestriero, R., Poli, P., Hoop, M. d., Campillo, M., and Baraniuk, R. (2020). Clustering Earthquake Signals and Background Noises in Continuous Seismic Data with Unsupervised Deep Learning. Nat. Commun. 11 (1), 1–12. doi:10.1038/s41467-020-17841-x
Trnkoczy, A. (2002). “Understanding and Parameter Setting of STA/LTA Trigger Algorithm,” in IASPEI New Manual of Seismological Observatory Practice. Editor P. Bormann (Potsdam: Deutsches GeoForschungsZentrum GFZ), 2, 01–20. Available at: https://gfzpublic.gfz-potsdam.de/pubman/item/item_43337.
Ventura, G., Lucchi, F., Peccerillo, A., Keller, J., Tranne, C. A., and Rossi, P. L. (2013). Kinematics of the Aeolian Volcanism (Southern Tyrrhenian Sea) from Geophysical and Geological Data. ” in The Aeolian Islands Volcanoes, Editors F. Lucchi, A. Peccerillo, J. Keller, C. A. Tranne, and P. L. Rossi (London: Geological Society) 37, 3–11. doi:10.1144/M37.2
Ventura, G., Vilardo, G., Milano, G., and Pino, N. A. (1999). Relationships Among Crustal Structure, Volcanism and Strike-Slip Tectonics in the Lipari-Vulcano Volcanic Complex (Aeolian Islands, Southern Tyrrhenian Sea, Italy). Phys. Earth Planet. Interiors 116, 31–52. doi:10.1016/s0031-9201(99)00117-x
Virtanen, P., Gommers, R., Gommers, R., Oliphant, T. E., Haberland, M., Reddy, T., et al. (2020). SciPy 1.0: Fundamental Algorithms for Scientific Computing in Python. Nat. Methods 17, 261–272. doi:10.1038/s41592-019-0686-2
Wessel, P., Luis, J. F., Uieda, L., Scharroo, R., Wobbe, F., Smith, W. H. F., et al. (2019). The Generic Mapping Tools Version 6. Geochem. Geophys. Geosyst. 20, 5556–5564. doi:10.1029/2019GC008515
Keywords: seismic array, active volcanoes, hydrothermal system, volcano-tectonics, machine learning
Citation: Di Luccio F, Persaud P, Cucci L, Esposito A, Carniel R, Cortés G, Galluzzo D, Clayton RW and Ventura G (2021) The Seismicity of Lipari, Aeolian Islands (Italy) From One-Month Recording of the LIPARI Array. Front. Earth Sci. 9:678581. doi: 10.3389/feart.2021.678581
Received: 09 March 2021; Accepted: 30 June 2021;
Published: 21 July 2021.
Edited by:
Jo Gottsmann, University of Bristol, United KingdomReviewed by:
Chris Bean, Dublin Institute for Advanced Studies (DIAS), IrelandLuca De Siena, Johannes Gutenberg University Mainz, Germany
Copyright © 2021 Di Luccio, Persaud, Cucci, Esposito, Carniel, Cortés, Galluzzo, Clayton and Ventura. This is an open-access article distributed under the terms of the Creative Commons Attribution License (CC BY). The use, distribution or reproduction in other forums is permitted, provided the original author(s) and the copyright owner(s) are credited and that the original publication in this journal is cited, in accordance with accepted academic practice. No use, distribution or reproduction is permitted which does not comply with these terms.
*Correspondence: Francesca Di Luccio, ZnJhbmNlc2NhLmRpbHVjY2lvQGluZ3YuaXQ=