 Simone Colucci
 Paolo Papale
- Istituto Nazionale di Geofisica e Vulcanologia, Sezione di Pisa, Pisa, Italy
Explosive eruptions are the surface manifestation of dynamics that involve transfer of magma from the underground regions of magma accumulation. Evidence of the involvement of compositionally different magmas from different reservoirs is continuously increasing to countless cases. Yet, models of eruption dynamics consider only the uppermost portion of the plumbing system, neglecting connections to deeper regions of magma storage. Here we show that the extent and efficiency of the interconnections between different magma storage regions largely control the size of the eruptions, their evolution, the causes of their termination, and ultimately their impact on the surrounding environment. Our numerical simulations first reproduce the magnitude-intensity relationship observed for explosive eruptions on Earth and explain the observed variable evolutions of eruption mass flow rates. Because deep magmatic interconnections are largely inaccessible to present-day imaging capabilities, our results motivate the need to better image and characterize extant magma bodies.
1 Introduction
Volcanic eruptions are the surface manifestation of complex dynamics in underground systems involving one or more magma chambers, their interconnecting dykes, the surrounding rocks and aquifers, and the conduit or dyke connecting the shallow reservoir to the surface. With the exception of the volcanic crater region, the flow conditions are subsonic everywhere in the underground system, implying that any process or disturbance anywhere in the fluid system propagates both downflow and upflow, influencing the dynamics in the entire system. As a consequence, the existence and activation of multiple magmatic reservoirs during volcanic eruptions cannot be neglected without losing substantial knowledge and understanding. The occurrence of an explosive eruption as a consequence of new injections of magma into a shallow chamber has been proposed at several volcanoes worldwide (e.g., Askja, Sparks et al. (1977); Piñatubo, Pallister et al. (1992); Krakatau, Mandeville et al. (1996); Mount Ranier, Venezky and Rutherford (1997); SoufriereHills, Murphy et al. (2000); El Chichon, Tepley et al. (2000); Nevado del Ruiz, Stix et al. (2003); St. Helens, Waite and Moran (2009); Tungurahua, Samaniego et al. (2011); Eyjafjallajkull, Keiding and Sigmarsson (2012); Etna, Bonaccorso et al. (2014); Sakurajima, Araya et al. (2019)). At Mount St. Helens, a P-wave velocity model based on local earthquake data images a low-velocity zone located beneath the edifice, between about 2 and 3.5 km below sea level, that is interpreted as a shallow magma storage zone; low velocities between about 5.5 and 8 km are, instead, modeled as the location of a large magma storage volume (Waite and Moran, 2009). At Nevado del Ruiz, Londoño and Kumagai (2018) infer from 4D seismic tomography a magma chamber at 2–3 km depth, refilled by a larger magma source at 7–8 km depth. At Piñatubo, Pallister et al. (1992) report evidence for the mixing of basaltic and dacitic magmas shortly before the Plinian eruption on June 15, 1991, suggesting that the injection of basaltic magma into the base of a magma chamber might have triggered the eruption. Similar pre-sin-eruptive injections by deep magma into a shallow reservoir, and consequent magma mixing, are described for many calderic and post-calderic eruptions at Campi Flegrei (Di Renzo et al., 2011). The 39 ka caldera-forming Campanian Ignimbrite eruption, Campi Flegrei, is described as originating from a 6 km deep large magma chamber connected to shallow, 2–3 km deep, partially degassed “magma apophysis” from which the eruption initially took place (Marianelli et al., 2006). The November 23, 2013 violent explosive lava fountain eruption at Mount Etna volcano confirmed the existence of a relatively small source region located at sea level (about 3 km depth), where a volume of magma, allowed to accumulate before erupting, was invaded by more primitive, fast rising magma resulting in pressurization and subsequent lava fountaining (Bonaccorso et al., 2014).
In spite of widespread evidence suggesting the activation of multiple reservoirs during volcanic eruptions, physical models often attempt to explain the eruption dynamics by referring to just one magma chamber hosting a given magma type, progressively emptied during the eruption (e.g., Bower and Woods (1998); Folch and Martí (1998); Martí et al. (2000); Macedonio et al. (2005); Folch and Martí (2009); Colucci et al. (2014)). In all such cases, pressure decrease upon magma extraction is invariably computed, terminating the eruption when the magmatic pressure drops below the local lithostatic pressure by an amount dictated by rock tensile strength, at which conditions rock failure is assumed to occur. A volcanic eruption in such a set up is relatively simple: the eruption intensity (or mass flow-rate) invariably decreases with time; the larger the magma chamber, the longer the eruption, and the larger the mass of discharged magma. With such an approach, Bower and Woods (1998), for example, find a two orders of magnitude increase in the erupted magma volume when the chamber volume is also increased by two orders of magnitude. More recently, Melnik and Costa (2014) explored the long-term (years) dynamics of a system made of two magma chambers connected each other by a dyke and connected to the Earth surface through a conduit: the study shows a cyclic behavior dependent on influx rate, volume, shape and degree of connectivity of the two reservoirs. Reverso et al. (2014) develop an analytic model for the long-term dynamics of two connected magma chambers surrounded by an elastic medium and fed by a constant basal magma inflow, modeling the magma during the ascent as an incompressible fluid.
In this work we investigate, through a global sensitivity analysis, the short-term (from hours to weeks) eruptive dynamics for a plumbing system characterized by a deep large reservoir hosting andesitic magma, connected to a shallow dacitic magma chamber. The available data on real eruption intensity and magnitude mostly involve these compositions, or others very similar belonging to the same andesitic suite (see below the discussion related to Figure 1 at the end of section 3-1). The condition whereby a shallow, more chemically (dacitic in this case) evolved magma is invaded by more primitive (andesitic) magma reflects the typical occurrence at most volcanoes worldwide (references above). The ascent of magma between the two reservoirs, and from the shallow chamber to the surface, is modeled by a 1D, steady, isothermal, compressible, multiphase, multicomponent model. We show that accounting for the concomitant action of different magmatic reservoirs leads to a new world of volcanic eruption dynamics, and new understanding of several aspects of the observed eruption dynamics and evolutions. We first analyze the model through a global uncertainty and sensitivity analysis, leading to the identification of the major controls by the model input quantities. The controlling roles of such quantities are then explored through dedicated parametric studies. The efficiency of inter-chamber magma transfer emerges as a new, major quantity largely controlling the eruption dynamics and evolution, and the conditions for eruption termination.
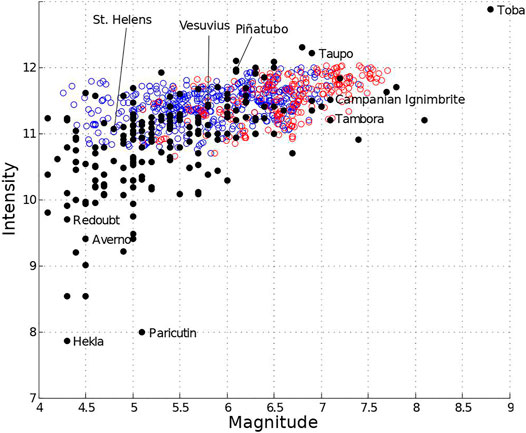
FIGURE 1. Observed (
2 Numerical Model
2.1 Modeling Approach
Figure 2 (left) shows the simulation setup. A deep, large reservoir hosting andesitic magma is connected through a vertical planar dyke to a shallow, smaller chamber hosting more chemically evolved dacite, connected to the surface through a cylindrical conduit. The input parameters (volume and depth of the chambers, conduit diameter, dyke thickness, volatile abundance in the two magmas) are varied in the ranges reported in Table 1, reflecting more frequently reported values for explosive eruptions in the literature (e.g., the references at the beginning of the Introduction section). Table 2 reports the composition of the employed dacitic and andesitic melts, which affects the major properties density and viscosity, and the multi-component volatile saturation surface. Water and carbon dioxide are considered as volatile species partitioning between the melt and gas phase. Magma properties and gas-melt volatile partition are locally defined on the basis of the
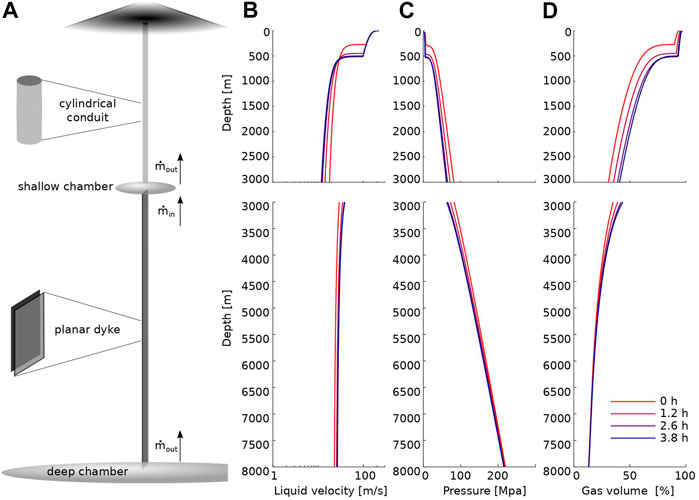
FIGURE 2. Simulation setup. (A) Simulation domain. (B–D) Example calculations at different times.
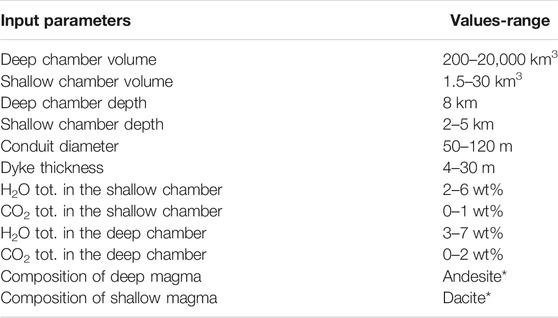
TABLE 1. Input parameters used in the simulations. Magma temperature is taken to be constant along the entire simulated domain, and equal to 950°C *Composition reported in Table (2).

TABLE 2. Chemical composition of the employed andesitic and dacitic melts (wt%).
A point-like lumped system approximation for the two magma chambers keeps the overall complexity to manageable levels, at the same time eliminating further arbitrary variables and allowing the extraction of first order controls on the eruption dynamics by the composite nature of the plumbing system. Boundary conditions for dyke and conduit flow reflect magma withdrawal (deep chamber) and balance between magma input and output under instantaneous magma mixing (shallow chamber). The upflow conditions for dyke flow correspond to deep chamber conditions. Pressure in the shallow chamber represents both the downflow boundary condition for dyke flow, and the upflow boundary condition for conduit flow, and together with the evolution of magma composition upon mixing in the shallow chamber, it couples dyke and conduit flow dynamics, and ultimately results in consistent evolution of the entire simulated system from the deeper chamber to volcanic conduit. In details:
1. At each time step, the equations for the cylindrical upper conduit and for the planar dyke connecting the deep reservoir to the shallow chamber are solved, with boundary conditions given by pressure and composition in the two chambers.
2. At time zero, we set a lithostatic pressure boundary condition for both chambers. Initial pressurized conditions are also possible, but they are not considered here in order to keep to a minimum the number of independent variables characterizing the system. The conduit/dyke exit boundary conditions are determined by either choked flow or ambient pressure (atmopheric pressure for the conduit, and shallow chamber pressure for the dyke), as part of the solution of the simulated dynamics. Note that time zero does not correspond to the start of the eruption, which would be characterized by highly transient dynamics during which the volcanic conduit and eruption plume are established. These transient dynamics are not considered in our modeling. Accordingly, time zero corresponds to a reference time when steady flow conditions have been established along the entire simulated domain from the deep chamber to the surface.
3. For later times, composition and pressure inside each one of the two chambers are computed on the basis of mass inflow/outflow, and constitute the new boundary condition for the numerical calculations of dyke and conduit flow. For dyke flow, the third, not simulated dimension has been fixed to 100 m when converting from mass flow rate per unit length (computed through dyke ascent modeling) to mass flow rate, and from that, to chamber mass loss or gain (see below). In particular, after update of mixture density given by
where
Under the quasi-steady flow assumption, the mass inside the chamber is approximated as
where
where β is the effective bulk modulus of the elastic walls surrounding the chambers. By repeating the same simulations with
4. The time step
The transit time
5. The cycle stops when the local difference between the lithostatic and magmatic pressure anywhere in the computational domain exceeds the tensile strenght of rocks.
6. A-posteriori evaluation of the quasi-steady assumption is done by checking if the following criterion is satisfied:
where
In spite of its relative simplicity, such a set up captures the fundamental characteristic of many volcanic plumbing systems characterized by separated reservoirs located at different depth and hosting different magmas, being simultaneously activated during an eruption. Comparison with real eruptions mostly involves the quantities Magnitude and Intensity. Magnitude (M) is computed as in Pyle (2015) as
Point 5 above requires further discussion. As explained above, we stop a simulation run when the pressure somewhere in the simulated domain, extending from the deep chamber to the surface, falls below the critical threshold dictated by rock tensile strength. Beyond such conditions local rock failure is expected, terminating the sub-steady phase of the eruption, or the eruption itself. If that happens at magma chamber level, caldera collapse may occur. In the real world the processes are expected to be more complex. As an example, initiation of caldera roof collapse may cause the magmatic pressure to increase back to values sufficient to avoid further collapse, and a sub-steady phase may be restored until further magmatic pressure changes lead to a new instability. Similarly, if large pressure decrease occurs locally in the volcanic conduit (typically close to magma fragmentation where the pressure gradient is the highest, Papale and Dobran (1994)), that may lead to local conduit wall erosion and conduit shape changes (Macedonio et al., 1994; Aravena et al., 2017). Additional complexities may come from the mechanics of rock failure (Kabele et al., 2017), especially in layered environments (Gudmundsson, 2007), whereby the generation of ring faults and the occurrence of caldera collapse depend on a number of other factors including chamber shape. The development of a yield strength in a crystal-rich magma reservoir affects the size of the magma body and hence the evolution of pressure and eruption rate, leading to increasing eruptions rates through time (Karlstrom and Manga, 2012). Because we only refer to steady flow dynamics and do not include in the model fracturing and faulting, that are beyond the scopes of this work, we stop our simulations when the computed pressure changes do not guarantee further validity of the steady flow assumption. Such an approach is similar to the one employed in previous works: Bower and Woods (1998) assume a critical under-pressure threshold in the magma chamber of 35 MPa as a condition for termination of steady conduit flow, and with the same approach Macedonio et al. (2005) use the very large value of 80 MPa. In his comprehensive analysis of ring-fault formation in volcanic areas, Gudmundsson (2007) employs a critical under-pressure of only 5 MPa as a potential trigger for ring-fault formation above a magma chamber. More recently, Kabele et al. (2017) develop a finite element model for the mechanical interactions between a magma chamber and its surrounding rocks, employing a rock tensile strength of 8 MPa. Although the real dynamics of caldera formation may be complex, and they are beyond the scopes of this work, in the following we adopt a fixed threshold of 20 MPa, and refer to the cases where the simulation is terminated because of pressure decrease in one of the two magma chambers, as “shallow chamber collapse” or “deep chamber collapse” for the shallow and deep magma chamber, respectively.
The dyke thickness parameter in our modeling requires particular care. In fact, magmatic reservoirs located at different depths may communicate to each other through a far more complex system of interconnections, possibly involving multiple dykes and intermediate storage zones (Edmonds et al., 2019). We will show in the following that dyke thickness is a major factor controlling the eruption dynamics and evolution, its role being that of balancing between magma withdrawal from the deep chamber, and magma inflow and outflow at shallow chamber level. Accordingly, dyke thickness in our simulations should be taken as a proxy for the overall efficiency of magma transfer across the variably complex system connecting the magmatic reservoirs.
2.2 Uncertainty and Global Sensitivity Analysis
In order to explore the dynamics of the composite system represented in Figure 2, the model described above is applied to the range of input parameters reported in Table 1. An uncertainty and global sensitivity analysis is performed in order to extract the input parameters controlling the eruption dynamics.
Uncertainty and sensitivity analysis investigate how a subset of the model assumptions, in the present case constituted by the input parameters in Table 1, affects the model output. The uncertainty analysis consists in studying how the variability of the input propagates into the distribution of the output. This can be done by repeatedly running the model with different input values sampled over their plausible ranges, and studying the distribution of model output. The sensitivity analysis studies how the variability observed in model outputs has to be ascribed to the different input parameters, thus providing information on the relative importance of the input quantities (Saltelli et al., 2019). To perform a valid sensitivity analysis when a model features nonlinearities and interactions, as it is largely the case with the present model, a global approach is required. In the global sensitivity analysis, the variation of the output is obtained by varying all the input factors simultaneously, so that the sensitivity to each input factor considers the direct influence of that factor as well as the joint influence due to interactions. It has been noted (Saltelli et al., 2019) that in the Earth Science literature many sensitivity analyses are still based on changing the input factors one at a time, leaving the space of the input variables largely unexplored.
In the present analysis we refer to three model outputs, represented by the eruption magnitude (which measures how much magma is discharged), the eruption intensity (which measures how fast the magma is discharged), and the location (shallow vs. deep) where rock failure terminating the simulation occurs. The input parameters are reported in Table 1.
We first perform an uncertainty analysis through a latin hypercube sampling of the space of the input quantities using the Dakota software (Adams et al., 2014). Then, two types of global sensitivity analysis are performed: a regional sensitivity analysis and a novel density-based sensitivity analysis called PAWN (Pianosi and Wagener, 2018).
Regional Sensitivity Analysis (RSA, Pianosi et al. (2016)) aims at identifying regions in the input space that correspond to particular values of the output. By comparing the empirical cumulative distribution functions of an input factor associated with output values above or below a given threshold (for continuous output values such as magnitude and intensity), or associated with different boolean-type outputs (such as “shallow” or “deep” rock failure), we can determine regions of the input that have different influence on the considered output. The divergence between the two distributions is measured by the Kolmogorov-Smirnov statistics.
where
The PAWN analysis (Pianosi and Wagener, 2015; Pianosi and Wagener, 2018) consists of a distribution-based method that uses the cumulative distribution function of the output and is particularly suitable when the output distribution is skewed or multi-modal, as in our case for the magnitude and intensity outputs. The PAWN sensitivity index for the ith input factor is defined as
where
3 Simulations
The right panels in Figure 2 show one example of calculations (only a few times are reported). At each time step the flow variable distributions display well-known behaviors [e.g., Papale (2001)] reflecting the establishment of a friction-dominated bubbly flow region characterized by large gradients of the flow quantities culminating in magma fragmentation, followed by an inertia-dominated gas-particle region from fragmentation to conduit exit. Lumped pressure in the shallow magma chamber corresponds at any time to both dyke exit and conduit base pressure, coupling the dynamics in the entire domain. Mixing between compositionally different magmas in the shallow chamber causes a progressive shift in the composition, thus in the properties of the magma flowing along the conduit, and results in a jump of gas volume fraction, of (not shown) magma density, and by continuity, of ascent velocity. Progressive withdrawal of magma from the deep chamber, controlled by the evolution of quantities over the entire domain, causes progressive decrease of pressure at depth, in turn influencing the overall dynamics.
3.1 Uncertainty Analysis
Figure 1 shows the computed variability in the two major output quantities magnitude and intensity, plotted together with a large number of observed data points from the literature [black dots, from the LaMEVE database (Crosweller et al. (2012)]. The open circles are the results from the present numerical simulations, each circle originating from a sequence of magma ascent simulations such as the one exemplified in Figure 2. Red and blue circles correspond to cases for which eruption termination occurs as a consequence of excessive pressure drop in the deep and shallow magma chamber, respectively. Significant depressurization exceeding rock tensile strength at volcanic conduit level only emerges for narrow conduits <50 m, in agreement with the conclusions by Aravena et al. (2018) who suggest dominantly unsteady dynamics at such unstable conditions. Accordingly, we have limited our analysis to conduit diameters >50 m (see Table 1). Conversely, over the explored conditions in Table 1, pressure decrease along the dyke connecting the two magma chambers is never found to approach rock tensile strength. The correspondence between the trend given by the data and that from the results of the simulations is notable. There are 719 simulated cases in the figure, which are obtained by automatically sampling (through the Dakota software, as explained in the Methods section) the input quantities over the reasonable ranges in Table 1. The modeling approach illustrated above, that results in a satisfactory representation of the real magnitude-intensity space, suggests that our model is able to capture the first order aspects of real explosive eruptions, at least in terms of total erupted mass, mass discharge rates, and eruption duration. The data describe a low-intensity region
3.2 Global Sensitivity Analysis
Figures 3–5 show the results of the regional sensitivity analysis (RSA) in relation to the three considered major model outputs outlined above, namely, location of the expected rock failure terminating the simulation (Figure 3), eruption magnitude (Figure 4), and eruption intensity (Figure 5). In the diagrams of these figures, the larger the distance, quantified by
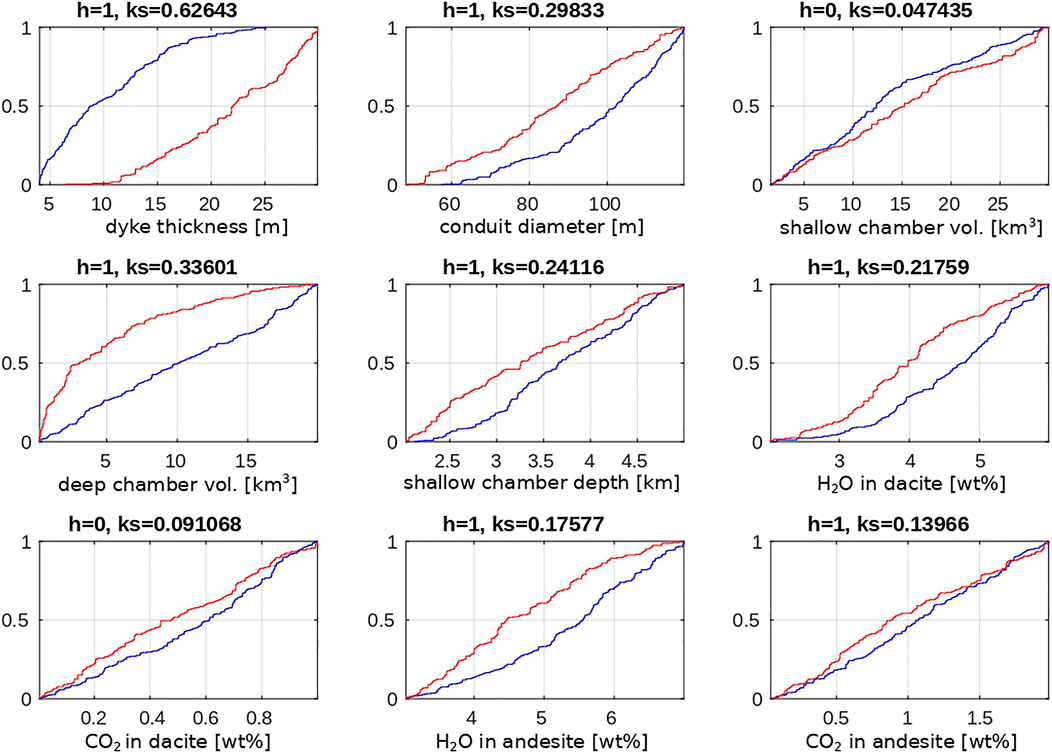
FIGURE 3. Regional analysis results for occurrence of eruption closure by shallow (blue lines) or deep (red lines) chamber collapse. ks (Eq. 7) quantifies the difference between the two distribution functions; the larger the value of ks, the more influential the input parameter; h is the hypothesis test result (h = 1 indicates that the test rejects the null hypothesis that the two distribution functions are the same at the
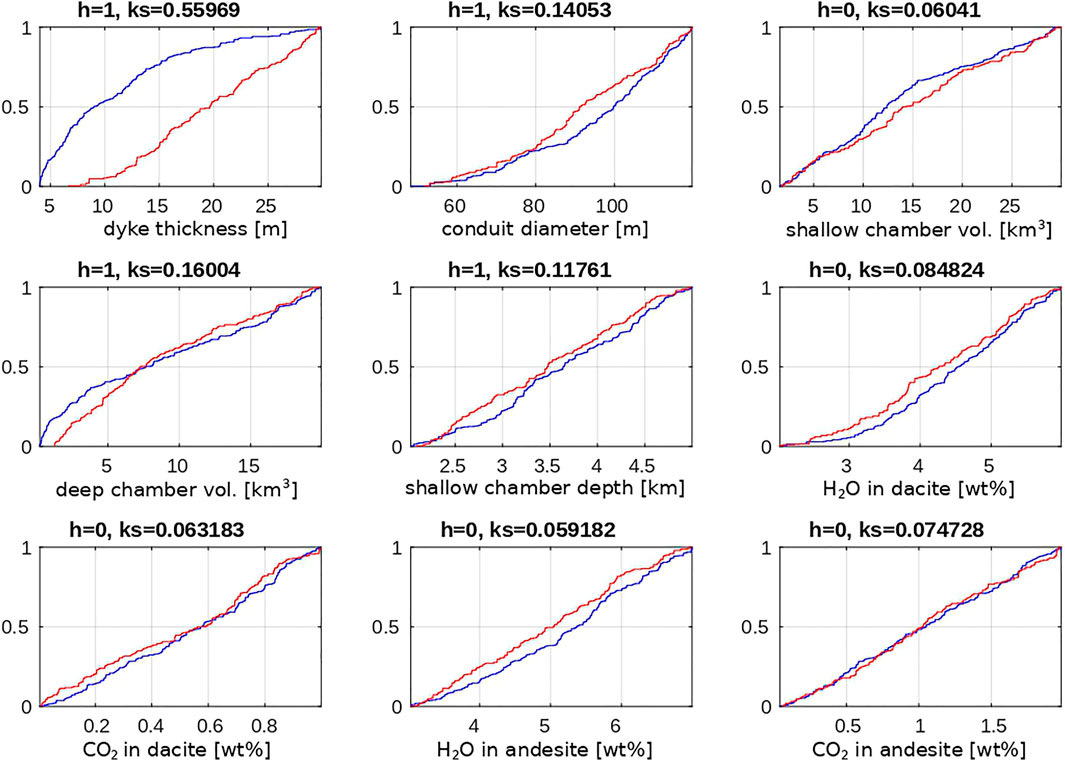
FIGURE 4. Regional analysis results for eruption magnitude less than (blue lines) or larger than (red lines) the value of 6.5. See Figure 3 for the interpretation.
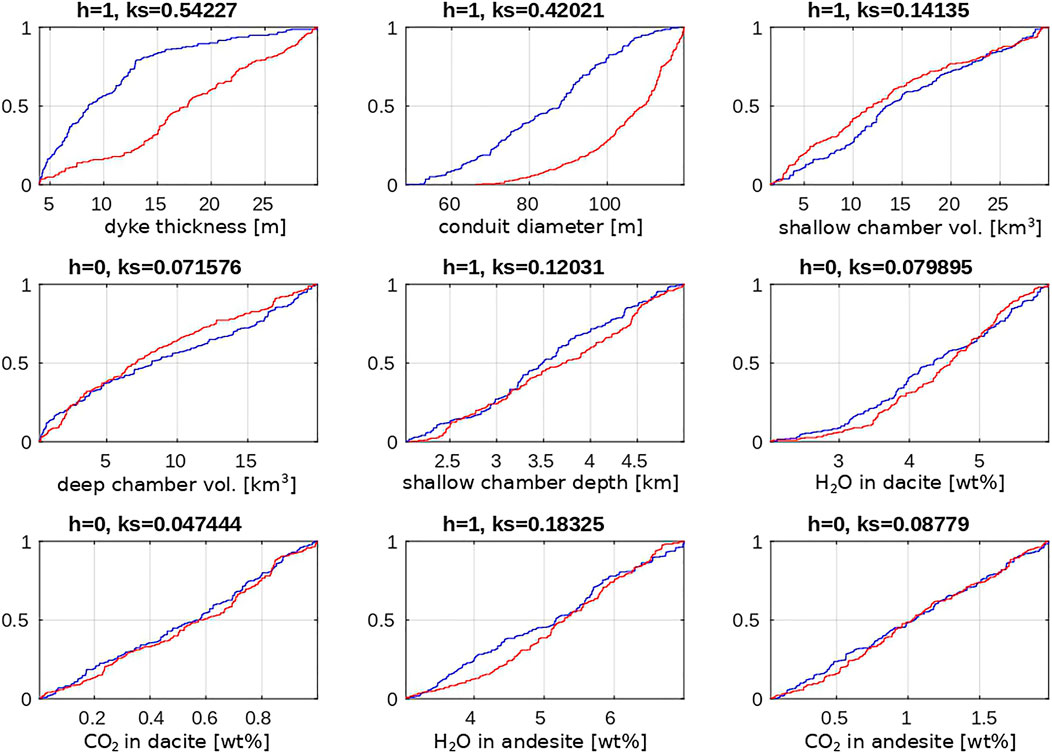
FIGURE 5. Regional analysis results for eruption intensity less than (blue lines) or larger than (red lines) the value of 11.5. See Figure 3 for the interpretation.
For each one of the major output quantities in Figures 3–5, dyke thickness turns out to be the input quantity associated with the largest
Figure 6 shows the PAWN sensitivity indexes relative to the output quantities magnitude and intensity, calculated as the median
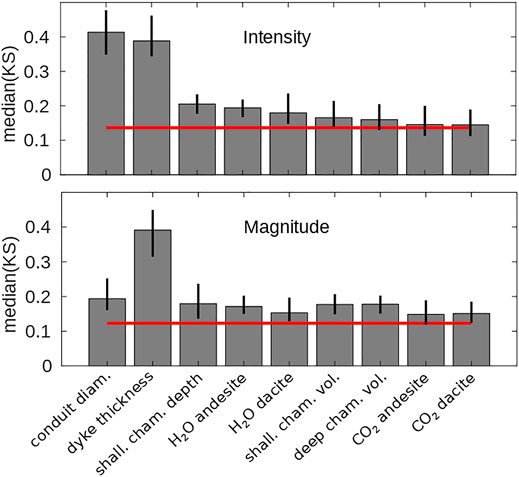
FIGURE 6. PAWN sensitivity indices as the median KS across conditioning intervals (stat = median in Eq. 8), for sample size N = 719 and number of conditioning intervals n = 10. Vertical line represents the 95% confidence interval estimated by bootstrapping and the bar height indicates the mean value of each PAWN index. The red line is the KS of the dummy parameter (values corresponding to bar heights lower than the red line are unreliable). The analysis is obtained with a sample size N = 719, and setting a number of conditioning intervals n = 10 sufficient to reach the convergence of the PAWN sensitivity indices (see also Supplementary Figures S2–5).
Overall, the picture emerging from the RSA and PAWN analyses is that of a major control exerted by the dyke thickness parameter on the overall simulated eruption dynamics and evolution, revealed here in terms of eruption intensity and magnitude, and on simulation closure as due to excessive depressurization within the shallow vs. deep magmatic system. Large dyke thicknesses (or high efficiency of magma transfer between deep reservoirs) tend to be associated with higher eruption magnitudes and intensities (although conduit diameter plays a major control on the latter), and to eruption closure by rock failure at deep chamber level (with other quantities playing a role on the latter, and among them, the volume of the deep magma chamber). In the following we analyze the major controls outlined here by making use of parametric studies primarily on dyke thickness and magma chamber volumes and illustrate the mechanistic aspects of such controls, leading to the identification of first relevance features of explosive eruption dynamics that were previously overlooked or unknown.
3.3 Control by Deep Interconnections
Figure 7 shows the computed evolution of some relevant eruption quantities, in a parametric study where the dyke thickness is varied from one simulation to another, while the simulation set up including all other input quantities is let unchanged. With small dyke thickness magma transfer across reservoirs is poorly efficient, thus the eruption discharge rate is not compensated by deep magma arrival (Figure 7D, cold colors). As a consequence, shallow chamber pressure decays rapidly (Figure 7A), while deep chamber pressure changes only slightly (Figure 7C) reflecting minor magma withdrawal from depth. At such conditions eruption closure quickly follows from shallow chamber pressure drop after progressive decline of the eruption discharge rate, resulting in a low magnitude eruption (Figure 7B).
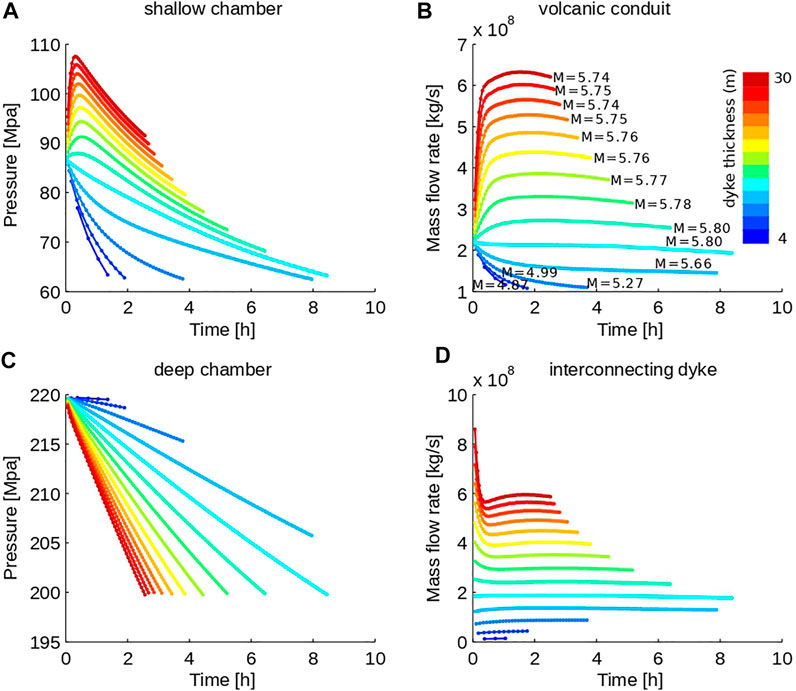
FIGURE 7. Computed pressure in the shallow and deep magma chambers, and mass flow rate along the conduit and dyke. Calculations corresponding to dyke thicknesses from 4 (cold colors) to 30 (hot colors) m, with regular dyke thickness increment by 2 m. Other simulation conditions: deep chamber volume =
With larger dyke thickness (10–12 m in Figure 7), the increased efficiency of deep mass transfer sustains the eruption discharge rate (Figures 3B,D, light blue/cyan curves), leading to longer sub-steady eruption phase (up to about 8 h in the figure) with nearly constant mass flow rate. Deep chamber pressure decrease becomes significant (Figure 7C) due to increased magma withdrawal, eventually reaching the rock collapse threshold (starting from the cyan curve, or dyke thickness of 12 m).
With further increase in dyke thickness, the mass flow rate along the dyke can overcome the one along the shallow conduit (hot-coloured lines in Figures 7B,D), causing shallow chamber pressurization (Figure 7A) and further deep chamber depressurization (Figure 7C). In turn, the former causes the eruption discharge rate to increase (Figure 7B). However, shallow pressure increase and deep pressure decrease rapidly lead to decreased mass flow rate along the dyke (Figure 7D), as the concomitant action of increasing downflow and decreasing upflow pressure driving dyke flow. Therefore, shallow chamber pressurization is self-buffered, as it induces changes in conduit and dyke flow ending up with less pressure increase. Accordingly, after initial shallow pressurization and intensity increase, the eruption evolves toward shallow pressure decrease (Figure 7A) and about constant or slightly decreasing mass flow rate (Figure 7B).
The eruption evolutions represented in Figure 7 correspond to a fixed deep chamber volume of
3.4 Shallow Versus Deep Controlled Eruption Regimes
The dynamics illustrated above show that besides explaining the observed magnitude-intensity relationship (Figure 1), the interplay between magmatic reservoirs provides the physical framework explaining observed variabilities in the evolution of eruption intensity, with mass flow-rates that can decrease, oscillate, remain constant, or increase depending on such an interplay. Non-linear relationships dominate the dynamics: when the dyke thickness is small, its increase produces longer eruption duration; conversely, if the dyke thickness is sufficiently large, its further increase results in shorter eruption duration. The longest durations correspond to near-balance of conduit and dyke mass flow rates (Figures 7B,D). The eruption magnitude (reported in panel 7b) is also non-linearly related to dyke thickness: for small dyke thickness, the increase in dyke thickness results in larger eruption magnitude, whereas for dyke thicknesses sufficiently large to cause eruption termination by deep chamber collapse, the eruption magnitude becomes poorly dependent on further dyke thickness changes.
The above depicts two regimes for explosive volcanic eruptions (Figure 8): a shallow-controlled regime determined by low inter-chamber magma transfer efficiency (= small dyke thickness) and evolving to shallow chamber collapse, characterized by rapid shallow chamber pressure decrease, minor changes in the deep reservoir, and positive dependence of eruption magnitude and duration on deep magma transfer efficiency; a deep-controlled regime determined by large inter-chamber magma transfer efficiency and evolving to deep chamber collapse, characterized by initial shallow pressure and eruption mass flow rate increase, significant pressure decrease in the deep reservoir, negative dependence of eruption duration and poorly negative or no dependence of eruption magnitude on magma transfer efficiency.
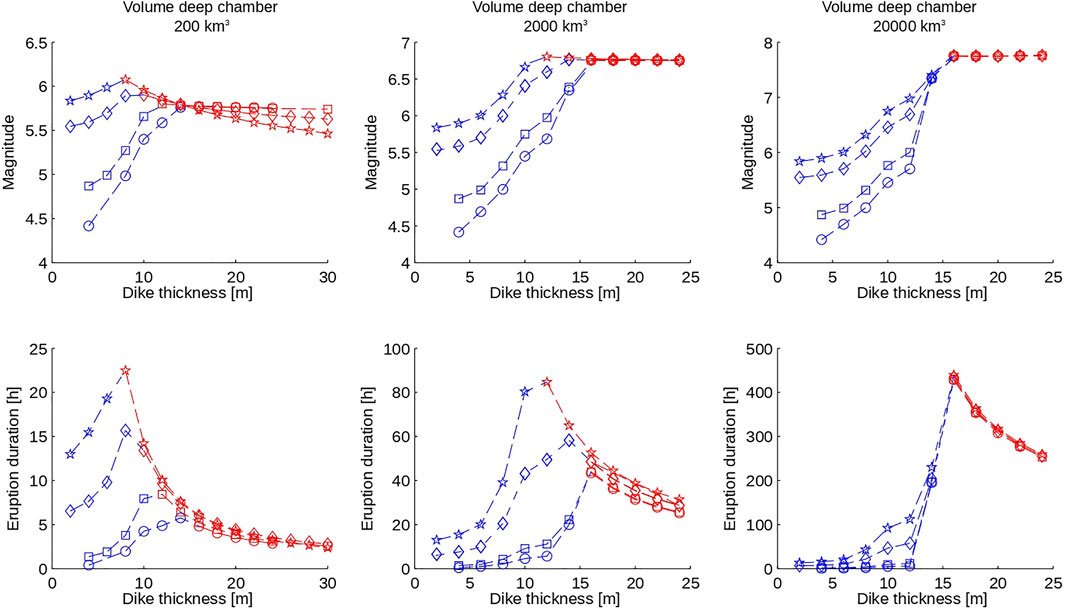
FIGURE 8. Role of deep interconnections. Calculated eruption magnitude (top panel) and duration (bottom panel) as a function of dyke thickness, for different deep chamber volumes and other conditions as in Figure 7. The different symbols refer to different shallow chamber volumes: circles =
The critical dyke thickness (or inter-chamber magma transfer efficiency) at regime transition is non-linearly related to other system conditions. For small deep chamber volume of
4 Discussion
4.1 Relevance of Deep Magma Transfer Efficiency
This study illustrates how the rich variability of observed magnitude, intensity, duration, and evolution of explosive volcanic eruptions on Earth can follow from the interplay between different magmatic reservoirs, as they are generally constrained by the bulk volcanological and petrological reconstructions from the products of past eruptions. In our study we vary several parameters over a large portion of their reconstructed natural variability. The performed sensitivity analysis allows consideration of the variablity of the eruption dynamics and evolution over a wide range of possible system conditions. We have limited our analysis to the andesitic magmatic suite, which represents the vast majority of subaerial explosive volcanism on Earth, and to a representative situation where more chemically evolved magma, that we fixed to dacite, occupies the shallow portion of a volcanic plumbing system which hosts andesitic magma at larger depth. Use of slightly different compositions such as rhyolite or basaltic andesite is not expected to change appreciably the results as long as the more viscous, chemically evolved, volatile-depleted magma is placed at shallow level, as the totality of petrologic modeling and reconstructions suggest. Furthermore, large changes in many other eruption parameters, reported in Table 2 and resulting in more than 700 simulations, ensure that a comparably large proportion of the space of eruptive conditions is covered. Each individual simulation illustrates an eruption evolution path such as those represented by each individual curve in Figure 7, and each one produces a point in Figure 1 (or in Figure 8). In analyzing such a vast suite of numerical results, we concentrate on a few parameters that emerge from the sensitivity analysis as playing a more effective control on first order characteristics of the resulting eruptions. In particular, we concentrate on eruption intensity and magnitude, as well as on the occurrence of deep vs. shallow pressure drop, beyond a sufficiently large threshold assumed to result in local rock collapse and either eruption closure or termination of the sub-steady eruption phase. A new quantity emerges as playing a major control on the overall eruption dynamics and evolution, represented by the efficiency of deep interconnections between separated magmatic reservoirs, exemplified in our study by the dyke thickness parameter. By varying the interconnection efficiency, we have highlighted the existence of two eruption regimes mostly controlled by the shallow or by the deep magmatic system, characterized by markedly different trends and likely to terminate as a consequence of shallow vs. deep failure of the rock system surrounding the chamber. The analyzed conditions span a range extending toward the two end-member cases constituted by isolated, relatively small, shallow magma chamber on the side of minimum dyke thickness (minimum efficiency of inter-chamber magma transfer), and large, deep chamber directly connected with the surface on the opposite side of very efficient deep magma transfer, or very large dyke thickness. It is, however, in the large region between such extremes that the richest dynamics and evolutions emerge, reflecting the concomitant action, and interaction, between the deep and shallow portions of the volcanic plumbing system.
Before considering some relevant implications of the above results, it is worth discussing the delicate balance between crediting and interpreting the numerical results on one side, and considering the limitations of the study on the other side. Complex systems are usually approached by first isolating some relevant first order aspects, then progressively increasing complexity so to construct a progressively more robust reference for understanding and interpretations. That approach is not limited to numerical investigation, rather, it characterizes virtually any scientific approach, e.g., the experimental one, where individual experiments are similarly planned to simplify real systems and isolate, for as much as possible, specific elements of interest. Because the aim is to achieve conclusions that are as much general as possible, both analogue and numerical experiments are first designed to minimize unnecessary complications. That is usually done by referring to a sort of archetype system conditions; e.g., a vertical cylinder for a volcanic conduit, a vertical planar fracture for a dyke, a sphere or ellipsoid for a magma chamber, etc. Once the first order aspects of such archetype systems are understood, one can then move to consider further complications, e.g., variations in the geometry, inclination, number etc. of the domain elements, higher order aspects of the physics involved, etc., obviously subject to constraints by technical feasibility, including finite time and resources available.
In the present case, the objective is that of systematically exploring the first order aspects of volcanic eruption dynamics involving magma initially residing at different depths in the volcanic plumbing system, an occurrence which is revealed by petrology and geochemistry as being virtually ubiquitous, but that it is still heavily under-explored in terms of controls on eruption conditions and evolution. Accordingly, our archetype simulation domain has been designed to capture the first order aspects of a composite volcanic system on one side, and to minimize unnecessary complications on the other side. Besides satisfying the above concepts, avoidance of further complications in the simulated system also reduces the computational time to within manageable amounts, allowing extensive investigation of the space of variables for meaningful investigation as well as for sensitivity analysis. In particular, we take advantage of previous extensive experience in the numerical simulation of 1D, steady, multiphase flow dynamics along volcanic conduits and fissures, and combine it with a lumped description for the evolution of magma chamber conditions, within a consistent approach detailed in the Methods section. We remark that adding a magmastatic pressure profile description within the magma chamber, as in previous work [e.g., Bower and Woods (1998); Colucci et al. (2014)], would not be a major complication. However, Colucci et al. (2014) find that pressure differences as large as
The primary message from this study is the existence of eruption regimes having different evolution and termination, mostly controlled by the deep magma transfer efficiency, and resulting in a major control on the eruption evolution by either the shallow or the deep region of the volcanic plumbing system (Figure 8). Factors other than the deep magma transfer efficiency have an influence in determining the onset of the shallow or deep-controlled eruption regime, and among them, the size of the deep magmatic reservoir is important (Figure 3). However, no other quantity emerges so strikingly as the deep magma transfer efficiency. Its central role in the eruption dynamics is that of balancing fast magma withdrawal from the shallow magmatic system during explosive eruptions. If the mass flow-rate across reservoirs does not compensate for the eruption mass flow-rate, then the pressure is destined to decrease in the shallow magmatic system (Figure 7) (in turn increasing the deep mass flow-rate, thus triggering non-linear effects accounted for in the present modeling). The eruption intensity progressively declines until the difference between lithostatic and magmatic pressure exceeds the rock tensile strength and shallow rock failure occurs, after a minor amount of deep magma has been erupted together with the shallow, more evolved magma making up nearly the totality of the volcanic products (Figure 9). If, instead, the deep magma transfer efficiency over-compensates for the eruption mass flow-rate, then the shallow system undergoes an initial phase of pressurization and quick increase of the eruption intensity (that is, increase of mass flow-rate and volcanic plume height), before entering a long phase where the eruption mass flow-rate (and plume height) can oscillate, remain constant, or slowly decrease (Figure 7), until a sufficient amount of deep magma is extracted from the deep system, and a portion of it is erupted to the surface (Figure 9), causing sufficient pressure decrease in the deep magmatic system and triggering unstable conditions at such deep level.
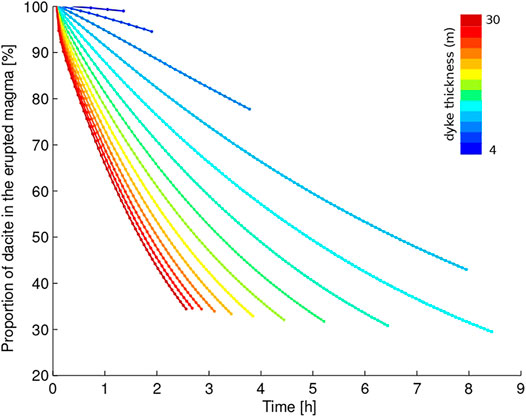
FIGURE 9. Calculated evolution of the average composition of the erupted magma, for the same simulation cases as in Figure 7.
4.2 Comparison With Real Eruptions
The overall picture summarized above is confirmed by the close correspondence between the intensity-magnitude relationship computed in this study by just varying the simulation conditions over a-priori defined, reasonable ranges from the literature (Table 1), and that from observed or reconstructed eruptions worldwide (Figure 1). The eruption magnitudes and durations resulting from the two regimes can largely overlap (Figures 1, 8), making the attribution of real eruptions to one or the other regime not straightforward. However, in the analyzed range of conditions the largest magnitudes and durations, approaching those of super-eruptions, are found for the deep-controlled regime (Figures 1, 4, 8). Similarly, if the size of the collapsing chamber is taken as a proxy for the width of a possibly associated caldera, caldera sizes can largely overlap between the two regimes, but the largest ones, of order tens of km, are found in association to the largest simulated eruption magnitudes in the deep-controlled regime (Figure 3). It seems plausible, therefore, that the known largest volcanic super-eruptions developed under conditions corresponding with those along the red curves in Figures 7–9: if intermediate magma accumulation zones existed between the large, deeper reservoir and the surface, the efficiency of the deep magma interconnections was however large enough to avoid quick shallow pressure decrease and rapid eruption closure. It may be speculated that if, instead, the deep magma transfer efficiency was not sufficiently large, then the volcanic system might have entered a phase of frequent low magnitude eruptions, each one terminating as a consequence of shallow system control, and each one quickly consuming part of the deep chamber overpressure. In other words, the simulation results seem to suggest that huge accumulation of eruptible magma at some depth below a volcano is necessary but not sufficient for the occurrence of a very large, globally impacting eruption. Such an extreme event appears to equally require the establishment of unusual conditions allowing high rates of magma transfer at depth, across an effective, highly efficient network of interconnections linking the large reservoir to its shallow, smaller hypophysis closer to the Earth surface. Figure 8 shows that for the conditions of the simulations in the figure, the minimum dyke thickness for deep-controlled eruption regime nearly doubles when the deep chamber volume changes from 200 to 20,000 km3. The establishment of such unusual conditions may in turn provide a justification to the rareness of volcanic super-eruptions [VEI eight eruptions represent only one-two out of 10 million volcanic eruptions on Earth, (Papale. 2018)], independent from the existence of sufficiently large magmatic reservoirs, that may exist but not be able to produce a huge eruption. Geophysical imaging suggests the presence of huge amounts of magma beneath an increasing number of volcanoes: at Yellowstone (WY, United States) a shallow (upper crust) rhyolitic magma storage zone is estimated to have a volume of about
4.3 Implications for Volcanic Hazard Forecasts
The present study suggests that the magnitude, thus the impacts, of a volcanic eruption largely depends on the dyke thickness parameter, a proxy for the efficiency of deep magmatic interconnections. That is an unfortunate situation for our forecasting capabilities. In fact, we do not have, currently, any viable means of estimating such an elusive quantity at any real volcano. As an example, what conditions should we assume in case of escalating unrest at Yellowstone, which has never erupted during last 70 ka? And, would it be safe to assume that the next eruption at Campi Flegrei, where the last eruption about 500 years ago was preceded by about 3.4 ka of quiescence, would still reflect low efficient deep magma interconnections as for the previous millennia? While we have progressed enormously in revealing even the smallest unrest signals at well monitored volcanoes, and we expect therefore to recognize the early signs of escalating dynamics, our capability to anticipate the size of an impending eruption has practically not evolved during last decades. Considerations based on the global size distribution of volcanic eruptions on Earth suggest that such an uncomfortable situation may result from exceedingly non-linear eruption dynamics, translating into the observed power law distribution of the frequency of dominantly explosive eruptions (Papale, 2018; Papale et al., 2021). This study shows that modeling the eruption dynamics leads to the similar conclusions that finding confident relationships between unrest dynamics and size of the impending eruption may continue to be, at least for explosive eruptions, a very hard task, if not a hopeless undertaking. The situation may be more favorable after the eruption has begun. In fact, conditions of high deep magma transfer efficiency can be associated with an initial phase of increasing eruption mass flow-rate, as it is shown in Figure 7 (and in the Supplementary Figure S6). For the conditions in such figures, and assuming no mass loss from the volcanic plume due to partial or total column collapses, the volcanic column would be seen to increase by about 2–>10 km (Costa et al., 2018) over the first one to several hours from the establishment of sub-steady conditions. Therefore, an initially progressively increasing (sub-steady) column height may be suggestive of deep-controlled eruption regime and associated high to very high eruption duration and magnitude, with the potential to evolve into a large caldera-forming eruption. A number of well-studied Plinian fallout deposits from the largest caldera-forming eruptions on Earth exhibit basal reverse grading; e.g., the Plinian fallout preceding the Campanian Ignimbrite eruption, mentioned above, shows basal reverse grading for more than its half height (Rosi et al., 1999); and the Plinian phase of the 760 ka M8.3 Bishop Tuff eruption, Long Valley, United States, shows reverse grading throughout its entirety, reflecting nearly continuous eruption column height thus mass flow-rate increase before pyroclastic flows leading to the gigantic ignimbrite formation (Gardner et al., 1991). In practice, however, referring to time-wize mass flow-rate increase as a syn-eruptive early sign of deep-controlled eruption regime thus of potentially more dangerous, more impacting conditions, can be difficult. In fact, mass flow-rate increase during initial eruption stages may reflect other factors and processes, like progressive wall rock erosion and establishment of the volcanic conduit (Aravena et al., 2017), progressive tapping of more water-rich, less chemically evolved (thus less viscous) magma (Papale et al., 1998), and others that can affect to various degrees the stages preceding and accompanying full development of a Plinian volcanic column. Many of these processes can be identified and reconstructed from the analysis of the associated volcanic deposits [e.g., Cioni et al. (2021)], but are difficult to constrain while the eruption is on-going. With the above limitations, in light of the present results we suggest that for those cases where the eruption mass flow-rate is seen to increase over hours, then it may be wise to consider an increased likelihood of established deep-controlled regime conditions, as well as the possibility of a long eruption duration of order days to weeks with comparably large accumulation of volcanic ash, potentially ending up with large caldera collapse and generation of large pyroclastic flows.
Data Availability Statement
The original contributions presented in the study are included in the article/Supplementary Material, further inquiries can be directed to the corresponding author.
Author Contributions
SC and PP conceived the present idea and the algorithm, discussed the results, and wrote the manuscript. SC implemented the algorithm and performed the numerical simulations.
Conflict of Interest
The authors declare that the research was conducted in the absence of any commercial or financial relationships that could be construed as a potential conflict of interest.
Supplementary Material
The Supplementary Material for this article can be found online at: https://www.frontiersin.org/articles/10.3389/feart.2021.681083/full#supplementary-material
Appendix
The fundamental equations describing transport of mass and momentum along a conduit or dyke assume 1D, steady, isothermal, multiphase conditions (Papale, 2001). The mass conservation for the gas phase (bubbles below fragmentation, continuous above it) is given by
and the equation for the dense phase (liquid + crystals below fragmentation, particles/droplets above it) by
The next two equations are for momentum balance. The equation for the gas phase is
and the equation for the dense phase is
In the above equations, ε is gas volume fraction, ρ is density, u is velocity, w is mass fraction, z is the vertical coordinate upward positive, P is pressure, g is gravity acceleration,
The interphase mass transfer term
where
Magma fragmentation is determined according to local conditions in terms of brittle/ductile response of the magmatic mixture. Fragmentation occurs when the following criterion is satisfied (Papale, 1999):
where
The above equations are the same for conduit and dyke flow. However, the two cases differ for the friction term, which expresses in 1D the effective mechanical energy dissipation due to the internal friction related to the effective velocity distribution in the plane perpendicular to flow direction. The friction term
where
where A is the cross-sectional area and χ is the wetted perimeter. For a cylindrical conduit and a planar dyke Eq. 19 gives
where D is conduit diameter and W is dyke thickness.
The quantity f in Eqs 18 is the friction coefficient, which embeds the internal dissipation associated with the effective velocity profile. For a Newtonian flow and with reference to the first of Eq. 18, the following holds:
B2
where
Other equations describing the additional terms in Eqs 9–12 are reported in Papale (2001).
References
Adams, B., Ebeida, M. S., Eldred, M. S., Jakeman, J. D., Swiler, L. P., Stephens, J. A., et al. (2014). Dakota, a Multilevel Parallel Object-Oriented Framework for Design Optimization, Parameter Estimation, Uncertainty Quantification, and Sensitivity Analysis: Version 6.0 User’s Manual. New Mexico: Sandia Technical Report SAND, 2014–4633. doi:10.2172/1177048
Albert, P. G., Giaccio, B., Isaia, R., Costa, A., Niespolo, E. M., Nomade, S., et al. (2019). Evidence for a Large-Magnitude Eruption from Campi Flegrei Caldera (Italy) at 29 Ka. Geology 47, 595–599. doi:10.1130/G45805.1
Aravena, Á., Cioni, R., de’Michieli Vitturi, M., and Neri, A. (2018). Conduit Stability Effects on Intensity and Steadiness of Explosive Eruptions. Sci. Rep. 8, 4125. doi:10.1038/s41598-018-22539-8
Aravena, Á., de' Michieli Vitturi, M., Cioni, R., and Neri, A. (2017). Stability of Volcanic Conduits during Explosive Eruptions. J. Volcanology Geothermal Res. 339, 52 – 62. doi:10.1016/j.jvolgeores.2017.05.003
Araya, N., Nakamura, M., Yasuda, A., Okumura, S., Sato, T., Iguchi, M., et al. (2019). Shallow Magma Pre-charge during Repeated Plinian Eruptions at Sakurajima Volcano. Sci. Rep. 9, 1979. doi:10.1038/s41598-019-38494-x
Arienzo, I., D’Antonio, M., Di Renzo, V., Tonarini, S., Minolfi, G., Orsi, G., et al. (2015). Isotopic Microanalysis Sheds Light on the Magmatic Endmembers Feeding Volcanic Eruptions: the Astroni 6 Case Study (Campi Flegrei, italy). J. Volcanology Geothermal Res. 304, 24–37. doi:10.1016/j.jvolgeores.2015.08.003
Arienzo, I., Moretti, R., Civetta, L., Orsi, G., and Papale, P. (2010). The Feeding System of Agnano-Monte Spina Eruption (Campi Flegrei, Italy): Dragging the Past into Present Activity and Future Scenarios. Chem. Geology. 270, 135–147. doi:10.1016/j.chemgeo.2009.11.012
Astbury, R. L., Petrelli, M., Ubide, T., Stock, M. J., Arienzo, I., D'Antonio, M., et al. (2018). Tracking Plumbing System Dynamics at the Campi Flegrei Caldera, italy: High-Resolution Trace Element Mapping of the Astroni crystal Cargo. Lithos 318-319, 464–477. doi:10.1016/j.lithos.2018.08.033
Bonaccorso, A., Calvari, S., Linde, A., and Sacks, S. (2014). Eruptive Processes Leading to the Most Explosive Lava fountain at etna Volcano: The 23 November 2013 Episode. Geophys. Res. Lett. 41, 4912–4919. doi:10.1002/2014GL060623
Bower, S. M., and Woods, A. W. (1998). On the Influence of Magma chambers in Controlling the Evolution of Explosive Volcanic Eruptions. J. Volcanology Geothermal Res. 86, 67–78. doi:10.1016/s0377-0273(98)00081-x
Brown, S. K., Crosweller, H. S., Sparks, R. S. J., Cottrell, E., Deligne, N. I., Guerrero, N. O., et al. (2014). Characterisation of the Quaternary Eruption Record: Analysis of the Large Magnitude Explosive Volcanic Eruptions (LaMEVE) Database. J. Appl. Volcanol. 3. doi:10.1186/2191-5040-3-5
Cioni, R., Pistolesi, M., Pompilio, M., and Scaillet, B. (2021). Understanding Volcanic Systems and Their Dynamics Combining Field and Physical Volcanology with Petrology studiesForecasting and Planning for Volcanic Hazards, Risks, and Disasters. Elsevier, 285–328. doi:10.1016/b978-0-12-818082-2.00007-x
Colucci, S., de' Michieli Vitturi, M., Neri, A., and Palladino, D. M. (2014). An Integrated Model of Magma Chamber, Conduit and Column for the Analysis of Sustained Explosive Eruptions. Earth Planet. Sci. Lett. 404, 98 – 110. doi:10.1016/j.epsl.2014.07.034
Costa, A., Suzuki, Y. J., and Koyaguchi, T. (2018). Understanding the Plume Dynamics of Explosive Super-eruptions. Nat. Commun. 9, 1–6. doi:10.1038/s41467-018-05545-2
Crosweller, H. S., Arora, B., Brown, S. K., Cottrell, E., Deligne, N. I., Guerrero, N. O., et al. (2012). Global Database on Large Magnitude Explosive Volcanic Eruptions (Lameve). J. Appl. Volcanol. 1. doi:10.1186/2191-5040-1-4
De Vita, S., Orsi, G., Civetta, L., Carandente, A., D'Antonio, M., Deino, A., et al. (1999). The Agnano-Monte Spina Eruption (4100 Years BP) in the Restless Campi Flegrei Caldera (Italy). J. Volcanology Geothermal Res. 91, 269–301. doi:10.1016/s0377-0273(99)00039-6
Di Renzo, V., Arienzo, I., Civetta, L., D'Antonio, M., Tonarini, S., Di Vito, M. A., et al. (2011). The Magmatic Feeding System of the Campi Flegrei Caldera: Architecture and Temporal Evolution. Chem. Geology 281, 227–241. doi:10.1016/j.chemgeo.2010.12.010
Edmonds, M., Cashman, K. V., Holness, M., and Jackson, M. (2019). Architecture and Dynamics of Magma Reservoirs. Phil. Trans. R. Soc. A. 377, 20180298. doi:10.1098/rsta.2018.0298
Fedi, M., Cella, F., D’Antonio, M., Florio, G., Paoletti, V., and Morra, V. (2018). Gravity Modeling Finds a Large Magma Body in the Deep Crust below the Gulf of naples, italy. Sci. Rep. 8. doi:10.1038/s41598-018-26346-z
Folch, A., and Martí, J. (2009). Time-dependent Chamber and Vent Conditions during Explosive Caldera-Forming Eruptions. Earth Planet. Sci. Lett. 280, 246 – 253. doi:10.1016/j.epsl.2009.01.035
Folch, A., and Martı́, J. (1998). The Generation of Overpressure in Felsic Magma chambers by Replenishment. Earth Planet. Sci. Lett. 163, 301 – 314. doi:10.1016/S0012-821X(98)00196-4
Gardner, J. E., Sigurdsson, H., and Carey, S. N. (1991). Eruption Dynamics and Magma Withdrawal during the Plinian Phase of the bishop Tuff Eruption, long valley Caldera. J. Geophys. Res. 96, 8097–8111. doi:10.1029/91jb00257
Gudmundsson, A. (2007). Conceptual and Numerical Models of Ring-Fault Formation. J. Volcanology Geothermal Res. 164, 142 – 160. doi:10.1016/j.jvolgeores.2007.04.018
Gudnason, J., Thordarson, T., Houghton, B. F., and Larsen, G. (2018). The 1845 Hekla Eruption: Grain-Size Characteristics of a Tephra Layer. J. Volcanology Geothermal Res. 350, 33 – 46. doi:10.1016/j.jvolgeores.2017.11.025
Husen, S., Smith, R. B., and Waite, G. P. (2004). Evidence for Gas and Magmatic Sources beneath the Yellowstone Volcanic Field from Seismic Tomographic Imaging. J. Volcanology Geothermal Res. 131, 397–410. doi:10.1016/S0377-0273(03)00416-5
Kabele, P., Žák, J., and Somr, M. (2017). Finite-element Modeling of Magma Chamber-Host Rock Interactions Prior to Caldera Collapse. Geophys. J. Int. 209, 1851–1865. doi:10.1093/gji/ggx121
Karlstrom, L., Rudolph, M. L., and Manga, M. (2012). Caldera Size Modulated by the Yield Stress within a crystal-rich Magma Reservoir. Nat. Geosci 5, 402–405. doi:10.1038/ngeo1453
Keiding, J. K., and Sigmarsson, O. (2012). Geothermobarometry of the 2010 Eyjafjallajökull Eruption: New Constraints on Icelandic Magma Plumbing Systems. J. Geophys. Res. 117. doi:10.1029/2011JB008829
Londoño, J. M., and Kumagai, H. (2018). 4D seismic tomography of Nevado del Ruiz Volcano, Colombia, 2000-2016. J. Volcanology Geothermal Res. 358, 105–123. doi:10.1016/j.jvolgeores.2018.02.015
Macedonio, G., Dobran, F., and Neri, A. (1994). Erosion Processes in Volcanic Conduits and Application to the Ad 79 Eruption of Vesuvius. Earth Planet. Sci. Lett. 121, 137 – 152. doi:10.1016/0012-821X(94)90037-X
Macedonio, G., Neri, A., Martì, J., and Folch, A. (2005). Temporal Evolution of Flow Conditions in Sustained Magmatic Explosive Eruptions. J. Volcanology Geothermal Res. 143, 153 – 172. doi:10.1016/j.jvolgeores.2004.09.015
Mandeville, C. W., Carey, S., and Sigurdsson, H. (1996). Magma Mixing, Fractional Crystallization and Volatile Degassing during the 1883 Eruption of Krakatau Volcano, indonesia. J. Volcanology Geothermal Res. 74, 243–274. doi:10.1016/S0377-0273(96)00060-1
Marianelli, P., Sbrana, A., and Proto, M. (2006). Magma Chamber of the Campi Flegrei Supervolcano at the Time of Eruption of the Campanian Ignimbrite. Geol 34, 937–940. doi:10.1130/G22807A.1
Martí, J., Folch, A., Neri, A., and Macedonio, G. (2000). Pressure Evolution during Explosive Caldera-Forming Eruptions. Earth Planet. Sci. Lett. 175, 275 – 287. doi:10.1016/S0012-821X(99)00296-4
Melnik, O., and Costa, A. (2014). Chapter 3 Dual-Chamber-Conduit Models of Non-linear Dynamics Behaviour at Soufrière Hills Volcano, Montserrat. Geol. Soc. Lond. Mem. 39, 61–69. doi:10.1144/m39.3
Miller, C. F., and Wark, D. A. (2008). SUPERVOLCANOES AND THEIR EXPLOSIVE SUPERERUPTIONS. Elements 4, 11–15. doi:10.2113/GSELEMENTS.4.1.11
Miller, T. P., and Chouet, B. A. (1994). The 1989-1990 Eruptions of Redoubt Volcano: an Introduction. J. Volcanology Geothermal Res. 62, 1 – 10. doi:10.1016/0377-0273(94)90025-6
Murphy, M. D., Sparks, R. S. J., Barclay, J., Carroll, M. R., and Brewer, T. S. (2000). Remobilization of Andesite Magma by Intrusion of Mafic Magma at the Soufriere hills Volcano, montserrat, West Indies. J. Petrology 41, 21–42. doi:10.1093/petrology/41.1.21
Neri, A., Papale, P., and Macedonio, G. (1998). The Role of Magma Composition and Water Content in Explosive Eruptions: 2. Pyroclastic Dispersion Dynamics. J. Volcanology Geothermal Res. 87, 95 – 115. doi:10.1016/S0377-0273(98)00102-4
Orsi, G., Di Vito, M. A., Selva, J., and Marzocchi, W. (2009). Long-term Forecast of Eruption Style and Size at Campi Flegrei Caldera (italy). Earth Planet. Sci. Lett. 287, 265–276. doi:10.1016/j.epsl.2009.08.013
Pallister, J. S., Hoblitt, R. P., and Reyes, A. G. (1992). A basalt Trigger for the 1991 Eruptions of Pinatubo Volcano? Nature 356, 426–428. doi:10.1038/356426a0
Papale, P., and Dobran, F. (1994). Magma Flow along the Volcanic Conduit during the Plinian and Pyroclastic Flow Phases of the May 18, 1980, Mount St. Helens Eruption. J. Geophys. Res. 99, 4355–4373. doi:10.1029/93JB02972
Papale, P. (2001). Dynamics of Magma Flow in Volcanic Conduits with Variable Fragmentation Efficiency and Nonequilibrium Pumice Degassing. J. Geophys. Res. 106, 11043–11065. doi:10.1029/2000JB900428
Papale, P. (2018). Global Time-Size Distribution of Volcanic Eruptions on Earth. Sci. Rep. 8, 6838. doi:10.1038/s41598-018-25286-y
Papale, P., Marzocchi, W., and Garg, D. (2021). Global Volume Distribution for continental Volcanism on Earth. Under Review. J. Geophys. Res. doi:10.1029/2021jb021763
Papale, P., Moretti, R., and Barbato, D. (2006). The Compositional Dependence of the Saturation Surface of H2o+co2 Fluids in Silicate Melts. Chem. Geology 229, 78 – 95. doi:10.1016/j.chemgeo.2006.01.013
Papale, P., Neri, A., and Macedonio, G. (1998). The Role of Magma Composition and Water Content in Explosive Eruptions. J. Volcanology Geothermal Res. 87, 75–93. doi:10.1016/s0377-0273(98)00101-2
Papale, P. (1999). Strain-induced Magma Fragmentation in Explosive Eruptions. Nature 397, 425–428. doi:10.1038/17109
Pianosi, F., Beven, K., Freer, J., Hall, J. W., Rougier, J., Stephenson, D. B., et al. (2016). Sensitivity Analysis of Environmental Models: A Systematic Review with Practical Workflow. Environ. Model. Softw. 79, 214–232. doi:10.1016/j.envsoft.2016.02.008
Pianosi, F., and Wagener, T. (2015). A Simple and Efficient Method for Global Sensitivity Analysis Based on Cumulative Distribution Functions. Environ. Model. Softw. 67, 1–11. doi:10.1016/j.envsoft.2015.01.004
Pianosi, F., and Wagener, T. (2018). Distribution-based Sensitivity Analysis from a Generic Input-Output Sample. Environ. Model. Softw. 108, 197–207. doi:10.1016/j.envsoft.2018.07.019
Pioli, L., Erlund, E., Johnson, E., Cashman, K., Wallace, P., Rosi, M., et al. (2008). Explosive Dynamics of Violent Strombolian Eruptions: The Eruption of Parícutin Volcano 1943-1952 (Mexico). Earth Planet. Sci. Lett. 271, 359 – 368. doi:10.1016/j.epsl.2008.04.026
Pistolesi, M., Isaia, R., Marianelli, P., Bertagnini, A., Fourmentraux, C., Albert, P. G., et al. (2016). Simultaneous Eruptions from Multiple Vents at Campi Flegrei (Italy) Highlight New Eruption Processes at Calderas. Geology 44, 487–490. doi:10.1130/G37870.1
Pyle, D. M. (2015). Sizes of Volcanic Eruptions. In The Encyclopedia of Volcanoes (Second Edition), ed. H. Sigurdsson (Amsterdam: Academic Press). Second edition edn., 257 – 264. doi:10.1016/B978-0-12-385938-9.00013-4
Reuber, G. S., Kaus, B. J. P., Popov, A. A., and Baumann, T. S. (2018). Unraveling the Physics of the Yellowstone Magmatic System Using Geodynamic Simulations. Front. Earth Sci. 6, 117. doi:10.3389/feart.2018.00117
Reverso, T., Vandemeulebrouck, J., Jouanne, F., Pinel, V., Villemin, T., Sturkell, E., et al. (2014). A Two-Magma Chamber Model as a Source of Deformation at Grímsvötn Volcano, Iceland. J. Geophys. Res. Solid Earth 119, 4666–4683. doi:10.1002/2013jb010569
Saltelli, A., Aleksankina, K., Becker, W., Fennell, P., Ferretti, F., Holst, N., et al. (2019). Why So many Published Sensitivity Analyses Are False: A Systematic Review of Sensitivity Analysis Practices. Environ. Model. Softw. 114, 29–39. doi:10.1016/j.envsoft.2019.01.012
Samaniego, P., Pennec, L., Robin, L., and Hidalgo, S. (2011). Magma Mixing: a Mechanism for Triggering Acid Explosive Eruption. Nature 257, 315–318. doi:10.1038/267315a0
Silleni, A., Giordano, G., Isaia, R., and Ort, M. (2020). The Magnitude of the 39.8 Ka Campanian Ignimbrite Eruption, italy: Method, Uncertainties and Errors. Front. Earth Sci.
Sparks, S. R. J., Sigurdsson, H., and Wilson, L. (1977). Magma Mixing: a Mechanism for Triggering Acid Explosive Eruptions. Nature 267, 315–318. doi:10.1038/267315a0
Stix, J., Layne, G. D., and Williams, S. N. (2003). Mechanisms of degassing at nevado del ruiz volcano, colombia. J. Geol. Soc. 160, 507–521. doi:10.1144/0016-764902-028
Tepley, F. J., Tilling, R. I., Arth, J. G., and Arth, J. G. (2000). Magma Mixing, Recharge and Eruption Histories Recorded in Plagioclase Phenocrysts from El Chichón Volcano, Mexico. J. Petrology 41, 1397–1411. doi:10.1093/petrology/41.9.1397
Venezky, D. Y., and Rutherford, M. J. (1997). Preeruption Conditions and Timing of Dacite-Andesite Magma Mixing in the 2.2 Ka Eruption at mount rainier. J. Geophys. Res. 102, 20069–20086. doi:10.1029/97JB01590
Waite, G. P., and Moran, S. C. (2009). VP Structure of Mount St. Helens, Washington, USA, Imaged with Local Earthquake Tomography. J. Volcanology Geothermal Res. 182, 113–122. doi:10.1016/j.jvolgeores.2009.02.009
Keywords: volcanic eruption dynamics, magma chamber, magnitude of volcanic eruptions, volcanic calderas, volcanic super-eruptions
Citation: Colucci S and Papale P (2021) Deep Magma Transport Control on the Size and Evolution of Explosive Volcanic Eruptions. Front. Earth Sci. 9:681083. doi: 10.3389/feart.2021.681083
Received: 15 March 2021; Accepted: 17 May 2021;
Published: 31 May 2021.
Edited by:
Giuseppe La Spina, The University of Manchester, United KingdomReviewed by:
Oleg E. Melnik, Lomonosov Moscow State University, RussiaMichael Manga, University of California, Berkeley, United States
Copyright © 2021 Colucci and Papale. This is an open-access article distributed under the terms of the Creative Commons Attribution License (CC BY). The use, distribution or reproduction in other forums is permitted, provided the original author(s) and the copyright owner(s) are credited and that the original publication in this journal is cited, in accordance with accepted academic practice. No use, distribution or reproduction is permitted which does not comply with these terms.
*Correspondence: Simone Colucci, c2ltb25lLmNvbHVjY2lAaW5ndi5pdA==