 Seiji Tsuno
- Seismic Data Analysis Laboratory, Center for Railway Earthquake Engineering Research, Railway Technical Research Institute, Tokyo, Japan
In this study, the on-site P-wave earthquake early warning (EEW) based on the site-specific spectral ratio of S-wave to P-wave to efficiently incorporate the site characteristics, which can potentially issue the earthquake warning by the time of Ts-p, was developed. The spectral ratio of S-wave to P-wave that are related to the source effects, the path effects, and the site effects are significantly affected by the site effects contrast to the source effects and the path effects in practical. At first, the on-site P-wave EEW method which multiplies a site-specific spectral ratio of S-wave to P-wave prepared in advance by P-wave observed in the real-time at seismic stations is applied to seismic data for moderate-sized earthquakes with a magnitude (Mj) of 5.0–6.0, occurred in the eastern Japan, observed at both the sedimentary basin site and the rock site. As a result, this method predicted well the observed S-wave in the single indicator of SI within the logarithmic standard deviation of 0.25 as well as in the frequency of more than 0.5 Hz. It is, also, confirmed that the site-specific spectral ratio of S-wave to P-wave at a seismic station was stably retrieved from 20 data samples at least. To investigate the applicability of this method to earthquake ground motions induced by a large-scaled earthquake, finally, this method is applied to seismic data during the 2011 off the Pacific coast of Tohoku earthquake, Japan (Mw 9.0). The prediction of S-wave using a time-window of 10 s after P-wave arrived, could not reproduce the observation with the underestimation; however, the prediction of S-wave using a time-window of more than 20 s containing P-wave propagated from an area generating strong motions in the fault, could reproduce the observation. Even in the case of the large-scaled earthquake, the on-site P-wave EEW method based on the site-specific spectral ratio of S-wave to P-wave at a seismic station availably works by using the gradually increasing time-windows after P-wave arrived in the single indicator of SI as well as in the frequency content, avoiding the mixture of S-wave into a part of P-wave.
Introduction
Earthquake Early Warning (EEW) systems are installed to many fields in the world based on their own concepts to provide warning prior to the strength of ground shaking (e.g., Allen et al., 2009). The on-site EEW methods, which estimate the strength of ground shaking at the same location by generally using a begging part immediately after the arrival of P-wave, have been developed (e.g., Nakamura, 1988; Allen and Kanamori, 2003; Odaka et al., 2003; Wu and Kanamori, 2005; Wu et al., 2007). On-site EEW methods, which can be operated by a single station and/or a seismic network, are based on the empirical relationships between an amplitude of P-wave and a strength of ground shaking (Wu and Kanamori, 2005), or based on the estimation of an earthquake magnitude (Nakamura, 1988; Allen and Kanamori, 2003; Wu et al., 2007) and an epicentral distance (Odaka et al., 2003) to rapidly predict the strength of ground shaking. Recently, the real-time ground motion prediction using the observed data at front stations in the direction of incoming seismic waves have been developed (e.g., Hoshiba, 2013; Hoshiba and Aoki, 2015; Yang and Motosaka, 2015). However, especially for the on-site EEW method operated by a single station, data recorded in the real-time by a dense seismic network is quite useful, and it is desirable that site characteristics are efficiently incorporated to the method to reflect the difference of the strength of ground shaking in the sites.
In the field of railway, Japan, on-site EEW using P-wave (Nakamura, 1988; Odaka et al., 2003) has been developed to stop the train quickly during the occurrence of earthquakes. At the same time, the own dense seismic network has been installed with the interval distance of 5–40 km and about 100 km along railway lines and coast lines respectively, especially in the eastern Japan (Nakamura, 1988; Nakamura, 1996; Miyakoshi et al., 2019). Recently, after the 2011 off the Pacific coast of Tohoku earthquake (Mw 9.0) occurred at the plate boundary of the Pacific plate subducting beneath Tohoku-Japan, seismic stations were installed with the interval distance of 50 km inland in the eastern Japan (Yamamoto and Tomori, 2013).
Miyakoshi and Tsuno (2015) illustrated the relationships between P-wave at the basement and S-wave at the ground surface with the empirical estimations for the physical parameters, using seismic data of KiK-net observed in the Kanto basin, Japan. Tsuno and Miyakoshi (2019) developed the relationships between P-wave at the ground surface and S-wave at the ground surface by interpreting the deconvolution of the transfer function of the P-wave and the convolution of the transfer function of the S-wave with the seismic data observed in the Kanto Region. In this study, the availability of an on-site P-wave EEW based on the site-specific spectral ratio of S-wave to P-wave at a seismic station, which directly predicts S-wave from P-wave (e.g. Miyakoshi and Tsuno, 2015; Tsuno and Miyakoshi, 2019; Zhao and Zhao, 2019) without any estimation of an earthquake magnitude and an epicentral distance was quantitatively examined by applying to seismic data in the Tohoku Region for moderate-sized earthquakes with a magnitude (Mj) of 5.0–6.0, occurred in the eastern Japan. Finally, the applicability of this method to seismic data for the large-scaled earthquake of the 2011 off the Pacific coast of Tohoku earthquake (Mw 9.0), Japan was investigated.
Data
Seismic data recorded at KS and SS stations respectively installed in the rock site and in the sedimentary basin site in the Tohoku Region, Japan by JR East, were used. As for geophysical information around the seismic stations, AVS30 (Aaverage Velocity of S-wave up to a depth of 30 m) at KS station located in Ayukawa, Miyagi Pref. is about 470 m/s and that at SS station located in Shin-Nagamachi, Miyagi Pref. is about 290 m/s, as shown by J-SHIS (Japan Seismic Hazard Information Station). Seismic data of moderate-sized earthquakes with a magnitude (Mj) of 5.0–6.0, occurred in the eastern Japan for a period from November/2007 to August/2018 and the mainshock of the 2011 off the Pacific coast of Tohoku earthquake (Mw 9.0) were analyzed in this study. As for moderate earthquakes, 58 and 95 earthquakes with high signal-to-noise ratio at KS and SS stations respectively were selected. Location of epicenters and seismic stations used in this study are shown in Figure 1. Information of PGAs, PGVs, and the peak frequency in the seismic data of the moderate-sized earthquakes with a magnitude (Mj) of 5.0–6.0 at KS and SS stations are shown with those of the 2011 off the Pacific coast of Tohoku earthquake (Mw 9.0) in Figure 2. As an example, waveforms of acceleration for 3 components during an earthquake (Mj 5.9) occurred on 11th/April 2011 are shown in Figure 3.
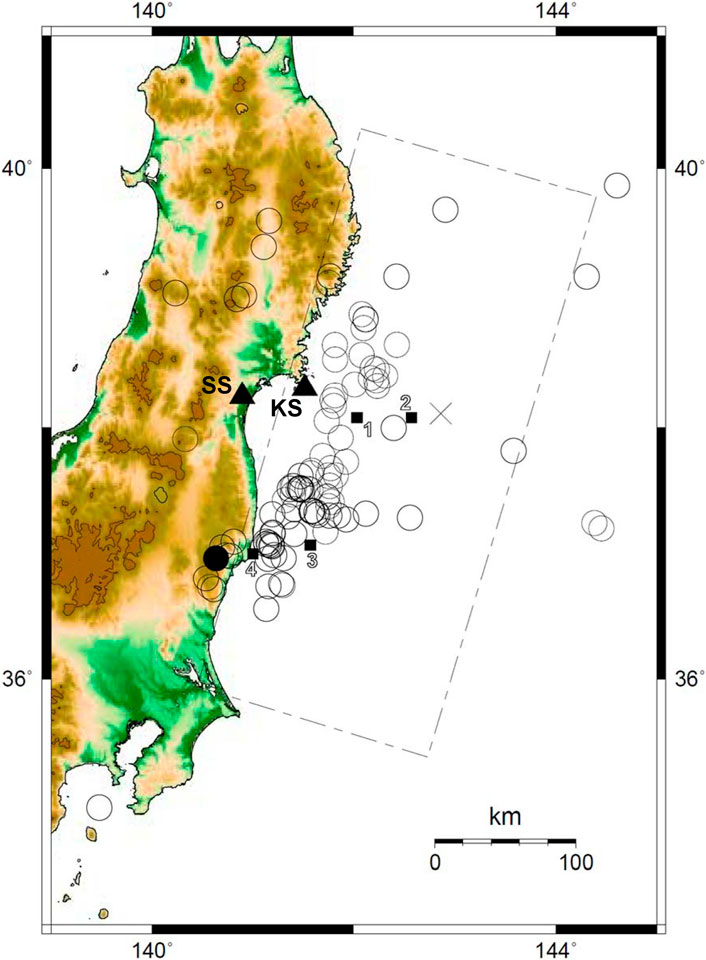
FIGURE 1. Location of epicenters for moderate-sized earthquakes and seismic stations used in this study. Open circles show the location of epicenters for the moderate-sized earthquakes with a magnitude (Mj) of 5.0–6.0 for a period from November/2007 to August/2018 and, closed triangles show the location of seismic stations. A closed circle shows location of epicenter for an earthquake (Mj 5.9) occurred on 11th/April 2011. The earthquake source fault plane of the 2011 off the Pacific coast of Tohoku earthquake (Mw 9.0) occurred on 11th/March 2011 by Suzuki et al. (2011) and the hypocenter by JMA is also shown with a broken rectangle and a diagonal cross, respectively. Closed rectangles show location of epicenters for the strong motion generation areas (SMGAs of M7-class events) estimated by Asano and Iwata (2012).
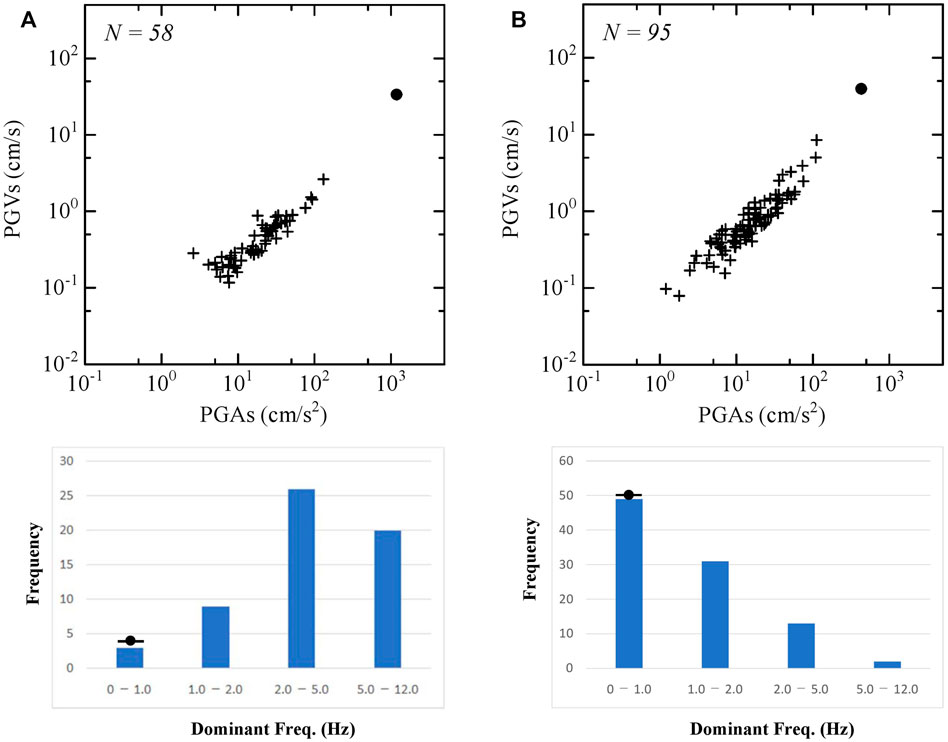
FIGURE 2. Information of PGAs, PGVs, and the peak frequency in the seismic data used in this study. N in the figures indicates the number of earthquakes used. Crosses and a circle in the figure of PGAs and PGVs at KS and SS stations show data of the moderate-sized earthquakes with a magnitude (Mj) of 5.0–6.0 and data of the 2011 off the Pacific coast of Tohoku earthquake (Mw 9.0), respectively. Histograms of the dominant frequency (Hz) for data of the moderate-sized earthquakes observed at KS and SS stations are shown with that of the 2011 off the Pacific coast of Tohoku earthquake (Mw 9.0) by a circle in the figure. (A) KS station (B) SS station.
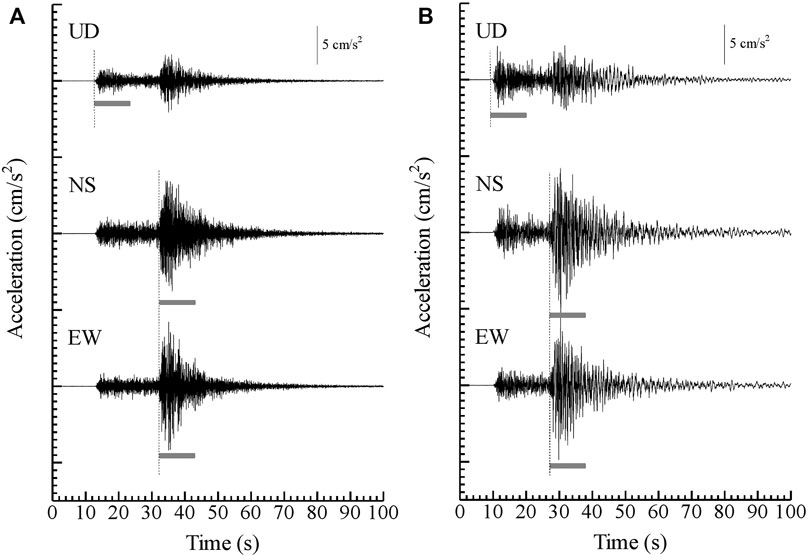
FIGURE 3. Waveforms of acceleration for 3 components during an earthquake (Mj 5.9) occurred on 11th/April 2011 observed at KS and SS stations. Broken lines show an onset of P-wave for UD component and onsets of S-wave for NS and EW components. Under lines show a time-window of 10.24 s for each component, to estimate a spectral ratio of S-wave to P-wave. (A) KS station (B) SS station.
On-Site P-Wave Earthquake Early Warning
Method
Assuming an earthquake ground motion observed in a far field induced by a double couple point source, the earthquake ground motions of P-wave and S-wave at the basement in the frequency domain are expressed, as follows (e.g. Iwata and Irikura, 1986; Aki and Richard, 2002).
Here, ω is an angular frequency, ρ and V is a density and a velocity of body waves in and around an earthquake source region, r is distance from an earthquake source, Rθϕ is a radiation coefficient, Ω (ω) is an earthquake source spectrum and Q is an internal attenuation in the crust. V′ is the average velocity of body waves in the crust. The subscripts of P and S represent P-wave and S-wave, respectively. The subscript of b, also, represents the basement.
In the logarithmic ratio of Eqs. 1, 2, the relationships between the S-wave at the basement and the P-wave at the basement is expressed by the following equations.
a1(ω) includes the influence of the source effect and the path effect, which are VP/VS around an earthquake source region, the ratio of the S-wave radiation coefficient to that of the P-wave, and the internal attenuation of the P-wave and S-wave propagating in the crust.
The relationships between the P-wave at the basement and P-wave at the ground surface, and between the S-wave at the basement and S-wave at the ground surface are expressed using the transfer functions GP(ω) and GS(ω) based on the P-wave and S-wave subsurface structures from the basement to the ground surface, as follows.
The subscript of s represents the ground surface.
In the logarithm of Eqs. 5, 6, a2(ω) and a3(ω) which includes the influence of the site effect related to the P-wave and the S-wave subsurface structures respectively, are expressed by the following equations.
Finally, the relationships between the P-wave at the surface and the S-wave at the surface from Eqs. 3, 7, 8 is expressed by the following equations.
b(ω) includes the influence of the source effect, the path effect, and the site effect (Tsuno and Miyakoshi, 2019). In practically, b(ω) is estimated from a spectral ratio of S-wave to P-wave using seismic data observed at the ground surface at a seismic station. Miyakoshi and Tsuno (2015) investigated the relationships between P-wave at the basement and S-wave at the ground surface, by the theoretical technique, the empirical formulas, and observation data. As a result, Miyakoshi and Tsuno (2015) concluded that the spectral ratio of S-wave at the ground surface to P-wave at the basement was significantly affected by the site effects contrast to the source effects and the path effects.
The method of on-site P-wave EEW directly predicts S-wave by multiplying a site-specific spectral ratio of S-wave to P-wave prepared in advance by P-wave observed in the real-time at a seismic station, as expressed by the Eq. 11 in the frequency domain with a logarithm (Tsuno and Miyakoshi, 2019; Zhao and Zhao, 2019). Therefore, this method using P-wave can significantly reduce the time of Ts-p to issue the warning than the previous method mainly using S-wave. Specifically, S-wave was predicted in the frequency domain, by using P-wave as shown in Figure 3 with an underline for UD component.
Site-specific Ratio of S-Wave to P-Wave Observed
A site-specific spectral ratio of S-wave to P-wave for Fourier spectrum and pseudo-velocity response spectrum (a damping coefficient of 20%), and a site-specific ratio of S-wave to P-wave for SI (Spectral Intensity; Housner, 1965) using seismic data of moderate-sized earthquakes at KS and SS stations as shown in Figure 1 were estimated. SI is calculated by averaging velocity response with a damping coefficient of 20% from a period of 0.1–2.5 s. At first, onsets of P-wave and S-wave for all the data were visually read as shown in Figure 3. Fourier spectrum and pseudo-velocity response spectrum of S-wave in horizontal components and P-wave in a vertical component without a smoothing process were calculated using time-windows of 10.24 s after the onsets. The time of Ts-p in the seismic data used was sufficiently secured to avoid mixing S-wave into a part of P-wave, which means the time of Ts-p is longer than 10.24 s in this study. Spectral ratios of S-wave to P-wave were calculated by dividing the Fourier spectrum and pseudo-velocity response spectrum of S-wave which is the arithmetic mean for the NS component and the EW component, by those of P-wave for the UD component. Finally, the spectral ratios of S-wave to P-wave and SI ratio of S-wave to P-wave were averaged by those for all the seismic data at each seismic station.
Estimated site-specific spectral ratios, response spectral ratios, and SI ratios of S-wave to P-wave for a time-window of 10.24 s at KS and SS stations are shown in Figures 4–6 with a plus and a minus of one standard deviation, respectively. The spectral ratio of S-wave to P-wave at the ground surface was significantly affected by the subsurface velocity structure and therefore, the spectral ratio of S-wave to P-wave at SS station in the sedimentary basin site had a large amplification in a wide frequency range of 0.3–10 Hz. On the other hand, the spectral ratio of S-wave to P-wave at KS station in the rock site had a large amplification in a frequency range of 3–10 Hz, especially it had the peak at the high frequency of around 10 Hz. The negative value for the spectral ratio of S-wave to P-wave in the frequency indicates that site amplification of P-wave is larger than that of S-wave as shown in the Eq. 12. Site-specific response spectral ratios have a more smoothed tendency than site-specific spectral ratios in the frequency/period domain without the negative value. Site-specific SI ratios of S-wave to P-wave are 6 and 4.5 at KS and SS stations, respectively.
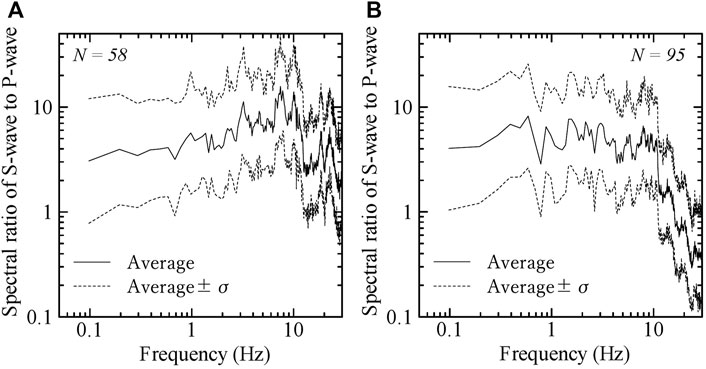
FIGURE 4. Estimated site-specific spectral ratios of S-wave to P-wave for a time-window of 10.24 s at KS and SS stations. N in the figures indicates the number of earthquakes used. (A) KS station (B) SS station.
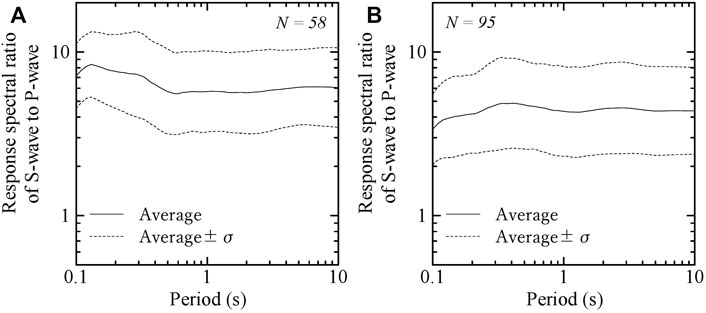
FIGURE 5. Estimated site-specific response spectral ratios of S-wave to P-wave for a time-window of 10.24 s at KS and SS stations. N in the figures indicates the number of earthquakes used. (A) KS station (B) SS station.
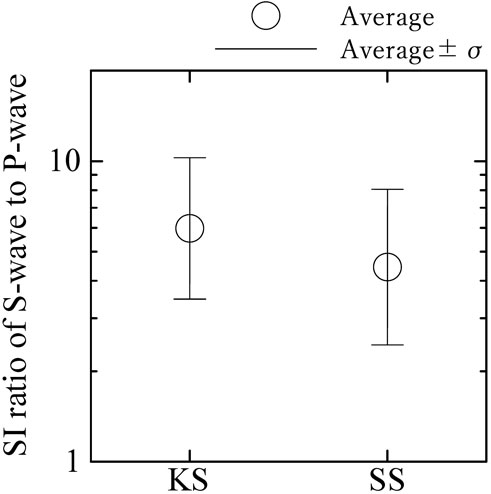
FIGURE 6. Estimated site-specific SI ratios of S-wave to P-wave for a time-window of 10.24 s at KS and SS stations.
A stability of site-specific spectral ratio of S-wave to P-wave, using seismic data with the different number of datasets was examined. RMS (Root Mean Square) between the spectral ratio of S-wave to P-wave using seismic data to the full datasets, for KS and SS stations is shown in Figure 7. The number of full datasets is 58 and 95 for KS and SS stations, respectively. In general, as the number of datasets increases, the spectral ratio becomes stable. In this study, RMS becomes stable enough by 40 and 20 data samples for KS and SS stations, respectively.
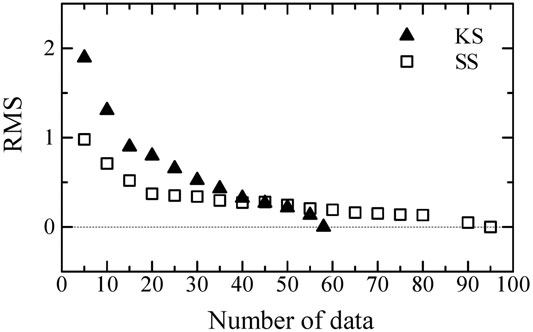
FIGURE 7. RMS between the spectral ratio of S-wave to P-wave using seismic data to the full datasets, for KS and SS stations. The number of full datasets is 58 and 95 for KS and SS stations, respectively.
Prediction of S-Wave From P-Wave in the Real-Time
S-wave was predicted by multiplying the site-specific spectral ratio of S-wave to P-wave prepared in advance by P-wave observed in the real-time at each seismic station, using the Eq. 11. As an example, Fourier spectra of S-wave for the earthquake of Mj 5.9, occurred on 11th/April 2011 at KS and SS stations whose accelerations are shown in Figure 3, predicted by this method were shown in Figure 8. Predicted Fourier spectrum of S-wave was in good agreement to the observed with the dominant frequency of about 10 Hz for the earthquake at KS station. On the other hand, predicted Fourier spectrum of S-wave was in good agreement to the observed with the dominant frequency of 1–2 Hz for the earthquake at SS station. The on-site P-wave EEW method could well explain Fourier spectrum of the S-wave in the frequency of more than 0.5 Hz at both KS and SS stations in which the site conditions are different. However, this method could not well explain Fourier spectrum of the S-wave in the frequency of less than 0.5 Hz. Miyakoshi and Tsuno (2015) pointed out that the spectral ratio of S-wave to P-wave at the basement is relatively affected by both the source effects and the path effects in the low frequency and in the high frequency, respectively. Even at the ground surface, therefore, the difference between the observation and the prediction in the low frequency are caused by the influence of the radiation coefficient in a1(ω) of the Eq. 4. Pseudo-velocity response spectra (a damping coefficient of 20%) of S-wave for the earthquake of Mj 5.9, occurred on 11th/April 2011 at KS and SS stations whose accelerations are shown in Figure 3, predicted by this method were shown in Figure 9, with the average ± the standard deviation. The predicted response spectra of S-wave were in good agreement to those observed in periods of 0.1–10 s at both KS and SS stations, indicating the observations mostly within the average ± one standard deviation of the predictions. Predicted SIs of S-wave for all the earthquakes at KS and SS stations against those observed are shown in Figure 10. The predictions of SI of S-waves were in good agreements with the observations within the logarithmic standard deviation of 0.25.
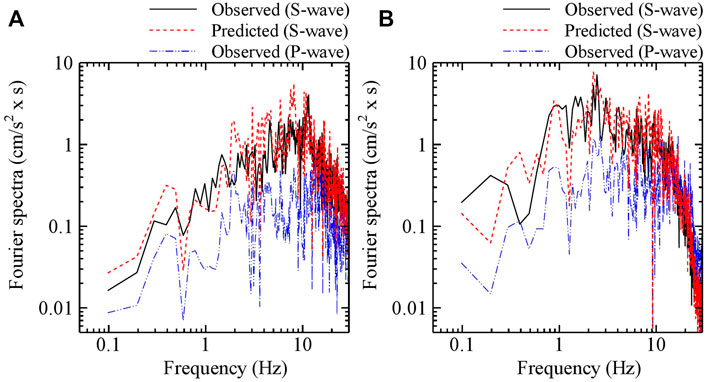
FIGURE 8. Predicted Fourier spectra of S-wave for the earthquake of Mj 5.9 on 11th/April 2011 at KS and SS stations whose accelerations are shown in Figure 3. Observed Fourier spectra of P-wave for the earthquake are also shown. (A) KS station (B) SS station.
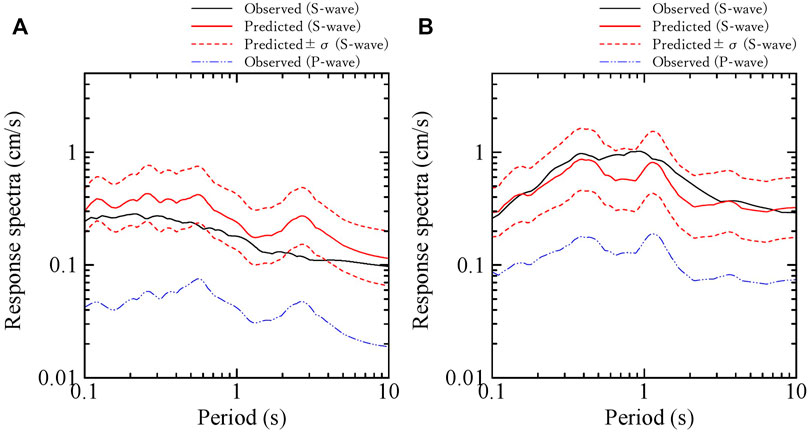
FIGURE 9. Predicted pseudo-velocity response spectra (a damping coefficient of 20%) of S-wave for the earthquake of Mj 5.9 on 11th/April 2011 at KS and SS stations whose accelerations are shown in Figure 3, with the average ± the standard deviation. Observed pseudo-velocity response spectra of P-wave for the earthquake are also shown. (A) KS station (B) SS station.
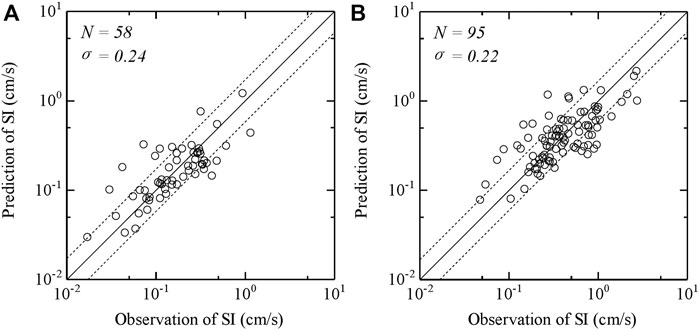
FIGURE 10. Predicted SIs of S-wave for all the earthquakes at KS and SS stations against those observed. N and σ in the figures indicate the number of earthquakes and one logarithmic standard deviation, respectively. (A) KS station (B) SS station.
It was indicated that the on-site P-wave EEW method, based on the site-specific spectral ratio of S-wave to P-wave can predict the observed S-wave in the single indicator of SI as well as in the frequency/period content for the moderate-sized earthquakes.
Application of the On-Site P-Wave EEW Method to the 2011 off the Pacific Coast of Tohoku Earthquake
The applicability of the on-site P-wave EEW method to seismic data observed at KS and SS stations, during the 2011 off the Pacific coast of Tohoku earthquake (Mw 9.0), Japan was investigated. Waveforms of acceleration for 3 components during the 2011 off the Pacific coast of Tohoku earthquake (Mw 9.0) occurred on 11th/March 2011 observed at KS and SS stations are shown Figure 11.
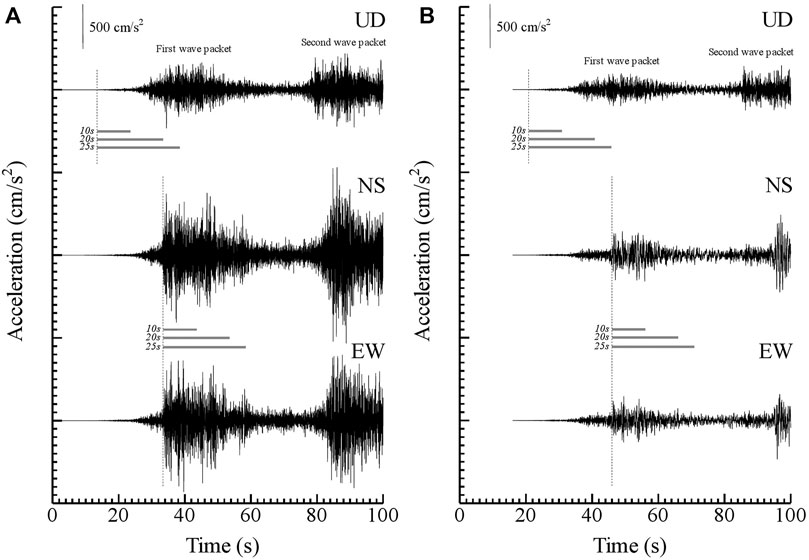
FIGURE 11. Waveforms of acceleration for 3 components during the 2011 off the Pacific coast of Tohoku earthquake (Mw 9.0) occurred on 11th/March 2011 observed at KS and SS stations. Broken lines show onsets of P-wave for UD component and S-wave for NS and EW components. Under lines show time-windows of 10, 20, and 25 s for each component. The first and second wave packet are generated by different the strong motion generation areas (SMGAs) estimated by Asano and Iwata (2012). (A) KS station (B) SS station.
In the real-time, S-waves were predicted by multiplying the site-specific spectral ratio of S-wave to P-wave prepared in advance (See Figure 4) by the different time-windows of 10, 20, and 25 s after P-wave arrived. Predicted Fourier spectra of S-wave for time-windows of 10, 20, and 25 s at KS and SS stations were shown in Figures 12, 13, respectively. As a result, the S-wave predicted for the 2011 off the Pacific coast of Tohoku earthquake, using the time-window of 10 s in P-wave after P-wave arrived, could not reproduce the S-wave observed with the underestimation at both KS and SS stations. On the other hand, the S-wave predicted using the time-windows of 20 and 25 s in P-wave could reproduce the S-wave observed at both KS and SS stations. It was point out that an area generating strong motions in the earthquake source fault differed from an area which the fault rupture started in the large-scaled earthquake event. To directly predict S-wave from P-wave observed in the real-time, therefore, a time-window containing P-wave induced by an area generating strong motions in the fault is necessary to be analyzed. As for strong motion generation areas (SMGAs) for the 2011 off the Pacific coast of Tohoku earthquake as shown in Figure 1, (Asano and Iwata, 2012) reported that two strong motion generation areas (SMGA1 and SMGA2) are identified in the Miyagi-oki region west of the hypocenter and another two strong motion generation areas (SMGA3 and SMGA4) are in the Fukushima-oki region southwest of the hypocenter. Also, they indicated that the strong ground motions in the frequency range 0.1–10 Hz along the Pacific coast are mainly controlled by these SMGAs of M7-class events existing in the deeper portion of the source fault plane. In their results, the strong ground motions observed in Miyagi Pref. where the KS and SS stations are located, are significantly affected by SMGA1 (Length: 36 km, width: 36 km, rise time: 6.9 s, and rupture velocity: 4 km/s) and SMGA2 (Length: 36 km, width: 36 km, rise time: 6.9 s, and rupture velocity: 4 km/s). Specially, the first and the second wave packets of strong ground motions observed at the KS and SS stations as shown in Figure 11 are generated by SMGA1 and SMGA2, respectively (Asano and Iwata, 2012). To accurately predict the amplitude of S-wave by P-wave observed in the real-time during the 2011 off the Pacific coast of Tohoku earthquake, it is necessary that strong ground motions generated by SMGA1 is contained in the observed P-wave. In this study, the time-window of 20 s in a UD component after P-wave arrived at KS and SS stations includes strong ground motions generated by SMGA1 at least. Therefore, the S-wave predicted using the time-windows of 20 and 25 s in P-wave could reproduce the S-wave observed at both KS and SS stations.
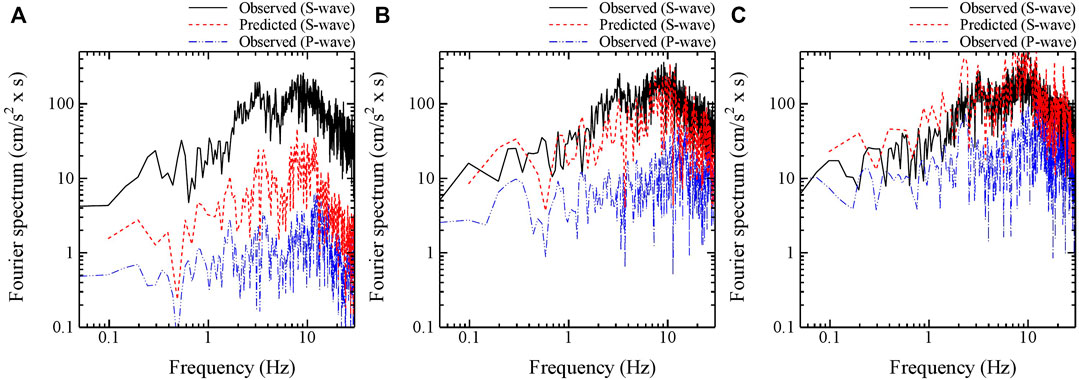
FIGURE 12. Predicted Fourier spectra of S-wave for time-windows of 10, 20, and 25 s during the 2011 off the Pacific coast of Tohoku earthquake (Mw 9.0) at KS station. (A) Time-window of 10 s (B) Time-window of 20 s (C) Time-window of 25 s.
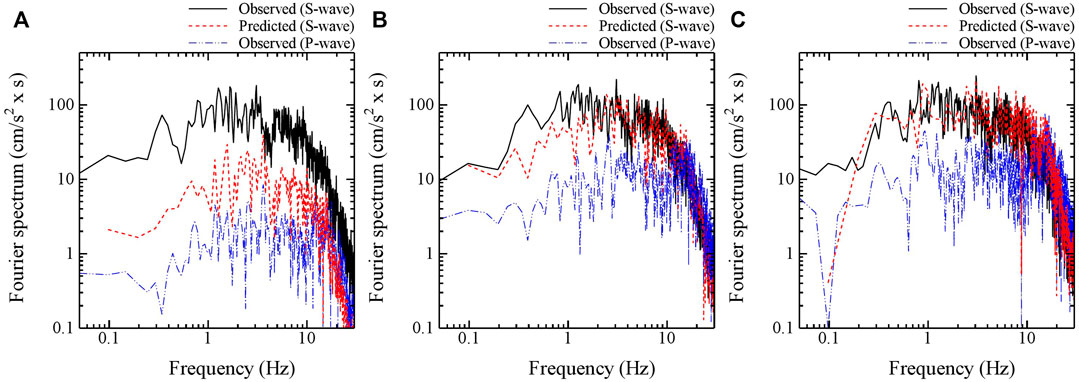
FIGURE 13. Predicted Fourier spectra of S-wave for time-windows of 10, 20, and 25 s during the 2011 off the Pacific coast of Tohoku earthquake (Mw 9.0) at SS station. (A) Time-window of 10 s (B) Time-window of 20 s (C) Time-window of 25 s.
On the other hand, the discrepancy between the S-wave observed and the S-wave predicted even using the appropriate time-windows in P-wave at KS and SS stations is larger in the low frequency than in the high frequency caused by the source effects, as shown in Figures 12B, 13C. It might be caused by that the prediction of S-wave for this large-scaled earthquake (Mw 9.0) which significantly affected the ground motions in the low frequency, was performed by the site-specific spectral ratio of S-wave to P-wave using seismic data of moderate-sized earthquakes with a magnitude (Mj) of 5.0–6.0.
Discussion
In the real-time, SI of S-wave by multiplying the site-specific spectral ratio of SI prepared in advance (See Figure 6) by SI of P-wave observed were predicted. The predicted SI of S-wave and the observed SI of S-wave with the time interval of one second until the time that S-wave arrived at each KS and SS stations during the 2011 off the Pacific coast of Tohoku earthquake is shown in Figure 14. The predicted SI of S-wave is gradually increasing until S-wave for the first wave packet arrives at each KS and SS stations. The values of the predicted SI immediately before S-wave for the first wave packet arrives reproduce well the maximum values of S-wave observed at both KS and SS stations. On the other hand, the lead time from the last prediction to the arrival of S-wave is not sufficient at KS station, because SMGA1 generating the strong ground motions for the first wave packet which is in the Miyagi-oki region west of the hypocenter, is close to KS station. At SS station which is located to more inland than KS station, however, the lead time of 10 s could be earned by this on-site P-wave EEW method.
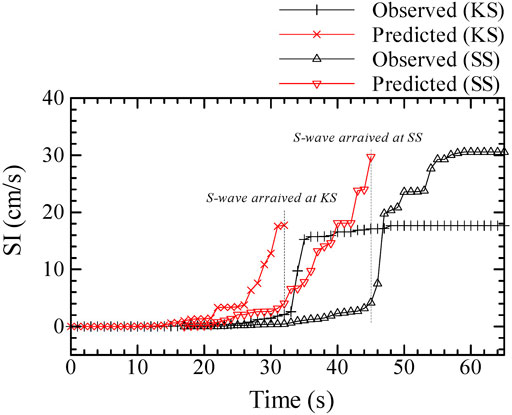
FIGURE 14. Predicted SI of S-wave and observed SI of S-wave with the time interval of one second during the 2011 off the Pacific coast of Tohoku earthquake (Mw 9.0) at KS and SS stations. Predicted SI of S-wave by using P-wave in the real-time, is shown until the time that S-wave arrived at each KS and SS station.
Even in the case of the large-scaled earthquake, the on-site P-wave EEW method availably works by using the gradually increasing time-windows after P-wave arrived in the single indicator of SI as well as in the frequency content. Note that in principle, this method can be applied to P-wave observed in the real-time until S-wave arrives. In case of mixing S-wave into a part of P-wave, the prediction overestimated the observation, as the predicted Fourier spectra of S-wave for the time-windows of 25 s after P-wave arrived at KS station shown in Figure 12C.
Conclusions
In this study, at first, the on-site P-wave EEW method which multiplies a site-specific spectral ratio of S-wave to P-wave prepared in advance by P-wave observed in the real-time at seismic stations is applied to seismic data for moderate-sized earthquakes with a magnitude (Mj) of 5.0–6.0, occurred in the eastern Japan, observed at both the sedimentary basin site and the rock site. As a result, this method predicted well the observed S-wave in the single indicator of SI within the logarithmic standard deviation of 0.25 as well as in the frequency of more than 0.5 Hz. It is, also, confirmed that the site-specific spectral ratio of S-wave to P-wave at a seismic station was stably retrieved from 20 data samples at least. To investigate the applicability of this method to earthquake ground motions induced by a large-scaled earthquake, finally, this method is applied to seismic data during the 2011 off the Pacific coast of Tohoku earthquake, Japan (Mw 9.0). The prediction of S-wave using a time-window of 10 s after P-wave arrived, could not reproduce the observation with the underestimation; however, the prediction of S-wave using a time-window of more than 20 s containing P-wave propagated from an area generating strong motions in the fault, could reproduce the observation. Even in the case of the large-scaled earthquake, the on-site P-wave EEW method based on the site-specific spectral ratio of S-wave to P-wave at a seismic station availably works by using the gradually increasing time-windows after P-wave arrived in the single indicator of SI as well as in the frequency content, avoiding the mixture of S-wave into a part of P-wave.
Practically, this on-site P-wave EEW will be installed with the regional EEW (Odaka et al., 2003) in the field of railway, Japan, to further improve the safety from earthquakes. The threshold levels for the single indicators to issue earthquake early warning is empirically set on around less than 10 cm/s in SI and/or less than 100 cm/s2 in PGA and therefore, the nonlinearity of the soft soil at the surface layers is not necessary to be considered from a practical point of view. As the future work, however, the influence of nonlinearity of the soft soil at the surface layers should be investigated to accurately predict earthquake ground motions in the case of strong ground motions. Also, the effects of 2-D and 3-D irregularity of the sedimentary basin should be investigated as well as the nonlinearity of the soft soil at the surface layers.
Data Availability Statement
The data analyzed in this study is subject to the following licenses/restrictions: Original data is provided by JR-East. ST has the results processed in this study. Requests to access these datasets should be directed to Seiji Tsuno, tsuno.seiji.75@rtri.or.jp.
Author Contributions
ST analyzed the seismic data. ST drafted the manuscript.
Conflict of Interest
The author declares that the research was conducted in the absence of any commercial or financial relationships that could be construed as a potential conflict of interest.
Publisher’s Note
All claims expressed in this article are solely those of the authors and do not necessarily represent those of their affiliated organizations, or those of the publisher, the editors and the reviewers. Any product that may be evaluated in this article, or claim that may be made by its manufacturer, is not guaranteed or endorsed by the publisher.
Acknowledgments
Seismic data recorded at two seismic stations maintained by JR-East were used. The geophysical information of a site condition in J-SHIS by NIED (National Research Institute for Earth Science and Disaster Resilience) at seismic stations were used. Location of hypocenters for the moderate-sized earthquakes with a magnitude (Mj) of 5.0–6.0 and the 2011 off the Pacific coast of Tohoku earthquake estimated by JMA (Japan Meteorological Agency) were used. We also thank two reviewers for their comments and suggestions, which significantly contributed to improving the quality of this paper.
References
Aki, K., and Richard, P. G. (2002). Quantitative Seismology. 2nd Edition. Sausalito, CA: University Science Books.
Allen, R. M., Gasparini, P., Kamigaichi, O., and Böse, M. (2009). The Status of Earthquake Early Warning Around the World: An Introductory Overview. Seismological Res. Lett. 80, 682–693. doi:10.1785/gssrl.80.5.682
Allen, R. M., and Kanamori, H. (2003). The Potential for Earthquake Early Warning in Southern California. Science 300, 786–789. doi:10.1126/science.1080912
Asano, K., and Iwata, T. (2012). Source Model for strong Ground Motion Generation in the Frequency Range 0.1-10 Hz during the 2011 Tohoku Earthquake. Earth Planet. Sp 64, 1111–1123. doi:10.5047/eps.2012.05.003
Hoshiba, M., and Aoki, S. (2015). Numerical Shake Prediction for Earthquake Early Warning: Data Assimilation, Real‐Time Shake Mapping, and Simulation of Wave Propagation. Bull. Seismological Soc. America 105 (3), 1324–1338. doi:10.1785/0120140280
Hoshiba, M. (2013). Real-time Prediction of Ground Motion by Kirchhoff-Fresnel Boundary Integral Equation Method: Extended Front Detection Method for Earthquake Early Warning. J. Geophys. Res. Solid Earth 118, 1038–1050. doi:10.1002/jgrb.50119
Housner, G. W. (1965). “Intensity of Earthquake Ground Shaking Near the Causative Fault,” in Proceeding of the 3rd World Conf. Earthq. Eng., New Zealand, January 1, 1965, 94–115.
Iwata, T., and Irikura, K. (1986). Separation of Source, Propagation and Site Effects from Observed S-Waves. Jssj 239, 579–593. doi:10.4294/zisin1948.39.4_579
Miyakoshi, H., Tsuno, S., Chimoto, K., and Yamanaka, H. (2019). Spatial Variation of S-Wave Site Amplification Factors Estimated Using Observed Ground Motion Data in the Tokyo Metropolitan Area. J. Seismology 23 (I-34), 1–18. doi:10.1190/segj2018-130.1
Miyakoshi, H., and Tsuno, S. (2015). Influence of the Source, Path, and Site Effects on the Relationship between P-Waves at the Seismic Bedrock and S-Waves on the Ground Surface. Jssj 68, 91–105. doi:10.4294/zisin.68.91
Nakamura, Y. (1988). “On the Urgent Earthquake Detection and Alarm System (UrEDAS),” in Proc. of 9th World Conference on Earthquake Engineering, Tokyo-Kyoto, Japan, Aug 2-9, 1988, 673–678.
Nakamura, Y. (1996). Research and Development of Intelligent Earthquake Disaster Prevention Systems UrEDAS and HERAS. Doboku Gakkai Ronbunshu 1996, 1–33. doi:10.2208/jscej.1996.531_1
Odaka, T., Ashiya, K., Sato, S., Ohtake, K., and Nozaka, D. (2003). A New Method of Quickly Estimating Epicentral Distance and Magnitude from a Single Seismic Record. Bull. Seismological Soc. America 93, 526–532. doi:10.1785/0120020008
Suzuki, W., Aoi, S., Sekiguchi, H., and Kunugi, T. (2011). Rupture Process of the 2011 Tohoku-Oki Mega-Thrust Earthquake (M9.0) Inverted from strong-motion Data. Geophys. Res. Lett. 38, a–n. doi:10.1029/2011GL049136
Tsuno, S., and Miyakoshi, H. (2019). Investigation of Earthquake Warning for the Threshold of P-Wave, Using an Amplitude Ratio of S-Wave to P-Wave. J. JAEE 19 (6), 105–106. doi:10.5610/jaee.19.6_105
Wu, Y.-M., Kanamori, H., Allen, R. M., and Hauksson, E. (2007). Determination of Earthquake Early Warning Parameters, τc and Pd, for Southern California. Geophys. J. Int. 170, 711–717. doi:10.1111/j.1365-246x.2007.03430.x
Wu, Y.-M., and Kanamori, H. (2005). Rapid Assessment of Damage Potential of Earthquakes in Taiwan from the Beginning of P Waves. Bull. Seismological Soc. America 95, 1181–1185. doi:10.1785/0120040193
Yamamoto, S., and Tomori, M. (2013). Earthquake Early Warning System for Railways and its Performance. J. JSCE 1, 322–328. doi:10.2208/journalofjsce.1.1_322
Yang, Y., and Motosaka, M. (2015). Ground Motion Estimation Using Front Site Wave Form Data Based on RVM for Earthquake Early Warning. J. Disaster Res. 10 (4), 667–677. doi:10.20965/jdr.2015.p0667
Keywords: on-site EEW, P-wave, site-specific ratio, prediction of S-wave, real-time, the 2011 off the Pacific coast of Tohoku earthquake, Tohoku region
Citation: Tsuno S (2021) Applicability of On-Site P-Wave Earthquake Early Warning to Seismic Data Observed During the 2011 Off the Pacific Coast of Tohoku Earthquake, Japan. Front. Earth Sci. 9:681199. doi: 10.3389/feart.2021.681199
Received: 16 March 2021; Accepted: 22 October 2021;
Published: 09 November 2021.
Edited by:
Simona Colombelli, University of Naples Federico II, ItalyCopyright © 2021 Tsuno. This is an open-access article distributed under the terms of the Creative Commons Attribution License (CC BY). The use, distribution or reproduction in other forums is permitted, provided the original author(s) and the copyright owner(s) are credited and that the original publication in this journal is cited, in accordance with accepted academic practice. No use, distribution or reproduction is permitted which does not comply with these terms.
*Correspondence: Seiji Tsuno, dHN1bm8uc2VpamkuNzVAcnRyaS5vci5qcA==