 Jun Liu
 Dong Jia
 Hongwei Yin
 Li Shen1
 Xiaogen Fan
 Shuang Yang
- 1State Key Laboratory for Mineral Deposits Research, School of Earth Sciences and Engineering, Nanjing University, Nanjing, China
- 2Helmholtz-Zentrum Potsdam, GFZ Deutsches GeoForschungsZentrum, Potsdam, Germany
- 3Laboratory for Mineralogy and Petrology, Department of Geology, Ghent University, Ghent, Belgium
The main formation of the Yinggehai Basin has been related to the rotation of the Indochina block, resulting in large-scale strike-slip motion along the Red River Fault Zone (RRFZ). Transrotational tectonics played a key role in the evolution of the Yinggehai Basin. In this study, we present analog experiments with a preexisting basal velocity discontinuity boundary, rotation of crustal blocks concerning vertical axes, and syntectonic sedimentations to evaluate how the transrotational tectonics controls the evolutionary process of the Yinggehai Basin. Particle image velocimetry (PIV) was used to monitor the deformation of the model surface. Four successive poles of rotation have been applied to the model. The basin evolution underwent two phases. An early phase of deformation is characterized by the nucleation of the main internal faults above the velocity discontinuity boundary and segmented en echelon border fault systems. In the early phase, the internal and boundary faults mainly accommodated large-scale strike-slip displacement. During progressive extension, the main internal faults deactivated, and tectonic activity is localized along the boundary and secondary internal faults in the late phase. The boundary faults in the rotating block play a dominant role in the widening and deepening of the rift zone at an accelerating rate. The model surface morphology shows similarities to the Yinggehai Basin, which is wide in the middle and converges toward the northwest and southeast. In addition, experimental profiles have been compared with seismic profiles in the Yinggehai Basin. The model results also indicate that the rotation of the Indochina block combines with strong strike-slip motion. The similarities between modeling and nature provide support for ∼250 km sinistral displacement along the RRFZ between ∼32 and ∼21 Ma.
Introduction
The Indochina block has been extruded to escape toward the SE along the Red River Fault Zone (RRFZ) relative to the stable South China block as a result of the Cenozoic Himalayan collision and the indentation of the rigid Indian plate into the Asian continent (Tapponnier et al., 1982). The NW–SE trending RRFZ, one of the most important strike-slip faults between the Indochina and South China blocks, controls the lateral extrusion of Southeast Asia. The onshore segment of the RRFZ extends for more than 1,000 km from Tibet to the Hanoi Basin, while the offshore segment of RRFZ is proposed to connect with the South China Sea (SCS) via the Yinggehai Basin, spreading in the center southern SCS. There is transpression along the NW, pure strike-slip in the middle, and transtension along the SE portions of the RRFZ (Tapponnier et al., 1986; Briais et al., 1993; Leloup et al., 2001; Sun et al., 2003).
The Yinggehai Basin is located in the southeast portion of the RRFZ, and is bounded by the offshore Red River Fault (Figure 1A). Recently, based on a dense grid of regional, high-quality reflection seismic and well data, the basin structures have been well recognized in the Yinggehai Basin.
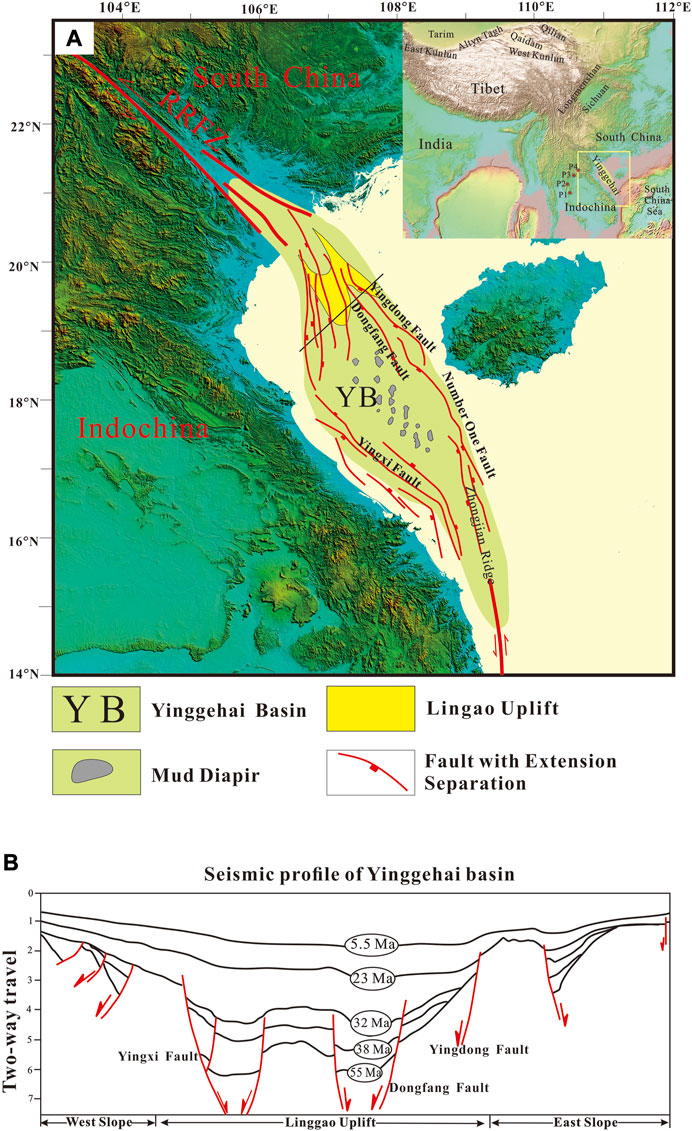
FIGURE 1. (A) Tectonic map showing the tectonic units and faults in the Yinggehai Basin. Rectangular frame in the top right corner large-scale map is our study area. The four red dots represent four rotational poles (P1, P2, P3, and P4); (B) seismic profile of the Yinggehai Basin (modified after Lei et al., 2015).
It is widely accepted that the RRFZ has played a key role in the formation of the Yinggehai Basin (Zhu et al., 2009; Lei et al., 2011; Lei et al., 2015). The transrotational tectonics, a kinematic model which includes compression, extension, and strike-slip deformation induced by plate rotation, has been proposed to explain the NW transpression and SE transtension portions of the RRFZ (Briais et al., 1993; Harrison et al., 1996; Leloup et al., 2001; Mazur et al., 2012). In this case, one key question emerged: how have transrotational tectonics controlled the evolution and formation of the Yinggehai Basin? Spurred by this, we performed analog sandbox modeling to test the applicability of the transrotational model for the Yinggehai Basin.
Geological Background
The Age and Displacement Along the Red River Fault Zone
Two opening mechanisms were proposed for the formation of the South China Sea (SCS): opening as pull-apart basin (Tapponnier et al., 1982; Briais et al., 1993) versus opening due to slab-pull (Taylor and Hayes, 1983; Huchon et al., 1994) (Figure 2). Both models have direct implications for the kinematics along the RRFZ and the Yinggehai Basin.
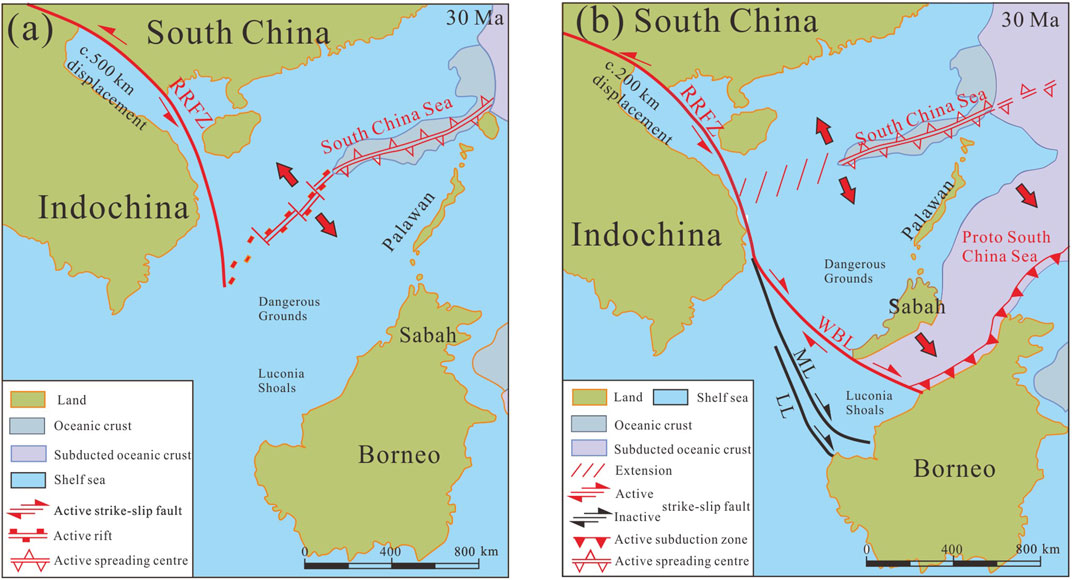
FIGURE 2. Two potential models for the opening of the South China Sea (modified after Mazur et al., 2012): (A) the pull-apart model and (B) the slab-pull model. LL, Lupar Line; ML, Mersing Line, RRFZ, Red River Fault Zone, WBL, West Baram Line.
On the one hand, regarding the pull-apart model, the age and displacement along the RRFZ should be similar to the opening timing of SCS and compatible with its width. By using large-scale geological markers such as ophiolite belts, Mesozoic basins, Permian basalts, Triassic arc volcanic, Cretaceous granites, and Permian gabbro, Leloup et al. (1995), Leloup et al. (2001) estimated the total left-lateral offset along the RRFZ to be 700 ± 200 km. Further, the sinistral strike-slip motion was constrained to have occurred at ∼35–17 Ma by mica 40Ar/39Ar (Leloup et al., 2001). Based on the fit of SCS magnetic seafloor anomalies and plate tectonic reconstructions, Briais et al. (1993) suggested that a total amount of 560 km left-lateral movement would be needed to open the SCS as a pull-apart basin, and the opening of the SCS was alternatively considered to take place at ∼30–16 Ma (chrons 11 to 5C) with an estimated left-lateral strike-slip rate of 35 mm/year (Briais et al., 1993).
On the other hand, the displacement of the RRFZ in the slab-pull model is quite different from that in the pull-apart model. Mazur et al. (2012) used 2-D gravity modeling and 3-D gravity inversion to reconstruct plate models. They suggested that the lateral displacement of the RRFZ is only 250 km and should have occurred between 35 and 20.5 Ma. The limited displacement along the RRFZ requires an additional mechanism that triggers the opening of the Yinggehai Basin. A slab-pull on the southwest was therefore suggested (Mazur et al., 2012).
There is a consensus that the total right-lateral offset on the RRFZ is approximately 6–50 km (Allen et al., 1984; Leloup et al., 1995; Rangin et al., 1995; Leloup et al., 2001; Replumaz et al., 2001; Schoenbohm et al., 2006) or several meters (Zhu et al., 2009) after 5 Ma. However, evidence for such a young right-lateral motion is not obvious in the structure of the Yinggehai Basin (Lei et al., 2011; Lei et al., 2015).
Geological Evolution of the Yinggehai Basin
The Yinggehai Basin is one of the largest strike-slip basins in the world and is filled with up to 17-km-thick sediments. The structures of the offshore RRFZ in the Yinggehai Basin have recently been captured by high-quality seismic images (Lei et al., 2011; Lei et al., 2015). In the Chinese literature, boundary fault trends along the northeast are named the Yingdong fault and Number One fault, and the southwest margin is called the Yingxi fault. To the north, the Yinggehai Basin is separated by the structural high of the Lingao Uplift (Figure 1) (Zhu et al., 2009; Lei et al., 2015).
According to seismic reflection and drilled well data, the evolution process of the basin can be divided into four successive stages (Lei et al., 2011; Wang et al., 2013; Lei et al., 2015). In the first stage between 55 and 32 Ma, the basin began to open, and the basement of the basin subsided (Lei et al., 2011; Lei et al., 2015). In seismic profiles, there are a series of normal faults below the ∼32 Ma unconformity (Rangin et al., 1995; Clift and Sun, 2006; Lei et al., 2011; Lei et al., 2015). The mechanism for the initial opening of the Yinggehai Basin is, however, not clear. Since 32–21 Ma, the basin experienced rapid subsidence, which is approximately synchronous with the rotation of the Indochina Block, sinistral motion along the RRFZ, and opening of the South China Sea (Briais et al., 1993; Yang and Besse, 1993; Leloup et al., 1995; Leloup et al., 2001; Gilley et al., 2003; Barckhausen and Roeser, 2004; Wang et al., 2013). The third stage is represented by thermal subsidence from 21 Ma to 5.5 Ma (Lei et al., 2011; Lei et al., 2015). The final stage refers to a further rapid subsidence after 5.5 Ma. Although the onshore RRFZ is assigned as a dextral strike-slip fault, there is no evidence indicating that the RRFZ extends into the Yinggehai Basin (Zhu et al., 2009; Lei et al., 2011; Lei et al., 2015). It is observed that the primary evolutionary stage of the Yinggehai Basin is between 32 and 21 Ma, which is coeval with the clockwise rotation of the Indochina Block and relative movements between the two blocks along the RRFZ (Rangin et al., 1995; Sun et al., 2003; Clift and Sun, 2006). Our analog experiment also focuses on this evolutionary stage (32–21 Ma).
Transrotational Tectonics
Basins have several types of subunits, for example, transtensional basin with releasing bends and transpressional basins with constraining bends (Crowell, 1974). Basins related to the rotation of crustal blocks around vertical axes within strike-slip fault systems are termed “transrotational,” and may combine extensional, compressional, and strike-slip components (Ingersoll, 1988). The Los Angeles Basin is recognized as an example of a transrotational basin as a result of clockwise crustal rotation of the transverse ranges (Dickinson and Wernicke, 1997; Rumelhart and Ingersoll, 1997; Ingersoll and Rumelhart, 1999). Previous studies generally interpreted the formation of the Yinggehai Basin with a zipper tectonic model (Figure 3A) (Briais et al., 1993; Harrison et al., 1992; Harrison et al., 1996; Leloup et al., 2001; Mazur et al., 2012). For example, if the RRFZ followed a small circle of the Euler rotation pole between the Indochina and South China blocks in the strictest sense, the RRFZ would be purely strike-slip, and there was only localized denudation in restraining or releasing bends. However, the RRFZ did not follow a small circle, and transpression and transtension in the NW (Xue Long Shan and Dian Cang Shan) and SE (Ailao Shan, Day Nui Con Vo and the Yinggehai Basin) parts could take place along large portions of the RRFZ (Figure 3A) (Briais et al., 1993; Harrison et al., 1996; Leloup et al., 2001; Mazur et al., 2012). The formation of the Yinggehai Basin related to the rotation of Indochina blocks around vertical axes within strike-slip fault systems combined extension, compression, and strike slip. In fact, the Yinggehai Basin can be regarded as a transrotational basin, with the zipper model being a special case of the transrotational model. Therefore, the terminology “transrotational model” is adopted in this article.
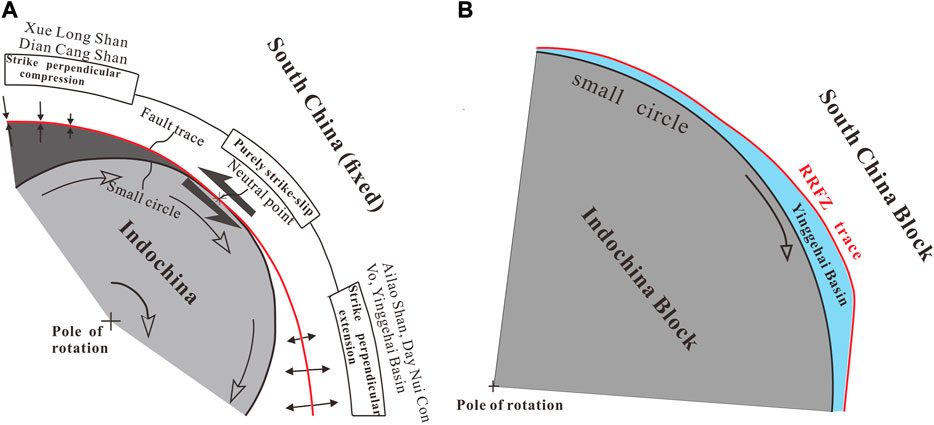
FIGURE 3. Transrotational tectonics: (A) zipper tectonic model: the fault trace does not follow a small circle, resulting in transpression pure strike-slip and transtension (modified by Leloup et al. (2001)), and (B) analog model of the transrotational tectonics in the Yinggehai Basin.
The Yinggehai Basin is situated in the SE parts of the RRFZ and belongs to the transtensional segment of the transrotational model (Figure 3B). The pole and angle of rotation describe the relative motion between the South China and the Indochina blocks (Mazur et al., 2012). Paleomagnetic studies of Cretaceous sedimentary rocks in the Khorat Plateau of Thailand suggest that the Indochina block experienced clockwise rotation of 14°–25° since the Late Cretaceous (Yang and Besse, 1993; Otofuji et al., 2012). Mazur et al. (2012) constrained the amounts of E-W extension perpendicular to the eastern Indochina margin by gravity data. According to the results of plate tectonic reconstruction, a succession of Euler poles is needed, and a total of four stages can be differentiated: 1) rotational angle of 10° (positive is clockwise) at 16.2°N, 101.6°E between 34.1 and 30.1 Ma; 2) rotational angle of 2° at 17.3°N, 101.4°E between 30.1 and 28.4 Ma; 3) rotational angle of 3° at 18.5°N, 102.4°E between 28.4 and 25.1 Ma; and 4) rotational angle of 5° at 19.2°N, 103°E between 25.1 and 20.5 Ma (Mazur et al., 2012). The reason why we adopted their Euler poles is that they used the transrotational tectonic model to restore its original plate position prior to extension, confirming a succession of Euler poles of Indochina block. Hence, we simulate this succession of pole rotations in our analog model.
Experimental Methods and Materials
Experimental Setup and Construction
Our experiment was performed in an apparatus composed basically of two different shapes of box with dimensions of 52 cm × 63 cm × 4 cm. The blocks simulating the South China block remained stable, while the other one (Indochina block) was actively rotated. In order to impose transrotational kinematics, one wall was fixed to the baseplate and the other wall was pulled by a linear actuator at a controlled rate (Figures 4A,B). Mazur et al. (2012) thought that 500 or 700 km left lateral displacement exceeded the width of the South China Sea plate; there were no opening spaces available for the proto–South China Sea while 250 km left-lateral displacement along the RRFZ was consistent with values of ENE-WSW extension. Rangin et al. (1995) suggested the displacement along the RRFZ to be less than 100 km in the Gulf of Tonkin after 30 Ma. The Yinggehai Basin experienced thermal subsidence from 21 to 5.5 Ma (Lei et al., 2011; Lei et al., 2015). Few or no left-lateral displacement was assumed on the RRFZ after 21 Ma. The partitioning of offset was based on the estimation of Mazur et al. (2012), who implemented a succession of four poles of rotation (Figure 4A) and a strike-slip rate. According to the four poles of rotation, the experimental process fell into four stages: 1) 10° of rotation around P1 with a strike-slip rate of 0.03 mm/s, 2) rotational pole was changed into P2 and the rotational angle was 2° with the same strike-slip rate, 3) 3° of rotation around P3 with a strike-slip rate of 0.01 mm/s, and 4) 5° of rotation around P4 with a strike-slip rate of 0.1 mm/s (Figure 4A; Table 1). During progressive subsidence of the rift zone, syntectonic accumulation of sediments was simulated in the experiments. Sedimentation rates were fast during 32–23.3 Ma (Lei et al., 2015). This was achieved by qualitatively filling the rift depression at irregular time intervals with dry quartz sand. Syntectonic sediments were filled at 40 min (green), 60 min (gray), 79 min (green), and 122 min (gray). At the end of the experiment, we poured green quartz sand into the basin to simulate post-tectonic accumulation.
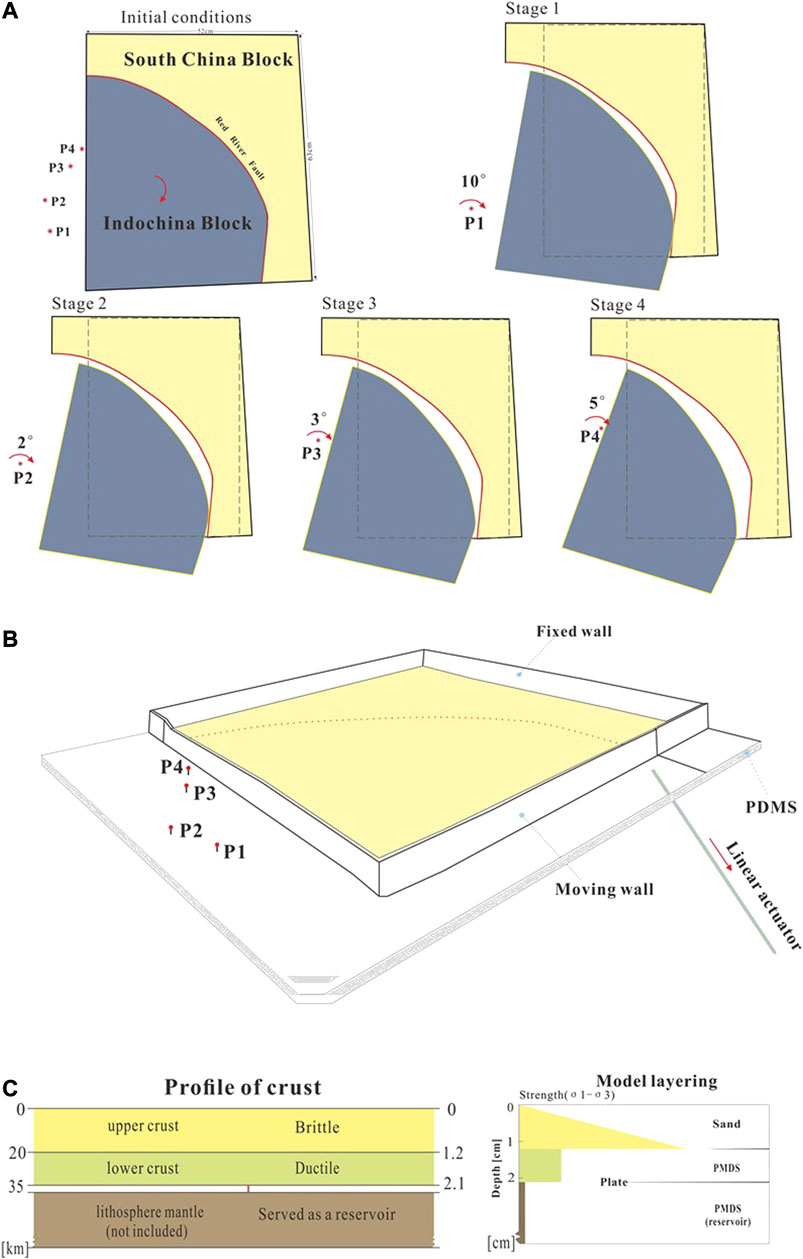
FIGURE 4. Experimental setup: (A) graphical summary of the boundary conditions for the laboratory experiments presented in this article and plan view sketch of the rotational boundary condition, imposed by fixing a pivot (P1, P2, P3, and P4) at one side of a moveable wall and pulling from the opposite side with a linear actuator; the dashed rectangle is monitored by a camera; (B) 3-D sketch of how the laboratory experiment was constructed; and (C) profile of the analog model (left represents the thickness of the crust in nature, and right represents the scaled down thicknesses for our models) and representative strength profiles of the model lithospheres. Below the lower crust, there is a rigid plate, and the thickness of the plate is 2 mm.
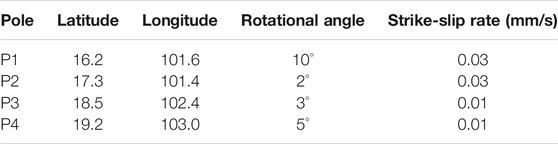
TABLE 1. Pole of rotation.
The experiment consists of a three-layer, brittle-ductile model crustal plate. Previous experimental setups for simulating crustal-scale extensional tectonics usually contain four types, including foam base, rubber base, rigid plates, and conveyor base (Zwaan et al., 2019). In our analog experiment, we chose rigid plates as experimental apparatus; a 2-mm-thick rigid plate driving the rotation of the crust was placed below the lower crust (Figure 4C). The previous experimental design placed the rigid basal plate above a fixed support table, where the bottom of the basin was limited, and natural subsiding was not allowed. We applied less viscous material below the rigid plates to act as a reservoir, allowing more realistic subsidence of the involving basin in the region where the two plates diverge. First, we sliced the rigid plate at the irregular curvature to simulate the initial track of the RRFZ. Therefore, a velocity discontinuity boundary between the fixed wall and moving wall was produced. The linear actuator was connected to the rigid plate and moved together with a steady velocity. Then, we placed PDMS below the rigid plate and finally placed PDMS on top of the rigid plate. Each process was performed for ∼48 h to dissipate air bubbles in the silicone. After the upper crust layer was deposited by sand, enough time (∼10 h) was left to achieve isostatic equilibrium. The moving wall was able to create a free edge in the upper left and lower right corners of the model. We used sand to seal in the experimental process, and the undesired boundary condition only affected a small area that was outside the region of interest, where the surface area was selected for deformation monitoring processing. This was considered to minimize other boundary effects.
Materials and Scaling
Geometrical and kinematic similarities (e.g., lengths, time, and forces) are scaled down in analog experiments to produce an appropriately sized model that behaves in a mechanically similar way to nature.
Our experimental model is 63 cm × 52 cm, which represents 1,050 km × 920 km in nature (Figure 4A). The length scale ratio, L* = Lm/Ln, where subscripts n and m refer to the natural prototype and the model, respectively, was fixed by setting the model crustal thickness and size. Lm = 21 mm represented a crustal thickness in nature Ln = 35 km, so L* = 6 × 10⁻⁷ (Table 2). This length scale ratio is suitable for the simulation of large areas on Earth. However, the spherical nature of Earth at its scale was neglected here.
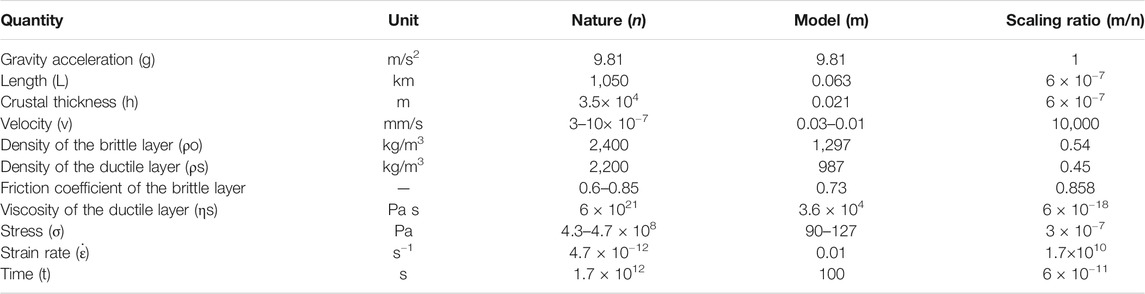
TABLE 2. Material properties and scaling parameters between the model and nature.
We used dry quartz sand and PDMS to simulate the upper and the lower crust, respectively. The dry quartz has a homogeneous grain size distribution of 0.2–0.4 mm. Its sieved bulk density is 1,297 kg/m3, and the coefficient of internal friction is close to 0.7, which is similar to that of other sands used for analog modeling. In our modeling, a natural upper crust has density ρ n ≈ 2,400 kg/m3 (Klinkmüller et al., 2016), and we set a density scaling factor ρ* = ρ m/ρ n= 0.54.
PDMS (polydimethylsiloxane) in our laboratory was used to model the ductile lower crust, which has a viscosity of ƞ m = 3.6 × 10⁴ Pa s (Rudolf et al., 2016) and corresponds to a natural lower crust viscosity of ƞ n ≈ 2 × 10²¹ Pa s (Ranalli, 1995). Therefore, the viscosity scaling factor is ƞ* = ƞ m/ƞ n = 6×10⁻¹⁸. All experiments are carried out in the normal field of gravity (1 g), so the scale ratio for gravity acceleration is g* = g m/g n = 1. Accordingly, the stress ratio is σ* =ρ*× g* ×l* =3 × 10⁻⁷.
The strain rate ratio is ε̇* = σ*/η* = 1.7×10¹⁰. Accordingly, the velocity ratio (V* = L* ε̇*) is close to 1,000, which means that 0.01 mm/s in the modeling represents ∼1 cm/year in nature. The time rate ratio, t*= ƞ*/(ρ* · g* · L*), is 2 × 10⁻¹¹, and 1 h in the model represents ∼6 Ma in nature. Reservoir below the rigid plates is also composed of PDMS, whose effective viscosity is 2.2 × 10⁴ Pa s.
Deformation Monitoring and Analysis
Stereoscopic particle image velocimetry (PIV) is able to monitor the deformation of the model surface. PIV can provide an accurate measurement of the instantaneous velocity (incremental-displacement) field, horizontal shear strain rate (Eyx), and area strain (Exx+Eyy). This allows not only a precise, instantaneous, and quantitative analysis of the deformation details but also a better comprehension of the kinematics, mechanics, and dynamics of the simulated geological process (Adam et al., 2005; Shen et al., 2012; Shen et al., 2015). We used a Canon 80D camera to record the deformation process. Successive PIV images were taken at 30 s intervals during the experimental process. The spatial and temporal resolution (Δs and Δt) of each tracer particle is limited by the amount and accuracy of the analyzed images. The apparent velocity can be calculated by using the following function.
Then, the horizontal component of the velocity in the X and Y directions of the PIV system can be calculated (U, V). The horizontal shear strain rate (Eyx) and area strain (Exx+Eyy) can be calculated as follows:
PIV results are similar as long as the pole is fixed. Accordingly, we chose a shorter time period to show the whole process.
Experimental Results
Comparison With Previous Modeling
Previous works on rift analog modeling emphasized that the presence of weakness zones, achieved by linear rheological heterogeneities with obliquity in experiments, had a profound influence on the extension of the continental lithosphere (Molnar et al., 2017). The presence of inherited structures or rheological heterogeneities controlled the evolution, pattern, and partitioning of deformation during oblique or rotational continental rifting (Agostini et al., 2009; Brune et al., 2017; Molnar et al., 2017). Our experiment made a difference in which a velocity discontinuity boundary exists below the ductile lower crust, localizing deformation more effectively. The preexisting velocity discontinuity boundary localized strain in the initial stage, resulting in the nucleation of stretching deformation above the velocity discontinuity boundary. As the blocks move apart, two new separate main boundary faults were developed. Increasing extension led to the abandonment of the main internal fault and the successive development of new faults along the depression boundaries. These were different from the modeling of inherited lithospheric heterogeneity with emerging boundary faults at the beginning and propagating to the interior. Moreover, during progressive extension, boundary faults lose their activity, and new faults developed within the depression (Agostini et al., 2009). Cross sections showed symmetrical and asymmetrical fault arrays from northwest to southeast.
Stage 1
The first increments of extension produced strike-slip faults above the velocity discontinuity boundary whose nucleation and connection gave rise to main internal faults. As the moving wall continued rotating, arrays of linear extensional faults formed in the west and east rift margins. Well-developed en echelon grabens were defined by conjugate faults along the west and east boundary fault system. Linkage between individual grabens was accommodated by breached relay ramps (Figures 5Ai, 6Ai). After the first syntectonic accumulation of sediments (Figures 5Aii,iii, 6Aii,iii), the fundamental architecture of the rift system was established on the basis of the previous fault system. At this stage, extensional fault systems predominantly accommodated the strong strike-slip component of motion imposed by the rotation of the Indochina block.
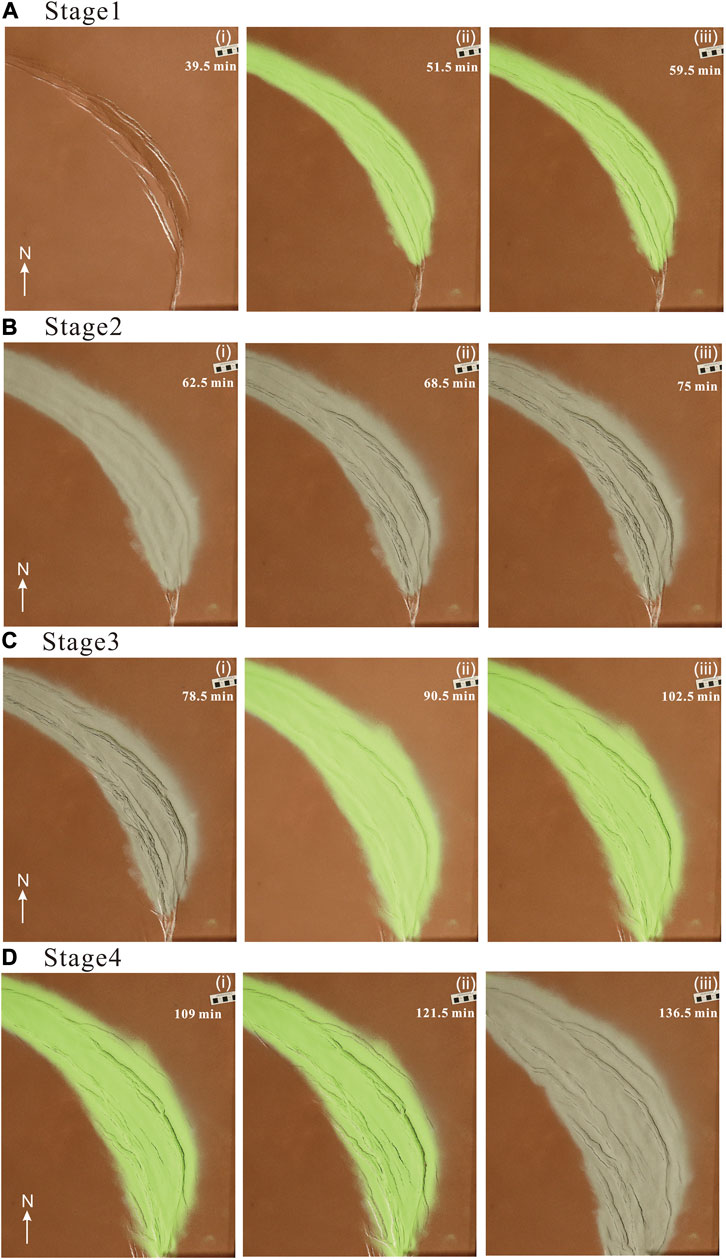
FIGURE 5. Evolution of deformation with stages 1 (A), 2 (B), 3 (C), and 4 (D). The four panels in (A–D) represent a primitive image without interpreted fault lines.
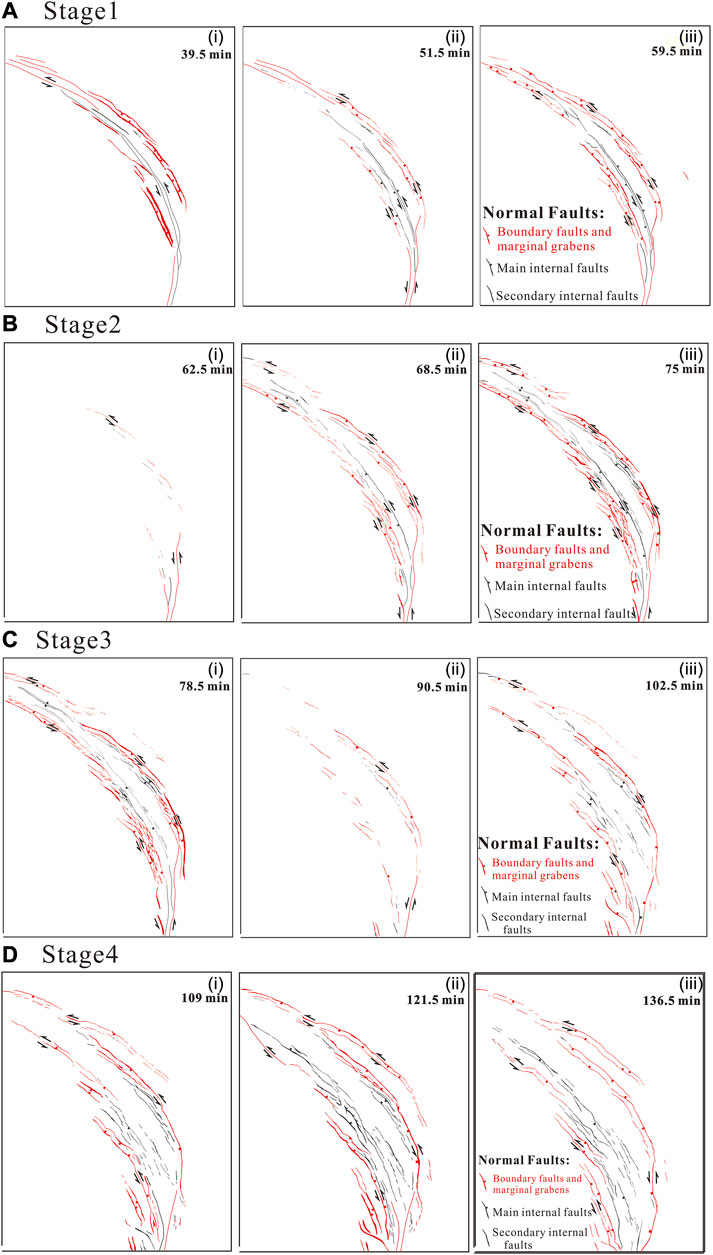
FIGURE 6. Line drawing of structures for stages 1 (A), 2 (B), 3 (C), and 4 (D).
The direction of displacement velocity was almost subparallel to the velocity discontinuity boundary, transferring from SE (in the northwest) to SSE (in the middle) and evolving into SN (in the south) (Figure 7Ai). There were three different velocity bands, including the high velocity band (orange-red), middle velocity band (green), and low velocity band (light green), where main boundary faults and internal fault were developed (Figure 7Ai). Secondary normal faults developed within the same velocity band. Boundary faults and main internal faults had a positive horizontal shear strain rate (Figure 7Aii), which revealed extensive transrotational or sinistral shear movement. The area strain was positive in the large-scale grabens (Figure 7Aiii).
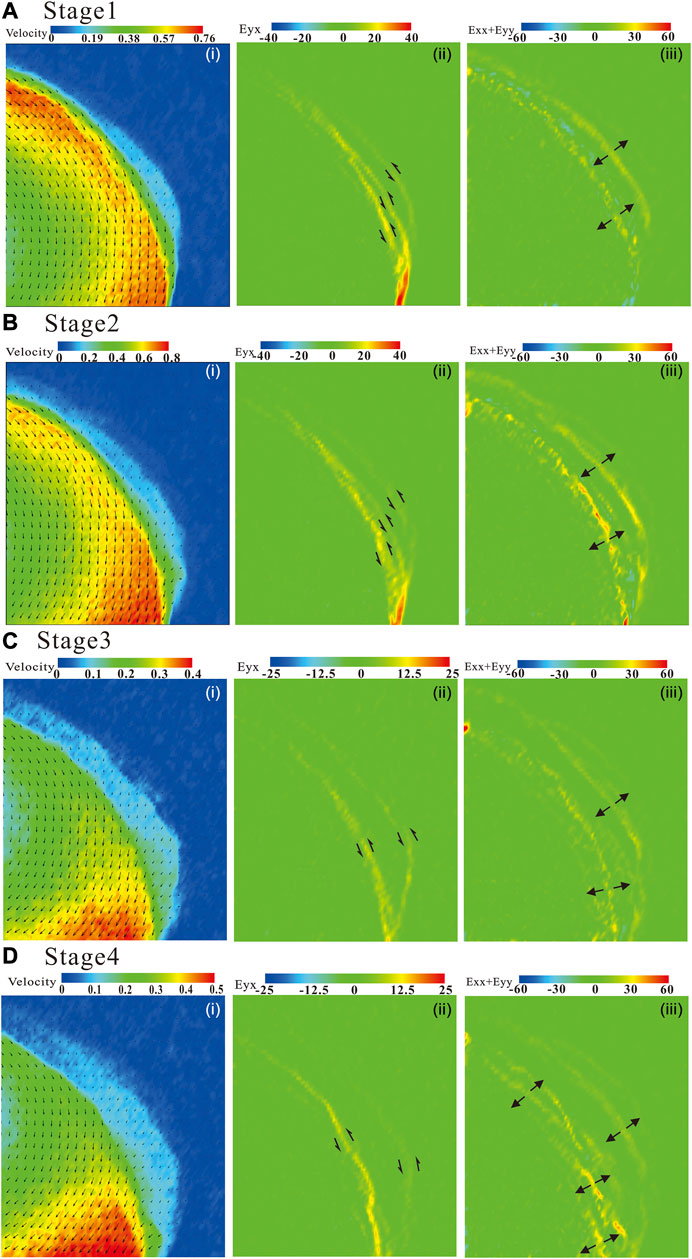
FIGURE 7. PIV results for stages 1 (A), 2 (B), 3 (C), and 4 (D). The four panels in (A–D) represent (i) the calculated velocity, (ii) the horizontal shear strain rate component, and (iii) the area strain rate component.
Stage 2
After the second syntectonic sedimentations, the large-scale main internal fault almost cut through the rift center, accommodating most of the far-field slip-strike displacement (Figures 5Bi–iii, 6Bi–iii). Major boundary faults for each rift margin continued to grow. Conjugate rift-parallel faults formed grabens in the block boundary zones. Small secondary normal faults developed inside part of the grabens. Compared with Stage 1, the rift grew in width as the pole of rotation moved northward.
The displacement field had a substantial change. The direction was NW trending, while it converted to NS trending in the middle and SW in the southern end of the rift zone. From NW to SE, three different velocity bands consistently existed (Figure 7Bi). This was also recorded in the horizontal shear–strain rate contour. Horizontal shear strain rate bands noticeably emerged in the depression boundaries and centers (Figure 7Bii), indicating a significant sinistral strike-slip movement. The area strain presented extensional stress either in the center or in the boundary (Figure 7Biii).
Stage 3
In the initial deformation phase of stage 3, an increase in extension caused further deepening of the rift and further propagation of boundary faults (Figures 5Ci, 6Ci). Continuing NE-SW extension resulted in the abandonment of the main internal faults and the development of secondary internal faults within the rift zone (Figures 6Cii,iii). The main boundary fault activation was based on preexisting fault systems. Newly formed NW-trending grabens in the rotating boundary zone increased the width of the rift zone.
In the northwest (Figure 7Ci), the displacement field was subparallel to the main boundary faults. The N-S trending displacement field transferred to the northwest, and the SW trending field appeared in the middle of the depression. It was important to note that the high-velocity band (orange-red) disappeared in the northwest and moved southward. As a result, the horizontal shear strain rate did not appear in the depression center. The transrotational horizontal shear strain rate was located along the depression boundaries (Figure 7Cii). In general, the area strain was positive in this stage (Figure 7Ciii).
Stage 4
The eastern rift border consisted of a segmented boundary fault system, while the western rift border developed well-developed arrays of small en echelon linked faults, bordering a serial of NW–SE grabens (Figures 5D, 6D). Secondary internal faults were subparallel to the rotating boundary faults. It is noted that the increase in extension led to the widening of the depression and increasing vertical displacement on the boundary faults. An increasing amount of transrotational deformation was accommodated by boundary and secondary internal faults. After syntectonic accumulation, the structural pattern almost developed on the basis of early formed faults (Figure 5Diii).
The turning point of the displacement field migrated to the northwest, and the high-velocity band (orange-red) only appeared in the south of the moving wall (Figure 7Di). It was observed that the rotating boundary formed a strong long narrow horizontal shear strain rate band (orange-red), recording higher strain, especially in the middle and south of the depression, in comparison with that of the fixed block (Figure 7Dii). This area appeared as a series of grabens and horsts, leading to the widening of the depression. In addition, the depression also showed extensively positive area strain because of the increasing extension in the area (Figure 7Diii).
Cross Sections
Serial cross sections illustrated an asymmetric rift system (Figure 8). Basin boundaries always gave rise to marginal grabens and large-scale extensional faults, mainly because these faults were active at the early stage.
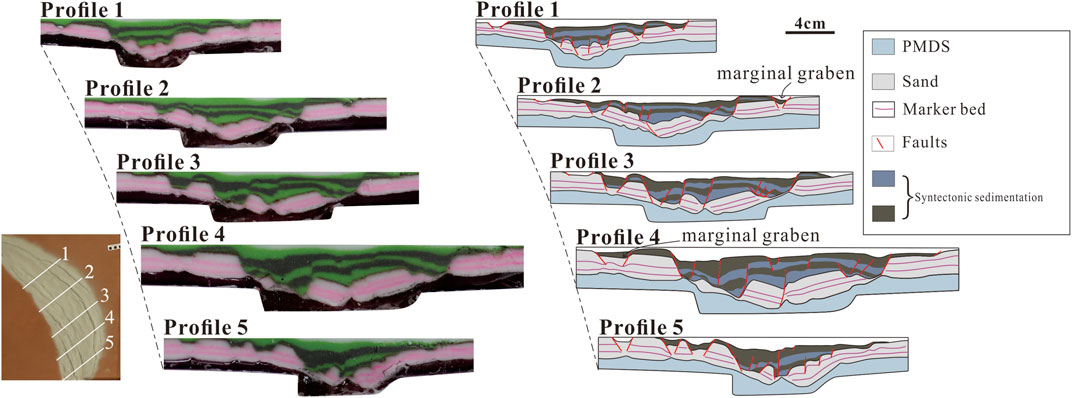
FIGURE 8. Serial sections through the transrotational model. Location of sections is indicated in the inset (left corner).
From NW to SE, the basin structure showed both symmetrical and asymmetrical fault arrays. This differs from the brittle-viscous plate base model with asymmetric extension, which showed symmetrical stepped graben structures (Figure 11G from Zwaan et al. (2019)). In the northwest, sections showed conjugate fault arrays and symmetrical graben-horse structures (profiles 1 and 2), in which extensional faults cut through basement. Few faults developed within syntectonic sedimentations. Toward the southeast, cross sections showed asymmetrical graben structures. The east of the basin developed some small-scale grabens, especially in profile 5, in contrast with the west of basin that gave rise to large-scale extensional faults. The interior of the basin developed not only extensional faults cutting through basement but also small faults within syntectonic sedimentations.
Discussion
Comparison With the Yinggehai Basin
The Yinggehai Basin is a transrotational basin. Our final surface deformation pattern shows the occurrence of large-scale boundary faults, delimiting an arc-shaped extensional basin. It is wide in the middle and converges toward the northwest and southeast of the basin, and a sequence of normal faults appear in the moving block boundary, which is similar to the geometry of the Yinggehai Basin (Figures 9A,B). Its shape is controlled by the initial curvature of the fault trace. As the rotational pole moves northward, transrotational deformation is first accommodated by the boundary and main internal faults, and then transferred to two block boundaries. Therefore, the geometry and deformation of the basin depend not only on the arc-shaped curvature of the velocity discontinuity boundary but also on the position of the rotational pole.
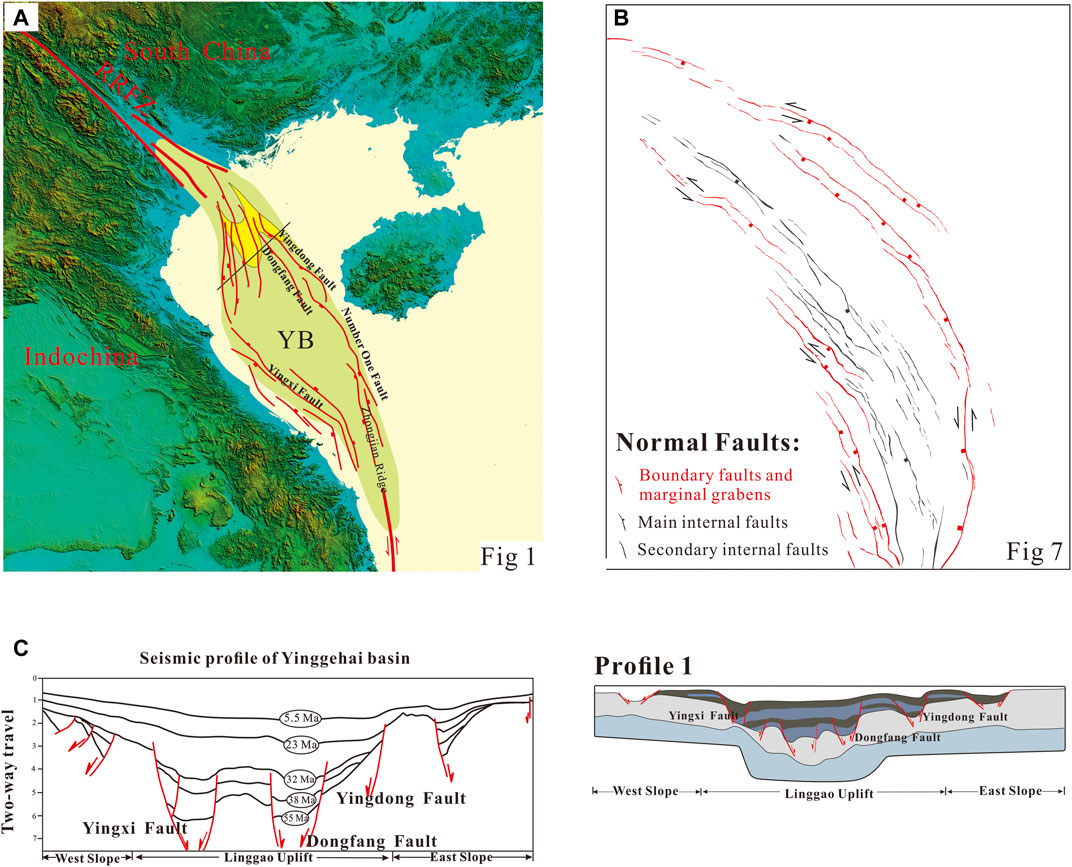
FIGURE 9. Comparison between the model results and the Yinggehai Basin: (A) primary faults of the study area, (B) key features of the analog model, and (C) the comparison of the cross-sectional structure between analog modeling and seismic profile (Lei et al., 2011; Lei et al., 2015).
We chose profile 1 to compare with the seismic profile of the Yinggehai Basin, whose position is presented in Figure 1. Considering that other seismic profiles cannot reveal the deeper structure in detail because of thick sediments, we selected the seismic profile located in the Linggao uplift. Compared with the seismic profile, it is observed that the main faults in the Yinggehai Basin, such as the Yingxi, Dongfang, and Yingdong faults, are well developed in our experimental profile (Figure 9C). Our model results also show grabens and horsts in the center of the basin, which is similar to the Linggao uplift. In addition, the experimental profile can also be divided into the West Slope, Linggao Uplift, and East Slope, although the fault patterns display small differences.
Despite the simplifications, the analog modeling results provide useful hints of the evolutionary processes of the Yinggehai Basin, such as a two-phase evolution. The model reveals two-phase basin evolution. At early phase (including Stages 1 and 2), the main internal and boundary faults accommodated the strong strike-slip component of motion imparted by Indochina Block rotation, which accounts for the relatively low speed of rift growth. Subsequently, increasing extension resulted in the abandonment of the main internal faults and the development of secondary internal faults within the rift zone. The largest part of extensional deformation was accommodated by the rotating block boundary faults in the latter deformation phase (including Stages 3 and 4). An increase in extension led to further deepening and widening of the basin at a faster rate. A change from strike-slip motion to extension-dominated deformation was clearly visualized by the PIV results. Accordingly, at an early phase, the displacement field was almost subparallel to the velocity discontinuity boundary, leading to slightly extensional transrotational shear at the boundary and center of the depression. In the later phase, the displacement field was significantly oblique to the boundary faults. The deformation migrated to the south, and transrotational shear was only accommodated at the depression boundaries, in particular along the Indochina Block boundary zones. Area strain was always spread over the boundary and internal faults in the two phases. Zhu et al. (2009) used detailed seismic reflection and borehole data to reveal structures of the offshore Red River Fault system. Two boundary faults (Number 1 fault and Yingxi fault) and two basin-center faults (named Fault B and C) in the Yinggehai Basin are likely the major offshore extensions of the RRFZ. They proposed that two boundary faults have been active between 32 and 21 Ma, while Fault B diminished upward until around 26 Ma in the northern basin. However, Fault C adjacent to the west border of the basin stopped its deformation around 16 Ma. Experimental results showed the western rift border gave rise to well-developed arrays of small en echelon linked faults at a faster rate. Fault C may form because faults migrate toward west. Thus, this may document the migration of the faulting in the Yinggehai Basin.
Syntectonic sedimentation may have an influence on fault migration (Corti et al., 2010). The main internal faults lose their activity after the third syntectonic accumulation of sediments. Horizontal shear strain rate before and after the third syntectonic sedimentation is identical in Stage 3, implying that syntectonic sediments cannot promote the rapid abandonment of the main internal faults. Ninety-nine kilometers of SW–NE maximum crustal extension was calculated (Mazur et al., 2012). The inactivation of main internal faults could explain why the basin did not juxtapose oceanic crust, while crustal thickness is only 6 km in the thinnest area (Zhang et al., 2008).
Implication for Regional Tectonics
Otofuji et al. (2012) reported Cretaceous paleomagnetic results from Late Cretaceous red beds of the Dak Rium Formation, and the Indochina block experienced clockwise rotation (before 32 Ma) prior to the movements of the Red River Fault Zone. Through our transrotational model, the start of the rotation of the Indochina Block always accompanies sinistral movement of the Red River Fault Zone. The left-lateral motion on the Red River Fault Zone dated back to 35 Ma by interpretation of the radiometric ages from metamorphic rocks along the Red River Fault Zone (Leloup et al., 2001; Gilley et al., 2003). In addition, independent evidence from the Yinggehai Basin constrains sinistral motion since 32 Ma. The rotation of the Indochina Block and left-lateral motion are concurrent and may not be independent. In addition, if the Indochina block moves southward, large-scale left-lateral offset will lead to compressive uplift because of the initial curvature of the fault, rather than the extensional basin that contracts the fact.
The model evolution displayed fault migration and propagation in the west of the basin are faster than those of the eastern basin. Deformation is mainly accommodated by minor western grabens, and faults in the east of the basin grow slowly. Opening of the SCS requires the resultant ∼550 km of N–S extension (Tapponnier et al., 1982; Briais et al., 1993; Lee and Lawver, 1994; Lee and Lawver, 1995; Leloup et al., 1995; Leloup et al., 2001). If the RRFZ provides a direct kinematic link with the SCS, faults should propagate toward the east at a faster rate than the west. Apparently, model results are contrary to the hypothesis. The model results similar to the Yinggehai Basin in surface and profiles provide support for 250 km sinistral displacement of the RRFZ between 32 and 21 Ma.
Conclusion
In order to elucidate what impact the transrotational model has on the evolution of the Yinggehai Basin, we conducted a crustal-scale analog experiment. Based on the comparison of the experimental results with natural and particle image velocimetry (PIV) analyses, the following conclusions can be drawn.
The Yinggehai Basin has a two-phase evolution of rifting. Deformation nucleated in the velocity discontinuity boundary, forming main internal faults, and main boundary faults emerge in two block boundaries at the early phase. Progressive extension results in the abandonment of main internal faults and the development of new faults in the rift boundaries lead to the widening and deepening of the basin at a faster rate at the late phase. Strain becomes highly localized in the Indochina block. Main boundary faults have been active from beginning to end. Changing poles make the main internal faults lose activity, rather than syntectonic sediments. From cross sections, conjugate faults develop in the basin, bordering grabens and horsts. Our model results are comparable in surface and profile. The success of our model highlights the importance of the preexisting velocity discontinuity, the initial curvature of the fault traces, and changeable poles. Our results also indicate that the rotation of the Indochina block always integrates with large-scale strike-slip motion, which is a dependent process. Our modeling suggests that 250 km left-lateral displacement is consistent with basin geometries and kinematics in the Yinggehai Basin between 32 and 21 Ma.
Data Availability Statement
The original contributions presented in the study are included in the article/Supplementary Material; further inquiries can be directed to the corresponding author.
Author Contributions
Conceptualization: DJ and JL. Methodology: JL, DJ, LS, XF, JC, and SY. Software: JL, LS, XF, SY, and JC. Validation: JL, LS, XF, and JC. Formal analysis: JL, LS, and XF. Investigation: JL, DJ, and HY. Resources: JL, DJ, LS, and JC. Data curation: JL, DJ, XF, and SY. Writing—original draft: JL, DJ, HY, and XF. Writing—review and editing: JL, DJ, and HY. Visualization: JL, DJ, HY, and LS. Supervision: DJ and HY. Project administration: DJ and HY. Funding acquisition: DJ and HY.
Funding
This study was funded by National Nature Science Foundation 548 of China (41927802 and 41902206) and the National S&T Major Project of China 547 (2016ZX05003-001 and 2017ZX05008-001).
Conflict of Interest
The authors declare that the research was conducted in the absence of any commercial or financial relationships that could be construed as a potential conflict of interest.
Publisher’s Note
All claims expressed in this article are solely those of the authors and do not necessarily represent those of their affiliated organizations, or those of the publisher, the editors and the reviewers. Any product that may be evaluated in this article, or claim that may be made by its manufacturer, is not guaranteed or endorsed by the publisher.
References
Adam, J., Urai, J. L., Wieneke, B., Oncken, O., Pfeiffer, K., Kukowski, N., et al. (2005). Shear Localisation and Strain Distribution during Tectonic Faulting-New Insights From Granular-Flow Experiments and High-Resolution Optical Image Correlation Techniques. J. Struct. Geology. 27, 283–301. doi:10.1016/j.jsg.2004.08.008
Agostini, A., Corti, G., Zeoli, A., and Mulugeta, G. (2009). Evolution, Pattern, and Partitioning of Deformation During Oblique Continental Rifting: Inferences From Lithospheric-Scale Centrifuge Models. Geochem. Geophys. Geosyst. 10, Q11015. doi:10.1029/2009gc002676
Allen, C. R., Gillespie, A. R., Han, Y. A., Sieh, K. E., Zhang, B. C., and Zhu, C. N. (1984). Red River and Associated Faults, Yunnan Province, China - Quaternary Geology, Slip Rates, and Seismic Hazard. Geol. Soc. Am. Bull. 95, 686–700. doi:10.1130/0016-7606(1984)95<686:rraafy>2.0.co;2
Barckhausen, U., and Roeser, H. A. (2004). Seafloor Spreading Anomalies in the South China Sea Revisited. Geoph. Monog. Ser. 149, 121–125. doi:10.1029/149gm07
Briais, A., Patriat, P., and Tapponnier, P. (1993). Updated Interpretation of Magnetic Anomalies and Seafloor Spreading Stages in the south China Sea: Implications for the Tertiary Tectonics of Southeast Asia. J. Geophys. Res. 98, 6299–6328. doi:10.1029/92jb02280
Brune, S., Corti, G., and Ranalli, G. (2017). Controls of Inherited Lithospheric Heterogeneity on Rift Linkage: Numerical and Analog Models of Interaction Between the Kenyan and Ethiopian Rifts Across the Turkana Depression. Tectonics 36, 1767–1786. doi:10.1002/2017tc004739
Clift, P. D., and Sun, Z. (2006). The Sedimentary and Tectonic Evolution of the Yinggehai-Song Hong Basin and the Southern Hainan Margin, South China Sea: Implications for Tibetan Uplift and Monsoon Intensification. J. Geophys. Res. 111, B06405. doi:10.1029/2005jb004048
Corti, G., Ranalli, G., Mulugeta, G., Agostini, A., Sani, F., and Zugu, A. (2010). Control of the Rheological Structure of the Lithosphere on the Inward Migration of Tectonic Activity During continental Rifting. Tectonophysics 490, 165–172. doi:10.1016/j.tecto.2010.05.004
Crowell, J. C. (1974). “Origin of Late Cenozoic Basins in California,” in Tectonics and sedimentation, Society of Economic Paleontologists and Mineralogists Special Publication. Editor W. R. Dickinson (Tulsa, OK: Society of Economic Paleontologists and Mineralogist), Vol. 22, 190–204.
Dickinson, W. R., and Wernicke, B. P. (1997). Reconciliation of San Andreas Slip Discrepancy by a Combination of interior Basin and Range Extension and Transrotation Near the Coast. Geology 25, 663–665. doi:10.1130/0091-7613(1997)025<0663:Rosasd>2.3.Co;2
Gilley, L. D., Harrison, T. M., Leloup, P. H., Ryerson, F. J., Lovera, O. M., and Wang, J.-H. (2003). Direct Dating of Left-Lateral Deformation along the Red River Shear Zone, China and Vietnam. J. Geophys. Res. 108, 2127. doi:10.1029/2001jb001726
Harrison, T. M., Wenji, C., Leloup, P. H., Ryerson, F. J., and Tapponnier, P. (1992). An Early Miocene Transition in Deformation Regime within the Red River Fault Zone, Yunnan, and its Significance for Indo-Asian Tectonics. J. Geophys. Res. 97, 7159–7182. doi:10.1029/92jb00109
Harrison, T. M., Leloup, P. H., Ryerson, F. J., Tapponnier, P., Lacassin, R., and Chen, W. (1996). “Diachronous Initiation of Transtension along the Ailao Shan–Red River Shear Zone,Yunnan and Vietnam,” in The Tectonic Evolution of Asia. Editors A. Yin, and T. M. Harrison (New York, NY: Cambridge University Press), 208–222.
Huchon, P., Le Pichon, X., and Rangin, C. (1994). Indochina Peninsula and the Collision of India and Eurasia. Geology 22, 27–30. doi:10.1130/0091-7613(1994)022<0027:ipatco>2.3.co;2
Ingersoll, R. V., and Rumelhart, P. E. (1999). Three-stage Evolution of the Los Angeles basin, Southern California. Geology 27, 593–596. doi:10.1130/0091-7613(1999)027<0593:Tseotl>2.3.Co;2
Ingersoll, R. V. (1988). Tectonics of Sedimentary Basins. Geo.l Soc. Am. Bull. 100, 1704–1719. doi:10.1130/0016-7606(1988)100<1704:Tosb>2.3.Co;2
Klinkmüller, M., Schreurs, G., Rosenau, M., and Kemnitz, H. (2016). Properties of Granular Analogue Model Materials: A Community Wide Survey. Tectonophysics 684, 23–38. doi:10.1016/j.tecto.2016.01.017
Lee, T.-Y., and Lawver, L. A. (1994). Cenozoic Plate Reconstruction of the South China Sea Region. Tectonophysics 235, 149–180. doi:10.1016/0040-1951(94)90022-1
Lee, T.-Y., and Lawver, L. A. (1995). Cenozoic Plate Reconstruction of Southeast Asia. Tectonophysics 251, 85–138. doi:10.1016/0040-1951(95)00023-2
Lei, C., Ren, J., Clift, P. D., Wang, Z., Li, X., and Tong, C. (2011). The Structure and Formation of Diapirs in the Yinggehai-Song Hong Basin, South China Sea. Mar. Pet. Geol. 28, 980–991. doi:10.1016/j.marpetgeo.2011.01.001
Lei, C., Ren, J., Sternai, P., Fox, M., Willett, S., Xie, X., et al. (2015). Structure and Sediment Budget of Yinggehai-Song Hong basin, South China Sea: Implications for Cenozoic Tectonics and River Basin Reorganization in Southeast Asia. Tectonophysics 655, 177–190. doi:10.1016/j.tecto.2015.05.024
Leloup, P. H., Lacassin, R., Tapponnier, P., Scharer, U., Zhong, D. L., Liu, X. H., et al. (1995). The Ailao Shan-Red River Shear Zone (Yunnan, China), Tertiary Transform Boundary of Indochina. Tectonophysics 251 (3–10), 13–84. doi:10.1016/0040-1951(95)00070-4
Leloup, P. H., Arnaud, N., Lacassin, R., Kienast, J. R., Harrison, T. M., Trong, T. T. P., et al. (2001). New Constraints on the Structure, Thermochronology, and Timing of the Ailao Shan-Red River Shear Zone, SE Asia. J. Geophys. Res. 106, 6683–6732. doi:10.1029/2000jb900322
Mazur, S., Green, C., Stewart, M. G., Whittaker, J. M., Williams, S., and Bouatmani, R. (2012). Displacement along the Red River Fault Constrained by Extension Estimates and Plate Reconstructions. Tectonics 31 (5), TC5008. doi:10.1029/2012tc003174
Molnar, N. E., Cruden, A. R., and Betts, P. G. (2017). Interactions Between Propagating Rotational Rifts and Linear Rheological Heterogeneities: Insights From Three‐Dimensional Laboratory Experiments. Tectonics 36, 420–443. doi:10.1002/2016tc004447
Otofuji, Y.-i., Tung, V. D., Fujihara, M., Tanaka, M., Yokoyama, M., Kitada, K., et al. (2012). Tectonic Deformation of the Southeastern Tip of the Indochina Peninsula during its Southward Displacement in the Cenozoic Time. Gondwana Res. 22, 615–627. doi:10.1016/j.gr.2011.09.015
Rangin, C., Klein, M., Roques, D., Lepichon, X., and Vantrong, L. (1995). The Red River Fault System in the Tonkin Gulf, Vietnam. Tectonophysics 243, 209–222. doi:10.1016/0040-1951(94)00207-p
Replumaz, A., Lacassin, R., Tapponnier, P., and Leloup, P. H. (2001). Large River Offsets and Plio-Quaternary Dextral Slip Rate on the Red River Fault (Yunnan, China). J. Geophys. Res. 106, 819–836. doi:10.1029/2000jb900135
Rudolf, M., Boutelier, D., Rosenau, M., Schreurs, G., and Oncken, O. (2016). Rheological Benchmark of Silicone Oils Used for Analog Modeling of Short- and Long-Term Lithospheric Deformation. Tectonophysics 684, 12–22. doi:10.1016/j.tecto.2015.11.028
Rumelhart, P. E., and Ingersoll, R. V. (1997). Provenance of the Upper Miocene Modelo Formation and Subsidence Analysis of the Los Angeles Basin, Southern California: Implications for Paleotectonic and Paleogeographic Reconstructions. Geol. Soc. Am. Bull. 109, 885–899. doi:10.1130/0016-7606(1997)109<0885:Potumm>2.3.Co;2
Schoenbohm, L. M., Burchfiel, B. C., Liangzhong, C., and Jiyun, Y. (2006). Miocene to Present Activity Along the Red River Fault, China, in the Context of Continental Extrusion, Upper-Crustal Rotation, and Lower-Crustal Flow. Geol. Soc. Am. Bull. 118, 672–688. doi:10.1130/B25816.1
Shen, L., Jia, D., Yin, H. W., Sun, C., Zhang, Y., and Fan, X. G. (2012). Analogue Modeling of Fold-and-Thrust Structures Based on Particle Image Velocimetry (PIV). Geol. Rev. 58 (3), 471–480. doi:10.1007/s11783-011-0280-z
Shen, L., Jia, D., Yin, H. W., Wei, D. T., Chen, Z. X., Sun, C., et al. (2015). Structural Analogue Modeling and PIV Finite Strain Analysis: Implications to Tectonic Fracture Prediction. Geol. J. China Univ. 22 (1), 171–182.
Sun, Z., Zhou, D., Zhong, Z., Zeng, Z., and Wu, S. (2003). Experimental Evidence for the Dynamics of the Formation of the Yinggehai Basin, NW South China Sea. Tectonophysics 372, 41–58. doi:10.1016/S0040-1951(03)00230-0
Tapponnier, P., Peltzer, G., Ledain, A. Y., Armijo, R., and Cobbold, P. (1982). Propagating Extrusion Tectonics in Asia - New Insights from Simple Experiments With Plasticine. Geology 10, 611–616. doi:10.1130/0091-7613(1982)10<611:Petian>2.0.Co;2
Tapponnier, P., Peltzer, G., and Armijo, R. (1986). “On the Mechanics of the Collision between India and Asia,” in Collision Tectonics. Editors M. P. Coward, and A. C. Ries (Geological Society, London, Special Publications), Vol. 19, 113–157.
Taylor, B., and Hayes, D. E. (1983). “Origin and History of the South China Sea basin,” in The Tectonic and Geologic Evolution of Southeast Asian Seas and Islands, Part 2, Geophysical Monograph Series. Editor D. E. Hayes (Washington, DC: AGU), Vol. 27, 23–56.
Wang, X., He, J., Ding, L., and Gao, R. (2013). A Possible Mechanism for the Initiation of the Yinggehai Basin: A Visco-Elasto-Plastic Model. J. Asian Earth Sci. 74, 25–36. doi:10.1016/j.jseaes.2013.05.022
Yang, Z., and Besse, J. (1993). Paleomagnetic Study of Permian and Mesozoic Sedimentary Rocks From Northern Thailand Supports the Extrusion Model for Indochina. Earth Planet. Sci. Lett. 117, 525–552. doi:10.1016/0012-821x(93)90101-E
Zhang, Y., Sun, Z., Zhou, D., Guo, X., Shi, X., Wu, X., et al. (2008). Stretching Characteristics and its Dynamic Significance of the Northern continental Margin of South China Sea. Sci. China Ser. D Earth Sci. 51, 422–430. doi:10.1007/s11430-008-0019-2
Zhu, M., Graham, S., and McHargue, T. (2009). The Red River Fault Zone in the Yinggehai Basin, South China Sea. Tectonophysics 476, 397–417. doi:10.1016/j.tecto.2009.06.015
Keywords: sandbox modeling, Yinggehai Basin, transrotational tectonics, poles of rotation, Indochina block
Citation: Liu J, Jia D, Yin H, Shen L, Fan X, He Z, Cui J, Yang S and Zhang Y (2021) Sandbox Modeling of Transrotational Tectonics With Changeable Poles: Implications for the Yinggehai Basin. Front. Earth Sci. 9:687789. doi: 10.3389/feart.2021.687789
Received: 30 March 2021; Accepted: 22 June 2021;
Published: 30 July 2021.
Edited by:
Lei Wu, Zhejiang University, ChinaReviewed by:
Chao Lei, China University of Geosciences Wuhan, ChinaChunyang Wang, Ministry of Natural Resources, China
Copyright © 2021 Liu, Jia, Yin, Shen, Fan, He, Cui, Yang and Zhang. This is an open-access article distributed under the terms of the Creative Commons Attribution License (CC BY). The use, distribution or reproduction in other forums is permitted, provided the original author(s) and the copyright owner(s) are credited and that the original publication in this journal is cited, in accordance with accepted academic practice. No use, distribution or reproduction is permitted which does not comply with these terms.
*Correspondence: Dong Jia, ZGppYUBuanUuZWR1LmNu