 Kexin Song
 Li Tao1,2*
 Jianyun Gao
- 1School of Atmospheric Sciences, Nanjing University of Information Science and Technology, Nanjing, China
- 2Key Laboratory of Meteorological Disaster, Ministry of Education (KLME), Nanjing University of Information Science and Technology, Nanjing, China
- 3Fujian Key Laboratory of Severe Weather, Fujian Institute of Meteorological Sciences, Fuzhou, China
The low-level monsoon trough over the western North Pacific (WNP) can evolve into a large cyclonic circulation, which is often termed a monsoon gyre (MG). Previous studies have revealed that tropical cyclones (TCs) embedded in MGs can experience rapid weakening (RW) and such RW might be attributed to the convective activity in the southeastern quadrant of the MG, which could induce asymmetries in a TC’s inner core structure, while the environmental factors, including the sea surface temperature (SST) and vertical wind shear (VWS), were not primary contributors to RW events. In this study, the possible role of large-scale environmental factors in association with the RW of TCs in MGs over the WNP is revisited based on the best-track TC and global reanalysis data during 2000–2018. Results indicate that TCs tend to weaken rapidly when they are embedded in the eastern semicircle of a MG, with the extreme RW events often occurring in the southeastern quadrant of a MG. However, different from previous studies, results from this study demonstrated that lower SST and strong large-scale VWS in the eastern semicircle of a MG are two major environmental factors contributing to the RW of TCs in MGs over the WNP. The different findings in this study from those in previous studies could be partly due to the different methods used to obtain the MG circulations and partly due to the environmental factors being analyzed in different quadrants of MG in this study.
Introduction
The low-level monsoon trough over the western North Pacific (WNP) and South China Sea, characterized by the cyclonic shear and confluence zone between the southwesterly on the equatorial side and the northeasterly on the poleward side, is the most common climate feature of the summer monsoon circulation over the WNP (Holland, 1995). The monsoon trough sometimes evolves into a large-scale, quasi-circular cyclonic gyre circulation with a diameter of about 2,500 km and a duration of 2–3 weeks. The circulation often called a monsoon gyre (MG) (Lander, 1994; Lander, 1996; Harr et al., 1996). MGs usually occur in the active tropical cyclone (TC) season over the WNP. The average MG is characterized by a large-scale cyclonic circulation in the middle-lower troposphere and an anticyclonic circulation in the upper troposphere, exhibiting a distinct baroclinic vertical structure (Wu et al., 2013b; Liang et al., 2018a). MGs often present a horizontally asymmetric structure with enhanced convective activity and strong southwesterly winds on its south-southeastern side. Such an asymmetric structure is known to result primarily from the beta-induced Rossby wave energy dispersion of the gyre circulation (Carr and Elsberry, 1995; Wu et al., 2013b; Liang et al., 2014; Liang et al., 2018a).
When a TC is located in a MG circulation, strong binary interaction may occur. Such a binary interaction can sometimes result in a coalescence of the TC with the MG in which the TC is embedded. During the coalescence period, the Rossby wave energy dispersion would be greatly enhanced, resulting in a strong ridge on the southeastern edge of this coalesced system. The enhanced southeasterly flows across the TC center lead to a sudden northward track changes of the TC (Carr and Elsberry, 1995). Wu et al. (2013a) compared sudden northward track changes and westward tracks during 2000–2010 and found that the synoptic-scale steering flow mainly controls the sudden northward turning tracks, while the steering flow on intraseasonal timescale controls the westward turning tracks. This may explain the larger forecasting errors associated with northward turns than westward turns. Liu et al. (2018) indicated that TCs tend to move northward when they are embedded in three types of intraseasonal (10–60 days) background flows: the MG pattern, mid-latitude trough pattern, and wavetrain pattern. In idealized numerical experiments, Liang and Wu (2015) identified three types of tracks when a TC is located in the eastern semicircle of a MG: a sudden northward turning track, a northward track without a sharp turn, and a westward track. They found that the track types were sensitive to the location of the TC relative to the MG center, while the intensity and size of the MG and the TC had little effect on TC track. Ge et al. (2018) conducted idealized numerical experiments and found that a TC could experience a sudden northward turning motion only when the TC was embedded in a relatively deep MG.
What’s more, intraseasonal oscillation (ISO) and MG may modulate the genesis and size of TCs. In the convective phase of an ISO, the synoptic disturbances are often strengthened and well organized, which are conductive to TC genesis (Straub and Kiladis, 2003; Maloney and Hartmann, 2000; Maloney and Hartmann, 2001; Hartmann and Maloney, 2001; Hsu et al., 2011; Ling et al., 2016; Ling et al., 2020). Lander (1994) found sequential geneses of very small TCs in the eastern periphery of a MG. He also found that sometimes a MG itself might evolve into a large TC. Based on the statistical analysis during 1984–1992 (lack of 1989), Ritchie and Holland (1999) found that 3% of TC genesis events are associated with MGs over the WNP. However, Chen et al. (2004) found that 70% of TC geneses over the WNP are related to MGs. This difference is primarily due to the different definitions of MGs (Wu et al., 2013b). According to Wu et al. (2013b) and Liang et al. (2014), 19.8% of TC geneses over the WNP are related to MGs, and among them most TCs form near the centers of MGs and only a small portion form at the northeastern end of the enhanced southwesterly flow where large-scale vertical wind shear (VWS) is relatively weak. Bi et al. (2015) found that when a TC is located near the center of a MG, the coalescence of the two systems would enlarge the outer-core size of the TC. Wu et al. (2015) also indicated that the large size TCs may be associated with the low frequency MG.
In addition to TC track, genesis, and size, more recent studies have also revealed that MGs over the WNP can impose significant influence on TC intensity change. Based on observational analysis and numerical simulation for Typhoon Chan-Hom (2015) Liang et al. (2016) and Liang et al. (2018b) found that Chan-Hom experienced a rapid weakening (RW) and a sudden track change during the coalescence process with a MG, and all operational forecasts failed to predict such a RW event. They suggested that the enhanced convection on the eastern side of the MG prevented mass and moisture from being transported into the inner core of Chan-Hom, which caused the collapse of the TC’s eastern eyewall. Based on statistical analysis of TC RW events during 2000–2014, Liang et al. (2018a) also found that more than 40% of TC RW events over the WNP were associated with MGs, and the RW might be related to TC structural changes induced by the interaction between the TC and the MG. They also indicated that the large-scale environmental factors, including changes of sea surface temperature (SST), VWS, and mid-level environmental humidity, were not primary contributors to the RW of TCs, though the VWS increased slightly when the RW occurred during the MG period. They suggested that MG might weaken TC intensity by modulating TC’s structure, which is consistent with their previous studies (Liang et al., 2016; Liang et al., 2018b). Based on idealized numerical experiments, Yan et al. (2019) suggested that TC development in a MG could be interfered by three dynamical mechanisms, namely vorticity segregation process, barotropic instability, and VWS.
Liang et al. (2018a) and Wu et al. (2013b) used a low-pass Lanczos filter with a 10-days cutoff to the wind fields in which the TC circulation was removed using the method of Kurihara et al. (1993) and Kurihara et al. (1995) to obtain a MG. The identified MG based on the temporal filtering may have the footprint of the TC circulation (Figures 1G,H), while the spatial filtering can separate TC circulation and MG circulation more effectively when the MG and TC are nearly overlapped and the TC moves slowly than do the temporal filtering. In this study, instead of time filtering, a spatial filtering method (spherical harmonic analysis) to decompose the streamfunction at 850 hPa was used to get MGs and to revisit the TC RW associated with MGs over the WNP. We analyze the TCs intensity change and various environmental factors in different quadrants and radii relative to the center of the averaged MG. In addition, Liang et al. (2018a) suggested that MGs could lead to TC RW by modulating the TC structure, with the large-scale environmental factors, including SST change, VWS, and mid-level environmental humidity, being not the primary factors for the RW events. We will show that the scale separation using the spatial filtering is more effective/robust in obtaining a MG circulation than the time filtering and the strong VWS and lower SST are two main environmental factors that are responsible for the RW of TCs in MGs. The rest of the paper is organized as follows. The data and methods are described in Data and Methods. Statistical comparison of RW events associated and not associated with MGs is given in Statistical Analysis of TC Intensity Changes in MGs. The involved physical mechanisms are analyzed and discussed in Possible Mechanisms of TC RW in MGs. Conclusions and discussion are given in Conclusion and Discussion.
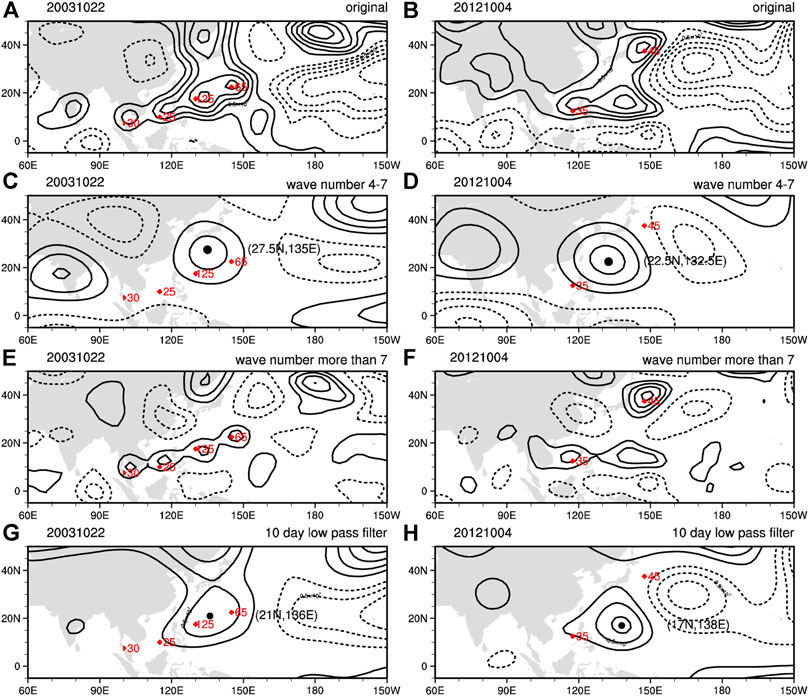
FIGURE 1. Examples of separating MG and TCs by spatial filtering method with a spherical harmonic expansion and Lanczos time filtering method on (A), (C), (E), (G) October 22, 2003 and (B), (D), (F), (H) October 4, 2012 (A) and (B) are the original streamfunction fields at 850 hPa (C) and (D) are streamfunction fields at 850 hPa with wavenumbers 4–7 (E) and (F) are streamfunction fields at 850 hPa with wavenumbers larger than 7, and (G) and (H) are streamfunction fields at 850 hPa obtained by the time filtering method. The red dots are TC centers from the JTWC, the red numbers are the 1 min average sustained wind speeds, and the black dots are the MG circulation centers.
Data and Methods
The best-track TC data from 2000 to 2018 over the WNP used in this study were obtained from the Joint Typhoon Warning Center (JTWC), which include 6-h TC center position (longitude and latitude) and maximum 1-min average sustained surface wind speed of each TC. JTWC datasets were used to identify the position and intensity change of TCs, so as to obtain rapid weakening events. The daily wind fields from 2000 to 2018 were obtained from the Reanalysis-2 dataset of the National Centers for Environmental Prediction-Department of Energy (NCEP-DOE), with a horizontal resolution of 2.5° × 2.5° (Kanamitsu et al., 2002). The SST data are the daily Optimum Interpolation SST, version 2 (OISSTv2) of the National Oceanic and Atmospheric Administration (NOAA) (Reynolds et al., 2007) with a horizontal resolutions of 0.25° × 0.25°. The daily outgoing longwave radiation data derived from NOAA (Liebmann and Smith, 1996) were used to detect convective activities associated with MGs, which has a horizontal resolution of 2.5° × 2.5°.
To remove the TC circulations from a MG, the spatial filtering method, namely the spherical harmonic analysis (Qian et al., 2014), was used to separate the MG and the TC circulations. First, the streamfunction of the 850 hPa wind field was calculated, with the negative (positive) streamfunction center representing the cyclonic (anticyclonic) circulation. Then, the spherical harmonic analysis of the streamfunction was performed with the triangle truncation. Figure 1 shows two examples of the spherical harmonic expansion analysis used in this study. The unfiltered streamfunction field at 850 hPa contains both TC and large-scale circulations (Figures 1A,B). The streamfunction with wavenumber 4–7 represents the MG-scale circulation (Figures 1C,D), while that with wavenumber high than 7 represents the synoptic and meso-scale motions (Figures 1E,F). It is clear that the streamfunction with wavenumber 4–7 can correspond well the MG-scale circulation, and the synoptic and meso-scale cyclonic circulation centers correspond well with the TC centers (red dot) from the JTWC best track data (Figures 1E,F). The MGs obtained using the time filtering method (Wu et al., 2013b; Liang et al., 2018a) are also shown in Figures 1G,H for a comparison. It is clear that TCs have footprint on the shape and location of the identified MGs obtained by using the time filtering method. Kurihara’s method and low-pass time filtering with a 10-days cutoff cannot completely remove the strong TC circulation, and the residual TC circulation may cause some interference to MG circulation. Specifically, compared with the MG obtained based on spatial filtering, the MG circulations obtained based on time filtering are less circular and more symmetric, probably due to having asymmetric components with smaller scales.
The streamfunction with wavenumbers 4–7 was selected as a MG if the central minimum value of streamfunction was less than −0.7σ (σ is the SD) and the duration of the circulation was at least 4 days (Wu et al., 2013b; Liang et al., 2018a). The size of the MGs we obtained is consistent with the MG size in the previous studies (Lander, 1994, Lander, 1996; Harr et al., 1996) with a diameter of about 2,500 km (Figures 1C,D). The location of the minimum MG-scale streamfunction was defined as the MG center. We only selected the MGs in the region (0°–30°N, 120°–150°E) over the WNP. Figure 2B shows the locations of the selected MG (marked with red dots) in May–October for the period 2000–2018. Here, the center of the MG (the red dot in Figure 2B) is fixed which is the position where the MG reaches the maximum intensity during its lifetime. However, in the composite analysis, the center of the MG is the position of the maximum intensity of the streamfunction at every time step, which is not fixed during its lifetime. Among the 3,496 days examined, 549 days were found with a MG. In total, 77 MGs have been identified, with an average of 4 MGs per year and an average duration of 7.1 days per MG. These are in general consistent with the results of Liang et al. (2018a), who identified 2.9 MGs per year with an average duration of 8.0 days per MG. In the following analysis, the days when MG is identified are defined as the MG period, and the rest days are defined as the non-MG period. Figure 3 shows the composite streamfunction at 850 and 200 hPa relative to the MG centers at 850 hPa. As we can see, the MG presents a baroclinic structure with a cyclonic circulation at 850 hPa and an anticyclonic circulation at 200 hPa.
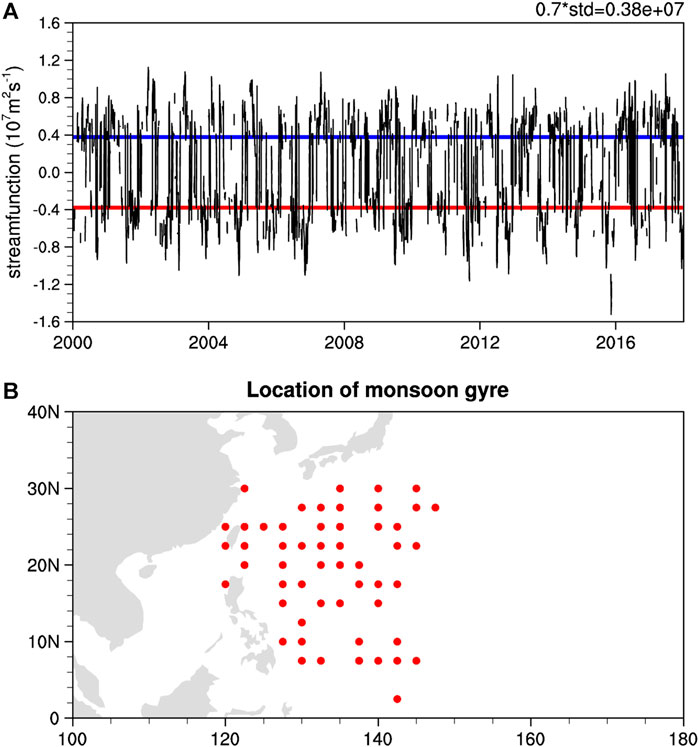
FIGURE 2. (A) The daily extreme value of streamfunction with wavenumbers 4–7 in the region of (0°–30°N, 120°–150°E) in May–October during 2000–2018, where the blue and red horizontal lines in (A) are positive and negative 0.7 times the standard deviation of extreme value of streamfunction, respectively; and (B) Locations of MG centers in the same period.
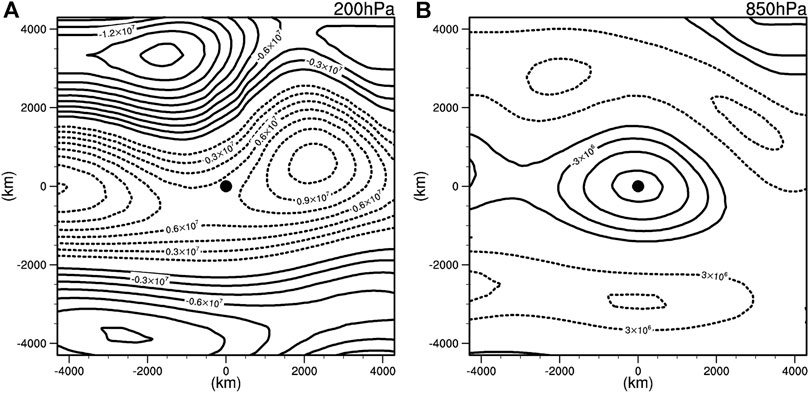
FIGURE 3. Composite 200 hPa streamfunction (m2 s−1) at 200 hPa (A) and 850 hPa (B) with the wavenumbers 4–7 centered at the center of MGs at 850 hPa. The origin (0,0) is the center of MGs.
We defined RW events in the way similar to that used in DeMaria et al. (2012) and Liang et al. (2018a). Namely, a 24-h TC intensity reduction of 20 kt or above was defined as an RW event. To eliminate the TC weakening due to extratropical transition, we removed all TCs experiencing their extratropical transition stages based on the JTWC best-track data. We also excluded any RW cases when the TC center was within 200 km from the nearest landmass in 24 h to avoid any significant land or topographic effect on TC weakening.
Statistical Analysis of TC Intensity Changes in MGs
To demonstrate the importance of MGs to RW of TCs over the WNP, we first examined the weakening ratio, which is defined as the number of weakening events divided by the number of total events in 6-h intervals (including both weakening and intensification events, excluded those with no intensity change). The area where the weakening ratio is greater than 0.5 means that the 6-h weakening events occur more frequently than the 6-h intensification events in the corresponding area, indicating that this area is conducive to the occurrence of TC weakening. Figure 4A shows the weakening ratio during May–October from 2000 to 2018. The weakening ratio increases with the increasing latitude due to the decrease in SST and increase in large-scale VWS in general toward the extratropical latitudes (Hanley et al., 2001). The TC weakening ratio is less than 0.5 south of 25°N, indicating that more TCs are in their intensification stages in favorable environmental conditions. The weakening ratio is more than 0.5 north of 25°N, indicating that the corresponding oceanic and atmospheric conditions are unfavorable for TC intensification, and thus more favorable for TC weakening.
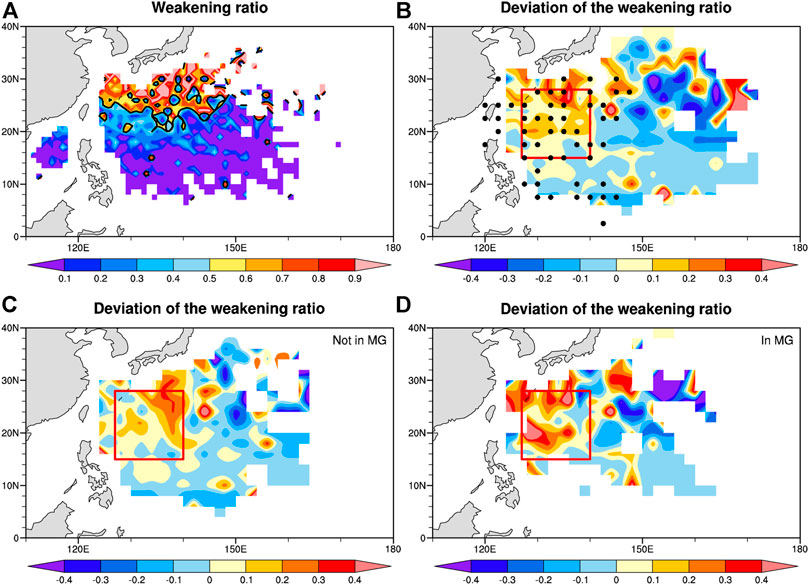
FIGURE 4. (A) TC weakening ratio (shadings) during 2000–2018, solid black contour is the weakening ratio of 0.5 (B) The deviation of the weakening ratio from the zonal average between 120°E and 180°E, with black dots being the locations of MGs, and red rectangle outlining the active region of MGs (C) The deviation of the weakening ratio from the zonal average during the non-MG period (D) The deviation of the weakening ratio from the zonal average during the MG period.
Figure 4B shows the deviation of the weakening ratio from its zonal average between 120°E and 180°E, in which the centers of MGs are marked in black dots and the active region of MGs is outlined with the red rectangle mainly in the western part of WNP. We can see that positive deviations in the active region of MGs indicate that TCs are more likely to weaken under the influence of MGs. In the following statistical analysis, we mainly focus on the TC weakening and intensification events south of 40°N and west of 165°E, namely, in the region where TC intensity change is largely affected by MGs over the WNP. The deviations of weakening ratio from its zonal average during the non-MG period and the MG period are compared in Figures 4C,D. In the MG active region (in the red rectangle), the positive deviation of weakening ratio is significantly larger during the MG period (Figure 4D) than during the non-MG period (Figure 4C), indicating that MGs are generally unfavorable for TC intensification. Namely, TCs are more likely to weaken in the active region of MGs during the MG period.
Figure 5 compares the probability distributions of the 24-h weakening rate and 24-h intensification rate. Here, the respective (weakening/intensification) rate is defined as
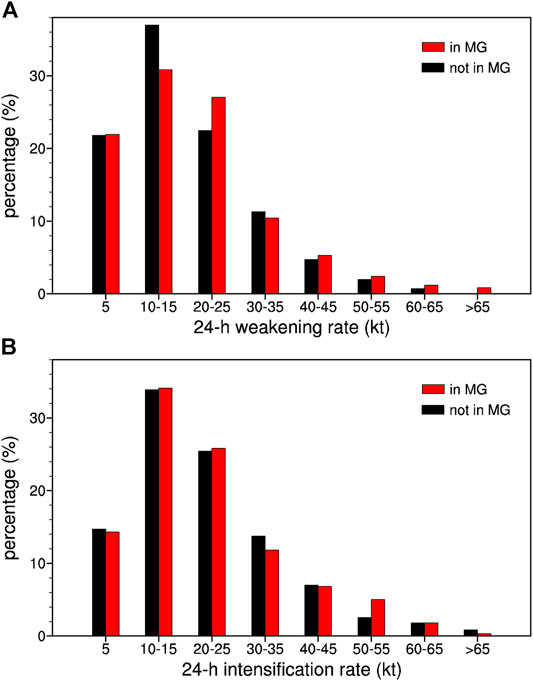
FIGURE 5. (A) The percentage of over-water 24-h weakening rate and (B) the percentage of over-water 24-h intensification rate. Events in and not in MGs are denoted by red bars and black bars, respectively. The horizontal coordinate is the 24-h intensity change of TCs (knot).
Possible Mechanisms of TC RW in MGs
In this section, we attempt to understand why TCs are more likely to weaken more rapidly during the MG period than during the non-MG period. Apart from the internal dynamical processes which can affect on the TC intensity change, many previous studies have also investigated several key large-scale environmental factors that can affect the weakening rate of a TC over the open ocean, such as the increased VWS, lower SST, and dry air intrusion (Frank and Ritchie, 2001; Kaplan and DeMaria, 2003; Zhang et al., 2007; Kaplan et al., 2010; Riemer et al., 2010; Tang and Emanuel, 2010; Shu et al., 2011; Qian and Zhang 2013; Chen et al., 2015; Wood and Ritchie, 2015; Fowler and Galarneau, 2017; Ma et al., 2019; Fei et al., 2020). Liang et al. (2018a) suggested that MGs could lead to RW events by modulating the TC structure, while the large-scale environmental factors, such as SST, VWS, and mid-level environmental humidity, were not major contributors to the TC RW in MGs. Here, we will revisit the possible role of large-scale factors that may contribute to TC RW in MGs by comparing the environmental factors during the MG period and the non-MG period.
We first examined the differences in large-scale environmental factors that are believed to affect TC intensity change during the MG period and non-MG period. Figure 6 compares the distributions of anomalies in deep VWS (defined as the VWS between 200 and 850 hPa) and shallow VWS (defined as the VWS between 850 and 1,000 hPa) during the two periods. The VWS anomalies are obtained by subtracting the daily climatological mean from the original daily VWS. To facilitate a direct comparison, the RW events in the respective periods are overlaid with red dots in Figure 6. Regardless the MG and non-MG periods, the RW events usually occur in the region of 120–160°E, 14–30°N. Both the deep VWS and shallow VWS are larger over most of the region with the occurrence of RW events during the MG period but are smaller over most of the region with RW events during the non-MG period. This seems to indicate that large-scale VWS plays a more important role in leading to RW of TCs in the MG period than in the non-MG period because large VWS are often negative to TC development and maintenance (Frank and Ritchie, 2001; Wong and Chan, 2004; Riemer et al., 2010; Wang et al., 2015). The distributions of SST and 500-hPa relative humidity during the MG period and the non-MG period are compared in Figure 7. The SST during the MG period is lower than that during the non-MG period (Figures 7A,B). The 500-hPa relative humidity is higher in the southeastern region of the occurrence of RW events and lower in the northwestern region during the MG period (Figure 7C) and it is opposite during the non-MG period (Figure 7D). This suggests that the mid-level moist condition contributes little to RW of TCs in the MG period. Based on above analysis, VWS (both deep layer and shallow layer shears) and SST are two key factors that are most likely responsible for RW of TCs during the MG period.
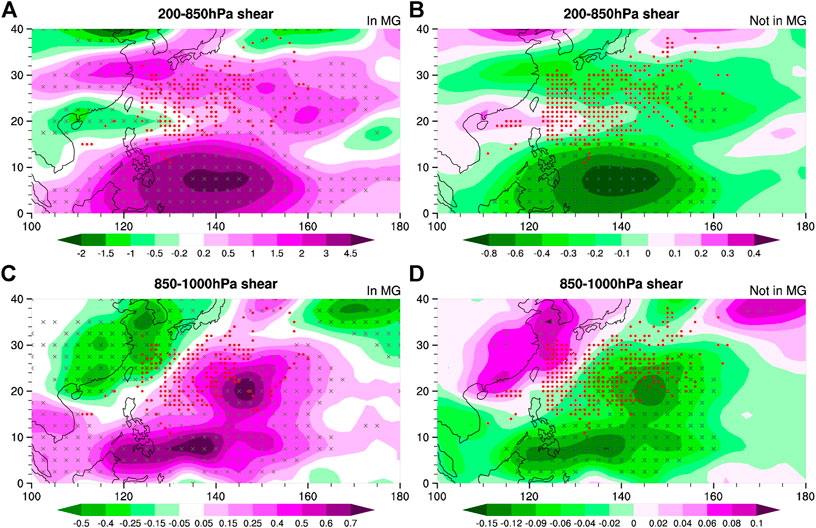
FIGURE 6. Anomalies in deep VWS between 200 and 850 hPa (m s−1, shadings) with the daily climatology removed during the MG period (A) and the non-MG period (B), and those in shallow VWS between 850 and 1000 hPa (m s−1, shadings) during the MG period (C) and the non-MG period (D). The red dots are the locations of the RW events during their corresponding periods. The black crosses represent the area where the statistical significance exceeds the 95% confidence level based on the Student’s t test.
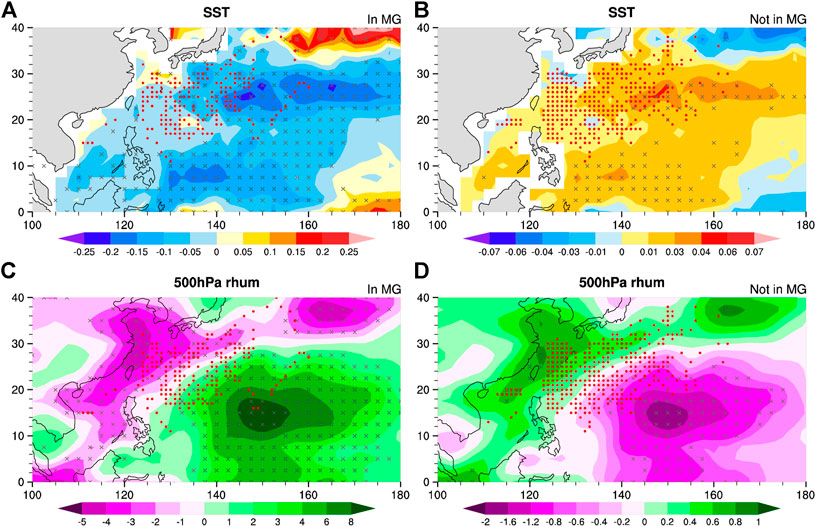
FIGURE 7. SST anomalies (°C, shadings) with the daily climatology removed during the MG period (A) and the non-MG period (B) and mid-level relative humidity anomalies (%, shadings) with the daily climatology removed during the MG period (C) and the non-MG period (D). The red dots are the locations of the RW events during the corresponding periods. The black crosses represent the area where the statistical significance exceeds the 95% confidence level based on the Student’s t test.
Because of the large asymmetric structure of MGs, it is important to examine any preferent regions in a MG where TCs are more likely to weaken more rapidly and to understand environmental features in the identified region as well. Therefore, we further examined the dependence of TC intensity change on the distance of the TC centers from the centers of MGs, with the results shown in Figure 8. The azimuthally averaged weakening rate is small in the region close to the center of a MG, increases with the radial distance from the MG center, reaches a maximum at the radius of about 1,300 km from the MG center, and then decreases with increasing distance (Figure 8A). However, the azimuthally averaged intensification rate is almost independence of the distance from the MG center (Figure 8B).
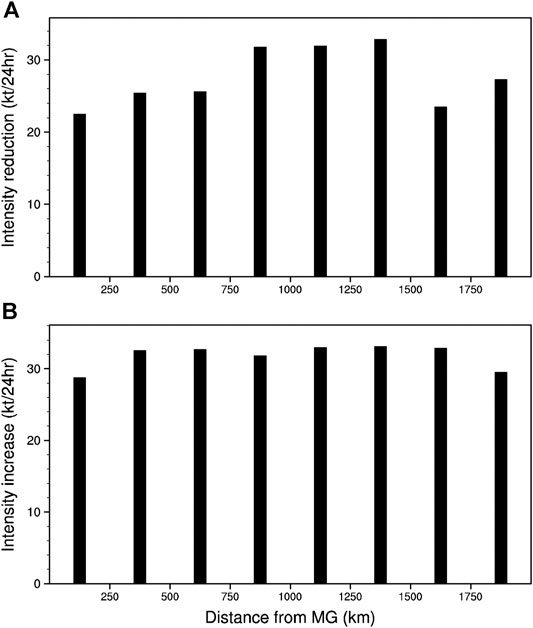
FIGURE 8. The azimuthally averaged intensity changes of RW events (A) and that of RI events (B) as a function of the distance of the TC center from the MG center. The vertical coordinate indicates the 24-h TC intensity changes (knot).
In addition to the radial distance from the MG center, we also examined whether the RW and RI events of TCs show any preferent azimuthal locations relative to the center of MGs based on a composite analysis during the study period. Figure 9 shows the RW events and RI events with respect to the composite MG center, with the outgoing longwave radiation (OLR) superimposed to indicate the convective activity in the MG circulation. As illustrated in Figure 9A, the RW events mainly occur in the eastern semicircle of a MG. The RW events in the northern semicircle of a MG may be partly contributed by the lower SST (red contours in Figure 9A) or larger VWS (blue contours in Figure 9B) at relatively higher latitudes. However, the RW events are mostly located in the eastern quadrant of MGs (red and orange dots in Figure 9A), and these events should be predominantly affected by MGs. By contrast, the RI events are scattered in the MG, with the extreme RI events concentrated due east and mostly in the southeastern quadrant in the MG (red and orange dots in Figure 9B). Previous studies have shown that the Rossby wave energy dispersion from a MG can be substantially enhanced during its interaction with a TC, resulting in strong southwesterly flows in the southeastern and eastern periphery of a MG (Carr and Elsberry, 1995; Wu et al., 2011a; Wu et al., 2011b; Wu et al., 2013b), with strong convection developed at the downwind end of the strong southwesterly flow (Liang et al., 2014). Consistent with previous studies (Carr and Elsberry, 1995; Wu et al., 2013b; Liang et al., 2014; Liang et al., 2018a), we also find convective activity in the southeastern quadrant of a MG (Figure 9). Therefore, the extreme RW events may be also affected by convective activity in the southeastern quadrant of the MG.
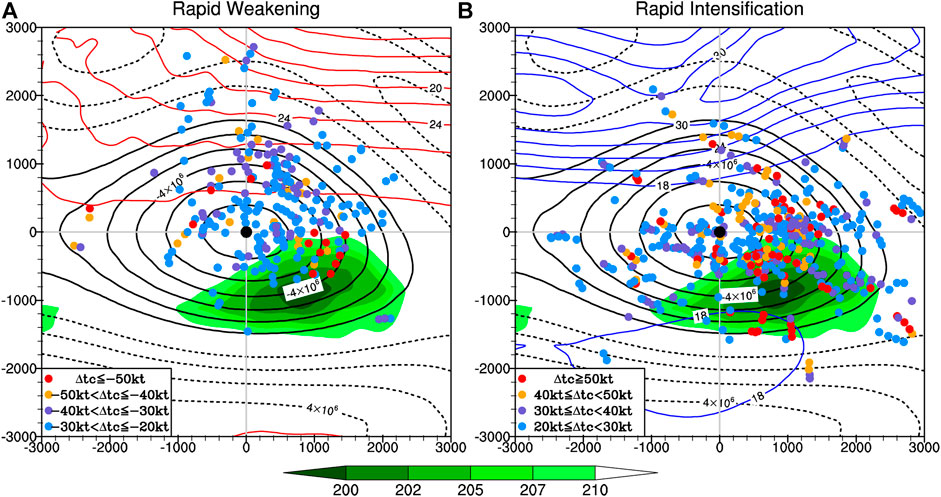
FIGURE 9. The positions of (A) RW and (B) RI events (color dots) with respect to the MG center (large black dot). The red contours in (A) are SST (°C) and the blue contours in (B) are VWS between 200 and 850 hPa (m s−1) in the composite MG, respectively. The black contours and shadings in (A) and (B) are the streamfunction (m2 s−1) and the distribution of OLR (K) in the composite MG, respectively.
Although active convection in the southeastern quadrant of a MG may play an important role in leading to RW of TCs embedded in the MG as demonstrated by Liang et al. (2014), a natural question arises as to whether the unfavorable environmental conditions may also play some important roles in RW of TCs therein. As illustrated in Figure 3, a MG is characterized by large-scale anticyclonic circulation in the upper atmosphere and cyclonic circulation in the middle-lower atmosphere, exhibiting a distinct baroclinic vertical structure. Such a vertical structure implies large VWS in the MG, especially in the southeastern quadrant. To examine the distribution of VWS in the MG circulation, we calculated both deep and shallow VWSs centered on the composite MG center after removing the seasonal cycle, with the results shown in Figure 10. Note that we show the deep and shallow VWSs without the spatial filtering in Figures 10A,D those with the synoptic and mesoscale components removed in Figures 10B,E and those corresponding to the composite MG circulation in Figures 10C,F. It is evident that the deep VWS in the original wind field is extraordinarily large in the south-southeastern quadrant of the MG, and positive VWS anomalies also appear in the northeastern quadrant of the composite MG (Figure 10A). The shallow VWS shows the similar distribution with positive anomalies in the southeastern and northeastern quadrants of the composite MG (Figure 10D). This suggests that VWS may play important roles in causing TCs to weaken rapidly in the eastern semicircle of a MG. The large VWS in the original wind field in the southeastern quadrant of the MG is predominantly contributed by the VWS related to the background and the MG-scale circulation (wavenumber 0–7, Figures 10B,C,E,F). This demonstrated that it is the large VWS, including the shallow VWS, associated with the background and MG-scale circulations that is conducive to the extreme RW of TCs in the southeastern quadrant of a MG.
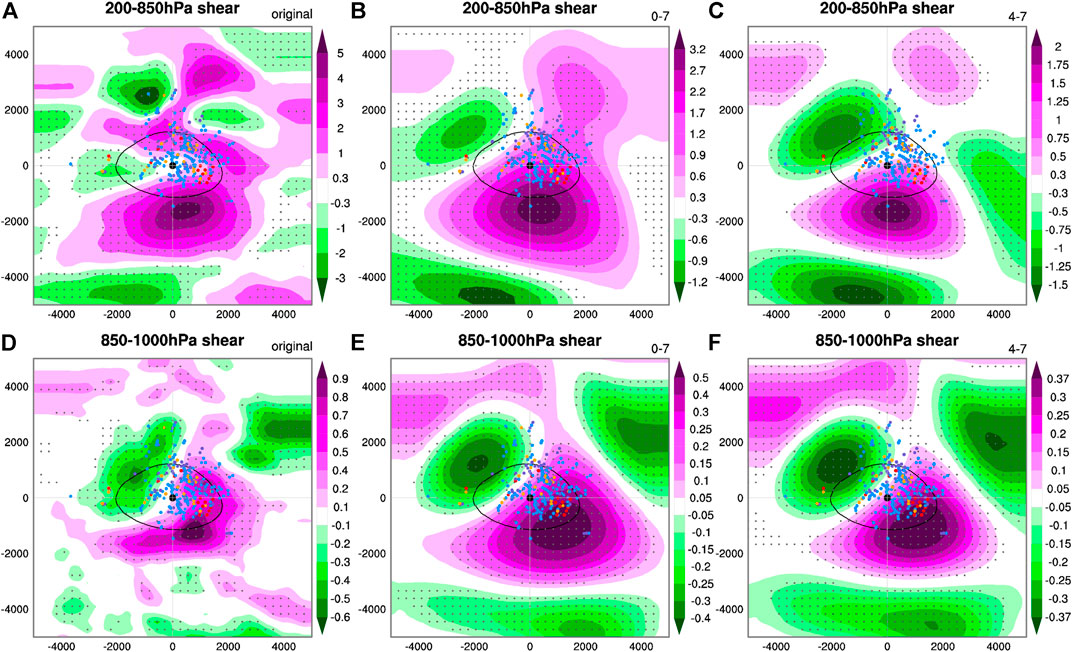
FIGURE 10. (A–C) Composite deep (200–850 hPa) VWS anomalies (m s−1, shadings) relative to the daily climatology centered on the composite MG, and (D–F) composite shallow (850–1,000 hPa) VWS anomalies (m s−1, shadings) relative to the daily climatology centered on the composite MG (A) and (D) VWS without filtering (B) and (E) VWS with wavenumbers 0–7 (C) and (F) VWS with wavenumbers 4–7. The origin (0,0) is the position of the MG center, the black contour represents the MG center and the small dots indicate the locations of RW events of TCs. The black crosses represent the area that exceeds the statistical Student’s t test at the 0.05 significance level.
We also examined the composite SST anomalies relative to the MG center with the seasonal cycle removed by subtracting the daily climatological SST from the original daily SST (Figure 11A). Note that the spatial filtering with the spherical harmonic expansion could not be applied to SST. The negative SST anomalies are present in the northeastern and southeastern quadrants of the composite MG. Although the anomalies are not very large, they are unfavorable for TC intensification and should partly contribute to RW of TCs in the eastern semicircle of a MG. The negative SST anomalies could be partly due to the increased cloud cover caused by enhanced convection (Figure 9) and partly due to the enhanced evaporation caused by enhanced surface southwesterly monsoon flow (Figure not shown) in the southeastern quadrant of the MG. Consistent with the enhanced convective activities, the 500-hPa relative humidity is relatively high in the southeastern quadrant of the MG (Figures 11B–D), consistent with previous studies (Liang et al., 2014). However, the region with strong convective activities is farther upstream of the regions with RW of TCs in the MG, suggesting that strong convection and high relative humidity in the southeastern quadrant of the MG might contribute marginally to RW of TCs in a MG.
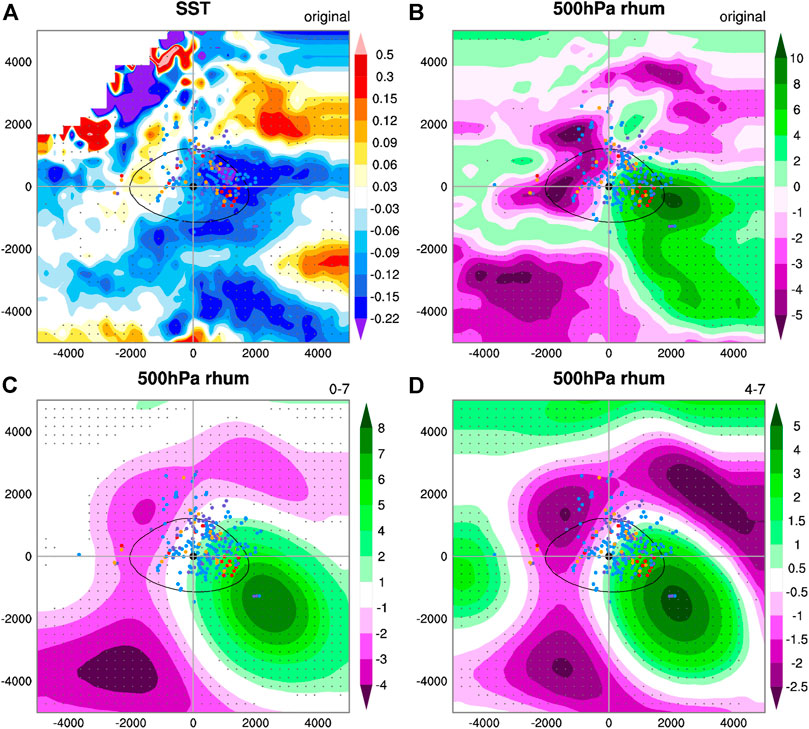
FIGURE 11. (A) Composite SST anomalies (°C, shadings) relative to the daily climatology centered on the MG (B–D) Composite mid-level relative humidity anomalies (%, shadings) relative to the daily climatology centered on the MG (B) Relative humidity anomalies without spatial filtering (C) relative humidity anomalies with wavenumbers 0–7; and (D) relative humidity with wavenumbers 4–7. The origin (0,0) is the position of the MG center, and the large black dots is the MG and the small dots are the locations of the RW events. The black dots represent the area that exceeds the statistical Student’s t test at the 0.05 significance level.
Conclusion and Discussion
This study has revisited the effect of MGs on RW of TCs during May–October over the WNP based on best-track TC data and global reanalysis during 2000–2018. Consistent with previous studies, MGs obtained with spatial filtering using the spherical harmonic expansion in this study have a baroclinic vertical structure with a cyclonic gyre circulation in the middle-lower troposphere and an anticyclonic circulation in the upper troposphere. Results from statistical analyses indicate that TCs are more likely to weaken rapidly during the MG period than during the non-MG period with most of the RW events occurring in the eastern semicircle of MGs and with the extreme RW events often occurring in the southeastern quadrant of a MG.
Compared with the non-MG period, both the deep and shallow VWSs are larger and SST is lower, and thus more favorable for TC RW during the MG period over the WNP. Results from the composite of environmental fields centered on the MG centers indicate that the deep and shallow VWSs are considerably larger and the SST is lower in the eastern semicircle of a MG. The larger VWS and lower SST are conducive to RW of TCs in the eastern semicircle of the MG and to the extreme RW of TCs in the southeastern quadrant of a MG. The relative humidity in the middle troposphere is relatively higher in the southeastern quadrant of a MG, which is accompanied with active convection, and might be secondary to RW of TCs in MGs.
The above results are different from those in Liang et al. (2018a), who found that the RW events associated with MGs usually occurred near the center of MGs during the sudden northward turn of the TC motion. They also suggested that MGs caused RW events by modulating the asymmetric structure of TCs. They suggested that the large-scale environmental factors, including SST, VWS, and mid-level environmental humidity, are not the primary factors for RW of TCs based on statistically analysis of TCs during 2000–2014, though they also noticed that there are increases in both deep and shallow VWS prior to and during the rapid weakening in MG. In this study, we showed the distribution of RW events and environmental factors relative to the MG center, and examined the effect of MG on TCs from the perspective of different quadrants of MG. The results showed that larger VWS and lower SST cover over most of the region with the occurrence of RW events. So, we suggested that lower SST and larger large-scale VWS in the eastern semicircle of a MG are two major environmental factors contributing to the RW of TCs in MG. However, it can’t exclude the probability that there are other important factors that are responsible for RWs in MG. It needs to be studied case by case.
The different results regarding the possible contributions of environmental factors to RW of TCs could result primarily from the different methods used to obtain the MG circulations in the two studies, which causes different distribution of RW events in MG. In this study, we employed the spatial filtering method with spherical harmonic expansion to obtain MGs, while Liang et al. (2018a) used the low-pass Lanczos filter with a 10-days cutoff to the wind fields in which the TC circulation is removed to obtain the MG circulation. Due to the limitation of time filtering applied to each season, the identified MGs may include the footprints of TCs and thus the RW events of TCs could be more likely to occur near the center of MGs in their study. It should be noted that the spatial filtering method may limit the scale of TCs.
The findings regarding the role of environmental factors in causing RW events of TCs associated with MGs are consistent with many previous studies. Large ambient VWS is negative to TC intensity due to various ventilation effects (Gray, 1968; Jones, 1995; Frank and Ritchie, 2001; Wang and Wu, 2004; Wu and Braun, 2004; Cram et al., 2007; Riemer et al., 2010; Tang and Emanuel, 2010; Wang et al., 2015; Fei et al., 2020). The intrusion of mid-level dry air into the inner core of a TC can lead to TC weakening as well, especially when the environmental VWS is large (Davis and Ahijevych, 2012; Fowler and Galarneau, 2017). Ma et al. (2019) and Fei et al. (2020) found that a sharp SST gradient (decreasing SST), background SST, and VWS play crucial roles in TC RW, while the ambient relative humidity plays a minor role in RW events of TCs over the WNP, except for dry air to the northwestern quadrant of a TC in large VWS environment. Note that although we have revealed the importance of environmental factors that could be responsible for RW of TCs embedded in MGs, the internal dynamics of TCs in response to convective activity outside the eyewall of a TC may also contribute to the weakening of a TC in MGs (Liang et al., 2018a; Liang et al., 2018b). However, the relative importance of different dynamical/physical processes to RW of TCs in MGs is yet to be investigated in future studies.
Data Availability Statement
The TC best track data were download from https://www.metoc.navy.mil/jtwc/jtwc.html. The NCEP-DOE Renalysis 2 were download from https://psl.noaa.gov/data/gridded/data.ncep.reanalysis2.html. The OISSTv2 data were downloaded from https://psl.noaa.gov/data/gridded/data.noaa.oisst.v2.highres.html. The NOAA OLR data were download from https://psl.noaa.gov/data/gridded/data.interp_OLR.html.
Author Contributions
KS contributed to the idea, data analysis and completed the manuscript writing. LT contributed to the idea and manuscript writing. JG contributed to the manuscript review.
Funding
This study has been supported by the National Key Research and Development Program of China under grant 2016YFA0600402.
Conflict of Interest
The authors declare that the research was conducted in the absence of any commercial or financial relationships that could be construed as a potential conflict of interest.
References
Bi, M., Li, T., Peng, M., and Shen, X. (2015). Interactions between Typhoon Megi (2010) and a Low-Frequency Monsoon Gyre. J. Atmos. Sci. 72, 2682–2702. doi:10.1175/JAS-D-14-0269.1
Carr, L. E., and Elsberry, R. L. (1995). Monsoonal Interactions Leading to Sudden Tropical Cyclone Track Changes. Mon. Weather Rev. 123, 265–290. doi:10.1175/1520-0493(1995)123<0265:MILTST>2.0.CO;2
Chen, T. C., WangYen, S. Y. M. C., and Gallus, W. A. (2004). Role of the Monsoon Gyre in the Interannual Variation of Tropical Cyclone Formation over the Western North Pacific. Weather Forecast. 19, 776–785. doi:10.1175/1520-0434(2004)019<0776:ROTMGI>2.0.CO;2
Chen, X., Wang, Y., and Zhao, K. (2015). Synoptic Flow Patterns and Large-Scale Characteristics Associated with Rapidly Intensifying Tropical Cyclones in the South China Sea. Mon. Weather Rev. 143, 64–87. doi:10.1175/MWR-D-13-00338.1
Cram, T. A., Persing, J., Montgomery, M. T., and Braun, S. A. (2007). A Lagrangian Trajectory View on Transport and Mixing Processes between the Eye, Eyewall, and Environment Using a High-Resolution Simulation of Hurricane Bonnie (1998). J. Atmos. Sci. 64, 1835–1856. doi:10.1175/JAS3921.1
Davis, C. A., and Ahijevych, D. A. (2012). Mesoscale Structural Evolution of Three Tropical Weather Systems Observed during PREDICT. J. Atmos. Sci. 69, 1284–1305. doi:10.1175/JAS-D-11-0225.1
DeMaria, M., DeMaria, R. T., Knaff, J. A., and Molenar, D. (2012). Tropical Cyclone Lightning and Rapid Intensity Change. Mon. Weather Rev. 140, 1828–1842. doi:10.1175/MWR-D-11-00236.1
Fei, R., Xu, J., Wang, Y., and Yang, C. (2020). Factors Affecting the Weakening Rate of Tropical Cyclones over the Western North Pacific. Mon. Weather Rev. 148, 3693–3712. doi:10.1175/MWR-D-19-0356.1
Fowler, J. P., and Galarneau, T. J. (2017). Influence of Storm-Storm and Storm-Environment Interactions on Tropical Cyclone Formation and Evolution. Mon. Wea. Rev. 145, 4855–4875. doi:10.1175/MWR-D-17-0131.1
Frank, W. M., and Ritchie, E. A. (2001). Effects of Vertical Wind Shear on the Intensity and Structure of Numerically Simulated Hurricanes. Mon. Weather Rev. 129, 2249–2269. doi:10.1175/1520-0493(2001)129<2249:EOVWSO>2.0.CO;2
Ge, X., Yan, Z., Peng, M., Bi, M., and Li, T. (2018). Sensitivity of Tropical Cyclone Track to the Vertical Structure of a Nearby Monsoon Gyre. J. Atmos. Sci. 75, 2017–2028. doi:10.1175/JAS-D-17-0201.1
Gray, W. M. (1968). Global View of the Origin of Tropical Disturbances and Storms. Mon. Weather Rev. 96, 669–700. doi:10.1175/1520-0493(1968)096<0669:GVOTOO>2.0.CO;2
Hanley, D., Molinari, J., and Keyser, D. (2001). A Composite Study of the Interactions between Tropical Cyclones and Upper-Tropospheric Troughs. Mon. Weather Rev. 129, 2570–2584. doi:10.1175/1520-0493(2001)129<2570:ACSOTI>2.0.CO;2
Harr, P. A., Elsberry, R. L., and Chan, J. C. L. (1996). Transformation of a Large Monsoon Depression to a Tropical Storm during TCM-93. Mon. Weather Rev. 124, 2625–2643. doi:10.1175/1520-0493(1996)124<2625:TOALMD>2.0.CO;2
Hartmann, D. L., and Maloney, E. D. (2001). The Madden–Julian Oscillation, Barotropic Dynamics, and North Pacific Tropical Cyclone Formation. Part II: Stochastic Barotropic Modeling. J. Atmos. Sci 58, 2559–2570. doi:10.1175/1520-0469(2001)058<2559:TMJOBD>2.0.CO;2
Holland, G. J. (1995). Scale Interaction in the Western Pacific Monsoon. Meteorl. Atmos. Phys. 56, 57–79. doi:10.1007/BF01022521
Hsu, P.-c., Li, T., and Tsou, C.-H. (2011). Interactions between Boreal Summer Intraseasonal Oscillations and Synoptic-Scale Disturbances over the Western North Pacific. Part I: Energetics Diagnosis*. J. Clim. 24, 927–941. doi:10.1175/2010JCLI3833.1
Jones, S. C. (1995). The Evolution of Vortices in Vertical Shear. I: Initially Barotropic Vortices. Q.J R. Met. Soc. 121, 821–851. doi:10.1002/qj.49712152406
Kanamitsu, M., Ebisuzaki, W., Woollen, J., Yang, S.-K., Hnilo, J. J., Fiorino, M., et al. (2002). NCEP-DOE AMIP-II Reanalysis (R-2). Bull. Am. Meteorol. Soc. 83, 1631–1643. doi:10.1175/BAMS-83-11-163110.1175/bams-83-11-1631(2002)083<1631:nar>2.3.co;2
Kaplan, J., and DeMaria, M. (2003). Large-scale Characteristics of Rapidly Intensifying Tropical Cyclones in the North Atlantic basin. Wea. Forecast. 18, 1093–1108. doi:10.1175/1520-0434(2003)018<1093:LCORIT>2.0.CO;2
Kaplan, J., DeMaria., M., and Knaff, J. A. (2010). A Revised Tropical Cyclone Rapid Intensification index for the Atlantic and Eastern North Pacific Basins. Wea. Forecast. 25, 220–241. doi:10.1175/2009WAF2222280.110.1175/2009waf2222280.1
Kurihara, Y., Bender, M. A., and Ross, R. J. (1993). An Initialization Scheme of hurricane Models by Vortex Specification. Mon. Weather Rev. 121, 2030–2045. doi:10.1175/1520-0493(1993)121<2030:AISOHM>2.0.CO;2
Kurihara, Y., Bender, M. A., Tuleya, R. E., and Ross, R. J. (1995). Improvements in the GFDL hurricane Prediction System. Mon. Weather Rev. 123, 2791–2801. doi:10.1175/1520-0493(1995)123<2791:IITGHP>2.0.CO;2
Lander, M. A. (1994). Description of a Monsoon Gyre and its Effects on the Tropical Cyclones in the Western North Pacific during August 1991. Weather Forecast. 9, 640–654. doi:10.1175/1520-0434(1994)009<0640:DOAMGA>2.0.CO;2
Lander, M. A. (1996). Specific Tropical Cyclone Track Types and Unusual Tropical Cyclone Motions Associated with a Reverse-Oriented Monsoon Trough in the Western North Pacific. Weather Forecast. 11, 170–186. doi:10.1175/1520-0434(1996)011<0170:STCTTA>2.0.CO;2
Liang, J., Wu, L., Gu, G., and Liu, Q. (2016). Rapid Weakening of Typhoon Chan-Hom (2015) in a Monsoon Gyre. J. Geophys. Res. Atmos. 121, 9508–9520. doi:10.1002/2016JD025214
Liang, J., Wu, L., and Gu, G. (2018a). Rapid Weakening of Tropical Cyclones in Monsoon Gyres over the Tropical Western North Pacific. J. Clim. 31, 1015–1028. doi:10.1175/JCLI-D-16-0784.1
Liang, J., Wu, L., and Gu, G. (2018b). Numerical Study of the Influences of a Monsoon Gyre on Intensity Changes of Typhoon Chan-Hom (2015). Adv. Atmos. Sci. 35, 567–579. doi:10.1007/s00376-017-7155-6
Liang, J., and Wu, L. (2015). Sudden Track Changes of Tropical Cyclones in Monsoon Gyres: Full-Physics, Idealized Numerical Experiments*. J. Atmos. Sci. 72, 1307–1322. doi:10.1175/JAS-D-13-0393.1
Liang, J., Wu, L., and Zong, H. (2014). Idealized Numerical Simulations of Tropical Cyclone Formation Associated with Monsoon Gyres. Adv. Atmos. Sci. 31, 305–315. doi:10.1007/s00376-013-2282-1
Liebmann, B., and Smith, C. A. (1996). Description of a Complete (Interpolated) Outgoing Longwave Radiation Dataset. Bull. Am. Meteorol. Soc. 77, 1275–1277.
Ling, Z., Wang, Y., and Wang, G. (2016). Impact of Intraseasonal Oscillations on the Activity of Tropical Cyclones in Summer over the South China Sea. Part I: Local Tropical Cyclones. J. Clim. 29, 855–868. doi:10.1175/JCLI-D-15-0617.1
Ling, Z., Wang, Y., Wang, G., and He, H. (2020). Impact of Intraseasonal Oscillations on the Activity of Tropical Cyclones in Summer over the South China Sea: Nonlocal Tropical Cyclones. Front. Earth Sci. 8, 609776. doi:10.3389/feart.2020.609776
Liu, Q., Li, T., and Zhou, W. (2018). Impact of 10-60-Day Low-Frequency Steering Flows on Straight Northward-Moving Typhoon Tracks over the Western North Pacific. J. Meteorol. Res. 32, 394–409. doi:10.1007/s13351-018-7035-8
Ma, Z., Fei, J., and Huang, X. (2019). A Definition of Rapid Weakening for Tropical Cyclones over the Western North Pacific. Geophys. Res. Lett. 46, 11471–11478. doi:10.1029/2019GL085090
Maloney, E. D., and Hartmann, D. L. (2000). Modulation of Eastern North Pacific Hurricanes by the Madden–Julian Oscillation. J. Clim. 13, 1451–1460. doi:10.1175/1520-0442(2000)013<1451:MOENPH>2.0.CO;2
Maloney, E. D., and Hartmann, D. L. (2001). The Madden–Julian Oscillation, Barotropic Dynamics, and North Pacific Tropical Cyclone Formation. Part I: Observations. J. Atmos. Sci 58, 2545–2558. doi:10.1175/1520-0469(2001)058<2545:TMJOBD>2.0.CO;2
Qian, W., Shan, X., Liang, H., Huang, J., and Leung, C.-H. (2014). A Generalized Beta-Advection Model to Improve Unusual Typhoon Track Prediction by Decomposing Total Flow into Climatic and Anomalous Flows. J. Geophys. Res. Atmos. 119, 1097–1117. doi:10.1002/2013JD020902
Qian, Y., and Zhang, S. (2013). Cause of the Rapid Weakening of Typhoon Bebinca (0021) in the South China Sea. Trop. Cyclone Res. Rev. 2, 159–168. doi:10.6057/2013TCRR03.03
Reynolds, R. W., Smith, T. M., Liu, C., Chelton, D. B., Casey, K. S., and Schlax, M. G. (2007). Daily High-Resolution-Blended Analyses for Sea Surface Temperature. J. Clim. 20, 5473–5496. doi:10.1175/2007JCLI1824.1
Riemer, M., Montgomery, M. T., and Nicholls, M. E. (2010). A New Paradigm for Intensity Modification of Tropical Cyclones: Thermodynamic Impact of Vertical Wind Shear on the Inflow Layer. Atmos. Chem. Phys. 10, 3163–3188. doi:10.5194/acp-10-3163-2010
Ritchie, E. A., and Holland, G. J. (1999). Large-scale Patterns Associated with Tropical Cyclogenesis in the Western Pacific. Mon. Weather Rev. 127, 2027–2043. doi:10.1175/1520-0493(1999)127<2027:LSPAWT>2.0.CO;2
Shu, S., Ming, J., and Chi, P. (2012). Large-scale Characteristics and Probability of Rapidly Intensifying Tropical Cyclones in the Western North Pacific basin. Wea. Forecast. 27, 411–423. doi:10.1175/WAF-D-11-00042.1
Straub, K. H., and Kiladis, G. N. (2003). Interactions between the Boreal Summer Intraseasonal Oscillation and Higher-Frequency Tropical Wave Activity. Mon. Weather Rev. 131, 945–960. doi:10.1175/1520-0493(2003)131<0945:IBTBSI>2.0.CO;2
Tang, B., and Emanuel, K. (2010). Midlevel Ventilation's Constraint on Tropical Cyclone Intensity. J. Atmos. Sci. 67, 1817–1830. doi:10.1175/2010JAS3318.1
Wang, Y., Rao, Y., Tan, Z.-M., and Schönemann, D. (2015). A Statistical Analysis of the Effects of Vertical Wind Shear on Tropical Cyclone Intensity Change over the Western North Pacific. Mon. Weather Rev. 143, 3434–3453. doi:10.1175/MWR-D-15-0049.1
Wang, Y., and Wu, C.-C. (2004). Current Understanding of Tropical Cyclone Structure and Intensity Changes ? a Review. Meteorol. Atmos. Phys. 87, 257–278. doi:10.1007/s00703-003-0055-6
Wong, M. L. M., and Chan, J. C. L. (2004). Tropical Cyclone Intensity in Vertical Wind Shear. J. Atmos. Sci. 61, 1859–1876. doi:10.1175/1520-0469(2004)061<1859:TCIIVW>2.0.CO;2
Wood, K. M., and Ritchie, E. A. (2015). A Definition for Rapid Weakening of North Atlantic and Eastern North Pacific Tropical Cyclones. Geophys. Res. Lett. 42, 10091–10097. doi:10.1002/2015GL066697
Wu, L., and Braun, S. A. (2004). Effects of Environmentally Induced Asymmetries on hurricane Intensity: A Numerical Study. J. Atmos. Sci. 61, 3065–3081. doi:10.1175/JAS-3343.1
Wu, L., Liang, J., and Wu, C. C. (2011a). Monsoonal Influence on Typhoon Morakot (2009). Part I: Observational Analysis. J. Atmos. Sci. 68, 2208–2221. doi:10.1175/2011JAS3730.1
Wu, L., Ni, Z., Duan, J., and Zong, H. (2013a). Sudden Tropical Cyclone Track Changes over the Western North Pacific: A Composite Study. Mon. Weather Rev. 141, 2597–2610. doi:10.1175/MWR-D-12-00224.1
Wu, L., Tian, W., Liu, Q., Cao, J., and Knaff, J. A. (2015). Implications of the Observed Relationship between Tropical Cyclone Size and Intensity over the Western North Pacific. J. Clim. 28, 9501–9506. doi:10.1175/JCLI-D-15-0628.1
Wu, L., Zong, H., and Liang, J. (2011b). Observational Analysis of Sudden Tropical Cyclone Track Changes in the Vicinity of the East China Sea. J. Atmos. Sci. 68, 3012–3031. doi:10.1175/2010JAS3559.1
Wu, L., Zong, H., and Liang, J. (2013b). Observational Analysis of Tropical Cyclone Formation Associated with Monsoon Gyres. J. Atmos. Sci. 70, 1023–1034. doi:10.1175/JAS-D-12-0117.1
Yan, Z., Ge, X., Peng, M., and Li, T. (2019). Does Monsoon Gyre Always Favour Tropical Cyclone Rapid Intensification?. Q.J.R. Meteorol. Soc. 145, 2685–2697. doi:10.1002/qj.3586
Keywords: monsoon gyres, tropical cyclones, rapid weakening, sea surface temperature, vertical wind shear
Citation: Song K, Tao L and Gao J (2021) Rapid Weakening of Tropical Cyclones in Monsoon Gyres Over the Western North Pacific: A Revisit. Front. Earth Sci. 9:688613. doi: 10.3389/feart.2021.688613
Received: 31 March 2021; Accepted: 09 June 2021;
Published: 23 June 2021.
Edited by:
Guihua Wang, Fudan University, ChinaReviewed by:
Guanghua Chen, Institute of Atmospheric Physics (CAS), ChinaXiaomin Chen, Atlantic Oceanographic and Meteorological Laboratory (NOAA), United States
Copyright © 2021 Song, Tao and Gao. This is an open-access article distributed under the terms of the Creative Commons Attribution License (CC BY). The use, distribution or reproduction in other forums is permitted, provided the original author(s) and the copyright owner(s) are credited and that the original publication in this journal is cited, in accordance with accepted academic practice. No use, distribution or reproduction is permitted which does not comply with these terms.
*Correspondence: Li Tao, dGFvbGlAbnVpc3QuZWR1LmNu