 Yuqiu Zhao1
 Djordje Grujic1*
 Santanu Baruah2
 Dawchu Drukpa3
 Joanne Elkadi4
 György Hetényi5
 Georgina E. King4
 Zoë K. Mildon6
 Nityam Nepal3Caroline Welte7
- 1Department of Earth and Environmental Sciences, Dalhousie University, Halifax, NS, Canada
- 2Geoscience and Technology Division, CSIR-North East Institute of Science and Technology, Jorhat, India
- 3Earthquake and Geophysics Division, Department of Geology and Mines, Thimphu, Bhutan
- 4Institute of Earth Surface Dynamics, University of Lausanne, Lausanne, Switzerland
- 5Institute of Earth Sciences, University of Lausanne, Lausanne, Switzerland
- 6School of Geography, Earth and Environmental Sciences, University of Plymouth, Plymouth, United Kingdom
- 7Department of Earth Sciences, ETH Zurich, Zurich, Switzerland
The 1714 Bhutan earthquake was one of the largest in the Himalaya in the last millennium. We show that the surface rupture caused by this earthquake extended further to the east than previously known, it was at least 175 km long, with slip exceeding 11 m at our study site. The age of the surface rupture was constrained by a combination of radiocarbon and traditional optically stimulated luminescence dating of affected river sediments. Computations using empirical scaling relationships, fitting historical observations and paleoseismic data, yielded a plausible magnitude of Mw 8.1 ± 0.4 and placed the hypocentre of the 1714 Bhutan earthquake on the flat segment of the Main Himalayan Thrust (MHT), the basal décollement of the Himalayan orogen. Calculations of Coulomb stress transfer indicate that great earthquakes along the leading part of the MHT would cause surface rupture. In contrast, distal earthquakes may not immediately trigger surface rupture, although they would increase the stresses in the leading part of the MHT, facilitating future surface-rupturing earthquakes. Frontal earthquakes would also transfer stress into the modern foreland basin facilitating southward propagation of the MHT as a blind basal décollement. In conclusion, studies of surface-rupturing events alone likely underestimate the seismic slip along the Himalayan megathrust.
Introduction
Understanding the evolution of convergent tectonic plate systems and determining their role in generating great earthquakes (>magnitude 8; USGS earthquake magnitude classes) requires integrating the record of fault behaviors preserved in fault rocks from all crustal depths with geophysical observations. Mapping and dating surface ruptures allow building earthquake catalog to calculate the slip rates, accumulated slip, and missing slip and thus calculate the seismic hazard and identify modes of propagation of an orogenic wedge into its foreland. Paleoseismic studies in the Himalaya have likely identified most of the great surface-rupturing events during the last 1,000 years. However, their low dating resolution may limit the ability to distinguish a series of events from distinct, much larger events, i.e., great earthquakes spread over decades may appear as a single great earthquake, or even an M 9 earthquake (e.g., Le Roux-Mallouf et al., 2016). In addition, the low precision of surface rupture length determination causes large errors in the inferred magnitudes.
The segment of the in eastern Bhutan is thought to host a potential slip of more than 10–12 m (Bilham, 2019; Robinson, 2020), the greatest in the Himalayas, implying high seismic hazard (Stevens et al., 2020). Conversely, the Bhutanese Himalaya experience fewer instrumental earthquakes than the central and western Himalayas (Gahalaut et al., 2011; Stevens and Avouac, 2015; Jayangondaperumal et al., 2018). However, this apparent gap in the Himalayan seismic belt may be only an observational gap caused by a lack of permanent seismometers in Bhutan until recent years. The apparent gap on the scale of the seismic cycle also roots in the fact that this region is a relatively less explored part of the Himalayas.
Here we present new information based on new paleoseismological findings in eastern Bhutan, interpreted in terms of possible earthquake location and magnitude that further close the seismic gap. Our results agree with the recent hypothesis of bimodal seismicity along the Main Himalayan Thrust (MHT) (Dal Zilio et al., 2019), which purports that a sequence of blind earthquakes is required to cause a great surface-rupturing event.
Morphotectonic Setting
Main Himalayan Thrust and Main Frontal Thrust
The basal décollement of the Himalayan orogen is the MHT, equivalent to a subduction zone megathrust, along which the Indian plate has been underthrusting beneath the Himalayan belt. The Main Frontal Thrust (MFT) is the surface expression of the MHT frontal ramp along the Himalayan orogenic front. The MFT places the Siwalik Group (locally the Lesser Himalayan Sequence) against Quaternary foreland sediments (Figure 1A). The trace of the MHT composite is discontinuous and in West Bengal and Central Bhutan–within large re-entrants–involves at least three traces: one at the topographic break, the Topographic Frontal thrust (TFT), and two outboards of the orogen (Nakata, 1972), seemingly affecting only the sediments of the foreland basin. The intermediate trace is a north-directed back thrust, interpreted as an element of a juvenile triangle zone (Stockmal et al., 2001) at the Himalayan orogenic front (Dasgupta et al., 2013; Chakrabarti Goswami et al., 2019). The southern tip of the MFT in the foreland basin may also be a blind basal décollement with an incipient back thrust (Duvall et al., 2020). Although the first-order trace of the MFT (at the topographic break) appears curved but continuous, detailed maps indicate that the trace consists of segments arranged in a left-stepping en échelon geometry (Figure 1B). These segments are separated by strike-slip faults, pressure ridges or relay ramps, characteristic of fault growth by linkage extensively investigated in extensional tectonic settings (e.g., Mansfield and Cartwright, 2001).
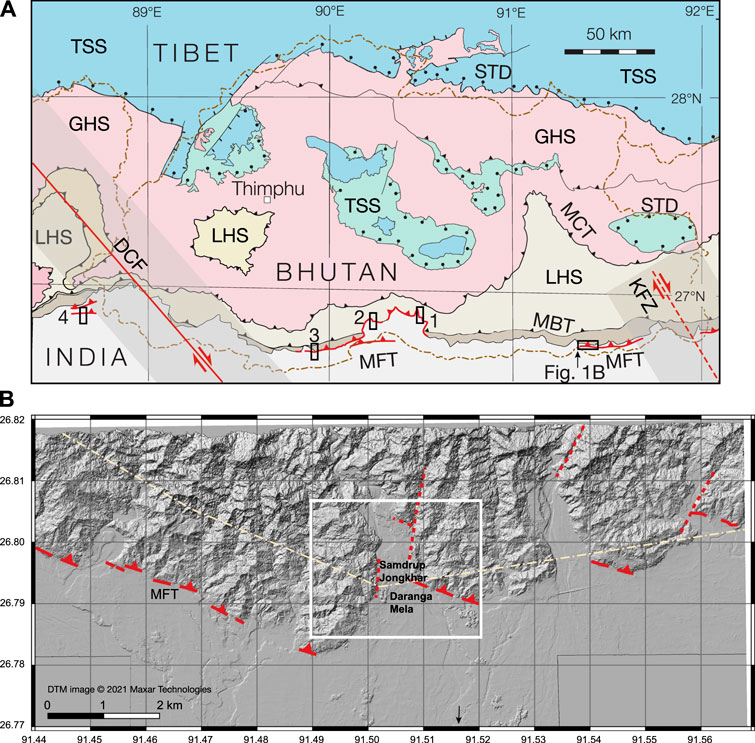
FIGURE 1. (A) Simplified geology of the Bhutan Himalaya, with the area of Panel (B) shown with the black square in the SE corner. Previous paleoseismological studies in the area are indicated with vertical rectangles: 1: Gelephu (Berthet et al., 2014); 2: Sarpang (Le Roux-Mallouf et al., 2016); 3: Piping (Le Roux-Mallouf et al., 2020); 4: Chalsa (Kumar et al., 2010). STD: South Tibetan Detachment; MCT: Main Central thrust; MBT: Main Boundary Thrust; MFT: Main Frontal Thrust; TSS: Tethyan Sedimentary Sequence; GHS: Greater Himalayan Sequence; LHS: Lesser Himalayan Sequence. DCF: Dhubri–Chungthang fault zone (Diehl et al., 2017); KFZ: Kopili Fault zone (Sutar et al., 2017). (B) Topography of the Himalayan foothills and foreland basin in eastern Bhutan. The Himalayan Frontal Thrust consists of an en échelon arrangement of short segments. White square indicates the area of Figure 2. The digital terrain model (DTM) with a horizontal resolution of 0.5 m and vertical resolution of 8 m was derived from Maxar stereo pair imagery by Maxar Technologies and further processed using QGIS (v. 3.16.3).
Thrusting on the MFT began at ∼2 Ma in central Nepal (Mugnier et al., 2004; van der Beek et al., 2006) and ∼1 Ma in Arunachal Pradesh in NE India (Chirouze et al., 2013); however, the onset of the MFT in Bhutan is still unconstrained (Coutand et al., 2016). The MHT was first imaged in Southern Tibet along the western border of Bhutan (Hauck et al., 1998). The MHT has a ramp-flat-ramp geometry that varies along strike between western and eastern Bhutan (Coutand et al., 2014) but consists of three main segments. The southernmost frontal ramp in eastern Bhutan is north-dipping at 65–70° (Hirschmiller et al., 2014) but flattens toward the surface, which is typical of ruptures along thrust faults because of decreasing lithostatic pressure (e.g., Philip and Meghraoui, 1983; Lee et al., 2001). However, the detailed geometry, which is essential for estimating slip and slip rates, is more complex (Drukpa et al., 2018). The frontal ramp is rooted at ∼12 km in the west and ∼10 km in the east. The flat middle section dips sub-horizontally by 3–5° to the north. In western Bhutan, this section is 100–110 km wide (Coutand et al., 2014; Diehl et al., 2017). Although the cosmogenic nuclide denudation analyses suggest a wider flat portion (Le Roux-Mallouf et al., 2015), we adopt the former geometry because the data are more mutually consistent. In eastern Bhutan, the flat portion is somewhat narrower at ∼95 km (Coutand et al., 2014; Diehl et al., 2017) but is more difficult to constrain (Singer et al., 2017). The northernmost segment of the MHT is a mid-crustal ramp dipping northward at ∼30° (Hauck et al., 1998). Smaller ramps have been inferred by cross-section balancing (Long et al., 2012).
The difference in MHT geometry between western and eastern Bhutan is reflected in the variations in coupling along with the detachment. In western and central Bhutan, the width of the fully locked zone on the MHT is reported as ∼100 km (Li et al., 2020) to 135–155 km (Marechal et al., 2016). At its northernmost boundary, it is limited by an abrupt down-dip transition, representing an area of interseismic stress build-up according to the seismicity (Diehl et al., 2017). Le Roux-Mallouf et al. (2015) suggested that the wider and gentle coupling zone on the MHT could have greater seismogenic potential in western Bhutan. In eastern Bhutan, the fully coupled zone is narrower (100–120 km) and confined up-dip and down-dip by partial coupling zones (Marechal et al., 2016; Li et al., 2020). GPS data indicate that the up-dip frontal ramp exhibits an aseismic slip rate of 5.5–14.5 mm/a within 50 km north of the MFT (Marechal et al., 2016).
The convergence rates based on GPS measurements in the Sikkim Himalaya are 17.2 ± 1.9 mm/a (Li et al., 2020), which agree with the slip rate of ∼18 mm/a measured by Mukul et al. (2018). The estimated convergence rates in western Bhutan and eastern Bhutan are 18.5 ± 1.0 and 16.2 ± 1.5 mm/a, respectively (Li et al., 2020), both of which are similar to the 17 ± 2 mm/a estimated by Marechal et al. (2016). The cumulative deformation values derived from paleoseismic data yield an average slip rate of 24.9 ± 10.4 mm/a along the MFT over the last 2,600 years (Le Roux-Mallouf et al., 2020). Across western Arunachal Pradesh (to the east of Bhutan), the age and geometry of uplifted river terraces indicate a convergence rate of 23 ± 6.2 mm/a (Burgess et al., 2012). The potential discrepancy between the millennial-scale slip rate from geological studies and geodetic estimates suggests that some of the interseismic deformations in Bhutan could be anelastic.
Active Tectonics of Bhutan
The seismotectonic of the Bhutanese Himalaya differ from those in the central Himalaya in the following two aspects:
1) The Bhutanese Himalaya and especially its foreland are bound by two oblique strike-slip zones (the Dhubri–Chungthang fault zone (DCF) in the west, evidently extending beneath the orogen (Diehl et al., 2017) and the Kopili fault zone in the east with a more diffuse and less clear continuation N of the Himalayan front (Sutar et al., 2017). Both fault zones are capable of generating earthquakes with Mw > 7 (ibid.). Both fault zones appear to affect only the Indian basement, that is, the Himalayan crust beneath the MHT (Diehl et al., 2017; Grujic et al., 2018), and define a distinct segment of the orogen in terms of flexure (Hammer et al., 2013; Hetényi et al., 2016).
2) Active deformation of the Indian basement in the Himalayan foreland. The two strike-slip fault zones extend south of the Himalaya and border the Shillong Plateau to the west and east, respectively. The Shillong Plateau is bound to the south by the Dauki fault (Biswas et al., 2007; Clark and Bilham, 2008), which exhibits cumulative displacement of >10 km (Biswas et al., 2007), but no related major earthquakes have been observed or recorded. To the north, the Shillong Plateau is affected by the Oldham fault, which produced an earthquake of 8.15 < Mw < 8.35 in 1897 (England and Bilham, 2015). In contrast to the Dauki fault, the Oldham fault has no mappable displacement, and its surface trace remains elusive (Rajendran et al., 2004).
The 2009 Mw 6.1 earthquake (USGS, 2020) is the only earthquake instrumentally observed in Bhutan with a focal solution compatible with slip along the MHT. All other earthquakes with a reported focal mechanism have been strike-slip or oblique-slip (Drukpa et al., 2006; Diehl et al., 2018). According to paleoseismic investigations, south-central Bhutan has been struck by at least five large earthquakes (E1–E5) between 485 ± 125 BCE and 1714 CE (Le Roux-Mallouf et al., 2020).
E1: Historically, the most recent earthquake that provoked massive destruction in the region was the 1714 CE earthquake, previously described by Ambraseys and Jackson (2003) as the 1713 CE earthquake with an epicentre in Arunachal Pradesh. By combining more recently identified historical and palaeoseismic constraints (Hetényi et al., 2016), determined that this earthquake occurred on May 4, 1714 and reached Mw 7.5–8.5 with a modeled hypocentre located in central or western Bhutan. E1 was possibly observed by palaeoseismic studies (Figure 1A) at the Piping site (Le Roux-Mallouf et al., 2020), Sarpang, and Gelephu (Berthet et al., 2014; Le Roux-Mallouf et al., 2016). This faulting event caused 1.5 ± 0.5 m of coseismic dip-slip at the Piping site and up to 0.5 m of vertical offset in Sarpang.
E2: This is the largest known seismic event observed in Bhutan. At the Piping site, it was dated to between 1204 CE and 1464 CE, 1344 ± 130 CE (Le Roux-Mallouf et al., 2020), and between 1140 CE and 1520 CE (Le Roux-Mallouf et al., 2016). This event was associated with 12.2 ± 2.8 m of coseismic dip-slip, an Mw > 8.5 earthquake at the Piping site (Le Roux-Mallouf et al., 2020), and 16–23 m of coseismic surface slip with an inferred Mw of ∼8.7 (Le Roux-Mallouf et al., 2016).
Events E3, E4, and E5, observed at the Piping site, occurred at 300 ± 70 CE, 100 ± 160 CE, and 485 ± 125 BCE, respectively (Le Roux-Mallouf et al., 2020). All five events provide an average recurrence interval of 550 ± 211 years and a cumulative slip of 40.4 ± 10.8 m of slip (E2+E3+E4) (Le Roux-Mallouf et al., 2020).
Materials and Methods
Field Investigation
The new study site is located between Samdrup Jongkhar (SE Bhutan) and Daranga Mela (N Assam, India) along the left bank of Dungsam Chu (Figure 2), which is a tributary of the Pagaldiya River that flows southwards to the Brahmaputra (Figure 1B). Geomorphic analyses were performed using transects acquired by differential GPS and landscape analysis of a digital terrain model (DTM) with a horizontal resolution of 0.5 m.
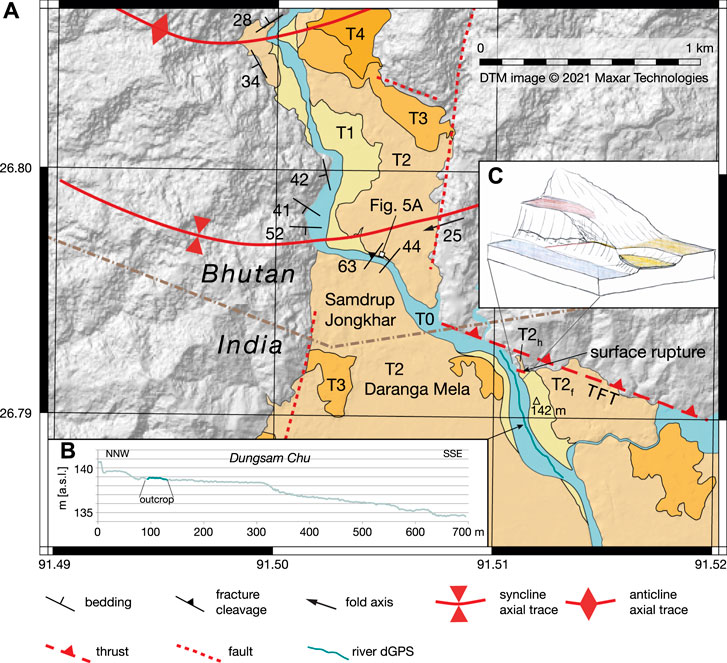
FIGURE 2. Geomorphic and structural map of the study area. (A) The digital terrain model (DTM) with a horizontal resolution of 0.5 m was derived from Maxar stereo pair imagery by Maxar Technologies and further processed using QGIS (v. 3.16.3). The geological observations are from Grujic et al. (2018) and our observations. The river terraces were mapped on the original DTM. (B) River profile acquired by the differential GPS. The mapped segment of the river is indicated on the map. (C) Draft of the paleoseismic exposure by Luca Malatesta, LM (U of Lausanne, 2019). River terraces T1 and T2 were observed and measured in the field; terrace T2h (hanging wall) in red is inferred to be the same as terrace T2f (footwall) in orange but uplifted by the surface-rupturing earthquake. Point marked 142 is the elevation above sea level in meters and location of the base station for differential GPS survey.
Sample Collection
To constrain the burial ages of the faulted units, we collected pairs of radiocarbon and optically stimulated luminescence (OSL) samples from seven locations (Tables 1, 2).
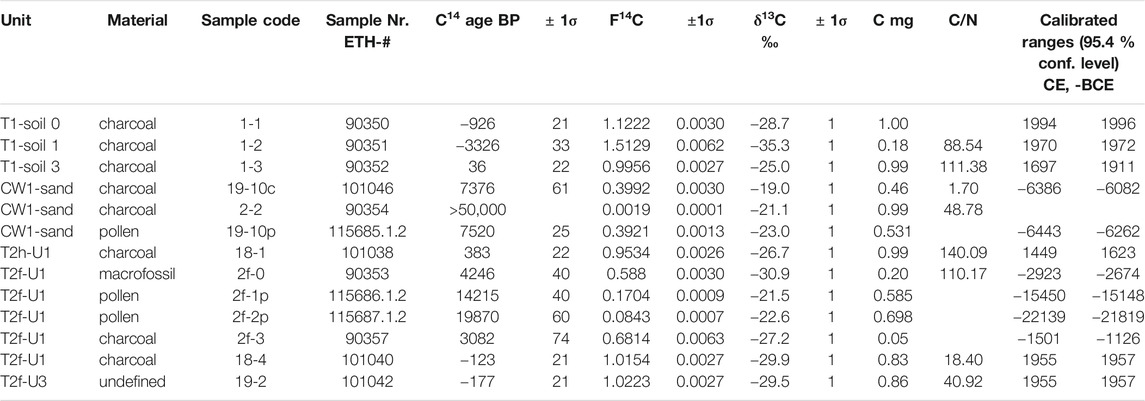
TABLE 1. Results of AMS analysis on samples selected from organic-rich layers and the total organic carbon (TOC) content of various fractions of sediments. BP = before present (before 1950 AD). F14C is the concentration measured in the sample, corrected for fractionation, and normalized to the 1950 value and the corresponding 14C age. δC13 is a value measured on graphite and can include additional fractionation. C/N ratio is an atomic ratio (C/N) × (14/12). The mass C is the final carbon content of the sample. Calibration was performed using the OxCal calibration with the INTCAL20 calibration curve (Reimer et al., 2020). The samples with F14C > 1 indicate the post-1950 source of carbon (modern). The corresponding calendar ages were obtained using Bomb Peak 14C data (Hua et al., 2013; Levin et al., 2013) and the online calibration software http://calib.org/CALIBomb/.
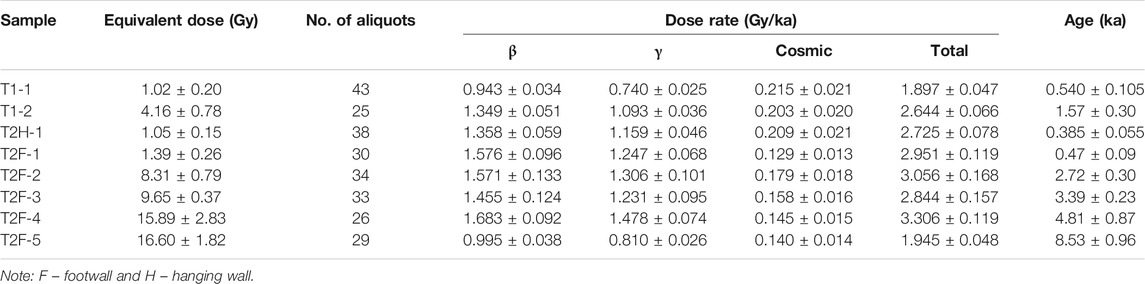
TABLE 2. Conventional OSL dating from the Dungsam Chu site. Results of OSL analysis on samples. The input variables for individual samples used for dose rate and age calculations are listed in Supplementary Table S1.
Radiocarbon Dating
Twenty-one samples were selected for radiocarbon analysis of the MFT exposure, including six fluvial deposits and two colluvial wedge samples. Three of the six fluvial deposit samples originated from terrace T1, with all others taken from terrace T2. Datable materials discovered in the samples included charcoal, bulk sediments (grain-size < 125 μm), and isolated plant and animal microfossils such as pollen, seeds, and insect shells. Physical and chemical pre-treatments were performed to isolate the samples from the surrounding matrix and remove post-depositional contaminants (Bronk Ramsey, 2008; Hajdas, 2008). Physical pre-treatments were performed at Dalhousie University (Canada), whereas chemical treatments were performed at the ETH accelerator facility in Zurich (Switzerland). The procedure for physical cleaning and inspection involved 1) manual picking with tweezers after visual examination of large pieces of organic matter; 2) flotation using deionized water accompanied by an ultrasonic bath to separate large pieces from the surrounding matrix; 3) drying below 60°C in an oven for 12–24 h after flotation; and 4) sieving for bulk sediments < 125 μm, following microscopic observations of the carbon content. To avoid contamination, acid-base-acid (ABA) treatment was applied at 60°C to remove the contamination caused by carbonates and humic acids, as follows: 1) initial acid treatment washed carbonates away from the sample surfaces using 0.5 M HCl solution, followed by sample rinsing with deionized water; 2) a base wash using 0.1 M NaOH solution removed humic acids, which was also followed by sample rinsing with deionized water; 3) a weak acid solution (0.1 M HCl) removed carbonates dissolved during previous pre-treatments. The ABA treatment ended with a final rinsing with deionized water. For pollen dating 400 µL aliquots of the samples and of three processing blanks were transferred to glass vials and freeze-dried. About 1.5 mg dried material was wrapped in cleaned Al capsules (Welte et al., 2018) and converted to graphite (Wacker et al., 2010b). Accelerator mass spectrometry (AMS) was performed at the Laboratory of Ion Beam Physics, ETH Zurich, Switzerland (Wacker et al., 2010a).
F14C represents the concentration of 14C measured in the samples normalized and corrected for fractionation (δ13C). Conventional radiocarbon ages were calculated using Libby’s half-life for 14C (Stuiver and Polach, 1977; Reimer et al., 2004). The δ13C values used for the correction of F14C (Reimer et al., 2004) were measured on graphite samples. Radiocarbon dates were calibrated using OxCal V4.4 (Bronk Ramsey, 2017) and the atmospheric calibration curve IntCal20 (Reimer et al., 2020), with a 95.4% confidence interval for 2σ error.
Optically Stimulated Luminescence Dating
Nine samples were dated by OSL, including eight overbank fluvial deposits and one colluvial wedge sample. Samples were prepared under subdued red-light conditions at Dalhousie University and the University of Lausanne using the following standard methods: sieving to isolate the 150–250 μm grain-size, removal of magnetic minerals using a hand-magnet, chemical treatment to remove carbonates and organic material, and density separation to isolate the quartz-rich mineral fractions. The quartz-rich fraction was purified by HF etching for 60 min using 40% HF.
Quartz OSL measurements were performed using a single aliquot regenerative dose protocol (Murray and Wintle, 2000) with three Risø TL-DA-20 readers and dose rates ranging from 0.089 to 0.24 s−1. Small aliquots of 2 mm diameter were measured. A preheat (and cut heat) temperature of 270°C was used, as well as a high-temperature optical wash at the end of each measurement cycle. The selected measurement conditions were validated using preheat plateau tests and successful dose recovery. An IR-depletion test was used to screen all aliquots for feldspar contamination (Duller, 2008).
Data were accepted using the following criteria: a recycling ratio within 10% of unity, an IR-depletion test within 10% of unity, a maximum test dose error of <10%, and recuperation of <10% of the natural signal. At least 25 De values were accepted for each of the measured samples. Overdispersion values (Galbraith et al., 1999) were calculated using the Luminescence package in RStudio (Kreutzer et al., 2016), which yielded values in excess of 20% for almost all samples (Supplementary Figure S2). For this reason, the three-component minimum age model was applied with an assumed overdispersion σb = 0.2 (see Supplementary material for details).
Sample radionuclide concentrations were determined using inductively coupled plasma mass spectrometry (ICP-MS). Environmental dose rates were calculated using DRAC v.1.2 (Durcan et al., 2015) and the conversion factors of (Guérin et al., 2011), the alpha grain-size attenuation factors of (Brennan et al., 1991), the beta grain-size attenuation factors of (Guérin et al., 2012) and the etch depth attenuation factors of Bell (1979) assuming an etch depth of 8 μm.
Results
Geomorphology of the Study Area
The MFT, i.e., the TFT, crosses the Dungsam Chu at 26.79194°N, 91.51085°E. Despite large vertical displacement along the MFT, the talweg is flat along a stretch of ∼240 m. Fifty meters upstream of the MFT trace is a 1-m-high knickpoint. A 1.5-m-high knickpoint is located ∼180 m downstream, from which the river flows south at ∼0.5° (Figure 2B), indicating that the coseismic knickpoint migrated upstream and was rapidly eroded, as observed in recent earthquakes (Liu and Yang, 2015). Such a rapid channel response is compatible with a high sediment supply and discharge. The rate of channel adjustment depends on the erodibility of the boundary, river discharge, slope, and sediment supply rate (e.g., Whipple and Tucker, 1999; Lague, 2014).
The MFT separates the flat, mostly undeformed, recent to active deposits of the alluvial plain to the south from alluvial terraces deposited by the Dungsam Chu over the Siwalik Group. These terraces are composed of well-stratified cobbles to boulders (the dominant lithologies are quartzite and slate from the Lesser Himalayan Sequence) within a sandy matrix. The lower (younger) terraces (T1, T2) are located along the present stream at low elevations, ∼3.5 and ∼9 m above the present stream, respectively. T2 is a fill terrace on which T1 formed as a cut-in-fill terrace. The intermediate terrace (T3) is strongly dissected by natural and anthropogenic processes. Alternatively, it could be interpreted as remnants of an alluvial fan. T4 was mapped only locally upstream of Dungsam Chu. T3 and T4 were identified from the DTM and were not observed in the field.
MFT Exposure
The natural river-cut exposure of the MFT was straightened and refreshed with a backhoe (Supplementary Figure S1). The orthorectified photomosaic of the outcrop (Figure 3) was constructed using Agisoft Metashape software. Because the MFT has a strike of 110° and the outcrop strikes 150°, the outcrop log (Figure 4) is a projection of the photomosaic perpendicular to the fault strike and parallel to the slickenlines observed in the fault gouge.
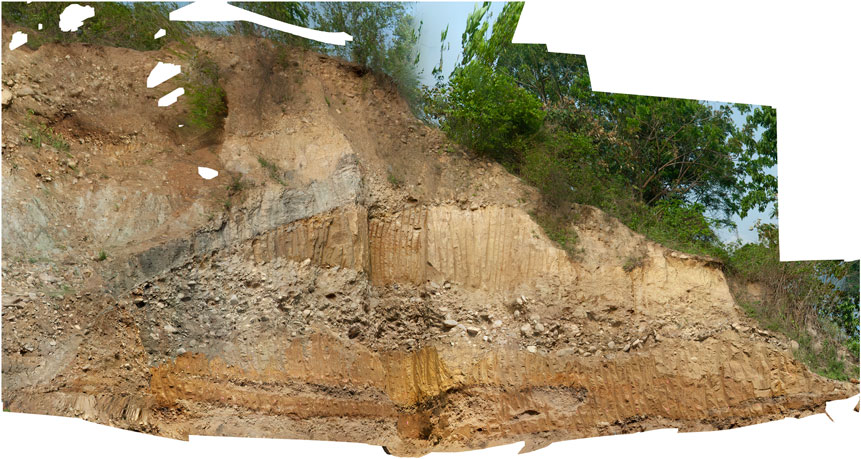
FIGURE 3. The orthorectified photomosaic of the outcrop (see also the associated Supplementary Video S1) was constructed with Agisoft Metashape software using 136 field photographs. The MFT, i.e., the TFT, crosses the Dungsam Chu at 26.79194°N, 91.51085°E.
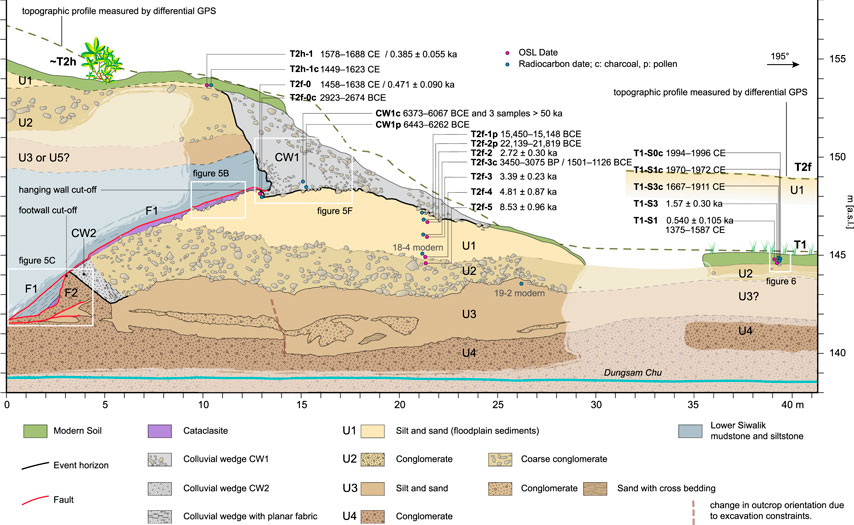
FIGURE 4. Detailed map of the Dungsam Chu palaeoseismic exposure. This map is a projection of the photomosaic (Figure 3) into the kinematic plane, perpendicular to the trace of the fault and parallel to the slickenlines observed along the clay smears within the F1 surface. The map was constructed by observations on the photomosaic, individual photographs, and by field observations. The topographic profile, including the surface of T1 and T2f to the south of the MFT trace, were measured by a dGPS. The dGPS measurements were made along the slope, away from the cliff edge, and are slightly higher. The topographic profile and T2f were projected onto the map of the exposure. The Dungsam Chu bed is also measured by the dGPS (darker blue segment on Figure 2B). Faded colors indicate a lack of exposure.
The MFT trace is discontinuous and consists of segments arranged en échelon and offset by N-S striking to NNE-SSW striking faults observed in the field and mapped on the DTM. For comparison, in central Bhutan, the TFT strikes 102–104° (Le Roux-Mallouf et al., 2016; Le Roux-Mallouf et al., 2020). In the center of Samdrup Jongkhar, in a small river-cut since walled over, the Siwalik bedding is strongly overprinted by pervasive fracture cleavage, suggesting top down to the west movement (Figure 5A). The fracture cleavage has the same orientation as the N-S striking faults between the MFT segments (Figure 2).
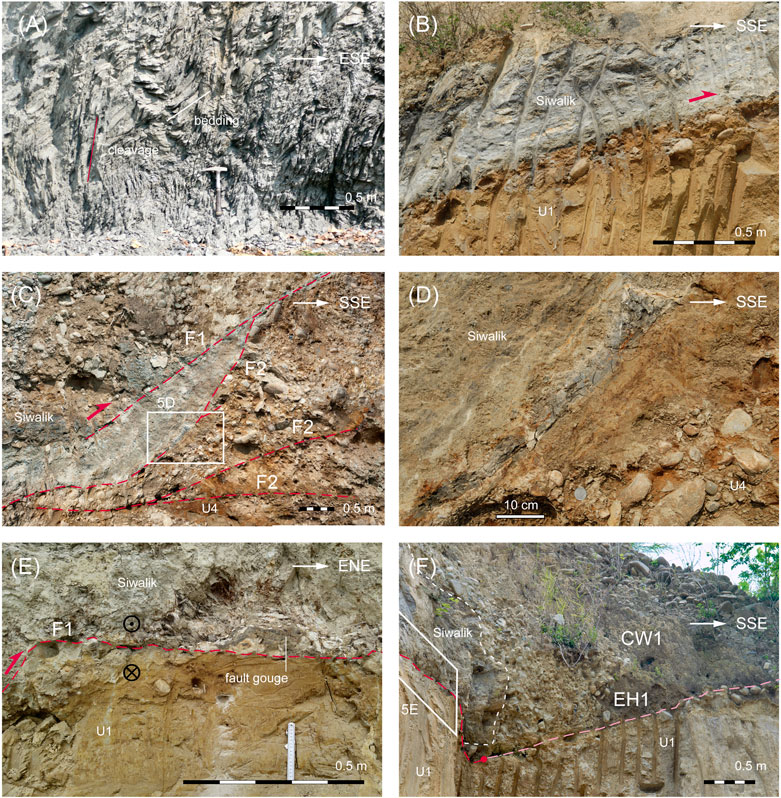
FIGURE 5. Field photographs of characteristic structures at the Dungsam Chu MFT exposure. (A) Moderately west-dipping Siwaliks siltstone layering strongly overprinted by steeper fracture cleavage indicating top down to the west faulting. Location in the center of Samdrup Jongkhar indicated in Figure 2. (B) F1 separating Siwaliks in the hanging wall and the U1 of terrace 2. Notice the layer of pebbles dragged up from lower stratigraphic levels. (C) Bottom of the north end of the paleoseismic exposure indicating branching of older faults F2 cut-off by the most recent fault F1. Between F1 and upper F2 is a lens of cataclasite. (D) Close up of Panel 5(C) showing the cataclasite, which is derived both from Siwalik and T2 lithologies. Coin for the scale is in the middle bottom of the photograph. (E) Tip of the F1 fault, looking NNW. In the hanging wall, there is a lens of cataclasite, probably derived from Siwalik sediments, it the footwall, there are few pebbles as in Panel 5(B). (F) Colluvial wedge 1. Showing the tip of the F1 fault (circle), the leading edge of the Siwalik in the hanging wall (white dashed line), and the Event Horizon 1 (pale pink line). Location of the photograph in Panel 5(D) is on the left side.
In the cross-section, the MFT is straight and simple, dipping approximately 24° to the north. The footwall block consists of the ∼8-m-thick T2, containing four irregular interbedded sandstone and conglomerate units with sharp boundaries, labeled U4, U3, U2, and U1 from oldest to youngest (Figure 4). Unit U4 is a clast-supported fluvial conglomerate composed of poorly sorted and poorly rounded granules, pebbles, and cobbles in a sandy matrix (Supplementary Figure S3A). The sandy matrix is overprinted by oxidation and local concentrations of manganese oxide. The base of U4 is currently below the water table, so it could not be logged. Unit U3 overlying Unit U4 is a silt to medium sand-sized fluvial deposit ∼1.5–3.0 m thick, which includes ∼20–80-cm-thick lenses of granular or pebble conglomerates and lenses of coarse sand with cross bedding (Supplementary Figures S3A–D). Unit U2 is an ∼1.8–3.0-m-thick, poorly sorted, and well-rounded pebble-cobble-boulder conglomerate with a sandy matrix. Unit U2 is distinguished from unit U4 by a generally larger clast size and a lesser degree of orange coloration due to oxidation. The topmost unit U1 is the youngest in the footwall, measuring up to 2.2 m thick, consisting of sandy to silty fluvial deposits. U4 is finer in grain-size and lighter in color than unit U2.
The cut-in-fill terrace T1 exposed to the south of the palaeoseismic exposure is ∼65 cm thick, comprising organic material-rich soil that caps the pebble-to-boulder gravel layer U2 (Figure 6). The T1 shows likely four soil profiles, mainly consisting of soil horizons A and B. The uppermost and lowermost soil profiles exhibit a clear sequence of local soil with horizons A, Bt (showing clay accumulation in the form of coatings on ped surfaces or in pores), and B. The middle soil profiles display white leached clay or clayey silt clasts identified as Ae1 in the top section, overlying a weakly developed Bw1 horizon and a possible fluvial sand deposit C1 horizon that buried a soil simply including horizons A2 and Bt2. The presence of Ae1, Bw1, and C1 indicates no erosion but still lots of water to leach the sediments in the middle layer. Considering all the age constraints in T1, the middle soil profile with horizons Ae1, Bw1, and C1 might be influenced seismically, and the lowermost soil may be formed pre-seismically. Based on the overlying C1 having an older burial age than the underlying buried soil, an alternative interpretation would be a possible earthquake-induced injected sand in the middle section instead of C1, even though the OSL burial ages calculated using the minimum age model (MAM) might be still overestimated due to incompletely bleached grains in the samples. However, no other injection features were exposed to confirm this alternative.
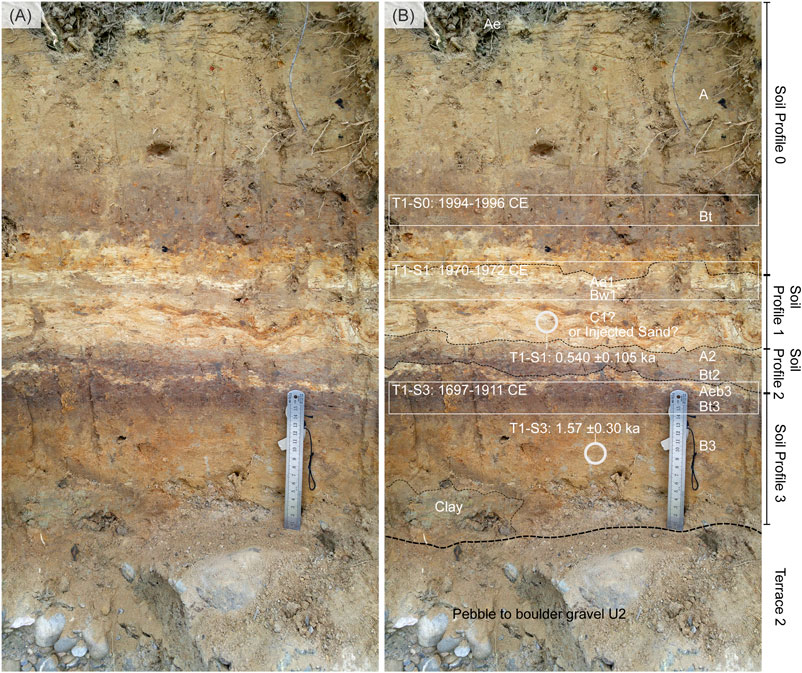
FIGURE 6. Terrace 1 at the southern end of the palaeoseismic exposure (Figure 4). (A) original photograph, (B) interpreted photograph. Terrace 1 is interpreted as a cut-in-fill terrace on top of layer U2 of Terrace 2. Material for radiocarbon dating was collected along horizons indicated with white rectangles. The deposits of T1 are interpreted as overbank deposits being converted to modern soil. The injected sand layer was interpreted based on the age distribution and photograph analysis (see main text for alternative interpretations).
The hanging wall block of the MFT consists of dark gray mudstone and siltstone layers of Unit 1 of the Siwalik Group (Coutand et al., 2016). These deposits represent different parts of a river-dominated deltaic system, developed in either a lacustrine or marine environment (Coutand et al., 2016). This outcrop is separated by faults and gaps in exposure from the continuous, 2,200-m-thick sedimentary section of the Siwalik Group that was deposited between ∼7 and 1 Ma (Coutand et al., 2016); therefore, we could not determine the depositional age at this outcrop. Late Miocene Siwalik sediments are discordantly overlain by the ∼2.5-m-thick T2, which includes three layers of interbedded sandstone and conglomerate (Figure 4). Sandstone lies over an evident erosion and weathering surface, pelma (Schirmer, 2020) that cuts through the Siwalik north-dipping stratigraphy. Soil horizon A was observed at the top of the hanging wall block. Except for modern soil, there were no continuous deposits over the fault trace.
We interpret CW1 and CW2 as two scarp-derived colluvial wedge units deposited during or shortly after coseismic displacement along with F1 and F2, respectively (Figure 4). The tip of F2 was sealed by CW2 during the earlier coseismic event, E2. Unit CW2 comprises pebbles in a dark sandy matrix with rare cobbles and caps the tops of the uppermost and middle F2 splays (Figure 5C), which is presumably derived from units U1 and U2 and contemporary soil. Unit CW1 originates from T2 and soil in the hanging wall and consists of cobble layers on the south side of the triangular unit, coarse sand in the middle, pebble layers on the north side, and a sandy matrix (Figure 5E).
Two events were identified: the most recent event, E1, and the penultimate event, E2. Pebbles dragged by E1 adorn the top of the footwall block (Figure 5B). Cataclasite is present between the two F2 splays and at the tip of F1 Figures 4C,D. The two tips of the surface ruptures (Figure 4) formed during the respective seismic events indicate that the throw of the last event was approximately 4.5 m, i.e., 10.5 ± 0.5 m of coseismic slip was produced during E1. Retrodeforming the E1 slip along the MFT places the terrace on the hanging wall of the MFT at the same level as the event horizon 1 and the top of the terrace T2 (Figure 7). Because only one cut-off line is visible for E2, we propose a minimum vertical displacement of 3 m for E2.
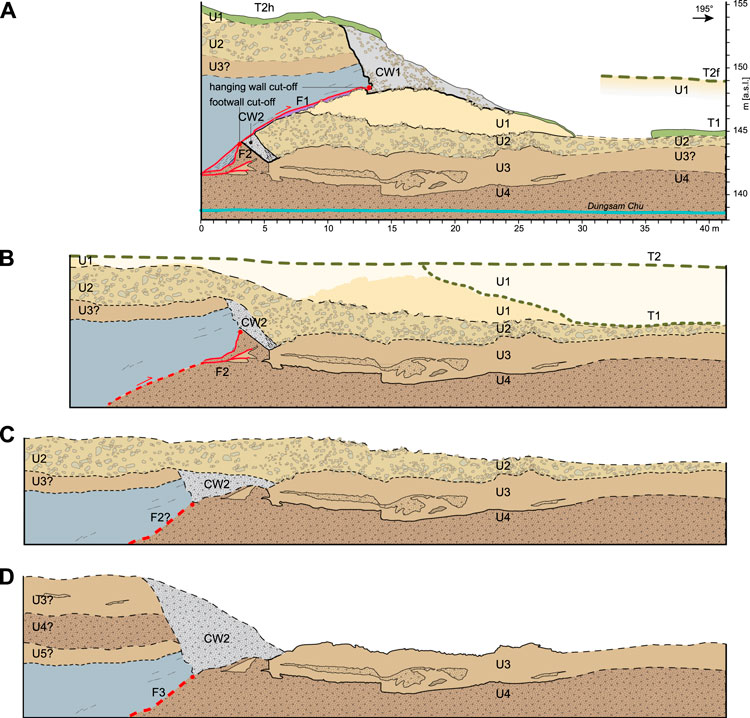
FIGURE 7. Retrodeformed section. (A) Current situation. (B) Pre 1714, this is a conservative restoration in which the inferred cut-off lines (Figure 4) were placed together. No other adjustments were made. Notice that the top of the hanging wall is restored to the same level as the current top of the terrace 2. Lateral variations of layer thicknesses are interpreted as a common feature of alluvial deposits and the result of the incision of terrace 1 into terrace 2. Notice the steepening of the F2, similar to the phenomenon observed by Le Roux-Mallouf et al. (2020). Indicated is the maximum northward extent of the cut in terrace T1. Tapering of U1 deposits is due either to their overlapping an older fill-cut terrace or more likely a minor displacement of U2 by F2 (C) Retroderformed section at the end of the deposition of U2, before the minor event F2. (D) Section after the event along the F3 and after the formation of the related colluvial wedge.
AMS 14C and OSL Dating Results
Table 1 summarizes the results of the AMS 14C analysis. Only ten samples yielded radiocarbon ages that were dendrochronologically corrected (Reimer et al., 2013); three samples yielded ages >50 ka, whereas the C content was too low in all other samples. Almost all samples produced OSL ages (Table 2), except for sample CW2, which was contaminated with feldspar. In the hanging wall, sample 2H-1 yielded a calibrated 14C age of 1445–1623 CE, which matches the OSL burial age of 1578–1688 CE for sample T2H-1 at the same sampling site. All five OSL samples in the footwall yielded increasing ages with depth (Figure 3). In the footwall, three OSL samples (T2F-1, T2F-2, and T2F-3) yielded ages of 1458–1638 CE (0.471 ± 0.090 ka), 2.72 ± 0.30 ka, and 3.39 ± 0.23 ka, from top to bottom. The OSL age of sample T2F-3 also matches the 14C age of 3450–3075 BP at the same location. These suggest deposition of U1 between ∼3.39 and ∼0.47 ka. Two samples in the topmost and top sections of U2 in the footwall yielded OSL ages of 4.81 ± 0.87 and 8.53 ± 0.96 ka, respectively. The OSL age of sample T2F-1 (1458–1638 CE) is different from the calibrated 14C age of 2923–2674 BCE at the same location, which indicates the mixing of material in the fault zone. One detrital charcoal collected in CW2, sample 2-1 (Figure 4), yielded a 14C age of 6373–6067 BCE, which suggests the source of unit CW2, but cannot be used to constrain its age. Three samples that yielded ages >50 ka are most likely Permian coal fragments from the Gondwana unit outcropping at the headwaters of Dungsam Chu [see, e.g., Figures 2, 3 in Long et al. (2011)].
Three charcoal samples and two OSL samples were collected from cut-in-fill terrace T1 (Figure 6). Three charcoal samples found in the bottom organic staining section of horizon A and the top and bottom organic staining sections of the leached and depleted E horizon yielded calibrated 14C ages of 1994–1996 CE, 1970–1972 CE, and 1697–1911 CE, respectively (Figures 4, 6). Two OSL samples taken from the middle sand section of a leached and depleted E horizon and the middle of the B horizon yielded OSL ages of 1375–1587 CE and 1.57 ± 0.30 ka, respectively. Large overdispersion (σb) value for these samples indicates incomplete bleaching; therefore we applied the MAM.
Discussion
Great Medieval Earthquakes
Palaeoseismological studies highlight one to several great medieval earthquakes in the. A large historical rupture around 1100 CE was reported in east-central Nepal (Upreti et al., 2000; Lavé et al., 2005). The largest event mapped in trenches in West Bengal (Kumar et al., 2010), central Bhutan (Le Roux-Mallouf et al., 2016; Le Roux-Mallouf et al., 2020), and eastern Arunachal Pradesh (Kumar et al., 2010) could exhibit consistent coseismic slip and chronology with the ∼1100 CE earthquake. Radiocarbon-modelled constraints on the timing of this event by Le Roux-Mallouf et al. (2016) yielded a scenario of a single mega-event between 1090 and 1145 CE with a 95.4% probability.
The second Great Medieval Earthquake was the historically recorded 1255 Kathmandu earthquake (Pant, 2002), also documented by palaeoseismologic studies (Mugnier et al., 2013; Sapkota et al., 2013; Bollinger et al., 2014) and also suggested to have occurred in West Bengal (Mishra et al., 2016); however, this interpretation was strongly disputed by Pierce and Wesnousky (2016). Alternative modeling of radiocarbon data (Le Roux-Mallouf et al., 2016) supports the latter event but, instead of supporting one mega-event, indicates a series of events between 1025 CE and 1520 CE. The second Great Medieval Earthquake was the largest seismic event observed in Bhutan. At the Piping site, it was dated to between 1204 CE and 1464 CE (Le Roux-Mallouf et al., 2020) or to between 1140 CE and 1520 CE (Le Roux-Mallouf et al., 2016). This event was associated with 12.2 ± 2.8 m of coseismic dip-slip, an Mw > 8.5 earthquake at the Piping site (Le Roux-Mallouf et al., 2020), and 16–23 m of coseismic surface slip with an inferred Mw of ∼8.7 at the Sarpang site (Le Roux-Mallouf et al., 2016).
Nearest trenches where great medieval events were rerecorded lie 124 km to the west (Le Roux-Mallouf et al., 2016) and 130 km to the east (Kumar et al., 2010) of our study site. Therefore, evidence of a medieval earthquake of Mw > 8 would also be expected at our site. However, according to our structural interpretation and dating, E2 in Daranga Mela is older than 8 ka. If the tremendous medieval events had affected this segment of the MHT, the evidence for surface rupture may have been overprinted by the E1 event, or eroded by surface processes. Alternatively, the slip caused by medieval events may not have reached the surface, or has propagated further south into the foreland basin. The lack of traces for medieval events reduces the likeliness of one mega-event rupturing the whole front and puts more weight on the scenario of multiple events.
1714 Bhutan Earthquake
The 1714 Bhutan earthquake has been identified in palaeoseismological trenches in western (Le Roux-Mallouf et al., 2020), central (Berthet et al., 2014; Le Roux-Mallouf et al., 2016), and eastern Bhutan (this study). The structure of the surface-rupturing faults is different; complicated by several splays and several events in the west and central Bhutan but very straight and simple in the east. In the western and eastern Bhutan Late Miocene, Siwalik sediments were thrust over Quaternary fluvial sediments, whereas the entire Siwalik appears to be missing in central Bhutan, where metasediments of the Lesser Himalayan Sequence are thrust over Quaternary alluvial sediments.
The 1714 event was not recognized at palaeoseismological sites west and east of Bhutan (Kumar et al., 2010). Equivalent to our comment about the medieval earthquakes, one must be careful in interpreting a lack of evidence as an absence of the 1714 event. In central Bhutan, there are at least three splays and traces of the MFT (Nakata, 1972; Berthet et al., 2014). The northernmost branch, also known as the TFT, has been investigated in all palaeoseismic studies in Bhutan. In contrast, the palaeoseismic trenches in West Bengal and Arunachal Pradesh lie across the southernmost branch of the MFT, south of the topographic front, where Quaternary sediments are thrust over other Quaternary sediments. Neither the traces in the Bhutan Himalaya foreland nor surfaces ruptures along with the TFT in West Bengal, and Arunachal Pradesh were not yet dated. In addition, the youngest mapped and dated layer in West Bengal and Arunachal Pradesh trenches, besides modern soil, is 1388–1455 CE (Kumar et al., 2010). Therefore, sedimentary conditions did not allow observation of a potential younger surface-breaking event.
F1 cuts unit U1 and is sealed by unit CW2; thus, event 1 occurred after unit U1 and likely triggered the deposition of unit CW2. The age of the uppermost section of U1 in the footwall given by the topmost OSL sample T2F-1 is consistent with the pair of radiocarbon and OSL dates in the hanging wall, confirming the identity of U1 from the footwall to the hanging wall and constrains E1 from rupturing the surface after 1690 CE. Due to the lack of an undisturbed layer sealing the fault, we could not determine the minimum age of the E1 event. The timing of formation of the injected sand would constrain the timing of the earthquake, causing this liquefaction feature to after formation of the soil horizon, with 14C dates of 1697–1911 CE.
In addition to simple calibration, a Bayesian model of OxCal was used to calibrate all samples with F14C < 1 and positive 14C ages (Figure 8), along with a chronostratigraphic model (aka phase model) for deposition episodes (alluvial units T1 and T2, colluvial wedge CW1) and surface-rupturing events E1 at the Dungsam Chu exposure. The model is built from abutting relationships between stratigraphy and faulting and is constrained by 14C and OSL ages. We evaluated several scenarios, all of which yielded similar results. All of the alluvial deposits on the primary exposure were affected by faulting. In the second scenario, we included data from T1 to the south of the MFT trace. The soil horizon 3 with a 14C age of 1697–1911 CE was injected with sand exhibiting older OSL ages; therefore, it was also considered “faulted.” In the third scenario, we included four ages from central Bhutan deposited on top of the event 1 horizon. All scenarios gave the same result for the end of the “phase,” which is interpreted to have been caused by E1. The variations of each scenario included the “event” in 1714 CE and the modern soil, which was not affected by faulting.
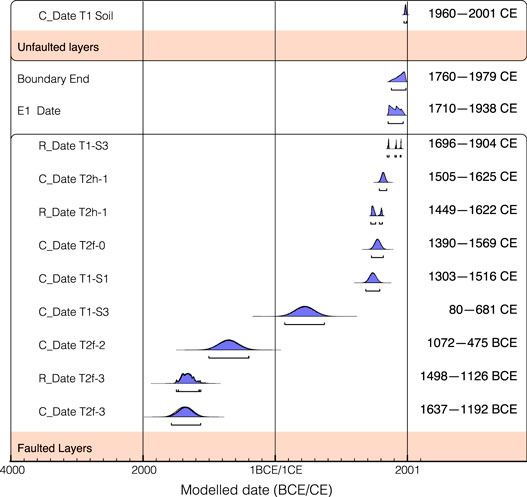
FIGURE 8. 14C ages of detrital charcoal (R_Date) from Dungsam Chu palaeoseismic exposure calibrated using the phase model of OxCal. The OSL data were input by converting the laboratory OSL age to calendar date (C_Date), including the laboratory uncertainties (Lienkaemper and Ramsey, 2009). In this scenario, the two oldest OSL ages were excluded to present the younger ages at a higher resolution. Dark gray areas show posterior probability distributions resulting from the Bayesian phase model of OxCal. Light gray areas show the standard (unmodelled) probability distributions.
Through a combination of observations, chronostratigraphic modeling, and the historical record (Hetényi et al., 2016), we conclude that the E1 surface rupture was caused by the 1714 Bhutan earthquake.
Magnitude and Location of the 1714 Bhutan Earthquake
The simplest and most common palaeo-earthquake magnitude estimate is based on the scaling relationship between the rupture length and magnitude (Wells and Coppersmith, 1994; Leonard, 2010). The distance between the trenches in which the 1714 event was observed was 175 km; the nearest trenches in which the event was not observed (Kumar et al., 2010) were 96 and 130 km to the west and east, respectively. Therefore, the minimum length of the surface rupture was 175 km, and the maximum was ∼400 km, which is likely unrealistic. If we assume that the two oblique strike-slip zones in the underthrusting basement constrain the extent of surface rupture along the MHT, the maximum surface rupture length could have been ∼290 km. The 175–290 km surface rupture length estimated for the 1714 Bhutan earthquake corresponds to Mw 7.8–8.1. According to Leonard (2010), the corresponding average surface displacement would be 3.7–5.6 m, whereas the maximum surface displacement should be double that value (Wells and Coppersmith, 1994; Leonard, 2010), i.e., 7.4–11.2 m. The larger value is consistent with the displacement of 11.3 ± 0.5 m, estimated from our outcrop log.
Following the approach of Hetényi et al. (2016), we performed a full grid search of earthquake scenarios using empirical scaling relationships relating the magnitude to the intensity, source location, and rupture geometry to constrain the size and possible hypocentral location of the 1714 event. The intensity observations and intensity prediction equations (IPE) by Allen et al. (2012) and Szeliga et al. (2010) are fully described in Hetényi et al. (2016). In addition to scaling equations by Wells and Coppersmith (1994) used in Hetényi et al. (2016), we also used those by Leonard (2010), and added the surface rupture observations from Le Roux-Mallouf et al. (2020) and this study. The tested scenarios and parameters used in the calculations are listed in Table 3. The set of four results, combining the two possible IPEs with two possible scaling laws (Figure 9), point to a magnitude range of 7.7–8.5 for plausible solutions, that is, Mw 8.1 ± 0.4. Note that the red fields in Figure 9 outline the area of possible hypocentre locations, not the rupture extent. The relatively lower magnitude models (until M∼8) locate the hypocentre in central Bhutan; the higher magnitude models extend the possible solution area to cover western Bhutan and also toward eastern Bhutan.
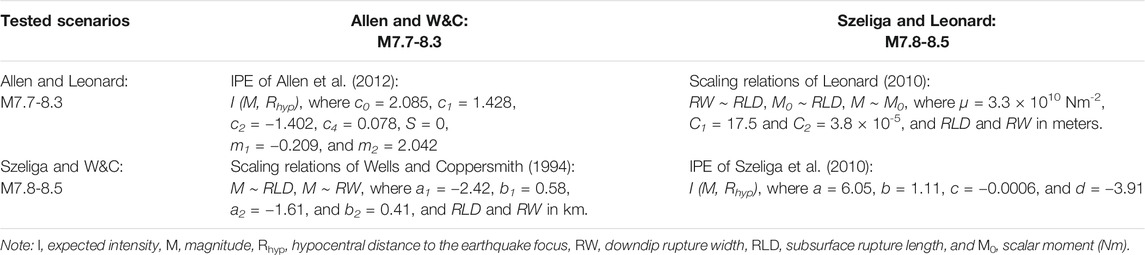
TABLE 3. Tested scenarios and parameters used in the magnitude calculations. Combinations of equations and parameters used for estimated magnitude calculations of the 1714 Bhutan earthquake shown in Figure 9. For the intensity observations please see (Hetényi et al., 2016).
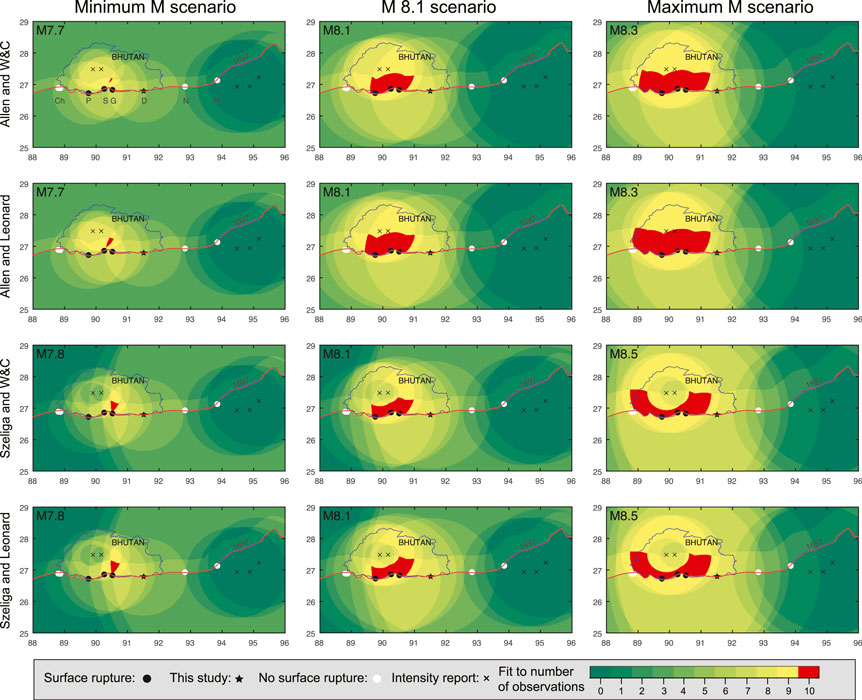
FIGURE 9. Various earthquake scenarios fitting historical damage and paleoseismology observations. Rows correspond to the different combinations of intensity prediction equations by Allen et al. (2012) and Szeliga et al. (2010) combined with scaling relationship equations by Leonard (2010) and Wells and Coppersmith (1994), as explained in Hetényi et al. (2016). The three columns show minimum magnitude, M8.1, and large magnitude scenarios, respectively. The color bar shows the number of observations fitted at the location on the map for a given magnitude; the red area represents hypocentre locations fitting all observed data points. Palaeoseismological trenches where surface rupture caused by the 1714 earthquake was identified are shown in black circles; trenches showing no evidence of surface rupture in the 18th century are shown as white circles. Ch: Chalsa; P: Piping; S: Sarpang; G: Gelephu; D: Dungsam Chu; N: Nameri; H: Harmutty. Intensity reports (Hetényi et al., 2016) are indicated with black crosses. Red line is the simplified trace of the Main Frontal Thrust. Purple segment in the east is the maximum portion of the MHT ruptured by the 1697 Sadiya earthquake (Pandey et al., 2021). Bhutan’s approximate border is shown in blue for reference. Map coordinates are in degrees N and E.
The length-to-width scaling by Leonard (2010) for intracontinental dip-slip faults yielded a rupture width of 31–44 km for surface rupture lengths of 175–290 km. Alternatively, using the scaling equations by Leonard (2010) to the earthquake magnitude range obtained by modeling yields rupture length and width of 118 and ∼42 km for Mw 7.7, and rupture length and width of ∼358 and ∼88 km for Mw 8.5. All these values imply that only the frontal third to half of the fully locked MHT (Li et al., 2020) would have slipped during the 1714 Bhutan earthquake; or that the aspect ratio of rupture length and width differed from the average. However, compared to the Gorkha earthquake of Mw 7.8 that has not ruptured the surface and the model of bimodal seismicity in Dal Zilio et al. (2019), the width parameter is poorly constrained. Nevertheless, with this magnitude range (7.7–8.5), we are confident that the 1714 Bhutan earthquake ruptured the flat portion of the MHT and the frontal ramp between the two strike-slip zones.
Stress Transfer
It has been observed that large instrumental earthquakes that rupture the deep ramp of the MHT do not always cause surface ruptures (Mugnier et al., 2013; Elliott et al., 2016). Therefore paleoseismic on-fault determinations of slip may not provide evidence for these deeper earthquakes in pre-instrumental times (Quigley et al., 2016). Coulomb stress transfer (CST) changes the state of stress around the rupture fault, with some areas (or receiver faults) experiencing an increase in Coulomb stress and others experiencing a decrease in stress (Lin and Stein, 2004). Typically, changes in stress along or across strike are investigated for planar faults, however the MHT has a ramp-flat geometry, thus CST modeling for non-planar faults (Stahl et al., 2016; Hughes et al., 2020) is better suited. Therefore, we use CST to try and determine the potential interaction and triggering between deep ramp earthquakes and the shallow ramp and flat portion of the MHT.
We performed calculations of coseismic stress changes using a realistic ramp-flat geometry of the MHT and the strike-variable surface trace of the MFT. The method used to generate strike-variable fault planes from surface fault traces was developed by Mildon et al. (2016) and dip-variable fault planes in Hughes et al. (2020). The MHT was modeled as a series of 20-km rectangular elements comprising the non-planar fault surface. The ramp-flat geometry of the MHT is based on Coutand et al. (2014) and Singer et al. (2017). All CST calculations were performed in Coulomb 3.4 (Toda et al., 2005), with the coefficient of friction as 0.4 and a Young’s modulus of 80 GPa (Grujic et al., 2018). An earthquake of magnitude 8.1 with a concentric slip distribution (see Mildon et al., 2016) over an area of 230 × 70 km [utilizing the scaling relationships in Wells and Coppersmith (1994)] was generated. Although this is a simple assumption, a hypocentre neither need be in the middle of the fault nor at the location of strongest shaking. For example, the maximum slip of the 2004 Aceh earthquake was located ∼200 km northwest of the hypocenter (Cattin et al., 2009). If the area of the fault that slips stays the same, but the distribution within the area varies, e.g., is skewed to one end, then the regions of positive and negative stress stay approximately the same, though the magnitudes undoubtedly vary (Mildon et al., 2017). Two earthquake scenarios were modeled, one with the slip on the deep ramp and one with the slip on the flat section. Although it has been documented that the MHT ramp has been creeping (Dal Zilio et al., 2021), we use this scenario to simulate earthquakes on the internal part of the MHT. The magnitude of Coulomb stress changes caused by coseismic slip on a fault also depends on the assumed elastic structure, which in this work is oversimplified (homogeneous half-space).
When the great earthquake slip is on the flat portion of the MHT (between 14 and 15 km depth), this transfers high positive Coulomb stresses (>10 bar) onto the frontal thrust (Figure 10A), indicating that earthquakes that predominantly slip the flat section will promote rupture on the frontal thrust, and therefore are likely to generate surface ruptures. The CST calculations indicate that an earthquake along the deep ramp on the MHT would transfer considerable amounts (up to and over 10 bar) of positive Coulomb stress onto the flat portion of the fault; however, much less (<2 bar) is transferred onto the frontal ramp (Figure 10C). In cross-section (Figure 11), we show the distribution of stress changes projected on subhorizontal planes and the optimally oriented thrust faults. Seismic slip along the ramp of the MHT would cause positive changes in the Coulomb stress along the shallow, flat segment of the MHT located in the end-fault lobe of the ramp (Figure 11A). However, clamping effects (i.e., compressive changes of normal stress) in the frontal part of the MHT are important (Figure 11B) impeding propagation of the slip to the surface (i.e., MFT). A similar stress pattern is observed for the optimally oriented thrust faults; although the Coulomb stress change along the MHT is neutral, the unclamping effect (i.e., tensile changes of normal stress) is modest (Figures 11C,D). Consequently, deep slip on the MFT may increase elastic strain in upper crustal levels, including shallow MFT, which is then accommodated by slip on the shallow MFT. The Coulomb stress increase along the flat portion of the MHT would promote future earthquakes along the frontal segment of the MHT and thus along with the frontal thrust. The down-dip end-fault stress lobes for both horizontal faults and optimally oriented faults are positive (Figures 11A′–D′), which is not the case for the deep slip (Figures 11A–D). It is important to note that the up-dip end-fault Coulomb stresses lobe is associated with a lobe of positive normal stress change (unclamping effect) (Figures 11A′,B′). Although the positive Coulomb stress change is larger for the thrust faults (cf. Figures 11A′,C′) there is a significant clamping effect (Figure 11D′), promoting MHT propagation into the foreland basin in the form of a blind basal décollement. Such a structure has been observed within or below the lower Siwalik Group in the subsurface of the foreland basin of the eastern Nepalese Himalaya (Duvall et al., 2020). Blind basal décollement may exist in the Bhutan Himalayan foreland basin as suggested by juvenile triangle zones in West Bengal and western Assam (Dasgupta et al., 2013; Chakrabarti Goswami et al., 2019). Therefore, palaeoseismic studies around the surface trace of the MFT may overestimate the slip potential where un-recognized faults or distributed deformation provide additional sources of strain release. In the case of the blind basal décollement in the foreland basin, the region of pre-seismic strain accumulation is only 20–40 km wide, the maximum slip that can be stored and released, no matter how long the interval since the previous earthquake, is only a couple of meters (Bilham, 2019).
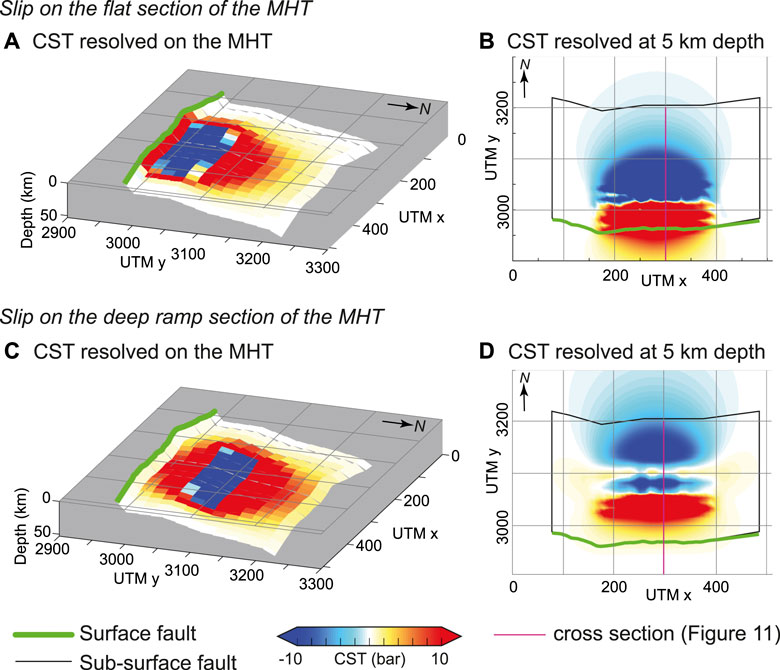
FIGURE 10. Models of Coulomb Stress Transfer (CST) for representative earthquakes. The color scale of CST is the same for all figures. (A). slip on the flat section of the MHT with stress resolved onto the rest of the MHT, (B). slip on the flat section with stress resolved at 5 km depth onto receiver faults with the geometry 270/45/90 (strike/dip/rake), (C). slip on the deep ramp (>15 km depth) of the MHT with stress resolved onto the rest of the MHT, (D). slip on the deep ramp with stress resolved at 5 km depth onto receiver faults with the geometry 270/45/90.
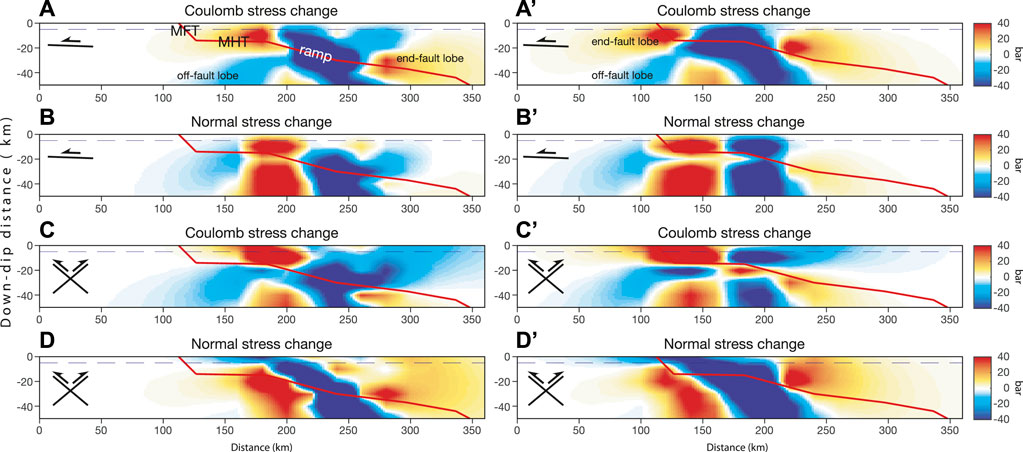
FIGURE 11. Cross-section view of the distribution of static stress changes caused by the 1714 Bhutan earthquake along a profile perpendicular to the strike of the MFT. The left-hand panels show the Coulomb stress (A,C) normal stress (B,D) changes caused by a shock with hypocentre on the deep ramp of the MHT. The right-hand panels show the Coulomb stress (A′,C′) normal stress (B′,D′) changes caused by a shock with hypocentre on the flay segment of the MHT. Static stress changes are calculated for the subhorizontal planes with the geometry 270/02/90 (A,A′,B,B′) and optimally oriented thrust faults with the geometry 270/40/90 (C,C′,D,D′).
Conclusion
Combined radiocarbon and OSL dating of river sediments at a new paleoseismic site, supported by historical records, indicated that the most recent surface rupture along the MFT in Eastern Bhutan was caused by the 1714 Bhutan earthquake. The surface rupture length was at least 175 km and likely up to ∼290 km. The largest observed coseismic surface displacement was ∼10.5 m. The scaling relationship between the rupture length and magnitude (Wells and Coppersmith, 1994; Leonard, 2010) indicated a minimum magnitude of Mw of 7.8–8.1. Computations using empirical scaling relationships, historical intensity data, and palaeoseismologically determined surface ruptures in the Bhutan Himalaya yielded plausible magnitudes of 7.7–8.5. The same calculations placed the epicentre of the 1714 Bhutan earthquake on the flat segment of the MHT. CST calculations suggested that distal earthquakes do not promote rupture on the frontal thrust. In contrast, a great earthquake along the flat portion of the MHT would cause slip along the frontal ramp (MFT), and would promote the propagation of the MHT into the foreland basin in the form of a blind thrust.
The current state of Himalayan palaeoseismological knowledge (Bilham, 2019) suggests that the majority of great surface-rupturing earthquakes during the last millennium have been identified, although the dating precision for some of them is low. However, great earthquakes that did not lead to surface rupture caused stress transfer into the flat frontal portion, promoting subsequent surface-rupturing events along the MFT.
Data Availability Statement
The original contributions presented in the study are included in the article/Supplementary Material, further inquiries can be directed to the corresponding author. The code to model strike- and dip-variable faults in Coulomb 3.4 is available from https://github.com/ZoeMildon/3D-faults.
Author Contributions
YZ: Fieldwork, data acquisition data interpretation, writing; DG: project concept and funding, field work, data acquisition data interpretation, writing; SB: field work, data acquisition; DD: field work, data acquisition; JE: data acquisition; GH: data interpretation, data modelling, writing; GK: data acquisition, data interpretation; ZM: data modelling, data interpretation. NN: field work, data acquisition; CW: data acquisition, data interpretation.
Funding
The study was supported by the Natural Sciences and Engineering Research Council of Canada (NSERC) grant RGPIN/4297-2014 to DG, and the National Geographic Society (Scientific research grant 83118-07 to DG). ZM acknowledges the support from NERC Studentship NE/L501700/1 and JSPS Short Term Fellowship PE15776 for developing the method to model stress changes on faults with variable geometry. Mitacs Globalink Research Award and the GSA student award provided the financial support to YZ for her work visit to the University of Lausanne. GH acknowledges the support of the Swiss National Science Foundation for project OROG3NY (grant number PP00P2_157627).
Conflict of Interest
The authors declare that the research was conducted in the absence of any commercial or financial relationships that could be construed as a potential conflict of interest.
Publisher’s Note
All claims expressed in this article are solely those of the authors and do not necessarily represent those of their affiliated organizations, or those of the publisher, the editors and the reviewers. Any product that may be evaluated in this article, or claim that may be made by its manufacturer, is not guaranteed or endorsed by the publisher.
Acknowledgments
We are grateful to Etho Metho travel agency for logistic support in Bhutan and to Abhijit Chowdhury and his team for field assistance in Assam. Palynological Laboratory Services Ltd (UK) performed the pollen separation. We also thank Isabelle Coutand, Roman Kislitsyn, John Gosse, Olivia Rolfe, and Luca Malatesta for laboratory assistance and discussion. Critical comments by reviewers RJ and MQ are greatly acknowledged.
Supplementary Material
The Supplementary Material for this article can be found online at: https://www.frontiersin.org/articles/10.3389/feart.2021.689457/full#supplementary-material
References
Allen, T. I., Wald, D. J., and Worden, C. B. (2012). Intensity Attenuation for Active Crustal Regions. J. Seismol 16 (3), 409–433. doi:10.1007/s10950-012-9278-7
Ambraseys, N., and Jackson, D. (2003). A Note on Early Earthquakes in Northern India and Southern Tibet. Curr. Sci. 84, 570–582.
Bell, W. (1979). Attenuation Factors for the Absorbed Radiation Dose in Quartz Inclusions for Thermoluminescence Dating. Ancient TL 8 (2), 12.
Berthet, T., Ritz, J.-F., Ferry, M., Pelgay, P., Cattin, R., Drukpa, D., et al. (2014). Active Tectonics of the Eastern Himalaya: New Constraints from the First Tectonic Geomorphology Study in Southern Bhutan. Geology 42 (5), 427–430. doi:10.1130/g35162.1
Bilham, R. (2019). Himalayan Earthquakes: a Review of Historical Seismicity and Early 21st century Slip Potential. Geol. Soc. Lond. Spec. Publications 483 (1), 423–482. doi:10.1144/sp483.16
Biswas, S., Coutand, I., Grujic, D., Hager, C., Stöckli, D., and Grasemann, B. (2007). Exhumation and Uplift of the Shillong Plateau and its Influence on the Eastern Himalayas: New Constraints from Apatite and Zircon (U-Th-[Sm])/He and Apatite Fission Track Analyses. Tectonics 26 (6), a–n. doi:10.1029/2007tc002125
Bollinger, L., Sapkota, S. N., Tapponnier, P., Klinger, Y., Rizza, M., Van Der Woerd, J., et al. (2014). Estimating the Return Times of Great Himalayan Earthquakes in Eastern Nepal: Evidence from the Patu and Bardibas Strands of the Main Frontal Thrust. J. Geophys. Res. Solid Earth 119 (9), 7123–7163. doi:10.1002/2014jb010970
Brennan, B., Lyons, R., and Phillips, S. (1991). Attenuation of Alpha Particle Track Dose for Spherical Grains. Int. J. Radiat. Appl. Instrumentation. D. Nucl. Tracks Radiat. Measurements 18 (1-2), 249–253. doi:10.1016/1359-0189(91)90119-3
Burgess, W. P., Yin, A., Dubey, C. S., Shen, Z.-K., and Kelty, T. K. (2012). Holocene Shortening across the Main Frontal Thrust Zone in the Eastern Himalaya. Earth Planet. Sci. Lett. 357, 152–167.
Cattin, R., Chamot‐Rooke, N., Pubellier, M., Rabaute, A., Delescluse, M., Vigny, C., et al. (2009). Stress Change and Effective Friction Coefficient along the Sumatra‐Andaman‐Sagaing Fault System after the 26 December 2004 (Mw= 9.2) and the 28 March 2005 (Mw= 8.7) Earthquakes. Geochem. Geophys. Geosystems 10 (3). doi:10.1029/2008gc002167
Chakrabarti Goswami, C., Jana, P., and Weber, J. C. (2019). Evolution of Landscape in a piedmont Section of Eastern Himalayan Foothills along India-Bhutan Border: A Tectono-Geomorphic Perspective. J. Mt. Sci. 16 (12), 2828–2843. doi:10.1007/s11629-018-5208-7
Chirouze, F., Huyghe, P., Van Der Beek, P., Chauvel, C., Chakraborty, T., Dupont-Nivet, G., et al. (2013). Tectonics, Exhumation, and Drainage Evolution of the Eastern Himalaya since 13 Ma from Detrital Geochemistry and Thermochronology, Kameng River Section, Arunachal Pradesh. Geol. Soc. America Bull. 125 (3-4), 523–538. Available at: http://gsabulletin.gsapubs.org/cgi/doi/10.1130/B30697.1. doi:10.1130/b30697.1
Clark, M., and Bilham, R. (2008). Miocene Rise of the Shillong Plateau and the Beginning of the End for the Eastern Himalaya. Earth Planet. Sci. Lett. 269 (3), 337–351. Available at: http://linkinghub.elsevier.com/retrieve/pii/S0012821X0800071X. doi:10.1016/j.epsl.2008.01.045
Coutand, I., Barrier, L., Govin, G., Grujic, D., Hoorn, C., Dupont-Nivet, G., et al. (2016). Late Miocene-Pleistocene Evolution of India-Eurasia Convergence Partitioning between the Bhutan Himalaya and the Shillong Plateau: New Evidences from Foreland basin Deposits along the Dungsam Chu Section, Eastern Bhutan. Tectonics 35 (12), 2963–2994. doi:10.1002/2016tc004258
Coutand, I., Whipp, D. M., Grujic, D., Bernet, M., Fellin, M. G., Bookhagen, B., et al. (2014). Geometry and Kinematics of the Main Himalayan Thrust and Neogene Crustal Exhumation in the Bhutanese Himalaya Derived from Inversion of Multithermochronologic Data. J. Geophys. Res. Solid Earth 119 (2), 1446–1481. doi:10.1002/2013jb010891
Dal Zilio, L., Hetényi, G., Hubbard, J., and Bollinger, L. (2021). Building the Himalaya from Tectonic to Earthquake Scales. Nat. Rev. Earth Environ. 6, 1–18.
Dal Zilio, L., van Dinther, Y., Gerya, T., and Avouac, J.-P. (2019). Bimodal Seismicity in the Himalaya Controlled by Fault Friction and Geometry. Nat. Commun. 10 (1), 48. doi:10.1038/s41467-018-07874-8
Dasgupta, S., Mazumdar, K., Moirangcha, L. H., Gupta, T. D., and Mukhopadhyay, B. (2013). Seismic Landscape from Sarpang Re-entrant, Bhutan Himalaya Foredeep, Assam, India: Constraints from Geomorphology and Geology. Tectonophysics 592, 130–140. doi:10.1016/j.tecto.2013.02.021
Diehl, T., Singer, J., Hetényi, G., Grujic, D., Clinton, J., Giardini, D., et al. (2017). Seismotectonics of Bhutan: Evidence for Segmentation of the Eastern Himalayas and Link to Foreland Deformation. Earth Planet. Sci. Lett. 471, 54–64. doi:10.1016/j.epsl.2017.04.038
Drukpa, D., Gautier, S., Cattin, R., Namgay, K., and Le Moigne, N. (2018). Impact of Near-Surface Fault Geometry on Secular Slip Rate Assessment Derived from Uplifted River Terraces: Implications for Convergence Accommodation across the Frontal Thrust in Southern Central Bhutan. Geophys. J. Int. 212 (2), 1315–1330. doi:10.1093/gji/ggx478
Drukpa, D., Velasco, A. A., and Doser, D. I. (2006). Seismicity in the Kingdom of Bhutan (1937-2003): Evidence for Crustal Transcurrent Deformation. J. Geophys. Res. 111 (B06301), a–n. doi:10.1029/2004JB003087
Duller, G. A. T. (2008). Single-grain Optical Dating of Quaternary Sediments: Why Aliquot Size Matters in Luminescence Dating. Boreas 37 (4), 589–612. doi:10.1111/j.1502-3885.2008.00051.x
Durcan, J. A., King, G. E., and Duller, G. A. T. (2015). DRAC: Dose Rate and Age Calculator for Trapped Charge Dating. Quat. Geochronol. 28, 54–61. doi:10.1016/j.quageo.2015.03.012
Duvall, M. J., Waldron, J. W. F., Godin, L., and Najman, Y. (2020). Active Strike-Slip Faults and an Outer Frontal Thrust in the Himalayan Foreland basin. Proc. Natl. Acad. Sci. USA 117 (30), 17615–17621. doi:10.1073/pnas.2001979117
Elliott, J. R., Jolivet, R., González, P. J., Avouac, J.-P., Hollingsworth, J., Searle, M. P., et al. (2016). Himalayan Megathrust Geometry and Relation to Topography Revealed by the Gorkha Earthquake. Nat. Geosci. 9 (2), 174–180. doi:10.1038/ngeo2623
England, P., and Bilham, R. (2015). The Shillong Plateau and the Great 1897 Assam Earthquake. Tectonics 34 (9), 1792–1812. doi:10.1002/2015tc003902
Gahalaut, V. K., Rajput, S., and Kundu, B. (2011). Low Seismicity in the Bhutan Himalaya and the Stress Shadow of the 1897 Shillong Plateau Earthquake. Phys. Earth Planet. Interiors 186, 97–102. doi:10.1016/j.pepi.2011.04.009
Galbraith, R. F., Roberts, R. G., Laslett, G. M., Yoshida, H., and Olley, J. M. (1999). Optical Dating of Single and Multiple Grains of Quartz from Jinmium Rock Shelter, Northern Australia: Part I, Experimental Design and Statistical Models. Archaeometry 41 (2), 339–364. doi:10.1111/j.1475-4754.1999.tb00987.x
Grujic, D., Govin, G., Barrier, L., Bookhagen, B., Coutand, I., Cowan, B., et al. (2018). Formation of a Rain Shadow: O and H Stable Isotope Records in Authigenic Clays from the Siwalik Group in Eastern Bhutan. Geochem. Geophys. Geosyst. 19 (9), 3430–3447. doi:10.1029/2017gc007254
Grujic, D., Hetényi, G., Cattin, R., Baruah, S., Benoit, A., Drukpa, D., et al. (2018). Stress Transfer and Connectivity between the Bhutan Himalaya and the Shillong Plateau. Tectonophysics 744, 322–332. doi:10.1016/j.tecto.2018.07.018
Guérin, G., Mercier, N., and Adamiec, G. (2011). Dose-rate Conversion Factors: Update. Ancient TL 29 (1), 5–8.
Guérin, G., Mercier, N., Nathan, R., Adamiec, G., and Lefrais, Y. (2012). On the Use of the Infinite Matrix assumption and Associated Concepts: a Critical Review. Radiat. Measurements 47 (9), 778–785. doi:10.1016/j.radmeas.2012.04.004
Hammer, P., Berthet, T., Hetényi, G., Cattin, R., Drukpa, D., Chophel, J., et al. (2013). Flexure of the India Plate underneath the Bhutan Himalaya. Geophys. Res. Lett. 40 (16), 4225–4230. doi:10.1002/grl.50793
Hauck, M. L., Nelson, K. D., Brown, L. D., Zhao, W., and Ross, A. R. (1998). Crustal Structure of the Himalayan Orogen at ∼90° East Longitude from Project INDEPTH Deep Reflection Profiles. Tectonics 17 (4), 481–500. doi:10.1029/98tc01314
Hetényi, G., Cattin, R., Berthet, T., Le Moigne, N., Chophel, J., Lechmann, S., et al. (2016). Segmentation of the Himalayas as Revealed by Arc-Parallel Gravity Anomalies. Scientific Rep. 6 (1), 1–10. doi:10.1038/srep33866
Hetényi, G., Le Roux-Mallouf, R., Berthet, T., Cattin, R., Cauzzi, C., Phuntsho, K., et al. (2016). Joint Approach Combining Damage and Paleoseismology Observations Constrains the 1714 A.D. Bhutan Earthquake at Magnitude 8 ± 0.5. Geophys. Res. Lett. 43 (20), 10,695–10,702. doi:10.1002/2016GL071033
Hirschmiller, J., Grujic, D., Bookhagen, B., Coutand, I., Huyghe, P., Mugnier, J.-L., et al. (2014). What Controls the Growth of the Himalayan Foreland Fold-And-Thrust belt? Geology 42 (3), 247–250. doi:10.1130/g35057.1
Hua, Q., Barbetti, M., and Rakowski, A. Z. (2013). Atmospheric Radiocarbon for the Period 1950-2010. Radiocarbon 55 (4), 2059–2072. doi:10.2458/azu_js_rc.v55i2.16177
Hughes, A., Bell, R., Mildon, Z., Rood, D., Whittaker, A., Rockwell, T., et al. (2020). Three‐Dimensional Structure, Ground Rupture Hazards, and Static Stress Models for Complex Nonplanar Thrust Faults in the Ventura Basin, Southern California. J. Geophys. Res. Solid Earth 125 (7), e2020JB019539. doi:10.1029/2020jb019539
Jayangondaperumal, R., Thakur, V., Joevivek, V., Rao, P. S., and Gupta, A. K. (2018). Active Tectonics of Kumaun and Garhwal Himalaya. Springer. doi:10.1007/978-981-10-8243-6
Kreutzer, S., Dietze, M., Burow, C., Fuchs, M., Schmidt, C., Fischer, M., et al. (2016). Comprehensive Luminescence Dating Data Analysis (R Package). See Available at: https://cran.r-project.org/web/packages/Luminescence/index.html.
Kumar, S., Wesnousky, S. G., Jayangondaperumal, R., Nakata, T., Kumahara, Y., and Singh, V. (2010). Paleoseismological Evidence of Surface Faulting along the Northeastern Himalayan Front, India: Timing, Size, and Spatial Extent of Great Earthquakes. J. Geophys. Res. 115 (B12), B12422. Available at: http://www.agu.org/pubs/crossref/2010/2009JB006789.shtml. doi:10.1029/2009jb006789
Lague, D. (2014). The Stream Power River Incision Model: Evidence, Theory and beyond. Earth Surf. Process. Landforms 39 (1), 38–61. doi:10.1002/esp.3462
Lavé, J., Yule, D., Sapkota, S., Basant, K., Madden, C., Attal, M., et al. (2005). Evidence for a Great Medieval Earthquake (1100 A.D.) in the Central Himalayas, Nepal. Science 307 (5713), 1302–1305. doi:10.1126/science.1104804
Le Roux‐Mallouf, R., Ferry, M., Ritz, J. F., Berthet, T., Cattin, R., and Drukpa, D. (2016). First Paleoseismic Evidence for Great Surface‐rupturing Earthquakes in the Bhutan Himalayas. J. Geophys. Res. Solid Earth 121 (10), 7271–7283.
Le Roux‐Mallouf, R., Godard, V., Cattin, R., Ferry, M., Gyeltshen, J., Ritz, J. F., et al. (2015). Evidence for a Wide and Gently Dipping Main Himalayan Thrust in Western Bhutan. Geophys. Res. Lett. 42 (9), 3257–3265.
Le Roux-Mallouf, R., Ferry, M., Cattin, R., Ritz, J.-F., Drukpa, D., and Pelgay, P. (2020). A 2600-Year-Long Paleoseismic Record for the Himalayan Main Frontal Thrust (Western Bhutan). Solid Earth 11 (6), 2359–2375. doi:10.5194/se-11-2359-2020
Lee, J.-C., Chen, Y.-G., Sieh, K., Mueller, K., Chen, W.-S., Chu, H.-T., et al. (2001). A Vertical Exposure of the 1999 Surface Rupture of the Chelungpu Fault at Wufeng, Western Taiwan: Structural and Paleoseismic Implications for an Active Thrust Fault. Bull. Seismological Soc. America 91 (5), 914–929.
Leonard, M. (2010). Earthquake Fault Scaling: Self-Consistent Relating of Rupture Length, Width, Average Displacement, and Moment Release. Bull. Seismological Soc. America 100 (5A), 1971–1988. doi:10.1785/0120090189
Levin, I., Kromer, B., and Hammer, S. (2013). Atmospheric Δ14CO2 Trend in Western European Background Air from 2000 to 2012. Tellus B: Chem. Phys. Meteorology 65 (1), 20092. doi:10.3402/tellusb.v65i0.20092
Li, S., Tao, T., Gao, F., Qu, X., Zhu, Y., Huang, J., et al. (2020). Interseismic Coupling beneath the Sikkim-Bhutan Himalaya Constrained by GPS Measurements and its Implication for Strain Segmentation and Seismic Activity. Remote Sensing 12 (14), 2202. doi:10.3390/rs12142202
Lienkaemper, J. J., and Ramsey, C. B. (2009). OxCal: Versatile Tool for Developing Paleoearthquake Chronologies--A Primer. Seismological Res. Lett. 80 (3), 431–434. doi:10.1785/gssrl.80.3.431
Liu, F., and Yang, S. (2015). The Effect of the Wenchuan Earthquake on the Fluvial Morphology in the Longmen Shan, Eastern Tibetan Plateau: Discussion and Speculation. Quat. Int. 371, 280–289. doi:10.1016/j.quaint.2014.09.021
Long, S., McQuarrie, N., Tobgay, T., Rose, C., Gehrels, G., and Grujic, D. (2011). Tectonostratigraphy of the Lesser Himalaya of Bhutan: Implications for the Along-Strike Stratigraphic Continuity of the Northern Indian Margin. Geol. Soc. America Bull. 123 (7-8), 1406–1426. doi:10.1130/B30202.1
Long, S. P., McQuarrie, N., Tobgay, T., Coutand, I., Cooper, F. J., Reiners, P. W., et al. (2012). Variable Shortening Rates in the Eastern Himalayan Thrust belt, Bhutan: Insights from Multiple Thermochronologic and Geochronologic Data Sets Tied to Kinematic Reconstructions. Tectonics 31 (5). Available at: http://www.agu.org/pubs/crossref/2012/2012TC003155.shtml. doi:10.1029/2012tc003155
Mansfield, C., and Cartwright, J. (2001). Fault Growth by Linkage: Observations and Implications from Analogue Models. J. Struct. Geology. 23 (5), 745–763. doi:10.1016/s0191-8141(00)00134-6
Marechal, A., Mazzotti, S., Cattin, R., Cazes, G., Vernant, P., Drukpa, D., et al. (2016). Evidence of Interseismic Coupling Variations along the Bhutan Himalayan Arc from New GPS Data. Geophys. Res. Lett. 43 (24), 399–312. doi:10.1002/2016gl071163
Mildon, Z. K. (2017). The Link between Earthquakes and Structural Geology; the Role of Elapsed Time, 3D Geometry and Stress Transfer in the central Apennines. Italy: (Doctporal dissertation), UCL (University College London).
Mildon, Z. K., Toda, S., Faure Walker, J. P., and Roberts, G. P. (2016). Evaluating Models of Coulomb Stress Transfer: Is Variable Fault Geometry Important?. Geophys. Res. Lett. 43 (24), 407–412. doi:10.1002/2016gl071128
Mishra, R. L., Singh, I., Pandey, A., Rao, P., Sahoo, H., and Jayangondaperumal, R. (2016). Paleoseismic Evidence of a Giant Medieval Earthquake in the Eastern Himalaya. Geophys. Res. Lett. 43 (11), 5707–5715. doi:10.1002/2016GL068739
Mugnier, J.-L., Gajurel, A., Huyghe, P., Jayangondaperumal, R., Jouanne, F., and Upreti, B. (2013). Structural Interpretation of the Great Earthquakes of the Last Millennium in the central Himalaya. Earth-Science Rev. 127, 30–47. doi:10.1016/j.earscirev.2013.09.003
Mugnier, J., Huyghe, P., Leturmy, P., and Jouanne, F. (2004). “Episodicity and Rates of Thrust Sheet Motion in Himalaya (Western Nepal),” in Thrust Tectonics and Hydrocarbon Systems. Editor K. R. Mc Clay (American Association of Petroleum Geologists Memoir), 91–114.
Mukul, M., Jade, S., Ansari, K., Matin, A., and Joshi, V. (2018). Structural Insights from Geodetic Global Positioning System Measurements in the Darjiling-Sikkim Himalaya. J. Struct. Geology 114, 346–356. doi:10.1016/j.jsg.2018.03.007
Murray, A. S., and Wintle, A. G. (2000). Luminescence Dating of Quartz Using an Improved Single-Aliquot Regenerative-Dose Protocol. Radiat. measurements 32 (1), 57–73. doi:10.1016/s1350-4487(99)00253-x
Nakata, T. (1972). Geomorphic History and Crustal Movement of the Foot-hills of the Himalayas, The Science Reports of the Tohoku University 7th series. Geography 22 (1), 39–177.
Pandey, A., Jayangondaperumal, R., Hetényi, G., Priyanka, R. S., Singh, I., Srivastava, P., et al. (2021). Establishing Primary Surface Rupture Evidence And Magnitude of The 1697 CE Sadiya Earthquake At The Eastern Himalayan Frontal Thrust, India. Sci. Rep. 11, 879. doi:10.1038/s41598-020-79571-w
Philip, H., and Meghraoui, M. (1983). Structural Analysis and Interpretation of the Surface Deformations of the El Asnam Earthquake of October 10, 1980. Tectonics 2 (1), 17–49. doi:10.1029/tc002i001p00017
Pierce, I., and Wesnousky, S. G. (2016). On a Flawed Conclusion that the 1255 A.D. Earthquake Ruptured 800 Km of the Himalayan Frontal Thrust East of Kathmandu. Geophys. Res. Lett. 43 (17), 9026–9029. doi:10.1002/2016gl070426
Quigley, M. C., Hughes, M. W., Bradley, B. A., van Ballegooy, S., Reid, C., Morgenroth, J., et al. (2016). The 2010-2011 Canterbury Earthquake Sequence: Environmental Effects, Seismic Triggering Thresholds and Geologic Legacy. Tectonophysics 672-673, 228–274. doi:10.1016/j.tecto.2016.01.044
Rajendran, C., Rajendran, K., Duarah, B., Baruah, S., and Earnest, A. (2004). Interpreting the Style of Faulting and Paleoseismicity Associated with the 1897 Shillong, Northeast India, Earthquake: Implications for Regional Tectonism. Tectonics 23 (4). doi:10.1029/2003tc001605
Ramsey, C. B. (2017). Methods for Summarizing Radiocarbon Datasets. Radiocarbon 59 (6), 1809–1833. doi:10.1017/rdc.2017.108
Reimer, P. J., Austin, W. E. N., Bard, E., Bayliss, A., Blackwell, P. G., Bronk Ramsey, C., et al. (2020). The IntCal20 Northern Hemisphere Radiocarbon Age Calibration Curve (0-55 Cal kBP). Radiocarbon 62 (4), 725–757. doi:10.1017/rdc.2020.41
Reimer, P. J., Bard, E., Bayliss, A., Beck, J. W., Blackwell, P. G., Ramsey, C. B., et al. (2013). IntCal13 and Marine13 Radiocarbon Age Calibration Curves 0-50,000 Years Cal BP. Radiocarbon 55 (4), 1869–1887. doi:10.2458/azu_js_rc.55.16947
Reimer, P. J., Brown, T. A., and Reimer, R. W. (2004). Discussion: Reporting and Calibration of post-bomb 14C Data. Radiocarbon 46 (3), 1299–1304.
Robinson, T. R. (2020). Scenario Ensemble Modelling of Possible Future Earthquake Impacts in Bhutan. Nat. Hazards 103 (3), 3457–3478. doi:10.1007/s11069-020-04138-x
Sapkota, S. N., Bollinger, L., Klinger, Y., Tapponnier, P., Gaudemer, Y., and Tiwari, D. (2013). Primary Surface Ruptures of the Great Himalayan Earthquakes in 1934 and 1255. Nat. Geosci. 6 (1), 71–76. doi:10.1038/ngeo1669
Singer, J., Obermann, A., Kissling, E., Fang, H., Hetényi, G., and Grujic, D. (2017). Along‐strike Variations in the H Imalayan Orogenic Wedge Structure in B Hutan from Ambient Seismic Noise Tomography. Geochem. Geophys. Geosyst. 18 (4), 1483–1498. doi:10.1002/2016gc006742
Stahl, T., Quigley, M. C., McGill, A., and Bebbington, M. S. (2016). Modeling Earthquake Moment Magnitudes on Imbricate Reverse Faults from Paleoseismic Data: Fox Peak and forest Creek Faults, South Island, New Zealand. Bull. Seismological Soc. America 106 (5), 2345–2363. doi:10.1785/0120150215
Stevens, V. L., and Avouac, J. P. (2015). Interseismic Coupling on the Main Himalayan Thrust. Geophys. Res. Lett. 42 (14), 5828–5837. doi:10.1002/2015gl064845
Stevens, V. L., De Risi, R., Le Roux-Mallouf, R., Drukpa, D., and Hetényi, G. (2020). Seismic hazard and Risk in Bhutan. Nat. Hazards 104 (3), 2339–2367. doi:10.1007/s11069-020-04275-3
Stockmal, G. S., Lebel, D., Mcmechan, M. E., and Mackay, P. A. (2001). Structural Style and Evolution of the triangle Zone and External Foothills, Southwestern Alberta: Implications for Thin-Skinned Thrust-and-fold belt Mechanics. Bull. Can. Pet. Geology 49 (4), 472–496. doi:10.2113/49.4.472
Stuiver, M., and Polach, H. A. (1977). Discussion Reporting of 14C Data. Radiocarbon 19 (3), 355–363. doi:10.1017/s0033822200003672
Sutar, A. K., Verma, M., Pandey, A. P., Bansal, B. K., Rajendra Prasad, P., Rama Rao, P., et al. (2017). Assessment of Maximum Earthquake Potential of the Kopili Fault Zone in Northeast India and strong Ground Motion Simulation. J. Asian Earth Sci. 147, 439–451. doi:10.1016/j.jseaes.2017.07.035
Szeliga, W., Hough, S., Martin, S., and Bilham, R. (2010). Intensity, Magnitude, Location, and Attenuation in India for Felt Earthquakes since 1762. Bull. Seismological Soc. America 100 (2), 570–584. doi:10.1785/0120080329
Toda, S., Stein, R. S., Richards‐Dinger, K., and Bozkurt, S. B. (2005). Forecasting the Evolution of Seismicity in Southern California: Animations Built on Earthquake Stress Transfer. J. Geophys. Res. Solid Earth 110 (B5). doi:10.1029/2004jb003415
Upreti, B., Nakata, T., Kumahara, Y., Yagi, H., Okumura, K., Rockwell, T., et al. (2000). The Latest Active Faulting in Southeast Nepal. Paper presented at the Proceedings of the Hokudan International symposium and School in active faulting.
USGS (2020). M 6.1 - Bhutan. Retrieved from Available at: https://earthquake.usgs.gov/earthquakes/eventpage/usp000h1r4/executive.
van der Beek, P., Robert, X., Mugnier, J.-L., Bernet, M., Huyghe, P., and Labrin, E. (2006). Late Miocene - Recent Exhumation of the central Himalaya and Recycling in the Foreland basin Assessed by Apatite Fission-Track Thermochronology of Siwalik Sediments, Nepal. Basin Res. 18 (4), 413–434. doi:10.1111/j.1365-2117.2006.00305.x
Wacker, L., Bonani, G., Friedrich, M., Hajdas, I., Kromer, B., Němec, M., et al. (2010a). MICADAS: Routine And High-Precision Radiocarbon Dating. Radiocarbon 52 (2), 252–262. doi:10.1017/S0033822200045288
Wacker, L., Němec, M., and Bourquin, J. (2010b). A Revolutionary Graphitisation System: Fully Automated, Compact and Simple. Nucl. Instrum. Methods Phys. Res. B 268 (7-8), 931–934. doi:10.1016/j.nimb.2009.10.067
Wells, D. L., and Coppersmith, K. J. (1994). New Empirical Relationships Among Magnitude, Rupture Length, Rupture Width, Rupture Area, and Surface Displacement. Bull. seismological Soc. America 84 (4), 974–1002.
Welte, C., Hendriks, L., Wacker, L., Haghipour, N., Eglinton, T. l., and Günther, D. (2018). Towards The Limits: Analysis Of Microscale 14C Samples Using EA-AMS. Nucl. Instrum. Methods Phys. Res. B 437, 66–74. doi:10.1016/j.nimb.2018.09.046
Keywords: surface rupture, stress transfer, Himalaya, optically stimulated luminescence dating, radiocarbon dating
Citation: Zhao Y, Grujic D, Baruah S, Drukpa D, Elkadi J, Hetényi G, King GE, Mildon ZK, Nepal N and Welte C (2021) Paleoseismological Findings at a New Trench Indicate the 1714 M8.1 Earthquake Ruptured the Main Frontal Thrust Over all the Bhutan Himalaya. Front. Earth Sci. 9:689457. doi: 10.3389/feart.2021.689457
Received: 31 March 2021; Accepted: 05 July 2021;
Published: 05 August 2021.
Edited by:
Alexander Cruden, Monash University, AustraliaReviewed by:
R. Jayangonda Perumal, Wadia Institute of Himalayan Geology, IndiaMark Quigley, The University of Melbourne, Australia
Copyright © 2021 Zhao, Grujic, Baruah, Drukpa, Elkadi, Hetényi, King, Mildon, Nepal and Welte. This is an open-access article distributed under the terms of the Creative Commons Attribution License (CC BY). The use, distribution or reproduction in other forums is permitted, provided the original author(s) and the copyright owner(s) are credited and that the original publication in this journal is cited, in accordance with accepted academic practice. No use, distribution or reproduction is permitted which does not comply with these terms.
*Correspondence: Djordje Grujic, ZGdydWppY0BkYWwuY2E=