 Francisco Javier Núñez-Cornú1*
 Diego Córdoba Barba2
 William Bandy3
 Juan José Dañobeitia4,5
 José Edgar Alarcón Salazar1
 Diana Núñez1
 Carlos Suárez Plascencia1
- 1C.A. Sismología y Volcanología de Occidente (SisVOc), CUC, CUCSH, Universidad de Guadalajara, Puerto Vallarta, Mexico
- 2Fac. CC. Físicas, Universidad Complutense de Madrid, Madrid, Spain
- 3Instituto de Geofísica, Universidad Nacional Autónoma de México, Mexico, Mexico
- 4EMSO ERIC, Rome, Italy
- 5Marine Technology Unit-CSIC, Barcelona, Spain
The geodynamic complexity in the western Mexican margin is controlled by the multiple interactions between the Rivera, Pacific, Cocos, and North American plates, as evidenced by a high seismicity rate, most of whose hypocenters are poorly located. To mitigate this uncertainty with the aim of improving these hypocentral locations, we undertook the TsuJal Project, a passive seafloor seismic project conducted from April to November 2016. In addition to the Jalisco Seismic Network, 10 LCHEAPO 2000 Ocean Bottom Seismometers (OBSs) were deployed by the BO El Puma in a seafloor array from the Islas Marías Archipelago (Nayarit) to the offshore contact between the states of Colima and Michoacan. We located 445 earthquakes in four or more OBSs within the deployed array. Most of these earthquakes occurred in the contact region of the Rivera, Pacific, and Cocos plates, and a first analysis suggests the existence of three seismogenic zones (West, Center, and East) along the Rivera Transform fault that can be correlated with its morphological expression throughout the three seismogenic zones. The seismicity estimates that the Moho discontinuity is located at 10 km depth and supports earlier works regarding the West zone earthquake distribution. Subcrustal seismicity in the Central zone suggests that the Intra-Transform Spreading Basin domain is an ultra-low spreading ridge. A seismic swarm occurred during May and June 2016 between the eastern tip of the Paleo-Rivera Transform fault and the northern tip of the East Pacific Rise-Pacific Cocos Segment, illuminating some unidentified tectonic feature.
Introduction
The Nayarit, Jalisco, and Colima coasts in the Pacific margin of Mexico are one of the most seismically active areas in North America, in which destructive earthquakes of great magnitude have occurred, generating small local tsunamis. There is also an important seismic gap (Vallarta Gap) on the northern coast of Jalisco (Figure 1). The TsuJal Project (Núñez-Cornú et al., 2016) had the objective of studying the seismic and tsunamigenic hazards associated with the interaction of the Rivera plate, Jalisco Block, and the North American plate. This project was conducted in two phases: 1) onshore and offshore active seismic experiments and geophysical surveys, and 2) passive observations of natural seismicity. The second phase sought to characterize the seismicity of the area between the Islas Marías, Bahía de Banderas, and along the Middle America Trench (MAT). We present here the first results for seismicity recorded during the second phase of the TsuJal Project.
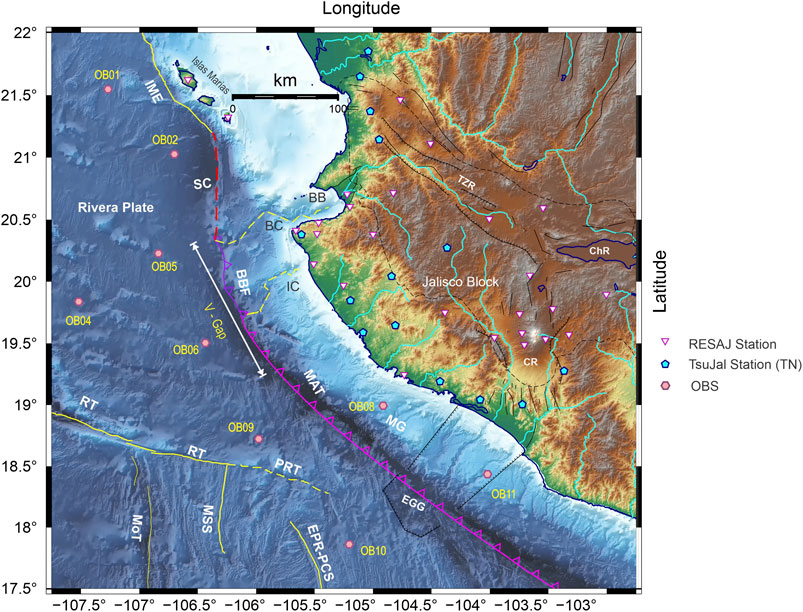
FIGURE 1. Tectonic frame of the Pacific Mexican region. Abbreviations: BB, Bahía de Banderas; BBF, Bahía de Banderas fore-arc block (purple line); BC, Banderas Canyon (yellow dashed line); ChR, Chapala Rift zone; CR, Colima rift zone; EGG, El Gordo Graben; EPR-PCS, East Pacific Rise Pacific-Cocos Segment (yellow line); IC, Ipala Canyon (yellow dashed line); IME, Islas Marias Escarpment (yellow light line); MAT, Middle America Trench (red line); MG, Manzanillo Graben; MoT, Moctezuma Trough; MSS, Moctezuma Spreading Segment; PRT, Paleo Rivera Transform fault (yellow dashed line) [after Pelaéz-Gaviria et al. (2013); Núñez-Cornú et al. (2018)]; RT, Rivera Transform (yellow line); SC, Sierra de Cleofas (pink dashed line); TZR, Tepic-Zacoalco Rift zone; V-Gap, Vallarta Seismic Gap. Seismic networks used in this study: white inverted triangles correspond to RESAJ permanent stations; Cyan pentagons denote TsuJal temporary seismic stations (TN) and pink hexagons are Ocean Bottom Seismometers (OBS).
In addition to the Jalisco Telemetric Seismic Network (RESAJ) (Núñez-Cornú et al., 2018), from April to November 2016, a temporary seismic network (TN) with 25 stations with sensor Le-3D MkIII was deployed from the northern part of the Nayarit to the south of Colima, including the Islas Marías Archipelago (from April 2016 to January 2017), providing a total of 50 seismic land stations. Offshore, a network of ten Ocean Bottom Seismometers (OBS) with four channels (3 short-period sensors and hydrophone) type LCHEAPO 2000 was deployed from the Islas Marías to offshore contact between Colima and Michoacan states. The OBSs were deployed and recovered by the research vessel BO El Puma (Universidad Nacional Autonoma de Mexico); nine of them worked well. Sensors recorded data from early April (Figure 1) through October 17. In this period, the USGS reported six earthquakes occurred in this region with magnitudes M > 5.0. Those were (1) May 7, 00:18 MW = 5.6; (2) May 7, 01:05, MW = 5.0; (3) June 1, 08:30, MW = 5.4; (4) Jun 2, 02:23, MW = 5.4; (5) June 7, 10:31, MW = 6.3; and (6) June 7, 10:51, MW = 5.5.
Previous seismicity studies in the East Pacific Rise and Rivera Fracture Zone using OBS were carried out between March and April 1974 using three OBS in small arrays (Prothero et al., 1976; Reid and Prothero, 1981). The areas studied were the Rivera Fracture zone, the junction of the ridge crest and the Rivera fracture zone, and the Rivera–Tamayo fracture zone.
Tectonic Setting
The North American (NOAM), Pacific, Cocos, and Rivera (RP) lithospheric plates interact in the western margin of Mexico (Figure 1), but the seismotectonic processes are still not fully understood. In this region, a tectonic unit exists, known as the Jalisco Block (JB) (DeMets and Stein, 1990; Michaud et al., 1990; Allan et al., 1991; DeMets and Wilson, 1997). The JB (Figure 1) is limited to the east by the Colima rift zone, which extends northward from the Pacific coast and connects at its northern end with two other major extensional structures: The Tepic-Zacoalco rift zone (trending roughly NW-SE), defined as the northern boundary of the JB, and the Chapala rift zone (trending roughly E-W). The connection between the north-western border of the JB and the continent is not well defined.
Recent studies (Dañobeitia et al., 2016; Núñez-Cornú et al., 2016; Madrigal et al., 2021) indicate that north of Islas Marías (from north to south: Maria Madre, Maria Magdalena, and Maria Cleofas), there is no evidence of an active subduction zone; instead, faulting at west flank of the Islas Marías is observed, while southwards between Maria Magdalena and Maria Cleofas islands the subducted slab of the RP is delineated by regional seismicity. These studies show the existence of a tectonic feature south of Maria Cleofas Island, the Sierra de Cleofas. This 100 km long structure is oriented N-S and marks the boundary of RP and JB, possibly arising from compression by RP against the JB. It establishes where the present-day subduction zone could begin and its presence is also supported by associated seismic activity. Núñez-Cornú et al. (2016) also suggest that Banderas Canyon may reflect the eastern extension, which seems to continue to the east through the Pitillal river’s valley. Continental stresses control the morphology of Banderas Canyon. Núñez-Cornú et al. (2016) show that the Bahía de Banderas area is undergoing strong crustal stress via the convergence of RP (Figure 1). Urías Espinosa et al. (2016) suggest that the existence of Ipala Canyon is related to the extension produced by the sharp change in the RP convergence, and Ipala Canyon may lie along the southeast boundary of a major forearc block (Figure 1), termed Banderas Forearc Block.
The atypical Rivera-Pacific-Cocos plate boundary is considered to be a transform fault with a complex stress pattern, which many authors have studied (e.g., Larson, 1972; Reid, 1976; Mammerickx, 1980; Bourgois and Michaud, 1991; Michaud et al., 1997; DeMets and Traylen, 2000; Michaud et al., 2000; Peláez-Gaviria et al., 2013). Initially, the Rivera Transform (RT) was proposed to consist of two domains (Larson, 1972; Reid, 1976; Mammerickx, 1980) divided at 107.5°W. The west domain of the RT is an NW-SW elongate basin containing an intra-transform spreading center, known as the Mid-Rivera Transform Discordance. The presence of an intra-transform spreading center at 108.25°W was first proposed based on local seismicity studies conducted in the 1970s (Prothero et al., 1976; Reid, 1976; Prothero and Reid, 1982). In contrast, within the east domain, the basin disappears and the transform fault was originally mapped as a series of discontinuous ridges. Bandy et al. (2011) proposed that the west domain of RT is divided into two very different domains. The first, named “Intra-Transform Spreading Basin,” is about 115 km long, extending from 107.30 to 108.42°W in the NW-SE direction. The second, named “Leaky Transform Basin,” is an NW-SE elongated structure, roughly 100 km long, extending from 108.42 to 109.21°W.
From bathymetry, Peláez-Gaviria et al. (2013) suggest that this region can be divided into several morphotectonic zones, some of which are described in previous studies. These include 1) zones related to the East Pacific Rise–Pacific Cocos Segment (EPR-PCS) propagation and Moctezuma Spreading Segment (Mammerickx, 1984; Bandy et al., 2008); 2) zones west of Moctezuma Trough (MoT) (Figure 1) that are the older crust created at the Mathematician Ridge through which the EPR propagated; 3) zones formed by the older crust at the Rivera Rise which is bent westward as it approaches the RT, due to shearing during the initial formation of the RT (Lonsdale, 1995); 4) zones related to the EPR-PCS propagation to the north of the Paleo Rivera Transform Fault (PRT), dated as 1.4 Ma; 5) the area of MAT, which could be subdivided into three domains; 6) zones located at NW of the El Gordo Graben, whose crust was formed at the EPR-PCS before 1.5 Ma; and 7) the Continental Shelf.
Data Processing and Seismic Analysis
During the study period, the Jalisco Telemetric Seismic Network (RESAJ) operated 20 seismic stations in the region, using the Antelope system to acquire, process and store data in real-time. This system also provided automatic preliminary locations, using the iasp91 P-wave velocity model, in real-time. Afterward, a seismologist reviewed P and S pickings. However, the depths of the earthquakes were deeper than expected because the iasp91 model is not suitable for this complex tectonic setting. The earthquakes were relocated using Hypo71 and a suitable velocity model; locations and readings (P and S) were integrated into a database.
Data recorded by the TN network were downloaded directly and included in the Antelope system monthly, integrating with those obtained from RESAJ network. At the end of the experiment, a database (Land) was generated with the records of both networks. The OBS data required a post-processing stage that took more time to be integrated into a database in the Antelope system. Our seismic databases (Land and OBS) include the seismicity from May 1 to October 17, 2016. For this first analysis, we follow the same methodology used by RESAJ in on-land recent studies (Gutiérrez et al., 2015; Tinoco Villa, 2015; Marín-Mesa et al., 2019) to establish a reference frame and compare the locations with and without OBS data, allowing us to improve the methodology to locate oceanic seismicity.
Earthquakes registered by the OBS array were identified using the Antelope system (Lindquist et al., 2007) through a short-term average/long-term average signal energy algorithm with a STA window of 1.0 s and LTA window of 60.0 s, with detections in at least four stations. Manual picking of P (vertical component) and S (horizontal components) wave arrivals was done. Some time readings from OBS (Figure 2) were arduous due to significant background noise. At some stations, the signals were masked by other oceanic signals; different passband filters to enhance the signal according to the station and the epicentral distance, main filters used were: (0.1, 1.0), (0.1, 5.0), (0.5, 3.0), (0.5, 10.0), (1.0, 5.0), (1.0, 10.0), (1.0, 15.0), (6.0, 8.0), (8.0, 10.0), (10.0, 12.0), (15.0, 30.0) Hz. Antelope automatically generates a hypocentral map; locations are estimated using the iasp91 P-wave velocity model these locations are shown in Supplementary Figure S0. Our initial analysis made it possible to locate 550 earthquakes using four or more OBS for the entire period. Some occurred outside of the study area, so location quality for those was poor and not considered.
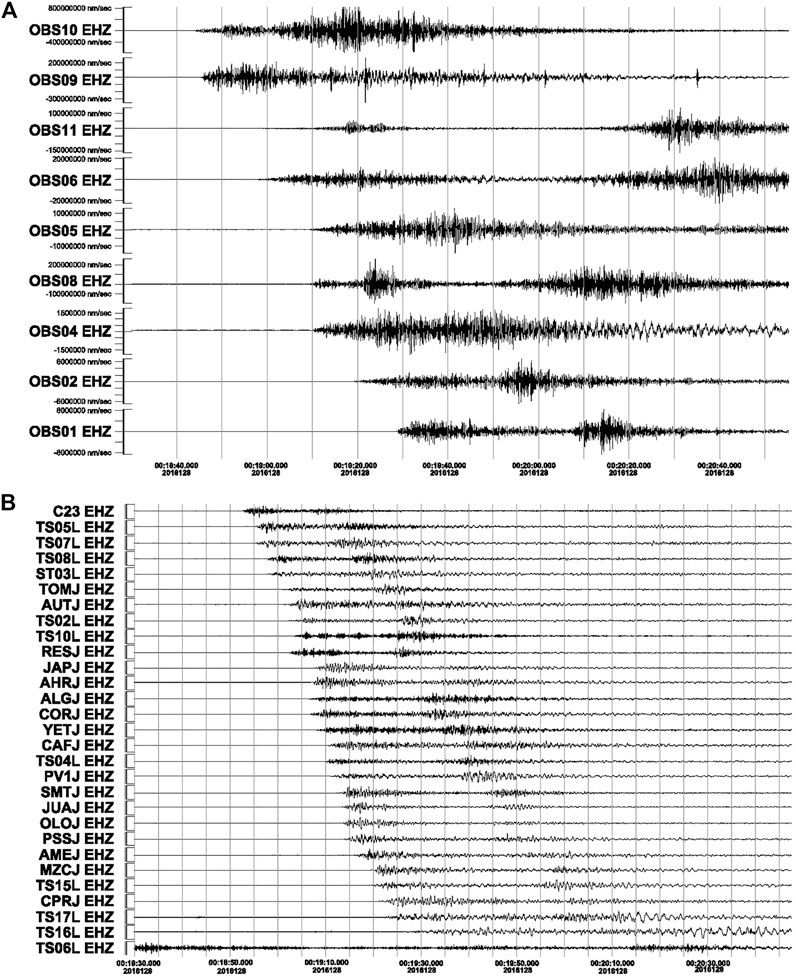
FIGURE 2. Seismic traces corresponding to May 7, 2016, earthquake at 00:18 recorded by (A) Ocean Bottom Seismometers (OBS) and (B) Temporary seismic (TN) and RESAJ networks. Stations ordered from nearest (OBS10) to the furthest (TS06L) to the earthquake.
The preliminary results using the Antelope OBS locations establish two main seismogenic areas. The first one corresponds to a longitudinal area where the seismicity is distributed along the RT, slightly shifted NW of the tectonic feature. In contrast, the second seismogenic region corresponds with an area between the eastern tip of the PRT and the northern tip of the EPR-PCS, defined as the Pacific-Cocos zone (PCZ), where epicenters are aligned in a SE–NW direction. Some events are observed on the west side and parallel to MAT. Scarce seismicity was identified in the Islas Marías area; those identified show hypocenter depths between 25 and 50 km or deeper. These values are questionable for the oceanic crust, and therefore the mismatch in the depths may be due to the P-wave velocity model (iasp91) used by Antelope, combined with the network distribution. We decided not to use Antelope locations for the analysis.
To analyze the quality of the earthquake locations, we studied the seismic sequence that occurred between May 7 and May 10 in the PCZ using both databases (Land and OBS). This seismic sequence is in an area in the vicinity of four OBSs. On May 7, at 00:18, an earthquake Mw = 5.5 occurred, followed by a second earthquake Mw = 5.2 occurred at 01:06. We located this swarm using Land database as routinely RESAJ does with Hypo 71, using the P-wave velocity model VJB01 (Figure 4A) (Núñez-Cornú et al., 2002) and comparing with OBS Antelope locations (Figure 3A). For this seismic swarm, 86 earthquakes were located. Different hypocentral determinations were observed; Antelope epicentral location depths are still greater than 20 km Hypo71 location depths agree with characteristic values of an oceanic crust, but the epicentral area is 50 km in NE away from Antelope epicentral area (Figures 3B,C).
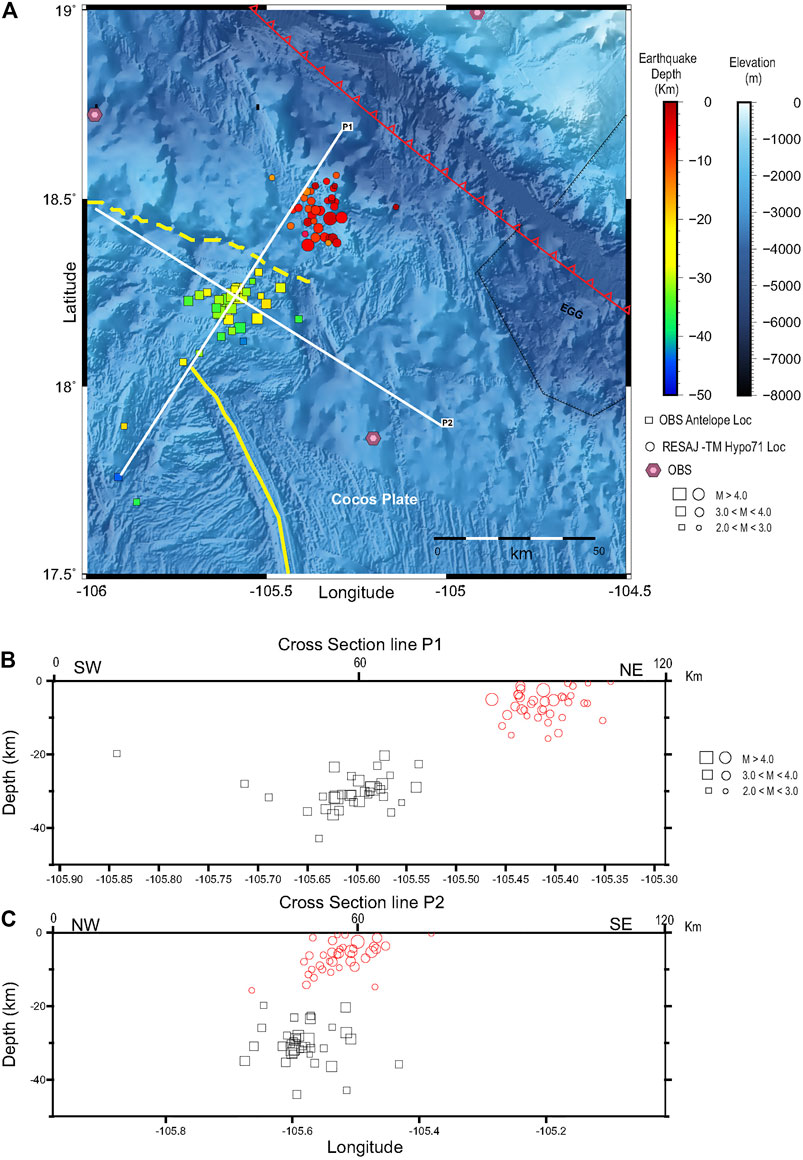
FIGURE 3. Locations of the seismic sequence occurred on May 7–10, 2016 (86 earthquakes) with Antelope and Hypo-71. (A) Epicentral map (fill color proportional to depth), where square symbols denote earthquakes located with OBS data located using Antelope system and velocity model iasp91. In contrast, circles represent the RESAJ and TN data locations using Hypo-71 and P-wave velocity model VJB01 (Núñez-Cornú et al., 2002). (B) Cross-section along line P1. (C) Cross-section along P2 line. Pink hexagons depict OBS locations.
To improve OBS locations, we adjust a 1D P-wave velocity model using the Rivera crustal velocity models proposed by Núñez-Cornú et al. (2016), Dañobeitia et al. (2016), and Núñez et al. (2019) to relocate through Hypo71. As a test group, we selected 30 earthquakes recorded by most of the OBSs (at least eight OBS with clear P and S waves) to adjust the SVRV01 model (Figure 4A) for which P and S residuals were minimum. To obtain the best solutions using Hypo71, eight different starting depths were used as the initial solution. The 86 earthquakes of this period were relocated using Hypo71 and SVR01 P-wave velocity model (Figures 5A–C), yielding a Root Mean Square (RMS) error with a mean value of 0.31 s. The standard mean error of the epicenter (ERH) and the standard mean value error of the focal depth (ERZ) present values of 2.8 and 2.6 km, respectively. The local magnitude (Lay and Wallace, 1995) relation was used in this study.
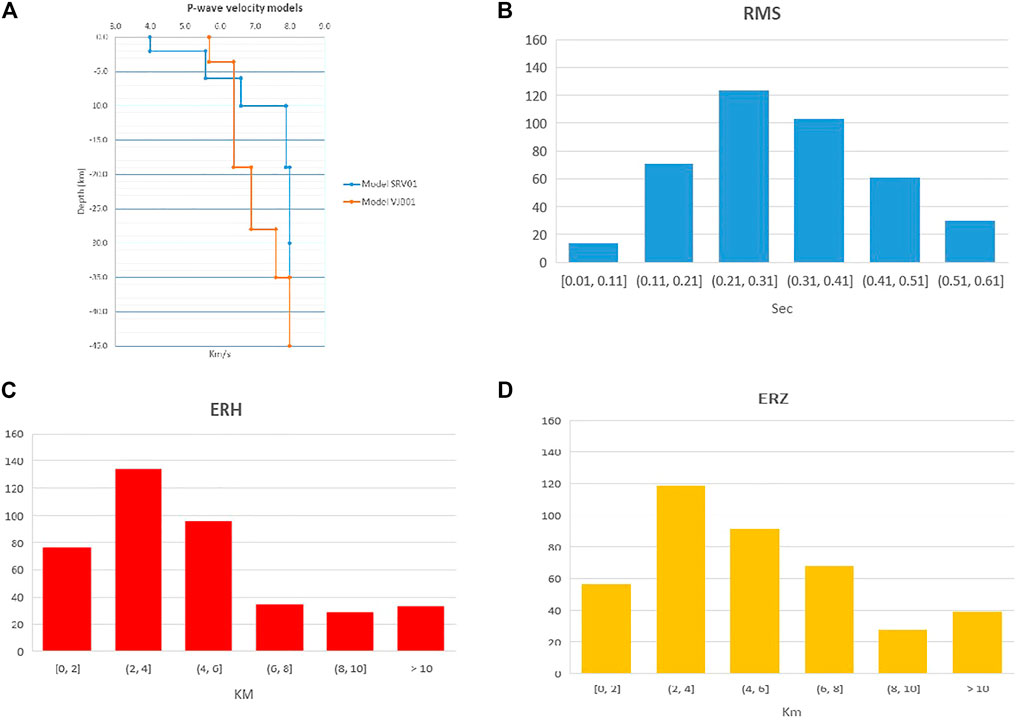
FIGURE 4. (A) Comparison between P-wave velocity models VJB01 and SVRV01. Model relocation errors for OBS data using Hypo71 with SVR01 velocity model: (B) RMS; (C) ERH; (D) ERZ.
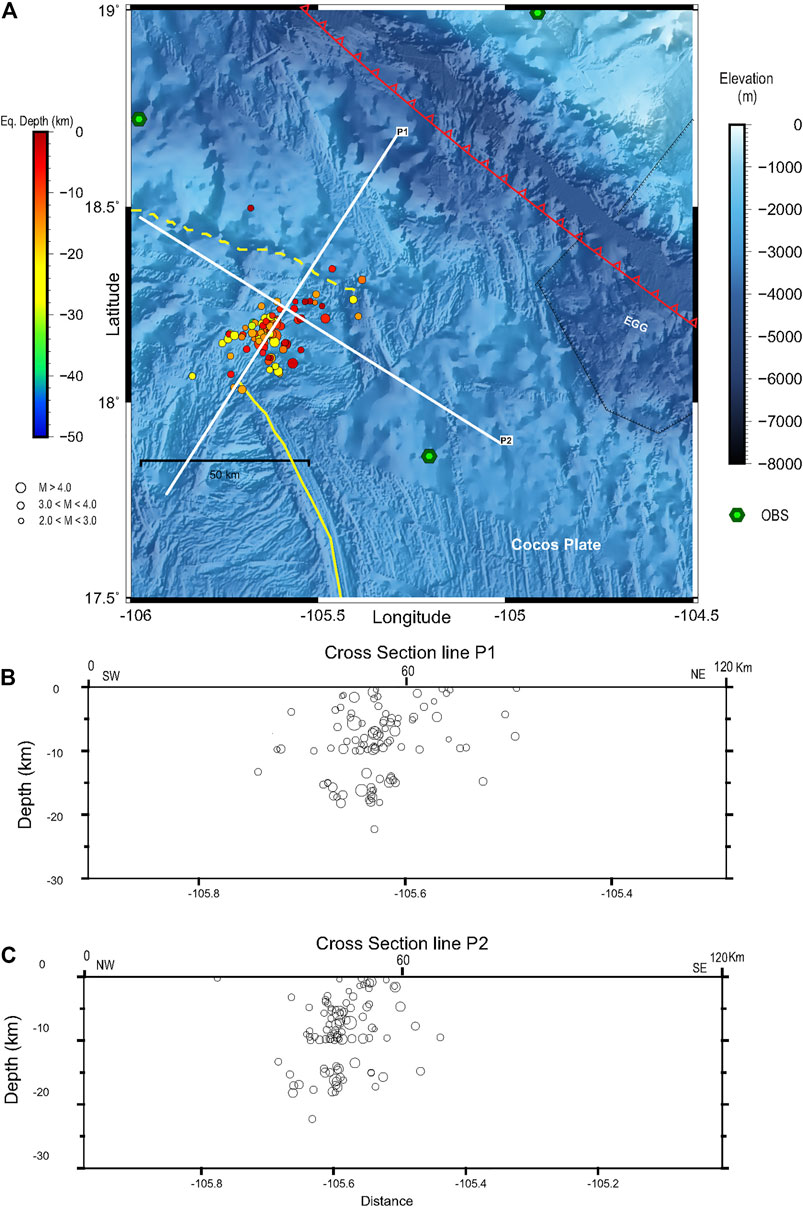
FIGURE 5. (A) Epicentral map showing the May 7–10, 2016 swarm (86 earthquakes) located with Hypo-71 using OBS data and P-wave velocity model SVR01. The white lines are the projection of seismicity throughout P1 and P2 transects with a width of 20 km; (B) Cross-section along P1 line; (C) Cross-section along P2 line. Abbreviations as for Figure 1.
Localization tests were made with Hypo71 joining both databases (OBS and Land) and using both velocity models. The results were unsatisfactory, the solutions did not always converge, and the residuals were very high. To evaluate the use of Land data at this stage of the process, we used as master events this earthquake swarm (86 Eq.) located with OBS data using Hypo71 and SVR01 velocity model, eliminating solution weight for the Land stations. In this case, we observed that the stations in the range of 140–240 km from the epicentral zone had residuals of the P wave arrival times less than −1.0 s; distances greater than 330 km yielded residuals greater than 1.0 s (Figure 6). These differences result from the seismic wave pathways that traverse strong lateral velocity variations in the continental crust. This indicates that additional corrections should be applied for each seismogenic area to use on-land data. In the case of OB08 and OB11, located on the North American plate near the trench, the average residuals of the P-wave are −0.51 and −0.32 s, respectively, indicating that structure imposes a little significant effect on these OBSs (Figure 6).
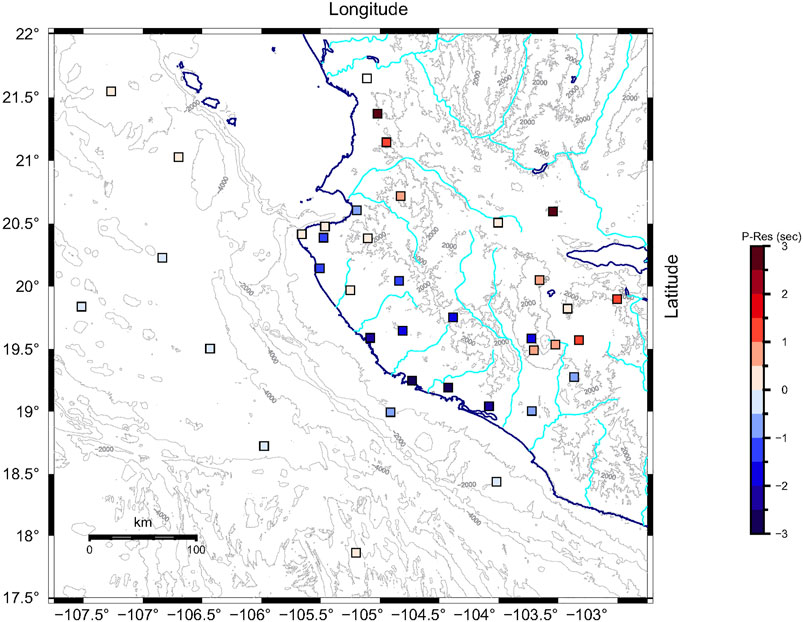
FIGURE 6. P-wave residuals for the OBS, RESAJ, and TN stations from Hypo71 locations using OBS data and model SVR01.
The OBS dataset was relocated using Hypo71 and model SVR01, obtaining a total of 445 relocated earthquakes (Figure 7). The event distribution is similar to that obtained with Antelope, but epicenters now correlate more closely with known tectonic features. Not all the seismogenic areas have the same station coverage, so each will exhibit its uncertainty challenges and should be processed separately. However, this study processed all similarly, and the RMS, ERH, and ERZ errors for the region were within our chosen tolerances (Figures 4B–D). Figure 8 shows the cross-sections at RT and PCZ, where important changes are observed in in-depth distribution for both areas. Most hypocenters were located between 0 and 10 km depth, agreeing with depths expected within the oceanic crust. Nevertheless, a second group is observed at depths between 15 and 25 km, suggesting activity in the lithospheric mantle.
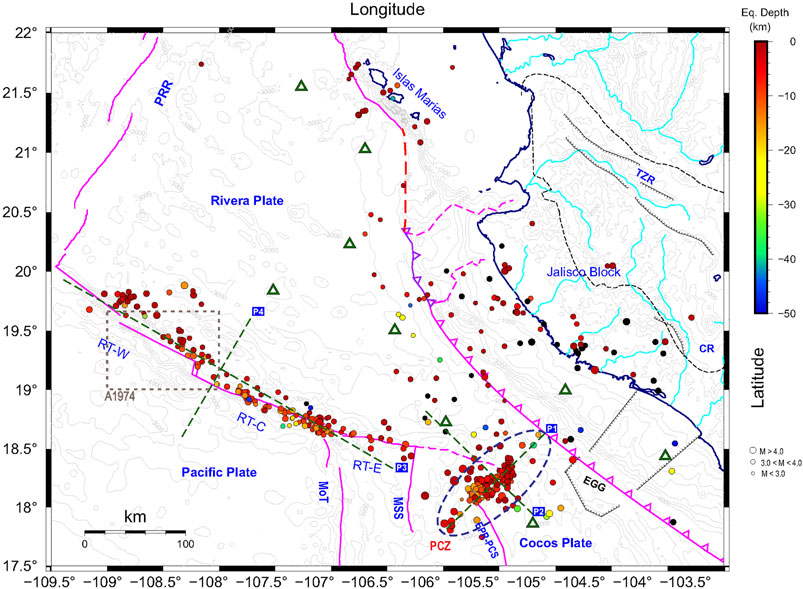
FIGURE 7. Hypocentral map of the seismicity recorded from May 1 to October 17, 2016, using OBS (green triangles) database and relocated with Hypo-71 and SVR01 P-wave velocity model. The A1974 gray rectangle denotes the position of the study area (a) reported for Prothero and Reid (1982). The blue dashed ellipse shows the Pacific-Cocos zone (PCZ). Green dashed lines correspond to the projection of seismicity along P1, P2, P3, and P4 lines (see Figure 8). Abbreviations as for Figure 1. RT-W, RT-C, and RT-E represent the three active segments of Rivera Transform from west to east. PRR, Pacific-Rivera rise. exhibits three active segments, or seismogenic zones, from east to west.
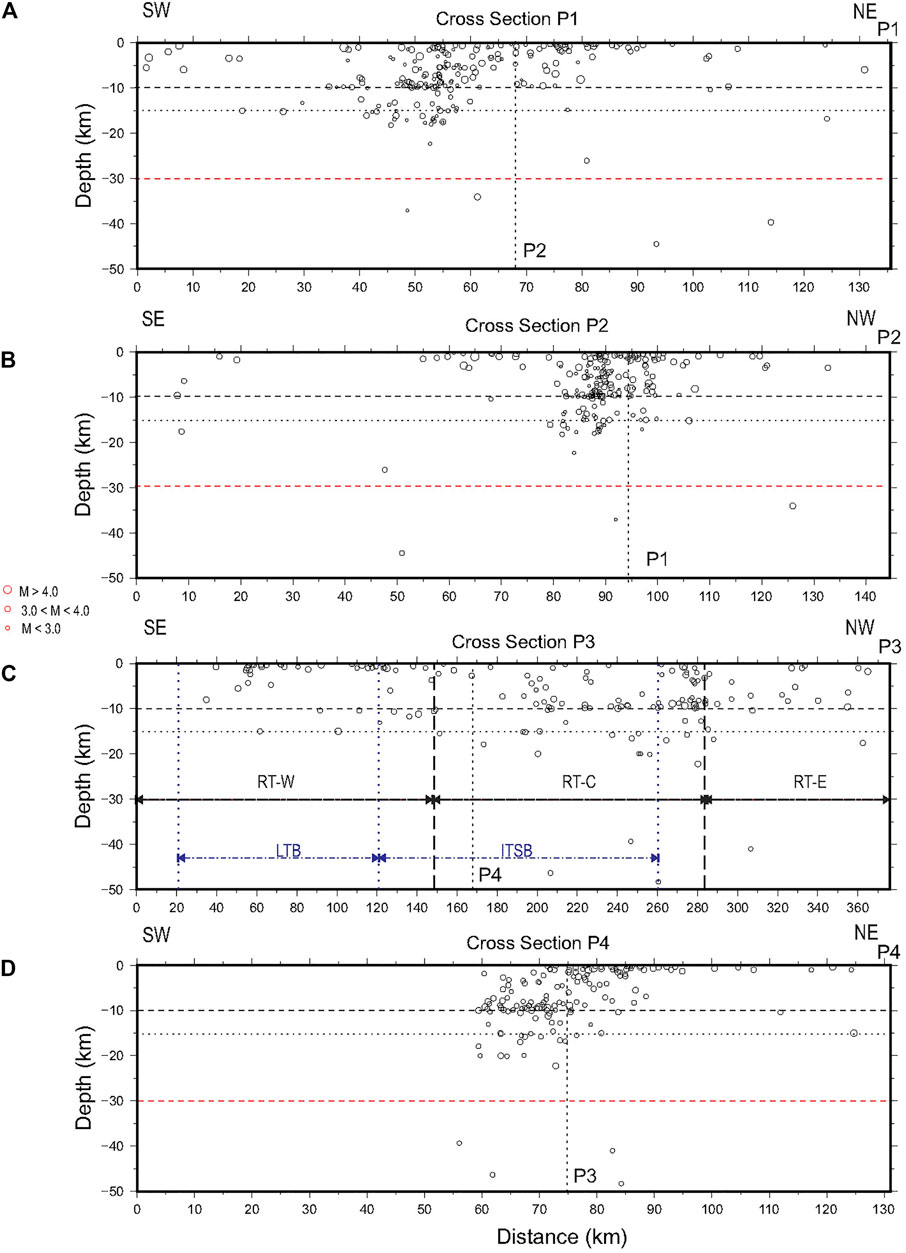
FIGURE 8. Seismicity projections along P1, P2, P3, and P4 transects, whose locations are shown in Figure 7. (A) Hypocentral cross-section along line P1; (B) Hypocentral cross-section along line P2; (C) Hypocentral cross-section along line P3, ITSB: Intra-Transform Spreading Basin. LTB: Leaky Transform Basin (Bandy et al., 2011); (D) Hypocentral cross-section along line P4. Dashed horizontal lines at 10, 15, and 30 km used as reference.
Results and Discussion
More than 400 earthquakes were located in the study region from May 1 to October 17, 2016. The seismic data obtained with the nine OBS temporary array will provide new and valuable information on the tectonics of the Rivera plate and its interaction with the Jalisco block, Pacific and Cocos plates. Our work analyzed regions exhibiting the most seismic activity during the study period, corresponding to the Rivera Transform (RT) and the Pacific-Cocos zone (PCZ).
Despite the tectonic complexity of our study region, it is possible to deem the Rivera plate as a quasi-homogeneous structure. Considering that all the stations, except OB08 and OB11, were in the interior of this plate and seismicity is also located within it or at its edges, we use the SVR01 P-wave velocity model for event location at this processing and analysis stage.
The temporary network array design sought to record seismicity along the Islas Marías Archipelago, Bahía de Banderas, and the Middle America Trench, but events were scarce in those regions. The seismicity recorded in RT is mainly outside the network, resulting in a wide azimuthal station gap, so we must consider a thorough investigation to understand better the different seismogenic zones identified. The distribution of stations is oblique to the RT; however, it intersects this structure, providing reasonable control of earthquake locations along the tectonic edge. Also, S-wave readings for those events help constrain the depths, and their location uncertainty is reduced by the position of OB04 (Figure 1).
The relocation of the May swarm (Figures 3, 5) indicates that estimated locations of Rivera plate seismicity using on-land stations are shifted ∼50 km to the northwest. In Figure 9, we compare the locations of the six earthquakes reported by the USGS for this period with the OBS data locations. These events are also shifted between 30 and 50 km in the northwest direction, except for the earthquake (3), which is 50 km to the southeast.
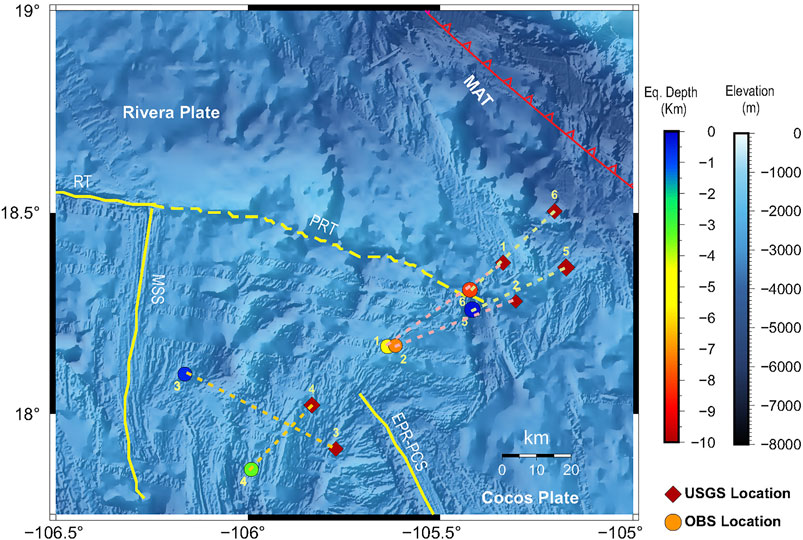
FIGURE 9. Comparison between earthquake locations reported by the USGS and those obtained with the OBS network for our study period. (1) May 7, 00:18 MW = 5.6; (2) May 7, 01:05, MW = 5.0; (3) June 1, 08:30, MW = 5.4; (4) Jun 2, 02:23, MW = 5.4; (5) June 7, 10:31, MW = 6.3; and (6) June 7, 10:51, MW = 5.5.
We can observe some general features from this location study (Figure 7). The RT exhibits three active segments, or seismogenic zones, from east to west 1) the RT-E between the Moctezuma Spreading Segment and Moctezuma Trough; 2) The RT-C from Moctezuma Trough to −108.25°; and 3) The RT-W from −108.25 to −109.10°. The most active area is the intersection of Moctezuma Trough with RT. Another seismogenic zone is the PCZ, where the epicentral distribution is more compact and aligned to the SE-NW. Seismicity parallel and west of MAT is also observed. Near the Islas Marías, two alignments perpendicular to Islas Marías Escarpment, NW, and SE of Maria Madre Island are identified.
Hypocentral depths (Figure 8) range primarily from 0 to 10 km depth, suggesting crustal thickness of 10 km in both areas, PCZ and RT. An additional hypocentral distribution between 14 and 18 km is observed in PCZ (Figures 8A,B). The three sections along the RT (RT-W, RT-C, RT-E) are distinct (Figure 8C). At the RT-E section (Figure 8C), most depths range from 0 to 10 km. In the RT-C section, most of the events are located shallower than 10 km, but hypocenters greater than 15 km depth are observed. In the RT-W section, we observe very shallow seismicity. Figure 8D shows the subcrustal seismicity is SW of the RT, and the shallow seismicity is NE of the RT (see P3 mark as reference).
The seismogenic zones identified in this study correspond to three different domains that divide RT, determined from morphological studies (Bandy et al., 2011). From west to east are: the “Leaky Transform Basin” domain, the “Intra-Transform Spreading Basin” domain, and the East Domain (Figure 8), which correspond to RT-W, RT-C, and RT-E, respectively. Our observations suggest that the “Intra-Transform Spreading Basin” is an ultra-low spreading ridge, similar to an analogous feature exhibiting subcrustal seismicity as reported by Jokat et al. (2012) and Schlindwein and Schmid (2016).
Prothero et al. (1976) reported that all reliable earthquakes in this area were shallower than 10 km below the seafloor, suggesting 10 km as a lower limit for the brittle zone thickness in this region. Our results agree with this value. Earthquake locations obtained in 1974 in the Rivera transform [zone (a)] were reported by Prothero and Reid (1982) (Figure 5), which are consistent with our results in the RT-W region (Figure 7, square A1974).
A monthly analysis allows us to study the seismicity that occurred in the region in more detail, identifying temporal patterns, swarms, mainshock-aftershock sequences, and possible migration activity. In May (Supplementary Figure S1), the most active area was the PCZ, where the May 5–7 mainshock-aftershock sequence with an alignment SW-NE was observed; this is also observed in Supplementary Figures S2A,B. The first earthquake 1) MW = 5.6 was located 7.5 km deep, and the 2) MW = 5.2 at 2.4 km. Along the RT, the most active area was the intersection of RT with Moctezuma Trough, which marks the limit between RT-E and RT-C; perpendicular alignments were also observed to Islas Marías Escarpment at María Madre Island.
On June 1 (Supplementary Figures S3, S4), a MW = 5.4 earthquake 3) occurred at 0830 GMT, located at a depth of 1 km between the PCZ and the Moctezuma Spreading Segment. This event was followed by another earthquake 4) MW = 5.8, which took place on June 2 at 0223 GMT and located SW of the May alignment, on the edge of the PCZ at 3.3 km depth. A new seismic sequence began on June 7 inside of the PCZ at the eastern tip of Paleo-Rivera Transform, with an earthquake 5) MW = 6.3 occurred at 1051 GMT located 1 km deep, followed by another earthquake 6) at 1058 GMT in the same area, with a magnitude MW = 5.5 and hypocenter depth of 8.1 km. The sequence consisted of 28 earthquakes for the period June 7–22 along a NS alignment. Moreover, we observed that seismicity is shallow along the RT-W area; meanwhile, at RT-C, it is deeper.
The seismicity observed in July is minimum in both areas (Supplementary Figures S5, S6). In August, the most active area is the intersection between RT and Moctezuma Trough (Supplementary Figures S7, S8); again, there is shallow seismicity at the RT-W area; meanwhile, the seismicity is deeper at RT-C and SE of RT. No seismicity was located at the PCZ in September (Supplementary Figures S9, S10). The most active area is the western tip of the RT-W, showing the same pattern of shallow seismicity at the RT-W and deeper seismicity at RT-C. The seismicity for October 1–17 periods is shown in Supplementary Figures S11, S12, where the most active area is located at the intersection of RT-C with Moctezuma Trough, which marks the border of RT-C with RT-E.
Conclusion
The data analysis recorded during the TsuJal Project represents the first inspection at an onshore-offshore data acquisition and investigation in the region. Our catalog and waveform database will provide the opportunity to advance our knowledge moving forward significantly. This study supports previous findings of a 10 km deep Moho and confirms previously observed seismic patterns at the RT-E zone (Prothero et al., 1976; Prothero and Reid, 1982). Subcrustal seismicity seen at the RT-C zone suggests that the “Intra-Transform Spreading Basin” domain is an ultra-low spreading ridge. Seismic swarms occurred between May and June 2016 at the Pacific-Cocos zone, a previously unidentified tectonic feature. Temporal analysis of the seismicity for this period indicates that most of the seismicity in the region occurred by seismic swarms, as reported by other authors (Prothero et al., 1976; Tinoco Villa, 2015). We observed two mainshock-aftershocks sequences and aisled earthquakes MW > 5.0. Locations from internationals and regional seismic networks are between 30 and 50 km shifted from OBS locations. Therefore, they cannot be used to characterize tectonic structures with a size smaller than 100 km.
Due to the tectonic complexity of the region, a more extensive and detailed study would be warranted. This study will improve the earthquake locations using more advanced methods, including 3D processes, and add land and island stations with appropriate station corrections and velocity models. The use of waveform analysis techniques (cross-correlations) will also improve and expand the catalog. Focal mechanism calculations will allow understanding the tectonic complexity of each identified seismogenic areas.
The study highlights the critical need for permanent OBS networks to monitor oceanic seismogenic regions adequately; this is particularly important in areas hosting potentially hazardous seismic activity, where significant crustal variability degrades confidence in seismic observations using land-based stations alone.
Data Availability Statement
All geophysical data collected by OBS, TN and RESAJ are in a database at the Research Group CA-UDG-276 SisVOc. The data may be available for collaborative research projects between CA-SisVOc and other interested institutions by specific agreements. For more information, please contact the corresponding author.
Author Contributions
FN-C: Conceptualization, methodology, investigation, conclusion, and original draft preparation. DC: Conceptualization, methodology, investigation. WB: Investigation, formal analysis, writing - original draft. JD: Conceptualization, methodology, investigation. EA: Software, Data processing. DN: Investigation, formal analysis, writing original draft, conclusion. CS: Investigation, formal analysis.
Funding
This research was funded by: CONACYT–FOMIXJAL 2008–96567 (2009); CONACYT–FOMIXJAL 2008–96539 (2009); CONACYT–FOMIXJAL 2010–149245 (2011); CONACyT-FOMIXJal (2012-08-189963) (MEXICO); CGL (2011-29474-C02-01) DGI Plan Nacional I + D + i (España). NOC Cruise JC098, RRS James Cook UK; B.O El Puma Campaigns, CABO-CIC-UNAM: JGAP2012, JGAP2013 Leg1 and Leg2; JGAP2016 Legs 1 and 2 Cruises.
Conflict of Interest
The authors declare that the research was conducted in the absence of any commercial or financial relationships that could be construed as a potential conflict of interest.
Publisher’s Note
All claims expressed in this article are solely those of the authors and do not necessarily represent those of their affiliated organizations, or those of the publisher, the editors and the reviewers. Any product that may be evaluated in this article, or claim that may be made by its manufacturer, is not guaranteed or endorsed by the publisher.
Acknowledgments
The authors gratefully acknowledge Charlotte Rowe for her valuable suggestions, including the English grammar revision that notably improved this article and Claudia B. M. Quinteros Cartaya for her help with the Generic Mapping Tools figures. The authors thank Dr. Carlos Mortera, Cruise Chief, the Captain, and the crew of the B.O. El Puma (UNAM) for the support and facilities granted. Our special thanks to Francisco Ponce Núñez for technical support onboard B.O. El Puma. We gratefully appreciate the efforts to secure the ship-time to Dr. Arturo Iglesias Mendoza and Dr. William Lee Alardin for granting ship-time for JGAP2016-LEG2. Some figures were generated using the Generic Mapping Tools (GMT-6; Wessel et al., 2019).
Supplementary Material
The Supplementary Material for this article can be found online at: https://www.frontiersin.org/articles/10.3389/feart.2021.738515/full#supplementary-material
References
Allan, J. F., Nelson, S. A., Luhr, J. F., Carmichael, I. S. E., Wopat, M., and Wallace, P. J. (1991). Pliocene-recent Rifting in SW México and Associated Volcanism: An Exotic Terrane in the Making, 47. Memoir: American Association of Petroleum Geologists, 425–445.
Bandy, W. L., Michaud, F., Mortera Gutiérrez, C. A., Dyment, J., Bourgois, J., Royer, J.-Y., et al. (2011). The Mid-rivera-transform Discordance: Morphology and Tectonic Development. Pure Appl. Geophys. 168, 1391–1413. doi:10.1007/s00024-010-0208-8
Bandy, W. L., Michaud, F., Dyment, F., Mortera-Gutiérrez, C. A., Bourgois, J., Calmus, T., et al. (2008). Multibeam Bathymetry and Sidescan Imaging of the Rivera Transform-Moctezuma Spreading Segment Junction, Northern East Pacific Rise: New Constraints on Rivera-Pacific Relative Plate Motion. Tectonophysics 454 (1-4), 70–85. doi:10.1016/j.tecto.2008.04.013
Bourgois, J., and Michaud, F. (1991). Active Fragmentation of the North America Plate at the Mexican Triple Junction Area off Manzanillo. Geo-Marine Lett. 11, 59–65. doi:10.1007/bf02431030
Dañobeitia, J., Bartolomé, R., Prada, M., Nuñez-Cornú, F., Córdoba, D., Bandy, W. L., et al. (2016). Crustal Architecture at the Collision Zone between Rivera and North American Plates at the Jalisco Block: Tsujal Project. Pure Appl. Geophys. 173 (10–11), 3553–3573. doi:10.1007/s00024-016-1388-7
DeMets, C., and Stein, S. (1990). Present-day Kinematics of the Rivera Plate and Implications for Tectonics in Southwestern Mexico. J. Geophys. Res. 95 (B1321), 21931. doi:10.1029/JB095iB13p21931
DeMets, C., and Traylen, S. (2000). Motion of the Rivera Plate since 10 Ma Relative to the Pacific and North American Plates and the Mantle. Tectonophysics 318, 119–159. doi:10.1016/s0040-1951(99)00309-1
DeMets, C., and Wilson, D. S. (1997). Relative Motions of the Pacific, Rivera, North American, and Cocos Plates since 0.78 Ma. J. Geophys. Res. 102, 2789–2806. doi:10.1029/96jb03170
Gutiérrez, Q. J., Escudero, C., and Núñez-Cornú, F. J. (2015). Geometry of the Rivera-Cocos Subduction Zone Inferred From Local Seismicity. Bull. Seismol. Soc. Am. 6, 3104–3133. doi:10.1785/0120140358
Jokat, W. J., Kollofrath, W. H., Geissler, , and Jensen, L. (2012). Crustal Thickness and Earthquake Distribution South of the Logachev Seamount, Knipovich Ridge. Geophys. Res. Lett. 39, 1–6. doi:10.1029/2012GL051199
Larson, R. L. (1972). Bathymetry, Magnetic Anomalies, and Plate Tectonic History of the Mouth of the Gulf of California. Geol. Soc. America Bull. 83, 3345–3360. doi:10.1130/0016-7606(1972)83[3345:bmaapt]2.0.co;2
Lindquist, K. G., Newman, R. L., and Vernon, F. L. (2007). The antelope Interface to PHP and Applications: Web-Based Real-Time Monitoring. Seismological Res. Lett. 78 (6), 663–670. doi:10.17885/gssrl.78.6.66310.1785/gssrl.78.6.663
Lonsdale, P. (1995). Segmentation and Disruption of the East Pacific Rise in the Mouth of the Gulf of California. Mar. Geophys. Res. 17, 323–359. doi:10.1007/bf01227039
Marín-Mesa, T., Núñez-Cornú, F. J., and Suárez-Plascencia, (2019). Analysis of the seismicity in the Jalisco Block from June to December 2015. Seism. Res. Lett. 90 (5), 1767–1778. doi:10.1785/0220190107
Madrigal, L. A., Núñez, D., Escalona-Alcázar, F. d. J., and Núñez-Cornú, F. J. (2021). Crustal Structure across the Northern Region of the Islas Marías Archipelago. Front. Earth Sci. 9, 1–12. doi:10.3389/feart.2021.682206
Mammerickx, J. (1980). Neogene Reorganization of Spreading between the Tamayo and the Rivera Fracture Zone. Mar. Geophys. Res. 4, 305–318. doi:10.1007/bf00369105
Mammerickx, J. (1984). The Morphology of Propagating Spreading Centers: New and Old. J. Geophys. Res. 89, 1817–1828. doi:10.1029/jb089ib03p01817
Michaud, F., Bourgois, J., and Aubin, J. (19901990). “Active Fragmentation of the West Pacific Coast: The Jalisco Block a Future Unexpected Terrain,” in Tectonics of Circum-Pacific Continental Margins. Editors J. Aubin, and J. Bourgois (Netherlands: VSP-BV), 51–76.
Michaud, F., Dañobeitia, J. J., Carbonell, R., Bartolomé, R., Córdoba, D., Delgado, L., et al. (2000). New Insights into the Subducting Oceanic Crust in the Middle American Trench off Western Mexico (17-19°N). Tectonophysics 318, 187–200. doi:10.1016/s0040-1951(99)00311-x
Michaud, F., Royer, J.-y., Bourgois, J., de Lepinay, B. M., and Liaudon, G. P. (1997). The Rivera Fracture Zone Revisited. Mar. Geology. 137, 207–225. doi:10.1016/s0025-3227(96)00103-x
Núñez, D., Núñez‐Cornú, F. J., Escalona‐Alcázar, F. d. J., Córdoba, D., López Ortiz, J. Y., Carrillo de la Cruz, J. L., et al. (2019). Seismic Structure of the Southern Rivera Plate and Jalisco Block Subduction Zone. Seismol. Res. Lett. 90-5, 1756–1766. doi:10.1785/0220180399
Núñez‐Cornú, F. J., Córdoba, D., Dañobeitia, J. J., Bandy, W. L., Figueroa, M. O., Bartolome, R., et al. (2016). Geophysical Studies across Rivera Plate and Jalisco Block, Mexico: TsuJal Project. Seismological Res. Lett. 87, 59–72. doi:10.1785/0220150144
Núñez-Cornú, F. J., Rutz-López, M., Nava, F. A., Reyes-Dávila, G., and Suárez-Plascencia, C. (2002). Characteristics of Seismicity in the Coast and north of Jalisco Block, Mexico. Phys. Earth Plan. Ints. 132 (1–3), 141–155. doi:10.1016/S0031-9201(02)00049-3
Núñez-Cornú, F. J., Sandoval, J. M., Alarcón, E., Gómez, A., Suárez-Plascencia, C., Núñez, D., et al. (2018). The Jalisco Seismic Accelerometric Telemetric Network (RESAJ). Seismol. Res. Lett. 89 (2A), 363–372. doi:10.1785/0220170157
Peláez Gaviria, J. R., Mortera Gutiérrez, C. A., Bandy, W. L., and Michaud, F. (2013). Morphology and Magnetic Survey of the Rivera-Cocos Plate Boundary of Colima, Mexico. Geofísica Internacional 52, 73–85. doi:10.1016/s0016-7169(13)71463-6
Prothero, W. A., and Reid, I. D. (1982). Microearthquakes on the East Pacific Rise at 21°N and the Rivera Fracture Zone. J. Geophys. Res. 87, 8509–8518. doi:10.1029/jb087ib10p08509
Prothero, W. A., Reid, I., Reichle, M. S. J. N., and Brune, J. N. (1976). Ocean Bottom Seismic Measurements on the East Pacific Rise and Rivera Fracture Zone. Nature 262, 121–124. doi:10.1038/262121a0
Reid, I., and Prothero, W. A. (1981). An Earthquake Sequence Studied with Ocean-Bottom Seismographs. Geophys. J. Int. 64, 381–391. doi:10.1111/j.1365-246x.1981.tb02673.x
Reid, I. (1976). The Rivera Plate: A Study in Seismology and Plate Tectonics. Ph.D. Thesis. La Jolla: University of California at San Diego, 280.
Schlindwein, V., and Schmid, F. (2016). Mid-ocean-ridge Seismicity Reveals Extreme Types of Ocean Lithosphere. Nature 535, 276–279. doi:10.1038/nature18277
Tinoco Villa, M. (2015). Detección y Análisis de Enjambres Sísmicos en la Corteza Oceánica al Sur de las Islas Marías. M.Sc. Thesis, Posgrado en Geofisica. Puerto Vallarta, Mexico: Universidad de Guadalajara, 67.
Urías Espinosa, J., Bandy, W. L., Mortera Gutiérrez, C. A., Núñez Cornú, F. J. J., and Mitchell, N. C. (2016). Multibeam Bathymetric Survey of the Ipala Submarine Canyon, Jalisco, Mexico (20°N): The Southern Boundary of the Banderas Forearc Block. Tectonophysics 671, 249–263. (ISSN 0040-1951). doi:10.1016/j.tecto.2015.12.029
Keywords: OBS, Rivera transform, Rivera plate, Cocos plate, Jalisco block, amphibious seismic network
Citation: Núñez-Cornú FJ, Córdoba Barba D, Bandy W, Dañobeitia JJ, Alarcón Salazar JE, Núñez D and Suárez Plascencia C (2021) The TsuJal Amphibious Seismic Network: A Passive-Source Seismic Experiment in Western Mexico. Front. Earth Sci. 9:738515. doi: 10.3389/feart.2021.738515
Received: 08 July 2021; Accepted: 14 October 2021;
Published: 02 November 2021.
Edited by:
Nibir Mandal, Jadavpur University, IndiaReviewed by:
Shyam Rai, Indian Institute of Science Education and Research, Pune, IndiaHelen Anne Janiszewski, University of Hawaii at Manoa, United States
Copyright © 2021 Núñez-Cornú, Córdoba Barba, Bandy, Dañobeitia, Alarcón Salazar, Núñez and Suárez Plascencia. This is an open-access article distributed under the terms of the Creative Commons Attribution License (CC BY). The use, distribution or reproduction in other forums is permitted, provided the original author(s) and the copyright owner(s) are credited and that the original publication in this journal is cited, in accordance with accepted academic practice. No use, distribution or reproduction is permitted which does not comply with these terms.
*Correspondence: Francisco Javier Núñez-Cornú, cGFjb3JudTc3QGdtYWlsLmNvbQ==