 G. V. Melián1,2*
 T. Toulkeridis3
 N. M. Pérez1,2
 P. A. Hernández1,2
 L. Somoza4E. Padrón1,2C. Amonte1,2M. Alonso1,2M. Asensio-Ramos1M. Cordero1
- 1Instituto Volcanológico de Canarias (INVOLCAN), Santa Cruz de Tenerife, Spain
- 2Instituto Tecnológico y de Energías Renovables (ITER), Granadilla de Abona, Spain
- 3Universidad de las Fuerzas Armadas ESPE, Sangolquí, Ecuador
- 4Marine Geological Resources Division, Geological Survey of Spain (IGME), Madrid, Spain
There are hundreds of volcanic lakes around the world that represent an important hazard due to the potential occurrence of phreatomagmatic or limnic eruptions. Variations in geochemical and geophysical parameters could help to identify potential risks for these events. Cuicocha and Quilota volcanic lakes, located at the North Andean Volcanic Zone of Ecuador, are geologically young, with gas emissions manifested mainly as CO2 via bubbling gases. Both lakes present a limited monitoring record. Therefore, volcanic monitoring is a priority task due to the potential hazard they represent by the possibility of water stratification and CO2 accumulation. During 2012-2018 period, geochemical investigation based mainly on diffuse CO2 surveys and analyzing the chemical and isotopic composition of bubbling gases has been carried out at Cuicocha and Quilotoa lakes. Additionally, vertical profiles of water columns were conducted in both lakes to investigate the possibility of water stratification and CO2 accumulation in the lakes. A bathymetric study was also carried out in Quilotoa in 2017, giving further information about the degasification processes and the morphology of the lake bottom. The computed diffuse CO2 output for Cuicocha volcanic lake (3.95 km2) showed a range from 53 to 652 t d−1 for the period 2006–2018, with a maximum value in 2012, coinciding with a maximum of the 3He/4He ratio measured at the bubbling gases and an increase in the seismic activity with an episode of long-period seismicity recorded in 2011–2012. For Quilotoa volcanic lake (3.50 km2) diffuse CO2 output was estimated between 141 and 536 t d−1 for the period 2014–2018. The chemical and isotopic data show that Cuicocha has a chemical composition typical of worldwide superficial shallow waters and aquifers, while Quilotoa shows a chemical composition typical of crater lakes in active volcanic systems. The distribution of the dissolved gas composition along the vertical profiles shows the existence of different water masses in both lakes, with an increase in the concentration of dissolved gases with depth. The carbon isotopic signature indicates an endogenous origin of the CO2, with a greater contribution in the stratification zone in both lakes. This study shows methods applicable to other volcanic lakes of the world to monitor their activity and potential risks.
Introduction
Volcanic lakes consist of accumulations of water inside a volcanic depression. The study of the physical and chemical characteristics of these water masses constitutes a powerful tool to evaluate the activity level of volcanic systems (Mazot and Taran, 2009; Rouwet et al., 2014, 2015; Andrade et al., 2016, 2019, 2021; Hernández et al., 2017). After the two well-known limnic eruptions ocurred in Camerron at Lake Monoun in 1984 and Lake Nyos in 1986, special importance has been paid to the development of CO2 emission surveys in different volcanic lakes (Padrón et al., 2008; Mazot and Taran, 2009; Hernández et al., 2011, 2017; Pérez et al., 2011; Mazot et al., 2014; Melián et al., 2017; Sierra et al., 2021). These periodic CO2 emission surveys in volcanic lakes are an important task for the surveillance of these systems. Although much effort has been made in the last 15 years to study the diffuse CO2 emission rate at several volcanic lakes in the world (Mazot and Taran, 2009; Pérez et al., 2011; Melián et al., 2017), many lakes are still noninvestigated and very few have been regularly monitored to create time series (Sierra et al., 2021).
Changes in temperature and water chemistry (chemical and isotopic composition, as well as dissolved gas composition and fluxes) of volcanic lakes may also indicate processes occurring deeper in the volcanic system. Water composition is strongly influenced by the fluid inputs and changes to it may signify variations in the composition or magnitude of fluid discharges into the system (Christenson, 2000; Gunkel et al., 2008, 2009; Inguaggiato et al., 2010, 2016; Hernández et al., 2017; Rouwet et al., 2017). Bathymetry studies have been employed to identify CO2 degassing vents (Aguilera et al., 2000; Goepel et al., 2015; Hernández et al., 2017; Melián et al., 2017), to evaluate ideal drilling sites into geothermal reservoirs (Brehme et al., 2019, 2021), and to evaluate hazards due to accumulation of CO2 in volcanic lakes (Anzidei et al., 2008).
Cuicocha and Quilotoa are potentially hazardous volcanic lakes located in Ecuador (Figure 1). Despite this, these lakes have not been extensively studied and there are only a few published works. Both volcanic lakes have been investigated by Gunkel et al. (2008) to evaluate the hazard due to the occurrence of CO2 emissions that can generate the accumulation of CO2 in the deep-water body. In this research, they conclude that Cuicocha can give rise to phreatic-magmatic eruptions due to the small amount of sediments, mainly carbonates and organic material, such that a remobilization of the sedimentation layer can be caused by earthquakes or rock slides. On the other hand, Quilotoa is more susceptible to the occurrence of potential limnic eruptions since it presents an atypical water mixture called atelomixis that can cause the release of diffuse CO2 during periods of calm or absence of wind in the caldera.
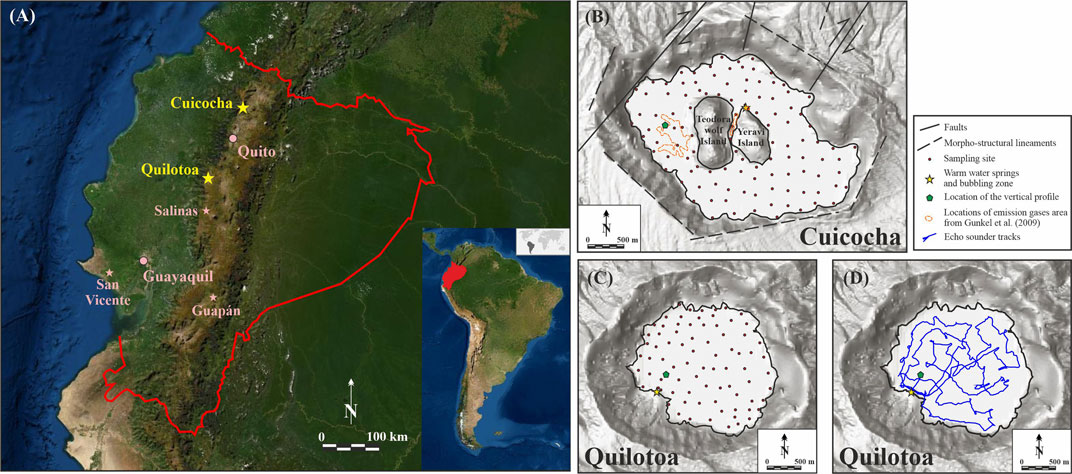
FIGURE 1. (A) Local map of Ecuador with the geographic location of Cuicocha and Quilotoa volcano. Location of the diffuse CO2 efflux measurements sites (red dots), vertical profiles (green pentagons), and warm water springs and bubbling sites (yellow stars) for (B) Cuicocha and (C) Quilotoa volcanic lakes. (D) Localization of echo-sounder track in Quilotoa volcanic lake for the 2017 survey. Orange line show.
Gunkel et al. (2009) present a characterization of the lake water during the period 2004–2006, through the study of vertical profiles and an eco-sounder (ES) survey. The results showed that Cuicocha volcanic lake presents a monomictic stratification and during overturn an intensive gas exchange can occur. The ES survey also showed an intensive gas emission, mainly CO2, at the western basin of the Cuicocha volcanic lake and a sediment layer of up to 10–20 cm in the deeper part of the lake. This sediment layer is not present in the zone of intense degassing. Gunkel et al. (2009) and Inguaggiato et al. (2010) studied the chemical composition of bubbling. These authors indicate that CO2 is the predominant gas, with concentrations approximately 37–51%.V, followed by N2 (∼45%.V) and O2 (∼3.5%.V). The 3He/4He (R/RA = 5.73) and δ13C–CO2 (−3.94‰) ratios of the bubbling gases were interpreted as a consequence of a magmatic contribution (Inguaggiato et al., 2010). The first study of diffuse CO2 emission at Cuicocha volcanic lake was reported by Padrón et al. (2008). The authors estimated the CO2 emission of the lake at 53 t d−1 using the sequential Gaussian simulation (sGs) method. More recently, Sierra et al. (2021) presented the results of long-term analysis of diffuse CO2 emission, estimating an emission of 400 kt of CO2 during the period 2011–2019 (8.13 years), with an average rate of ∼135 t d−1. Sierra et al. (2021) considered that the CO2 emission peak registered in 2012-2013 was related to the anomalous seismicity occurred during this period due to deep origin processes that affect the hydrothermal system.
Regarding Quilotoa, most of the published studies have been focused on its volcanism and the last (800 years BP) eruption (Rosi et al., 2004; Di Muro et al., 2008; Hall and Mothes, 2008; Mothes and Hall, 2008) and only a few works have been published about the water chemistry of the lake. Based on data from water vertical profiles (pH, electrical conductivity (EC), temperature, chemical composition of water), Aguilera et al. (2000) observed two water bodies at Quilotoa volcanic lake: a thin (∼14 m) oxic epilimnion overlying a thick (∼200 m) anoxic hypolimnion. Inguaggiato et al. (2010) report a clearly CO2-dominated (96%.V) chemical composition of the bubbling gases, followed by N2 (∼3%.V) and O2 (∼0.4%.V). As in the case of Cuicocha, He and N2 composition shows two groups of samples based on the geographical limit of the active volcanic arc in Ecuador. Quilotoa is in the group of active volcanism (quaternary arc). In the case of Quilotoa, no previous works have been published on the emission of CO2 from the volcanic lake.
We herein report the results of CO2 efflux surveys carried out in the Cuicocha and Quilotoa volcanic lakes, with the aim of evaluating the temporal variation of CO2 efflux from de water surface and 3He/4He ratio of bubbling gases and their relationship with volcanic activity. Additionally, vertical profiles of dissolved gases and chemical and isotopic composition of the water column were carried out in both volcanic lakes; an ES survey was conducted at the Quilotoa volcanic lake to study the stratifications of the water layers, accumulation of gases, and the possibility of future dangerous gas outburst episodes.
Geological Background
The North Andean volcanic zone is part of a ∼7,000 km long active continental margin on the western edge of the South American continent (Jordán et al., 1983; Garrison and Davidson, 2003). The ESE trending oceanic Nazca plate is subducting below the South American and Caribbean continental segments, which give rise to the active volcanism within Colombia and Ecuador (Gutscher et al., 1999). Here volcanism is aligned in a NNW-SSE orientation within a number of volcanic arcs, with approximately 250 volcanoes in Ecuador (Rodriquez et al., 2017; Toulkeridis and Zach, 2017). Within the western volcanic cordillera, which represents the volcanic front, the only two water-filled calderas appear, Cuicocha to the north and Quilotoa to the southeast of Ecuador’s capital Quito (Figure 1).
The Cuicocha Volcanic System
The Cuicocha volcano is situated in the south of the older and extinct edifice of the nearby Cotacachi volcano. The oldest edifice of the Cotacachi volcano initiated approximately 160,000 years ago (Almeida Vaca, 2016). Both are located along the Otavalo—Umpalá fracture zone (Hanus, 1987). However, above the older units of the Cotacachi volcano four principal parasitic domes were emplaced, of which Cuicocha is the youngest (Sierra et al., 2021). Its collapse formed the caldera approximately 4,500 years ago, which has since been the location of intense eruptions with volcanic explosivity indexes (VEI) of 5–6, lahars, and massive pyroclastic flows through to approximately 1,300 years ago (Hillebrant, 1989). The Cuicocha volcano is truncated by an elliptical caldera with a maximum diameter of 3.2 km, and a lake within, with maximum depth of 148 m and a volume of 0.28 km3. The surface of the lake is at an altitude of 3,072 m.a.s.l. The water in the caldera initially resulted from the melting of the Cotacachi volcano glacier and later fed by rainwater and hydrothermal vents. The last eruptive activity of Cuicocha is evidenced by the formation of four domes distributed on two islands in the center of the lake named Isla Yerovi and Wolf, and a further one in the northeast extreme on the caldera wall. All domes have an andesitic composition (Gunkel et al., 2009). Both lahars and pyroclastic flows have reached distant areas such as the towns of Quiroga (population: 3,300), Cotacachi (population: 8,800), and even the highly populated Otavalo (population: 40,000), all of them located only a few dozens of km from the caldera (Bustos-Gordón and Serrano-Abarca, 2014). Post-volcanic activity is evidenced by the emission of volcanic gases in the form of gas bubbles and dead vegetation because of the action of these gases. The most constant and noticeable of these is located on the northern shoreline of Yeravi island but they are also observed in the eastern area of the lake (Figure 1B; Gunkel et al., 2008; Padrón et al., 2008).
Ecuador’s volcanic activity is monitored by the Ecuadorian Instituto Geofísico de la Escuela Politécnica Nacional (IG-EPN). Cuicocha volcanic lake hosts a broadband seismic station and a GPS (www.igepn.edu.ec/). The seismic activity of Cuicocha volcanic lake is characterized in general by volcano-tectonic seismicity (VT) of low-magnitude earthquakes (M < 2; IGEPN, 2010, 2018, 2019). Several episodes of high long-period (LP) seismicity were identified in the 2011–2012 period (Sierra et al., 2021). The available deformation data registered in Cuicocha volcanic lake (January 2018–February 2020) do not show significant variations according to IGEPN (2019). Since 2011, CO2 diffuse flux studies were conducted by IG-EPN in Cuicocha volcanic lake with a variable periodicity.
The Quilotoa volcanic System
The collapse of a stratovolcano gave rise to the Quilotoa caldera (Aguilera et al., 2000). The caldera has an elliptical shape with a diameter of 2.4–2.8 km and a depth of up to 256 m. The surface of the lake hosted within the caldera is 3,500 m.a.s.l. and the total volume of the water is estimated at 0.35 km3 (Aguilera et al., 2000). The water level has been continuously declining for the past 30 years, as attested by the lacustrine deposits observable on the shore banks (Aguilera et al., 2000; Gunkel et al., 2008; Bustos-Gordón and Serrano-Abarca, 2014). The eruptive record of Quilotoa exhibits a long series of Plinian eruptions with a VEI between 4 and 6, covering a large part of the region and ash and pumice traced across the entire country (Aguilera et al., 2000; Rosi et al., 2004). In the last 2,11,000 years, there have been more than a dozen different cycles every 10,000–15,000 years (Rosi et al., 2004; Di Muro et al., 2008). The eruptions were characterized by different phases, commonly starting with phreato-magmatic explosions followed by falls rich in lapilli-size pumice, ending with pyroclastic and ash-flows of mostly dacitic composition (Rosi et al., 2004; Hall and Mothes, 2008). There are approximately 18 domes identified around the Quilotoa caldera, being of dacitic to rhyolitic composition (Panchana Guerra, 2015). These originated from the various phases of the eruptive activities beginning ∼34,000 years ago. Furthermore, the Quilotoa caldera experienced 4 limnic explosions during the 18th century (Simkin and Siebert, 1994). The last violent gas escape event (February 4, 1797) originated due to an earthquake under the Tungurahua volcano, generated flames and suffocating gases in the lake, and destroyed the cattle on the slopes of Quilotoa (Lyell, 1830). It is worth noting that near the volcano, there are many settlements of native indigenous people dedicated to agriculture and tourism. Additionally, very strong gas emissions, manifest mainly as CO2 emission via bubbling gases and hydrothermal waters, occur in the south and southwest shorelines of the lake (Figures 1C,D; Aguilera et al., 2000; Gunkel et al., 2008). Regarding geophysical monitoring of Quilotoa volcanic lake, a GPS station is installed in the volcanic lake, but there are not public data (www.igepn.edu.ec/).
Sampling Procedures, Analytical Methods, and Data Processing
During the period 2012–2018, four and three diffuse CO2 efflux surveys were conducted at Cuicocha and Quilotoa volcanic lakes, respectively. Bubbling gas samples were also collected from both lakes during the period 2014–2018 to study their chemical (He, O2, N2, and CO2) and isotopic (3He/4He ratio and δ13C-CO2) composition. Additionally, in 2017 and 2018, vertical profiles of dissolved gases (He, H2, O2, N2, CO2, and CH4) and chemical (Ca2+, Mg2+, K+, Na+, HCO3−, Cl−, and SO42−) and isotopic (δ2H, δ18O, and δ13C-CO2) composition of the water column were carried out in both volcanic lakes. All samples (water and gases) were transported from Ecuador to Tenerife (Canary Islands, Spain), where the analyses were carried out in the ITER laboratory. Water pH, temperature, and EC were measured at 30 cm depth from the water surface at each sampling site and in water samples in the vertical profiles. During the 2017 survey, an ES survey was also conducted at Quilotoa volcanic lake.
Diffuse CO2 efflux survey was intentionally carried out in days of stable weather conditions (sunny days without wind) to minimize the effects of variable meteorological conditions on CO2 emission. Approximately 113 (for Cuicocha) and 84 (for Quilotoa) sampling sites were selected to cover homogeneously all the surface of volcanic lakes with site spacing of about 180 m for both (Figures 1B,C). The GPS position of each measurement point was recorded with a resolution of ±5 m. Measurements of diffuse CO2 efflux at the water surface of the lakes were conducted in situ using the accumulation chamber method (Parkinson, 1981; Chiodini et al., 1998) with the chamber placed on a flotation device (Huttunen et al., 2003; Pérez et al., 2011). These measurements were conducted by means of a portable CO2 efflux instrument provided with a nondispersive infrared (NDIR) CO2 analyzer LICOR-800 system (West Systems Ltd). The accuracy of the diffuse CO2 efflux measurements for the range 10–35,000 g⋅m−2·d−1 was estimated at 10% for this study. Spatial distribution maps for Cuicocha and Quilotoa volcanic lakes were constructed using sGs (Deutsch and Journel, 1998; Cardellini et al., 2003). The final maps were constructed as an average of 100 equiprobable realizations and the differences among all simulated maps were used to compute the uncertainty in the estimation of diffuse CO2 emission of the studied areas.
Water pH, temperature, and EC were measured by means of an Oakton Waterproof pH/CON 10 m (accuracies ±0.2, ±0.5, and ±1%, respectively), where calibration was done on site before the start of the survey.
A vertical profile of 80 m depth was studied in both 2017 and 2018, sampling every 10 m (green pentagon in Figure 1B), at Cuicocha volcanic lake. In the case of Quilotoa, a 140 m depth profile was conducted in 2017 and a 120 m depth profile in 2018, and water samples were collected every 30 and 20 m, respectively (green pentagon in Figure 1C). Water samples were collected using a 2.2 L WaterMark horizontal PVC water bottle. Total alkalinity (HCO3−) in the water samples was analyzed by automatic titration Metrohm 716 DMS Titrino. The concentration of Cl− and SO42- was analyzed by means of a Dionex ICS-2100 system, while the concentration of Ca2+, Mg2+, K+, and Na+ was determined by means of a 861 Advanced Compact IC. The cations were determined in filtered acidified samples. Each sample was analyzed in triplicate and the accuracy of the analyses was estimated at 2.5%. The quality of the geochemical data was checked in each sample by calculating the ion balance error (IBE = (sum cations–sum anions)/(sum cations + sum anions)). Only those results with IBE of ±5% were considered for processing.
The δ2H and δ18O values of water and δ13C-CO2 in dissolved and bubbling gas were obtained by isotopic ratio mass spectrometry (IRMS; Thermo-Finnigan MAT 253). For δ18O and δ2H, the results are reported in δ units per mil vs Vienna Standard Mean Ocean Water (VSMOW) with experimental errors of ±0.1 and ±1‰, respectively. For δ13C-CO2, the results are reported in δ units per mil vs Vienna Pee Dee Belemnite standard (VPDB) with an analytical error of ±0.01‰.
Dissolved He, H2, O2, N2, CO2, and CH4 concentrations were analyzed following the method of Capasso and Inguaggiato (1998), with pure Ar as the host gas using a two-channel Agilent 490 micro-chromatograph with thermal conductivity detection (TDC). The instrumental precision and limit of detection was estimated as 2% and 0.3 ppm.V (parts per million in volume) for He, 2% and 0.3 ppm.V for H2, 0.1% and 15 ppm.V for O2, 0.1% and 50 ppm.V for N2, 2% and 7 ppm.V for CO2, and 2% and 1.6 ppm.V for CH4.
The chemical composition of the collected bubbling gas was analyzed by quadrupole mass spectrometers (QMS), models Pfeiffer Omnistar 422 and HIDEN QGA. Analytical error was estimated as <5% and <10% for the main (O2, N2, and CO2) and minor (He) gas components, respectively.
Elemental abundances of He and Ne, and He isotope composition of the gas samples were analyzed in a high-precision VG Isotech modified VG-5400 noble gas mass spectrometer. The analytical error for 3He/4He determination was <2%. Air standards were measured frequently during analyses to determine sensitivities of the mass spectrometer. The correction factor for helium isotope ratios was determined by the measurement of an inter-laboratory helium standard named HESJ with a recommended 3He/4He ratio of 20.63 ± 0.10 RA (Matsuda et al., 2002). The measured 3He/4He ratios were corrected for the addition of air based on the 4He/20Ne ratios measured by mass spectrometry, assuming that Ne has an atmospheric origin (Craig and Lupton, 1976) and normalized to that in the atmosphere (RA = 1.384 × 10⁻⁶; Clarke et al., 1976).
Finally, an ES survey was carried out at Quilotoa in 2017 by means of a Lowrance HDS-5 ES equipped with a dual frequency (83 and 200 kHz) transducer. Boat velocity ranged on average between 0.5 and 3 knots. ES data were processed according to the methodology used by Hernández et al. (2017) and Melián et al. (2017). The digital ES echograms were processed using Sonar Viewer 2.1.2 software. Extracted bathymetric data were converted from the Lowrance-type Mercator projection to universal Transverse Mercator (WGS1984 UTM Zone 17S) using ArcGis 10.2. Bathymetric data from the two frequencies (Primary at 200 kHz and Secondary at 83 kHz) were interpolated using the natural neighbor technique of the 3D analyst tools.
Results
CO2 Diffuse Degassing
Cuicocha Volcanic Lake
The CO2 efflux values measured at Cuicocha volcanic lake ranged between below the detection limit of the instrument (<0.5 g⋅m−2·d−1) to 695 g·m−2·d−1, with an average value of 54 g⋅m−2·d−1 for the four surveys (Supplementary Table S1 in Supplementary Material). The surface water temperature presented a range between 14.5 and 17.3°C (average of 15.9°C). The pH value of the water was slightly basic, ranging between 7.17 and 9.02 (average of 8.2) and EC ∼700 μS cm−1. No significant spatial variation of EC was observed at 30 cm depth. The water temperature values are ∼2°C higher in the bubbling zone, while the pH is ∼0.4 units lower with respect to the rest of the lake.
To check for the presence of overlapping log-normal populations of the efflux data, we applied the probability-plot technique (Sinclair, 1974) to the entire CO2 efflux data (cumulative percentile frequencies versus class intervals). The inflection point of the curve allows the threshold value between different populations to be distinguished. The descriptive statistics summary of CO2 efflux values partitioned populations at each survey are shown in Supplementary Table S1 (Supplementary Material). The result of the statistical-graphic analysis of CO2 efflux data (Figures 2A–D) showed different populations for each survey: population I (background) with values from 6.1 to 58.0 g⋅m−2·d−1 (average 15.9 g⋅m−2·d−1) and represented between 29.6 and 53.8% of the total data (average 54%). Population III (anomalous or peak), which presented a range from 4.8 to 9.1% (average 6.9%) of the total data, showed values between 27.4 and 326 g⋅m−2·d−1 (average 59 g⋅m−2·d−1). The rest of the cumulative probability (population II) corresponding to the mixing of two log-normal populations (background and peak) is not considered as a product of a different source or mechanism, but rather the mixture of the previous ones.
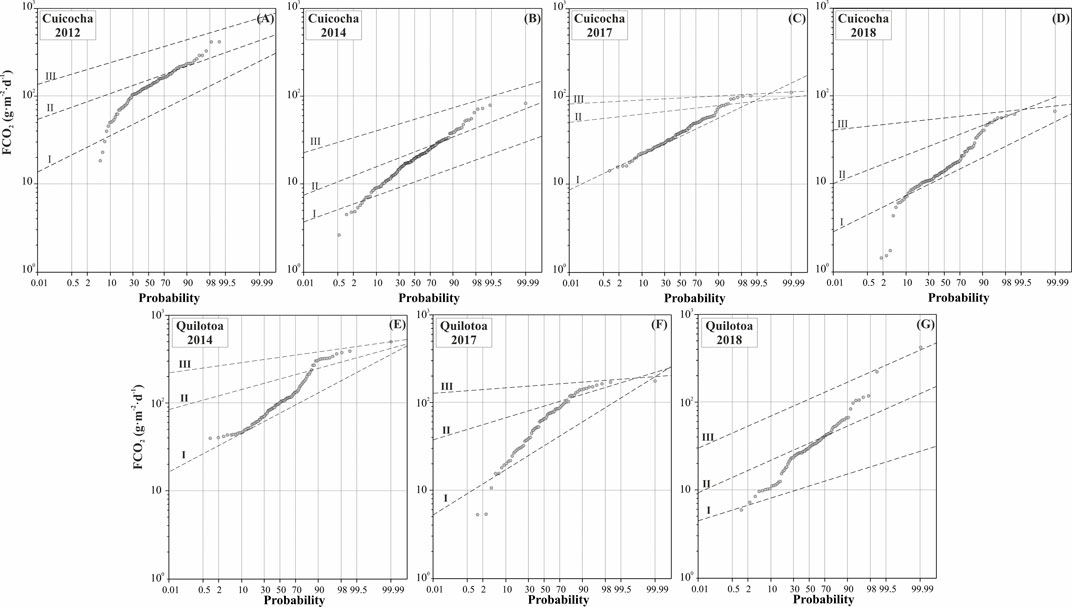
FIGURE 2. Probability-plots of the CO2 efflux data measured at the Cuicocha volcanic lake for (A) 2012, (B) 2014, (C) 2017, and (D) 2018; and Quilotoa volcanic lake for (E) 2014, (F) 2017, and (G) 2018. The black dots indicate the original data. Dashed lines indicate separated geochemical populations.
Figure 3 shows the spatial distribution maps of CO2 efflux at the Cuicocha volcanic lake for the period 2012–2018. Supplementary Figure 1S in Supplementary Material shows the omnidirectional experimental variogram of CO2 efflux normal scores from the survey conducted at the Cuicocha volcanic lake, as well as the parameters that refer to the variogram models. An inspection of CO2 efflux distribution maps shows that background CO2 efflux values (∼16 g⋅m−2·d−1) are identified across most of the studied area, except for the 2012 survey that shows values of ∼100 g⋅m−2·d−1. For all the surveys, relatively high CO2 efflux values were observed in the bubbling gas zone located in the northern corner of Yerovi island (>40 g⋅m−2·d−1), close to CO2 bubbling areas (temperature of 16-17°C and pH of 7–8). During the 2012 survey, the highest CO2 degassing rate showed four areas with particularly high values (>200 g⋅m−2·d−1): 1) in the NW shores of the lake; 2) along the eastern shores of Wolf Island; 3) in the southern zone of the lake; and 4) along the SW shores (Figure 3A). Relatively high CO2 efflux values (>35 g⋅m−2·d−1) were measured in 2014 at the western zone of the lake and at the eastern shores (Figure 3B). The spatial distribution map of the 2017 survey shows constant CO2 efflux values (>60 g⋅m−2·d−1) over the entire surface of the lake (Figure 3C). Finally, the 2018 CO2 efflux map shows a significant decrease in the magnitude of the values, with relatively high values of CO2 efflux measured in the small area located to the W and NW of Wolf Island (Figure 3D).
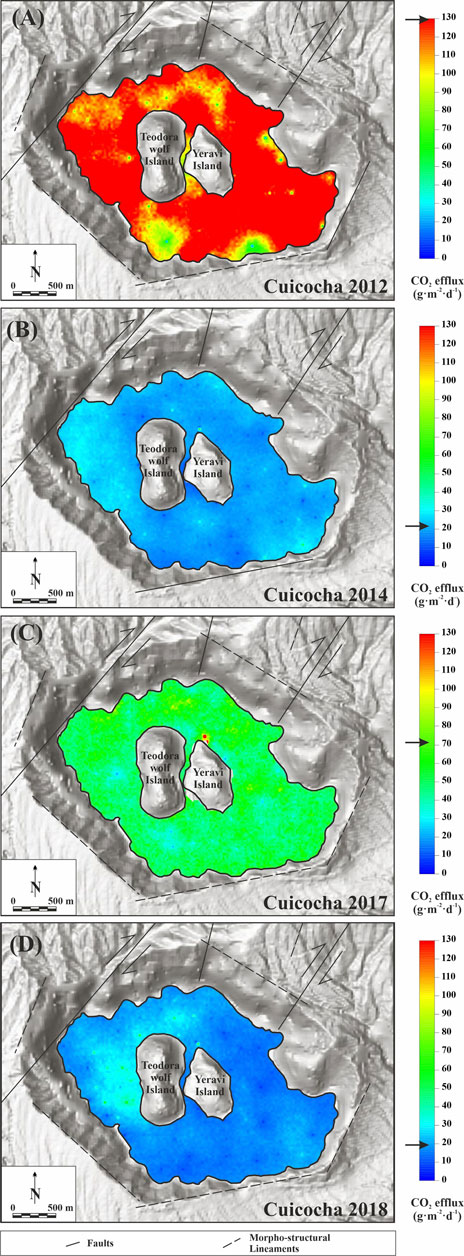
FIGURE 3. Spatial distribution of CO2 efflux (g m−2 d−1) at the Cuicocha volcanic lake for (A) 2012, (B) 2014, (C) 2017, and (D) 2018. Location of the main tectonic structures according to Sierra et al. (2021) are also shown. Horizontal arrow at each color scale indicates the average value of the data used to construct the spatial distribution map.
Guided by the variogram model, sGs of diffuse CO2 efflux data were conducted covering an area of 3.95 km2 for each survey in the period 2012–2018. The CO2 output estimated shows a range from 76 ± 3 to 652 ± 25 t⋅d−1 in the 2012–2018 period, with 2018 and 2012 surveys showing the lowest and maximum values, respectively (Table 1 and Figure 4A). The normalized CO2 emission value by area (3.95 km2) ranged between 19 ± 1 t⋅d−1·km−2 (in 2018) and 165 ± 6 t⋅d−1·km−2 (in 2012; Supplementary Table S1 in Supplementary Material).
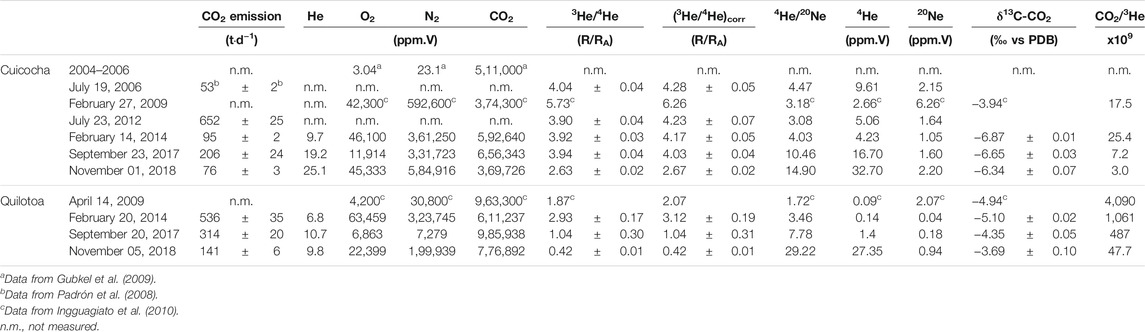
TABLE 1. Estimated diffuse CO2 emission rates, chemical composition of bubbling gases, 3He/4He (R/RA)corr and 4He/20Ne ratios in bubbling gases, δ13C-CO2 and CO2/3He ratios for Cuicocha and Quilotoa volcanic lakes during the 2006–2018 period.
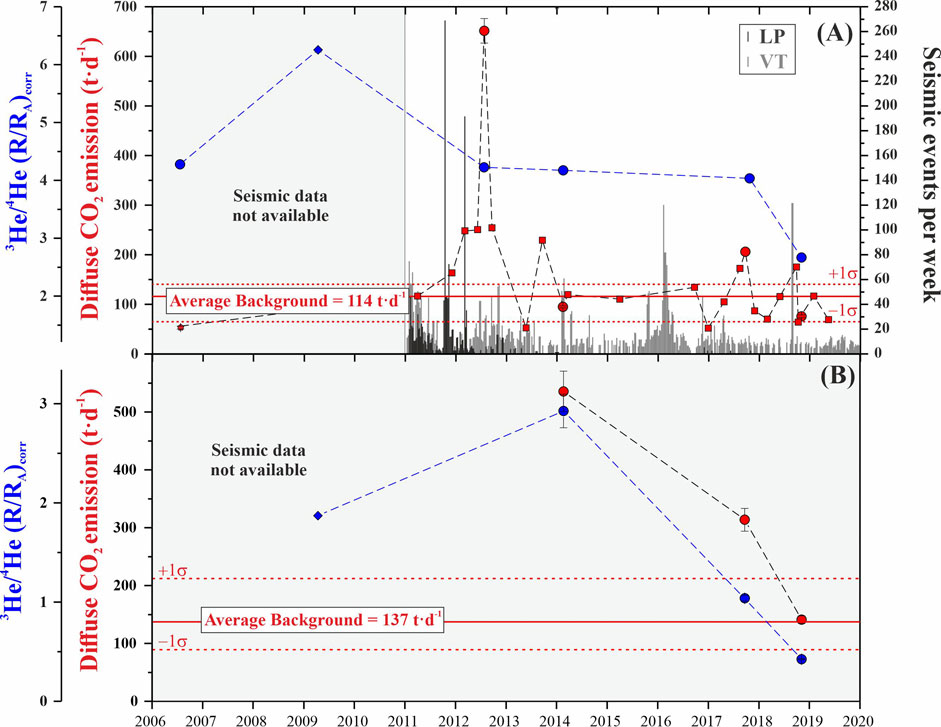
FIGURE 4. Temporal evolution of diffuse CO2 emission (red dots for present work data, red pentagon from Padrón et al. (2008), and red squares for sGs flux data from Sierra et al. (2021)) and (3He/4He)corr (blue dots for present work data and blue diamond for data from Inguaggiato et al. (2010)) measured in (A) Cuicocha and (B) Quilotoa volcanic lakes in the period 2006–2018. Vertical error bars in the CO2 emission data depict 1 sigma of the 100 equiprobable sGs realizations. Uncertainties with reported 3He/4He ratios (vertical error bars) are 1 sigma, including error of the measured raw 3He/4He ratio, that of measured raw 3He/4He ratio of HESJ, and that on the recommended 3He/4He ratio of HESJ. Average background CO2 emission (red line) with ±σ (red dash line) is also shown. The seismic event data of Cuicocha are from the IG-EPN seismic network and reported by Sierra et al. (2021): Volcanic Tectonic event (VT: gray vertical bars) and Long Period event (LP: black vertical bars).
Quilotoa volcanic Lake
CO2 efflux values ranged from 5.2 to 542 g⋅m−2·d−1, with an average value of 83 g⋅m−2·d−1. The surface water temperature ranges between 10.7 and 15.5°C (average 13.6°C), with pH ranging between 6.60 and 8.10 (average 7.3). Similar to Cuicocha lake, no significant spatial variations of EC were observed on the water at 30 cm depth. In the bubbling gas zone water temperature is ∼1–2°C higher and pH is 0.5 units lower than the rest of the lake.
The probability-plot technique applied to the diffuse CO2 efflux values confirms the existence of two log-normal populations (Figures 2E–G; Supplementary Table S1 in Supplementary Material). Population I showed values from 11 to 74 g⋅m−2·d−1 (average 39 g⋅m−2·d−1), which represented between 21.9 and 73.2% of the total data (average 48.4%). Population III, which represented a range from 9.7 to 33.9% (average 18.3%) of the total data, showed values between 107 and 354 g⋅m−2·d−1 (average 206 g⋅m−2·d−1).
The CO2 efflux maps (Figure 5) show the highest values are located mainly in the SW shores (>450 g⋅m−2·d−1), where gas bubbles and warm water springs appear, being characterized also by a relatively high water temperature and pH (temperature of ∼22°C and pH of ∼6.8) (6). In 2014, other high values of the CO2 efflux were observed in the SW shores (>450 g⋅m−2·d−1) and in the north-eastern zone of the lake (>200 g⋅m−2·d−1; Figure 5A). During the 2017 survey, relatively high values of CO2 efflux were observed in the eastern zone of the lake, with values > 250 g⋅m−2·d−1 (Figure 5B). Regarding the 2018 survey, a general decrease on the extension and magnitude of the values were registered, with the principal anomalies focused in the south-western zone (Figure 5C).
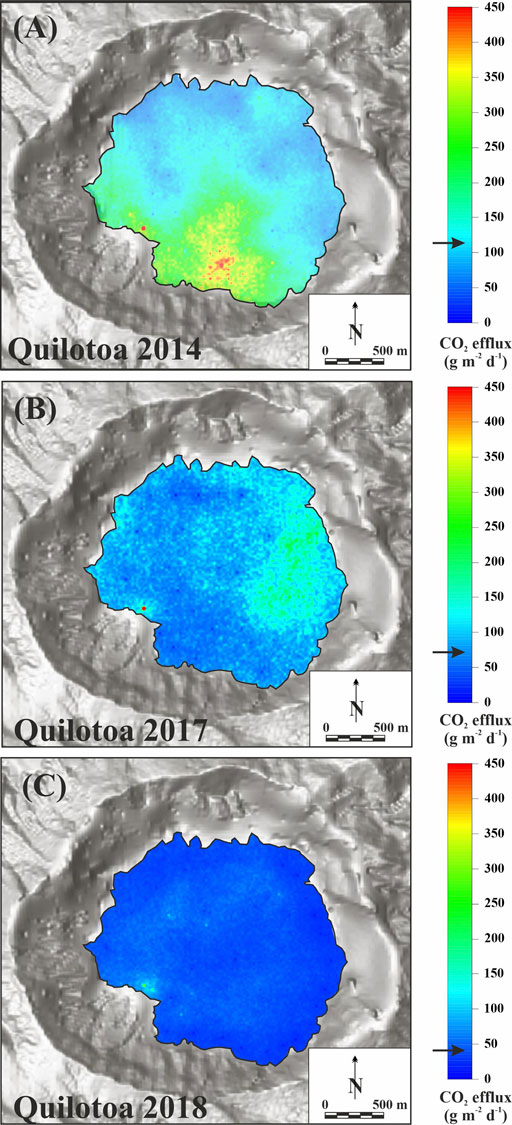
FIGURE 5. Spatial distribution of CO2 efflux (g·m−2·d−1) at Quilotoa volcanic lake for (A) July 2014, (B) 2017, and (C) 2018. Horizontal arrow at each color scale indicates the average value of the data used to construct the spatial distribution map.
The diffuse CO2 emission at Quilotoa was estimated between 141 ± 6 and 536 ± 35 t⋅d−1 (average 330 t⋅d−1; Table 1 and Figure 4B), corresponding to an area of 3.50 km2. The normalized emission value ranged between 40 ± 2 t⋅d−1·km−2 (in 2018) and 153 ± 10 t⋅d−1·km−2 (in 2014; see Supplementary Table S1 in Supplementary Material).
Lake Water Chemistry and Vertical Profiles
Table 2 and Figure 6 present the chemical composition of the vertical profiles of water samples collected during 2017 and 2018 at Cuicocha and Quilotoa volcanic lakes (location of lake profiles is shown by green pentagon in Figures 1B,C). The water temperature of Cuicocha volcanic lake ranged between 14.9 and 17.8°C (Figure 6A). Temperature differences were observed between the surface waters and 20 m depth in both 2017 and 2018 surveys, signifying that thermal stratification at Cuicocha is likely typical. An alkaline pH along the water column (∼8.2 for the 2017 survey and ∼7.8 for the 2018 survey; Figures 6A,B) and a gradient along the water column of 0.2–0.4 pH units were recorded. Moreover, pH values were higher on the surface compared with the lake bottom. EC values were relatively low at Cuicocha volcanic lake (<700 μS⋅cm−1; Figure 6C) along the water column. The water samples from Cuicocha volcanic lake showed relatively low concentration of Na+ (64.5–68.1 ppm⋅m (parts per million in mass); Figure 6D), Ca2+ (41.6–57.6 ppm⋅m; Figure 6D), and Mg2+ (29.6–39.9 ppm⋅m; Figure 6D) and relatively high values of HCO3− (314–382 ppm⋅m; Figure 6E) and lower concentration of Cl− (73.5–64.1 ppm⋅m; Figure 6E) and SO42- (19.6–21.4 ppm⋅m; Figure 6E).
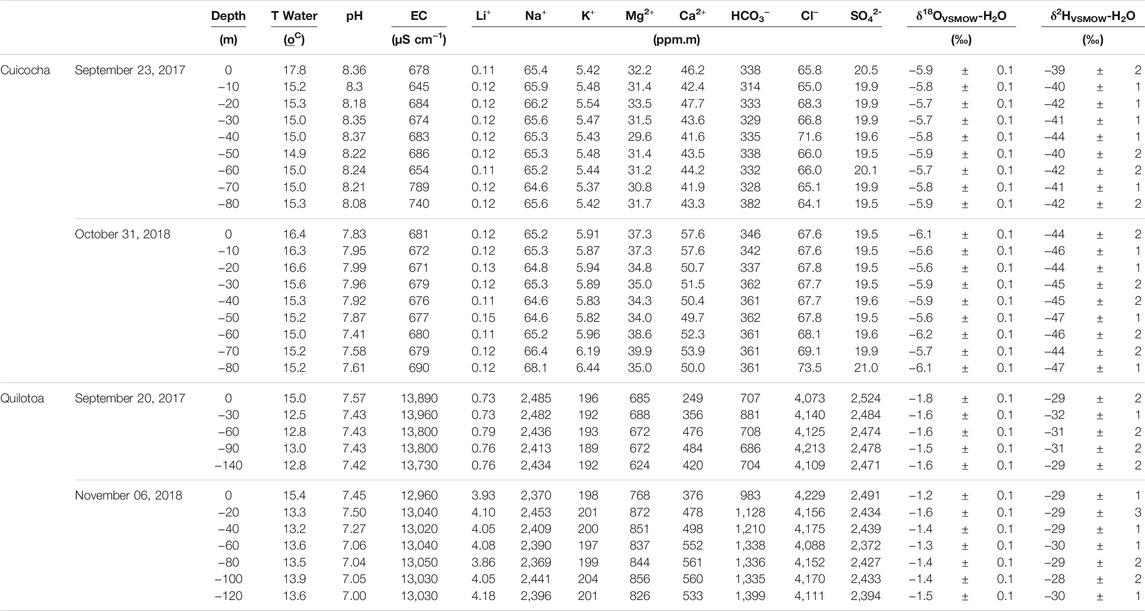
TABLE 2. Chemical and isotopic data of the samples of Cuicocha and Quilotoa volcanic lakes water profiles, including temperature, pH, electrical conductivity (EC), and major ion compositions. The chemical composition is expressed in ppm.m and water stable isotopes are expressed in ‰ vs. VSMOW.
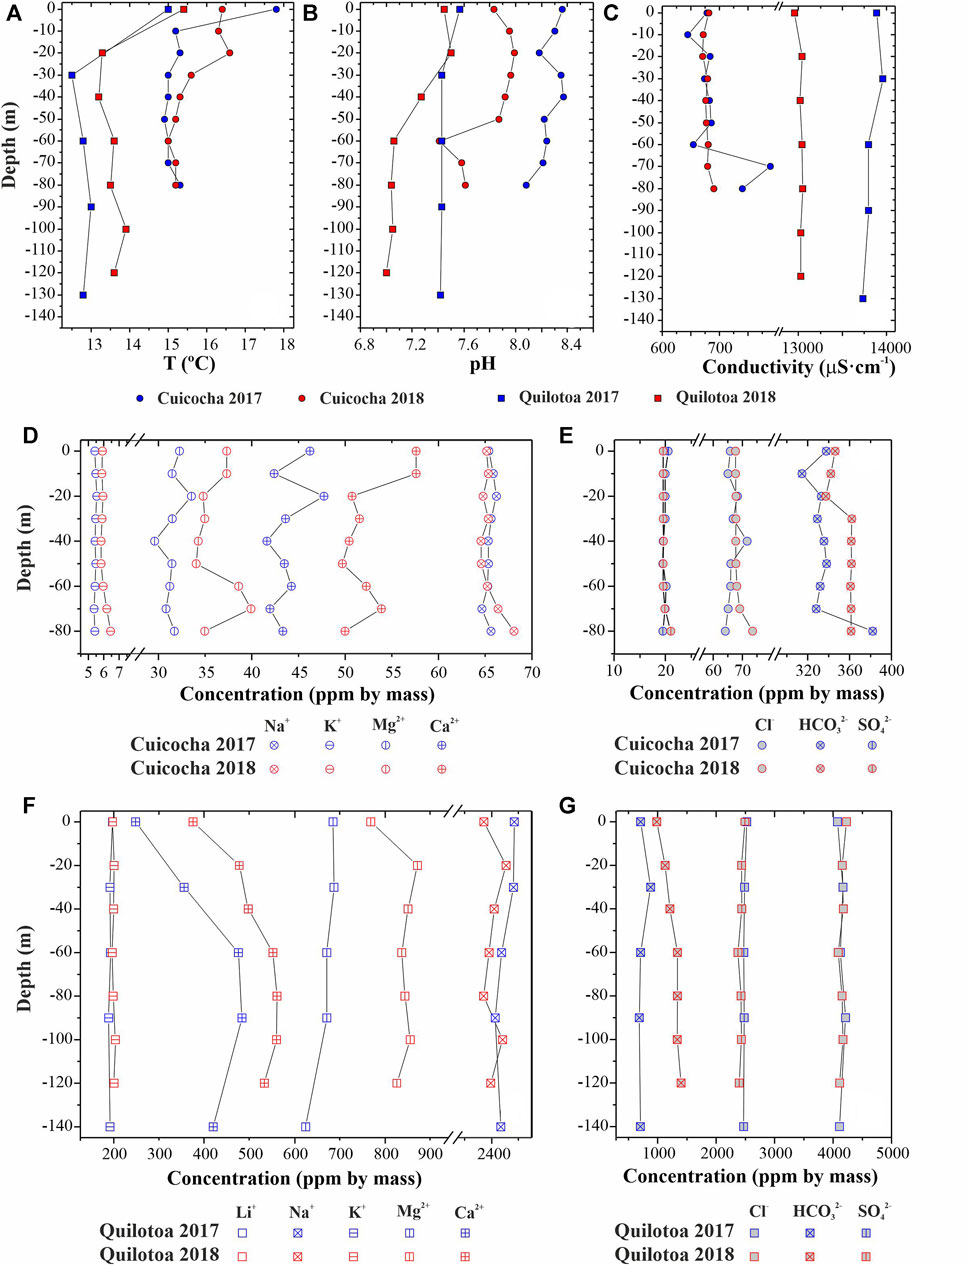
FIGURE 6. Vertical profiles of (A) temperature, (B) pH, (C) electrical conductivity (EC), and major (D,F) cations and (E,G) anions in the Cuicocha and Quilotoa waters.
For Quilotoa volcanic lake, the water temperature ranged between 12.5 and 15.4°C (Figure 6A) with neutral pH values (∼7.4 and ∼7.2 for 2017 and 2018 surveys, respectively; Figure 6B) and the gradient along the water column reached 0.2–0.4 pH units. The EC presents high values along the water column (∼13,000 μS⋅cm−1; Figure 6C) associated with high contents of Na+, Cl−, and SO42-. The samples of Quilotoa volcanic lake showed high concentrations of Na+ (2,369–2,485 ppm⋅m; Figure 6F) and relatively high concentrations of Mg2+ (625–871 ppm⋅m; Figure 6F) and Ca2+ (248–561 ppm⋅m; Figure 6F). The samples along the water column were rich in Cl− (4,073–4,229 ppm⋅m; Figure 6G) and SO42− (2,372–2,524 ppm⋅m; Figure 6G) and relatively low concentrations of HCO3− (686–1.399 ppm⋅m; Figure 6G).
In general, variations in the physical-chemical parameters and concentrations of K+, Na+, Cl−, and SO42−- with depth are not observed at either of the lakes in this study during the 2017-2018 period. Ca2+, Mg+2, and HCO3− content present significant variations along the water column (Figures 6D–G) with changes also between 2017 and 2018. Despite these vertical changes in chemistry, the dissolved cationic constituents decreased in abundance in all water samples in both lakes as follows: Na+>Mg2+>Ca2+>K+; regarding anionic constituents, the order was HCO3− > Cl− > SO42− for Cuicocha and Cl− > SO42− > HCO3− for Quilotoa.
Table 2 and Figure 7 show the oxygen and hydrogen isotopic composition of water column. δ18OVSMOW-H2O values ranged from −6.2 to −5.6‰ and δ2HVSMOW-H2O values from −47 to F02D−39‰ for Cuicocha volcanic lake. No significant variations of δ18OVSMOW-H2O values are observed between 2017 and 2018; however, a slight decrease in δ2HVSMOW-H2O is observed (−41‰ for 2017 to −45‰ for 2018). For Quilotoa volcanic lake, the values ranged from −1.8 to −1.2‰ for δ18OVSMOW-H2O and δ2HVSMOW-H2O values ranged from −32 to −28‰ and variations that are not considered significant were observed between 2017 and 2018.
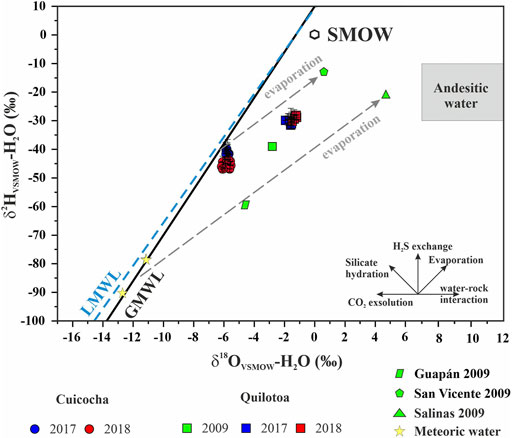
FIGURE 7. δ2HVSMOW-H2O vs δ18OVSMOW-H2O for samples along the water column at Cuicocha (dots) and Quilotoa (squares) for 2017 (blue) and 2018 (red) surveys. The Global Meteoric Water Line (GMWL; Craig, 1961) and the Local Meteoric Water Line (LMWL; Inguaggiato et al., 2010) are shown. The isotopic composition of the sea water (SMOW), magmatic waters (Giggenbach, 1992), meteoric water (start yellow; Rozanski and Araguás, 1995), and data from Inguaggiato et al. (2010; green) are also plotted. Black lines adapted from (Karolyte et al., 2017).
Dissolved and Bubbling Gases
The analytical results of both dissolved and bubbling gases contents, as well as carbon isotopic composition of CO2 and 3He/4He (R/RA)corr, are presented in Tables 1, 3 and Figure 8. For Cuicocha volcanic lake, the predominant chemical species in the dissolved gases in the water column was CO2, with values ranging from 3.8 to 89.7 cm3·STP·L−1 (Figure 8A), followed by N2 (∼6.3 cm3·STP·L−1) and O2 (∼3.0 cm3·STP·L−1) with values of O2/N2 ratio of ∼0.5 (Figure 8B). The average concentrations of H2 (Figure 8C), He and CH4 (Figure 8D) were ∼5 × 10⁻³, ∼4 × 10⁻³, and 1 × 10⁻³ cm3·STP·L−1, respectively. In the water column of Quilotoa volcanic lake the predominant chemical species in the dissolved gas was also CO2, with values ranging from 19.3 to 190 cm3·STP·L−1 (Figure 8F), followed by N2 (∼6.6 cm3·STP·L−1) and O2 (∼2.2 cm3·STP·L−1) with values of O2/N2 ratio of ∼0.4 (Figure 8G). The average concentrations of H2 (Figure 8H), He and CH4 (Figure 8I) were ∼5.9 × 10⁻², ∼4.5 × 10⁻², and ∼1.3 × 10⁻⁴ cm3·STP·L−1, respectively. δ13C values (vs. VPDB) in the dissolved CO2 in the water columns of Cuicocha and Quilotoa volcanic lakes varied from −4.94 to −0.16‰ (Figure 8E) and from −3.50 to −0.17‰ (Figure 8J), respectively.
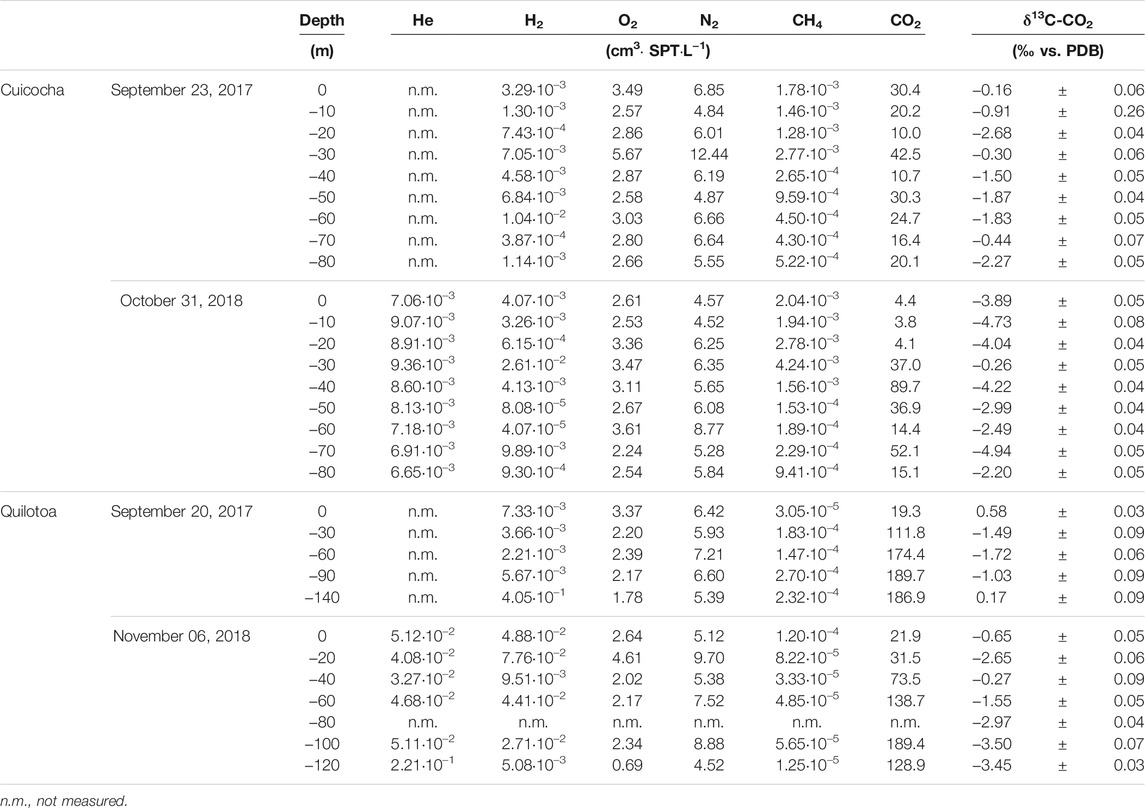
TABLE 3. Chemical (cm3·STP·L−1) and isotopic (‰ vs VPDB) composition of dissolved gases in the samples of Cuicocha and Quilotoa volcanic lakes water profiles.
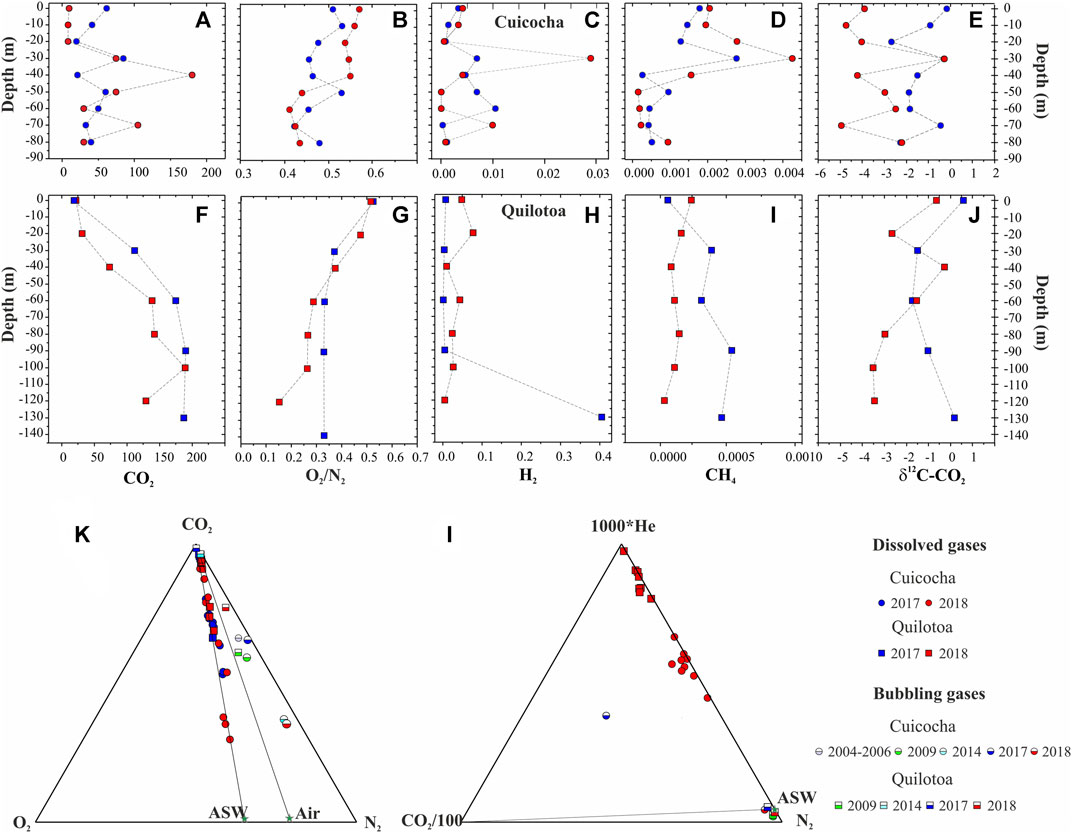
FIGURE 8. Vertical profiles of dissolved gases from Cuicocha [dots; (A–E)] and Quilotoa [square; (F–J)] volcanic lake. (K) CO2-N2-O2 and (L) He-N2-CO2 ternary diagram for dissolved gases and for bubbling gases from Cuicocha (dots) and Quilotoa (square) volcanic lake collected during 2014 (cian), 2017 (blue) and 2018 (red) surveys. Data from Gunkel et al. (2009; gray) and Inguaggiato et al. (2010; green) are also shown.
Table 1 shows the chemical and isotopic composition of bubbling gases from Cuicocha and Quilotoa volcanic lakes. Their chemistry shows a clearly CO2-dominated composition (∼54%.V for Cuicocha and ∼79%.V for Quilotoa), followed by N2 (∼43%.V for Cuicocha and ∼18%.V for Quilotoa), O2 (∼3.0%.V for both lakes), and He (∼18 ppm.V for Cuicocha and ∼9 ppm.V for Quilotoa). The δ13C-CO2 in bubbling gases presented a range from −6.65 to −6.34‰ for Cuicocha and from −5.10 to −3.69‰ for Quilotoa.
The (3He/4He)corr in bubbling gases ranged from 2.67 to 6.26 RA at Cuicocha volcanic lake and between 0.42 and 3.12 RA at Quilotoa volcanic lake, while 4He/20Ne ratios ranged from 3.09 to 14.9 and from 1.72 to 29.2 for Cuicocha and Quilotoa volcanic lakes, respectively (Table 1 and Figures 4A,B). To study the origin of the He, we used the three endmembers (magmatic, atmospheric, and crustal) model proposed by Sano and Wakita (1985). The fraction of atmospheric, magmatic, and crustal components in the sample “i” can be calculated using the following equations:
where subscripts “a”, “m”, and “c” indicate atmospheric, magmatic, and crustal sources, respectively; and A, M, and C are the fraction of helium from atmospheric, magmatic, and crustal, respectively (Sano et al., 1985; Sano and Wakita, 1985). Using the following values: (3He/4He)a = 1 RA, (4He/20Ne)a = 0.318, (3He/4He)m = 8 RA, (4He/20Ne)m = 1,000, (3He/4He)c = 0.01 RA, (4He/20Ne)c = 1,000. For Cuicocha volcanic lake, helium isotopic composition of bubbling gases samples indicated a predominant crustal and magmatic component, with values ∼53 and ∼41% respectively, and relatively low atmospheric contribution (∼7%; Supplementary Table S2 in Supplementary Material). For Quilotoa volcanic lake, helium isotopic composition of bubbling gases samples indicated that crustal He component is predominant (∼79%), followed by magmatic He contribution (∼16%) and low atmospheric contribution (∼5%; Supplementary Table S2 in Supplementary Material).
Bathymetry Data and Acoustic Anomalies at Quilotoa volcanic Lake
Bathymetry data from the Quilotoa volcanic lake extend across a 2,200 m by 1,560 m oval with the major axis-oriented NW-SE, covering a total surface of 7,100 m2 (Figure 1D). Two bathymetric maps have been made from data of two frequencies: primary at 200 kHz (Figure 9A), and secondary at 83 kHz (Figure 9B). The 200 kHz bathymetric map (Figure 9A) shows a strong anomaly (25 m water depth) surrounded by deep floor (300 m) at the NW of the crater lake. Furthermore, the 83 kHz bathymetric map shows two main anomalies in the center of the deep crater lake (Figure 9B). The northern anomaly (25–30 m water depth) is located at the same place as that identified with 200 kHz. However, a second anomaly is in the SW following a certain NW-SE lineament with the northern anomaly (Figure 9A). Both anomalies are surrounded by a deep basin reaching water depths of 330 m, while the deep floor of the lake is surrounded by a step flank and a rimmed platform at 25–50 m water depth (Figure 9B). Additionally, minor positive anomalies are identified within the flanks, which are also interpreted as minor degassing vents. During the period in which the bathymetric survey was conducted, the lake floor was partially masked by acoustic anomalies from a shallow high-reflective stratified plume that generated backscatter values. The bathymetry shows maximum water depths of 330 m, surrounded by a rimmed platform located between 50 and 75 m (Figures 9A,B).
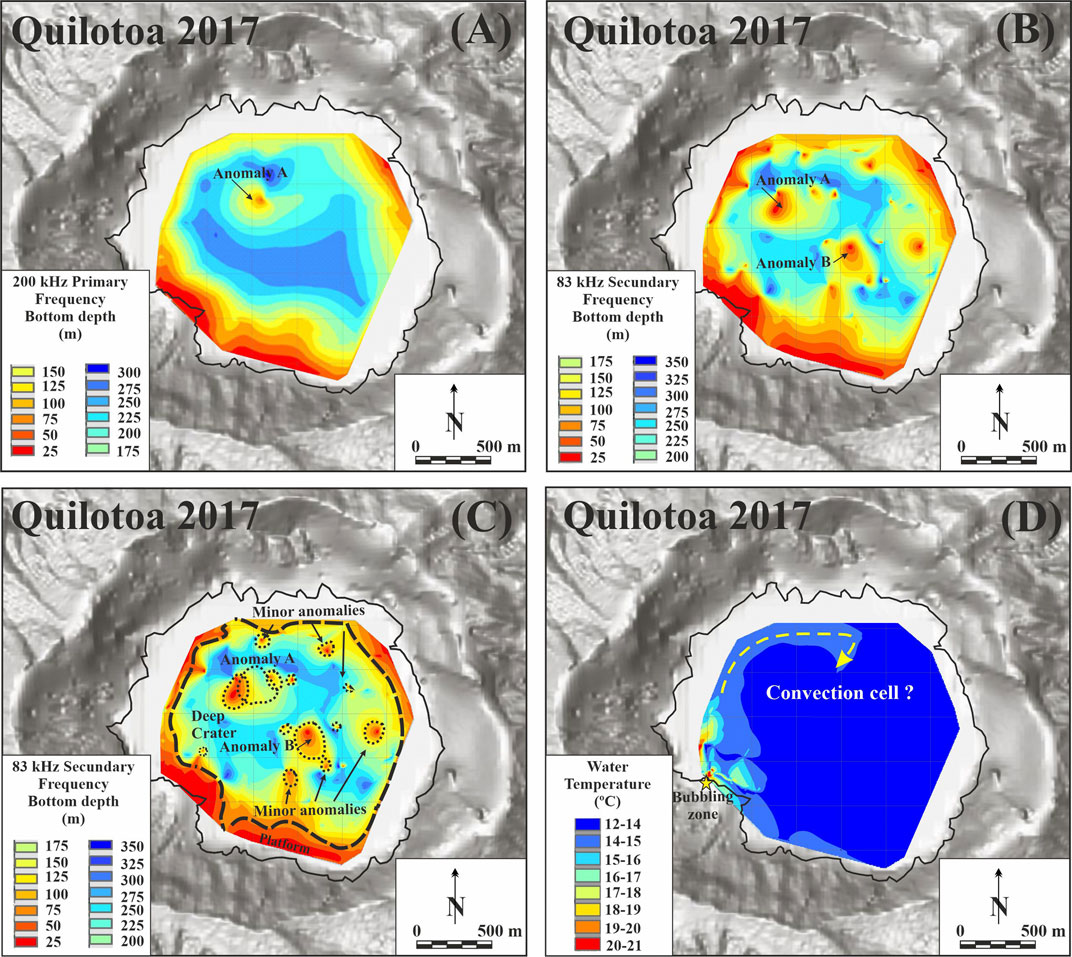
FIGURE 9. Map of the acoustic data of the Quilotoa volcanic lake derived from the two-frequency echosounder: (A) 200 kHz and (B) 83 kHz. (C) Interpretation of the acoustic anomalies and bathymetric data of the volcanic lake. The positive acoustic anomalies (up to 25 m) are interpreted as false echoes caused by high reflective layers at the top of intense degassing vents (A,B). See the text for further explanation. (D) Distribution of surface water temperature of the crater lake obtained from the echosounder sensor.
Discussion
Cuicocha Volcanic Lake
CO2 Diffuse Degassing, Temporal Evolution of Diffuse CO2 Emission, and 3He/4He Isotopic Composition at Cuicocha Volcanic Lake
The observed bimodal distributions reflected the existence of more than one population of CO2 efflux (Figure 2), which suggests the occurrence of different sources for the CO2, as well as the existence of different mechanisms of gas transport (Padrón et al., 2008; Cardellini et al., 2017). In this respect, during the period 2012–2018, Cuicocha volcanic lake presents background CO2 emission values represented predominantly by the diffusion of CO2 through the water-air interface. The mean value of the background with a confidence level of one standard deviation was used to estimate the contribution of CO2 from population I to the CO2 emission of Cuicocha lake, as previously described (Melián et al., 2014). Assuming an area of 3.95 km2 for Cuicocha volcanic lake, the cutoff background emission was estimated as 114 t⋅d−1 and the standard deviation of the background emission was computed as 65 t⋅d−1 for the 16th percentile (−1σ) and 141 t⋅d−1 for the 84th percentile (+1σ). These values are similar to those considered by Sierra et al. (2021), who estimated values of cutoff background emission approximately 79–119 t⋅d−1 (20–30 g⋅m−2·d−1) based on the Graphical Statistical Approach method calculations and the model proposed by Mazot et al. (2014).
The advective mechanism represents an important contribution in population III for Cuicocha volcanic lake, not only by the direct transport to the surface, but also because bubbling contributes to the dissolved CO2, and as such increases the CO2 gradient between the bottom and the surface of the lake. The origin of population III is likely the CO2 released from a magma chamber that escapes to the surface with a crustal CO2 contribution from carbonate decomposition. Thus, the isotopic composition of dissolved gases (see Dissolved and Bubbling Gases at Cuicocha Volcanic Lake section) and the isotopic composition of bubbling gases evidence the existence of deep-seating magmatic degassing that in turn affects the lake.
The temporal evolution of diffuse CO2 emission measured at the water surface is depicted in Figure 4A for Cuicocha volcanic lake (red dots for the present work data, red pentagon for data from Padrón et al. (2008), and red squares for the data from Sierra et al. (2021)), plotted together with the 3He/4He isotopic ratio measured in the bubbling gases collected in the lake in the period 2006–2018 (blue dots for the present work data and blue diamonds for the data from Inguaggiato et al. (2010)). The seismic event data of Cuicocha are from the IG-EPN seismic network and reported by Sierra et al. (2021). The diffuse CO2 emission values for Cuicocha volcanic lake were similar to those reported by Padrón et al. (2008) and Sierra et al. (2021; Figure 4). Cuicocha is a monomictic lake, i.e., it has an overturn period every year from June to August, when circulation reduces the CO2 accumulated in the deepest water. Under these conditions, a maximum CO2 emission to the atmosphere occurs (Padrón et al., 2008). This could be the mechanism that explains the maximum emission rate measured in July 2012, values higher than those estimated as background emission. However, since a much lower value was reported in a survey conducted in 2006 (Padrón et al., 2008), a significant increase in the input of magmatic CO2 cannot be excluded. The magmatic component increased in 2009 as indicated in Supplementary Table S2 (Supplementary Material), and the CO2 released from the fresh magmatic melts persisted during 2009–2012. However, the magmatic He was released more quickly as the magmatic component remained at similar values in 2006 and 2012 and experienced an increase in 2009. Such observations are coherent with the expected geochemical behaviors of He and CO2. It is also worth noting that the CO2 emission peak detected in 2012 occurred after episodes of high LP seismicity at the end of 2011 and beginning of 2012 (Sierra et al., 2021). LP events are generally low-amplitude signals linked to alterations in the shallow hydrothermal system. Such alterations might be due to injection of magmatic fluids that were observed at the surface several months later. 3He/4He ratio measured in bubbling gases in the lake showed an increase from 2006 to 2009 (Figure 4A), which means an increase in the magmatic fraction of helium (Supplementary Table S2 in Supplementary Material). Unfortunately, no data are available between 2009 and 2012 to confirm if the increase persisted after 2009. The increase in magmatic helium emission suggests a magmatic intrusion, which likely occurred in 2009 or before, and injected magmatic gases and perturbed the hydrothermal system, stimulating pressure fluctuations and causing fluid-driven cracks in the volcano-hydrothermal system of Cuicocha.
Lake Water Chemistry and Vertical Profiles at Cuicocha Volcanic Lake
Vertical profiles of water temperature, pH, and EC (Figures 6A–C) showed that Cuicocha volcanic lake is comprised of discrete water masses. The water temperature shows variations at 30 cm depth, which are attributed to environmental influences (Figure 6A). The temperature differences depicted in Figure 6A were observed between the surface waters and 20 m depth in both 2017 and 2018 surveys, and hence the thermal stratification. This observation is consistent with the report of a stratification period (September to May) in Cuicocha volcanic lake by Padrón et al. (2008).
The EC of Cuicocha lake (<700 μS⋅cm−1) is relatively elevated compared to values of the nonactive Ecuadorian Mojanda caldera (35 μS⋅cm−1), reported by Gunkel et al. (2009). In general, anions and cations content are present with higher concentration in the hypolimnetic waters than in the epilimnion (Figures 6D–G). These results are comparable with the data reported by Gunkel et al. (2009). According to the Langelier-Ludwig classification diagram represented in Figure 10A, the samples along the water column display a Ca2+(Mg2+)-HCO3− composition typical of worldwide superficial waters and shallow aquifers (Tassi et al., 2009; Inguaggiato et al., 2010). Inguaggiato et al. (2010) report water composition enriched in Cl− + SO42−, probably because the sample was collected in the bubbling zone richest in Cl− and SO42 located on the northern shores of Yerovi Island. A similar behavior is observed at a depth of 60 m in one of the profiles reported by Gunkel et al. (2009), where an increase in the concentration of CO2 was also registered (Gunkel et al., 2009). The samples of Cuicocha present low values of total dissolved solids (TDS = 269 mg⋅L−1) which could be explained by a weak water-rock interaction due to short residence time and/or low aquifer temperature.
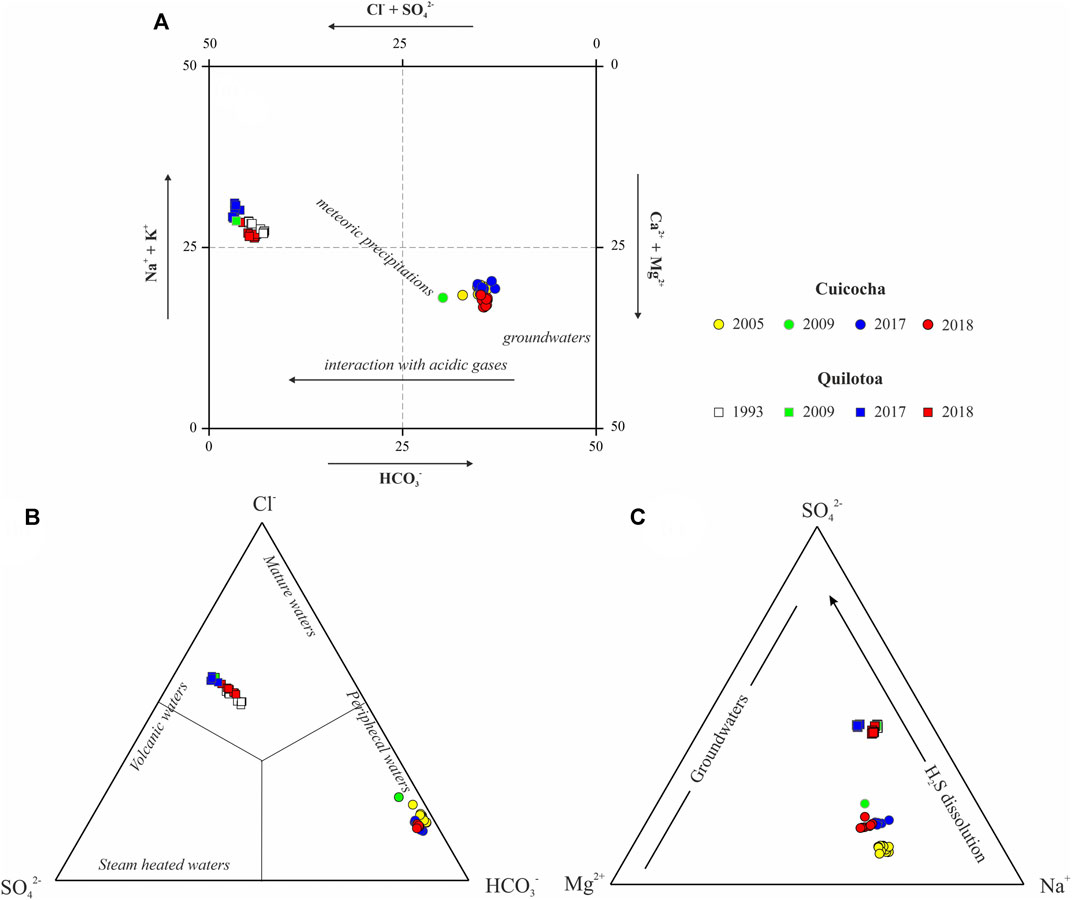
FIGURE 10. (A) Langelier-Ludwig (1942) diagram for the samples along the water column from Cuicocha (dots) and Quilotoa (squares) lakes for the 2017 (blue) and 2018 (red) surveys. Plot of relative (B) HCO3−, SO42−, and Cl− and (C) Na+, SO42−, and Mg2+ contents for the water samples from the Cuicocha (dots) and Quilotoa (square) lakes for the 2017 (blue) and 2018 (red) surveys. Data from Aguilera et al. (2000; white squares), Gunkelet al. (2009; yellow squares), and Inguaggiato et al. (2010; green squares) are also shown.
The relative HCO3−, SO42−, and Cl− contents in the vertical profiles samples are presented in Figure 10B (Giggenbach, 1988) of Cuicocha volcanic lake for the 2017 and 2018 surveys. The samples from the Cuicocha plot close to the HCO3− vertex, in the peripheral waters zone, probably due to gas-water interaction processes, CO2 addition/removal processes in the aquifer (Inguaggiato et al., 2010), and/or addition of organic CO2 from decomposition of plants and animals (Aguilera et al., 2000). The variation of SO42− and Cl− in water samples relative to the volcanic hydrothermal fluids (VHFs), meteoric water (MW), and seawater (SW) end-members (Hernández et al., 2017) is shown in Figure 11. The Cuicocha samples show a low SO42− and Cl− content and plot close to MW, explained by rainfall and input of surface water from the catchment area feed the lake, along with hydrothermal water inflow (Gunkel et al., 2009).
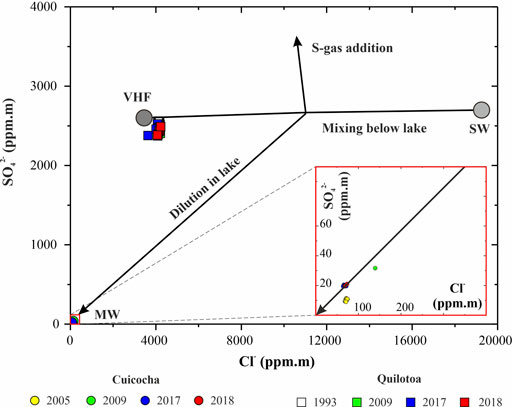
FIGURE 11. Binary diagram of SO42− vs. Cl− for the Cuicocha and Quilotoa water samples collected during the 2017 (blue) and 2018 (red) surveys. Data from Aguilera et al. (2000; white), Gunkelet al. (2009; yellow), and Inguaggiato et al. (2010; green) are also shown. VHF: volcanic hydrothermal fluid; MW: meteoric water and SW: seawater (Hernández et al., 2017).
Values for δ2HVSMOW-H2O and δ18OVSMOW-H2O for Cuicocha profiles are presented in Figure 7, Local Meteoric Water Line (LMWL; δ2H = 6.3×δ18O+8.1; Inguaggiato et al., 2010), and Global Meteoric Water Line (GMWL; δ2H = 8×δ18O+10; Craig, 1961). To evaluate the evaporation process, the isotopic composition of San Vicente, Salinas, and Guapán water from Inguaggiato et al. (2010) is also represented for comparative purposes (Figure 1A). The samples of Cuicocha present values of δ18OVSMOW-H2O and δ2HVSMOW-H2O very close to the LMWL and/or GMWL, suggesting that the volcanic lake water is mainly recharged by local precipitation that is characterized by a short residence time (Giggenbach, 1991). This result is concordant with the low SO42− and Cl− contents shown in Figure 11. There are differences in the δ2HVSMOW-H2O of Cuicocha between waters collected in 2017 and 2018 (∼−6‰). δ2HVSMOW-H2O changes are related to H2S exchange from volcanic gases (Karolyte et al., 2017). During 2017, Cuicocha volcanic lake presents values of CO2 emission and 3He/4He greater than in 2018 (Figure 4), which is consistent with higher values of δ2HVSMOW-H2O.
Dissolved and Bubbling Gases at Cuicocha Volcanic Lake
Dissolved gases in volcanic lakes are excellent tracers of gas-water interaction, due to their high mobility and different solubilities (Capasso and Inguaggiato, 1998; Capasso et al., 2000). The concentrations of dissolved gases (Table 3) in the Cuicocha samples collected during the 2017 and 2018 surveys are higher than expected values for air-saturated water (ASW; Capasso and Inguaggiato, 1998) at the sampling temperature, which suggests an important gas–water interaction. The content of CO2 in all the samples (∼26 cm3·STP·L−1) is much higher than the ASW values (0.32 cm3·STP·L−1). For the 2018 survey, high concentrations of He (∼8·10–3 cm3·STP·L−1) were also measured in the water column (ASW = 4.8·10–5 cm3·STP·L−1). The high concentrations of CO2 and He measured in dissolved gases suggest a significant contribution of such gases from volatile-rich fluids. No significant variation was observed in the chemical and isotopic composition of water in 2018 compared to 2017.
The thermal stratification observed in Cuicocha volcanic lake (Figure 6A) is confirmed by a corresponding stratification of dissolved gases (Figures 8A–E). CO2 concentration in dissolved gases showing a decreasing trend toward the 40 m depth sample (epilimnion zone) could be due to the loss to the atmosphere and photosynthetic utilization, which then increases again to the bottom of the lake (Figure 8A). The CH4 concentrations are lower in the hypolimion with respect to the epilimnion (Figure 8C), while high concentrations of dissolved CO2, H2, and CH4 in water have been observed around 20–40 m (Figures 8A,C,D), in the metalimnion zone. The carbon isotopic signature (Figure 8E) indicates a clear endogenous origin for CO2, with a greater contribution in the metalimnion zone. These results are congruent with the data observed by Gunkel et al. (2009) who observed emission of gases using sonar from the bottom of the crater lake (see Figure 1B).
The relative compositions of both dissolved and bubbling gases are plotted on the CO2-O2-N2 ternary diagram (Figure 8K). All samples of dissolved gases of Cuicocha volcanic lake show an alignment with an O2/N2 ratio at around ASW (∼0.489; Figures 8A,K) and a relative increase of CO2 with depth was also observed (Figure 8A). This result suggests different degrees of interaction between the bubbling gases and the water of Cuicocha volcanic lake. Bubbling gases present an O2/N2 ratio lower than that in air (Figure 8K), highlighting an excess of non-atmospheric N2 and/or a consumption of O2. The O2 consumption due to reducing redox conditions could be the principal process causing the relative N2-enrichment. The relative content of He, N2, and CO2 in the samples of both dissolved and bubbling gases is represented (Figure 8L). All the dissolved gases samples of Cuicocha volcanic lake show very similar He, N2, and CO2 content and He/N2 ratios higher than the atmospheric ratio (∼1.4·10–3). The He/N2 ratios in dissolved gases were very different from those measured in the bubbling gases, except for Cuicocha in the 2017 survey. All bubbling gases samples plot close to the N2 vertex, due principally to reducing redox conditions.
Quilotoa volcanic Lake
CO2 Diffuse Degassing, Temporal Evolution of Diffuse CO2 Emission, and 3He/4He Isotopic Composition at Quilotoa volcanic Lake
As in the Cuicocha volcanic lake, two distinct modes were found at Quilotoa volcanic lake (Figure 2) suggesting a deep perturbation of the volcanic system for the CO2 and/or different mechanisms of gas transport (Padrón et al., 2008; Cardellini et al., 2017). Background CO2 emission values (population I) are predominantly represented by the diffusion of CO2 through water-air interface during the period 2014–2018. The contribution of CO2 from population I to the CO2 emission of Quilotoa lake (3.50 km2) is estimated as 137 t⋅d−1 with a standard deviation as 89 t⋅d−1 for −1σ and 212 t⋅d−1 for the +1σ. Νo previous data are described in the literature. Advection might be the responsible transport mechanism to explain the relatively high observed CO2 efflux values (population III). The isotopic composition of dissolved and bubbling gases (see Dissolved and Bubbling Gases at Quilotoa volcanic Lake section) and the observation of acoustic degassing plumes in Quilotoa (see Acoustic Degassing Plumes and Crater-Lake Bottom Morphology at Quilotoa volcanic Lake section) evidence the existence of deep-seating degassing from the bottom of the crater lake.
Figure 4B shows the temporal evolution of diffuse CO2 emission measured at the water surface from Quilotoa volcanic lake (red dots for present work data), plotted together with the 3He/4He isotopic ratio measured in the bubbling gases (blue dots for present work data and blue diamonds for data from Inguaggiato et al. (2010)). The temporal evolution of diffuse CO2 emission measured from the water surface of Quilotoa volcanic lake during 2014–2018 period and the 3He/4He values at the bubbling gases in the period 2009–2018 present maximum values in 2014 and a decreasing trend until the 2018 survey. Unfortunately, geophysical records are not available nor diffuse CO2 studies prior to 2014. The lack of more records does not allow for the evaluation of the possible origin of this increase; however, it is worth noting that an increase in the magmatic fraction of helium was observed in 2014 (Supplementary Table S2 in Supplementary Material), so an additional contribution of deep-seated fluids to the volcanic system cannot be ruled out.
The differences observed in the 3He/4He ratio measured in bubbling gases reported in this work and by other authors between Cuicocha and Quilotoa could be related to the age of the recent volcanism in both systems: Cuicocha has experienced 4 confirmed holocenic volcanic eruptions and Quilotoa only one. In fact, bubbling gases in Quilotoa show a higher percentage of radiogenic (crustal) He (∼79%) than that in Cuicocha (∼48%), where the magmatic component is higher. It is worth highlighting that the largest magmatic component of Cuicocha bubbling gases was observed in 2009 (Inguaggiato et al., 2010), 2–3 years before the seismic unrest that occurred in the surroundings of Cuicocha. As stated before, a magmatic intrusion, likely occurred in 2009 or before injected magmatic gases, disturbed the hydrothermal system that later originated pressure fluctuations, and caused fluid-driven cracks in the volcano-hydrothermal system of Cuicocha.
Quilotoa presents a relatively low normalized CO2 emission values by area that was approximately ∼94 t⋅d−1·km−2, which is a typical value for lakes filled with neutral pH waters and comparable to other volcanic lakes as Masaya and Apoyeque (Nicaragua; Pérez et al., 2011) and significantly higher than that of Cuicocha. With a value of normalized CO2 emission by area of ∼27 t⋅d−1·km−2, excluding the maximum of the 2012 survey where a contribution of magmatic CO2 cannot be excluded. These values are similar to those estimated in Nejapa (Nicaragua) or Monoun (Cameroon) volcanic lakes (Pérez et al., 2011).
Lake Water Chemistry and Vertical Profiles at Quilotoa volcanic Lake
The water temperatures (Figure 6A), pH (Figure 6B), and EC (Figure 6C) measured during this study in the vertical profiles indicated that Quilotoa volcanic lake is made up of different water masses. The temperature differences depicted in Figure 6A were observed between the surface waters and 30 m depth in both the 2017 and 2018 surveys, and thermal stratification. This observation is consistent with the report by Aguilera et al. (2000). The EC of Quilotoa lake (∼12,000 μS⋅cm−1) was high, compared with Cuicocha lake (<700 μS⋅cm−1) and Mojanda caldera (35 μS⋅cm−1; Gunkel et al., 2009). In general, anions and cations content present higher concentration in the hypolimnetic waters than in the epilimnion ones. The Langelier-Ludwig classification diagram (Figure 10A) shows that the water samples of the Quilotoa volcanic lake plot in the Na+(K+)-Cl-(SO42−) field, typical of crater lakes in active volcanic systems (Delmelle and Bernard 1994; Tassi et al., 2009; Hernández et al., 2017). These results are in accordance with those reported by other authors who observed similar findings about the chemical composition of Quilotoa volcanic lake (Figure 10A; Aguilera et al., 2000; Inguaggiato et al., 2010).
Figure 10B shows the relative HCO3−, SO42−, and Cl− contents in the vertical profiles (Giggenbach, 1988) for Quilotoa volcanic lake for the 2017 and 2018 surveys. Data from Aguilera et al. (2000), Gunkel et al. (2009), and Inguaggiato et al. (2010) are also shown. The water from Quilotoa shows an intermediate composition with a trend observed in the Na+ and SO42− contents (Figure 10C) that suggests the addition of S-rich gases to the lake water. The relatively higher Cl−/SO42− ratios (Figure 11) of Quilotoa samples are probably due to 1) the removal of S (precipitation of SO42− minerals and elementary S and/or bacterial reduction of SO42− to S2− and precipitation of sulfide minerals); 2) the addition of Cl− related to inflow of neutral Na-Cl- geothermal waters or brines; or 3) both (Aguilera et al., 2000). Quilotoa water samples present a typical composition of VHF, a fact that is also endorsed by the δ2HVSMOW-H2O and δ18OVSMOW-H2O values (see Figure 7).
The Quilotoa water samples are all enriched in both δ2HVSMOW-H2O and δ18OVSMOW-H2O relative to the GMWL indicating a different origin and/or that waters have modified their isotopic composition (Figure 7). A very moderate isotopic shift of oxygen can be observed relative to GMWL values by up to +3.5‰ (Figure 7), suggesting the occurrence of enhanced water–rock interactions, mixing with VHF or andesitic water, or/and evaporation processes. There are marked differences in the isotopic composition between the Quilotoa volcanic lake waters collected in 2009 by Inguaggiato et al. (2010) and the samples collected in the present study. Inguaggiato et al. (2010) reported for Quilotoa water samples collected in bubbling gases values of -2.8‰ for δ18OVSMOW-H2O and -39‰ for δ2HVSMOW-H2O. However, in this study, we obtained values for δ18OVSMOW-H2O of ∼ −1.5‰ and δ2HVSMOW-H2O of ∼ −29‰. Different hypotheses could explain the observed changes of δ2HVSMOW-H2O values between the samples collected during 2009 and 2017–2018: 1) changes in evaporation because of an increase in water temperature; 2) increased rainfall (displacement of the data toward the LMWL); 3) incorporation of andesitic water due to an increase in hydrothermal volcanic fluids; and 4) hydrogen exchange between H2S and H2O (Hernández et al., 2017). The concentration of Cl−, SO42− and most cations were similar in Quilotoa for 2009 and this study (2017 and 2018 surveys); therefore, isotopic changes cannot be explained as a consequence of variations in concentration. The water temperature of Quilotoa lake in 2009 (22°C; Inguaggiato et al., 2010) was significantly higher than in 2017 and 2018 (∼13.5°C), so the evaporation process could explain the changes observed in the isotopic composition of water for the different surveys. For Quilotoa volcanic lake, the values reported by Inguaggiato et al. (2010) for the 2009 survey present lighter values with respect to the 2017 and 2018 surveys, indicating an increase in the isotopic exchange of endogenous CO2 with water. A similar behavior was observed for δ2HVSMOW-H2O, showing a shift toward lighter δ2HVSMOW-H2O values, which can be explained in terms of more abundant H2S and associated isotopic exchange (Aguilera et al., 2000). These variations were agreed with the emission CO2 and 3He/4He data observed in 2009 and 2017–2018 from Quilotoa volcanic lake.
Dissolved and Bubbling Gases at Quilotoa volcanic Lake
The concentrations of dissolved gases (Table 3 and Figure 7) in the Quilotoa samples of vertical profiles collected during the 2017 and 2018 surveys are higher than the expected values for ASW (Capasso and Inguaggiato, 1998) at the sampling temperature, which suggests an important gas–water interaction. The content of CO2 in all the samples (∼115 cm3·STP·L−1) is much higher than the ASW values (0.32 cm3·STP·L−1; Capasso and Inguaggiato, 1998). For the 2018 survey, high concentrations of He (∼7.0·10–2 cm3·STP·L−1) were also measured in the water column (ASW = 4.8·10–5 cm3·STP·L−1; Capasso and Inguaggiato, 1998). The high concentrations of CO2 and He measured in dissolved gases suggest a significant contribution of such gases from volatile-rich fluids.
The relative composition of both dissolved and bubbling gases is plotted on a CO2-O2-N2 ternary diagram (Figure 7K). All samples of dissolved gases at Quilotoa show an alignment with an O2/N2 ratio at around ASW (∼0.529) and an increase of CO2 with depth was also observed (Figure 7K). This result suggests different degrees of interaction between the bubbling gases and the water of Quilotoa volcanic lakes. Bubbling gases present an O2/N2 ratio lower than that in air (Figure 7J) with CO2 content and O2/N2 ratio higher than Cuicocha, suggesting a reducing redox condition in Quilotoa volcanic lake.
The relative content of He, N2, and CO2 in the samples of both dissolved and bubbling gases are represented (Figure 7). All the dissolved gases samples of Quilotoa volcanic lake show very similar He, N2, and CO2 content with He/N2 ratios (∼1.35·10–2) higher than the atmospheric and very different from those measured in the bubbling gases. The physicochemical conditions of the Quilotoa volcanic lake (pH, temperature, and salinity) control the behavior of CO2 in water due to the different solubility and reactivity between He and CO2 (Capasso et al., 2000).
The distribution of dissolved H2 and CH4 and CO2, together with the O2/N2 ratios along the Quilotoa vertical profile, are shown in Figure 7L. For Quilotoa volcanic lake, a stratification of the dissolved gases was observed at ∼30 m depth. CO2 and CH4 concentrations in dissolved gases show an increasing trend toward 120–140 m depth (Figures 7F,H). High concentrations of H2 at depth stand out in the 2017 survey (Figure 7G), suggesting a reducing redox condition in Quilotoa volcanic lake. The isotopic signature of carbon (Figure 7J) also indicates a clear endogenous origin for CO2 consistent with the occurrence of significant CO2 sources rising from the bottom of the lake through fumarolic discharges.
Acoustic Degassing Plumes and Crater-Lake Bottom Morphology at Quilotoa volcanic Lake
Based on both frequencies studied (200 and 83 kHz), it can be interpreted that the acoustic data are composed of true and false bathymetric echoes (Figures 6A–C). False echoes forming acoustic positive anomalies are interpreted as zones of intense degassing generating false acoustic domes that mask the real lake floor as reported in other active acid crater lakes and verified in the Taal crater lake 2 years before the explosion of the crater lake, where intense degassing partially masked the lake floor (Hernández et al., 2017). Thus, two main positive anomalies (labeled as A and B in Figures 6A,B) are located in the center of
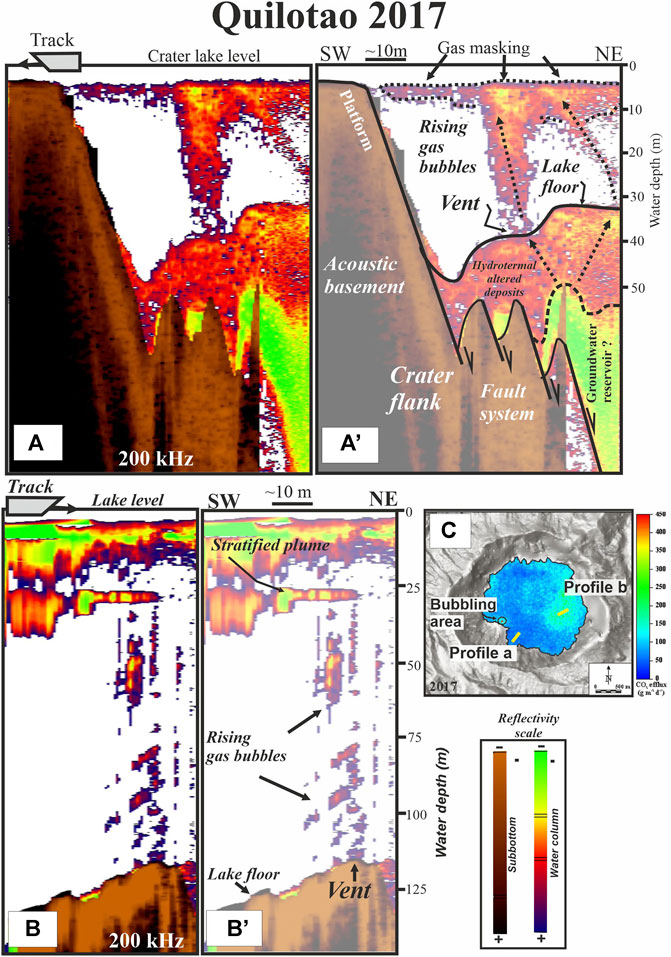
FIGURE 12. Images of the degassing plumes sourced from the Quilotoa crater floor; (A,A’) Shallow-water degassing vents (35 m water depths) on the western flank of the crater lake. Degassing takes place through low-backscatter sediments. (B,B’). Deep-water degassing vent (120 m) located on the eastern flanks and associated with high CO2 flux. (C) Spatial distribution of CO2 efflux at Quilotoa volcanic lake for 2017.
Otherwise, on the eastern side of the crater lake, another degasification plume was identified sourcing from the bottom at 120 m water depths (Figure 12B). The shape of this acoustic plume corresponds to a puffing-like flare caused by intermittent burst of a focused degassing according to the classification mentioned above. In this type of acoustic plumes, frequency of degassing may vary between 1 and 30 s (Melián et al., 2017). Contrary to the observations in the western sector, the degassing is sourced directly from the substrate of the lake bottom. This degassing vent at the bottom of the lake is related to a maximum in the measured CO2 efflux measured on the lake surface in 2017 (Figure 4B, Figure 12C). Above the vertical plume, a highly reflective stratified layer is located at 30 m below the surface of the lake (Figure 12B). We suggest that this stratified acoustic boundary might represent the abrupt increase in the CO2 pressure identified at
Surface Water Temperature Anomalies at Quilotoa volcanic Lake
Surface water temperature has also been obtained from the echosounder sensor (Figure 6D). The intense anomaly detected along the western side (up to 21°C) is related to a bubbling zone identified in the shallow water (Figure 6D). The distribution of the surface temperatures suggests a clockwise convective gyre around the crater lake. Aguilera et al. (2000) calculated the expected changes in density of the Quilotoa crater lake waters at different depths, according to the variations in the temperature. Thus, at 8 m below the surface and a temperature of 20°C, the density is 1.0075 g⋅cm−3, increasing exponentially to 1.0090 g⋅cm−3 as the temperatures drop to values of 10–12°C. Thus, the rapid cooling of these warm water gyre might lead to the sinking of water as it is cooling. This process could trigger the renewal of stratified waters of the crater lake by opening “holes” within the sub-stratified layer of CO2.
Conclusion
This work presents the results of a complete geochemical study of the Ecuadorian volcanic lakes Cuicocha and Quilotoa during the period 2006–2018 (diffuse CO2 emission data of 2006 from Padrón et al. (2008)). Vertical profiles of water temperature, pH, and EC showed that these lakes are made up of different water masses. The water samples from Cuicocha have a Ca2+(Mg2+)–HCO3− composition typical of worldwide shallow waters and aquifers, while those from Quilotoa showed a Na+(K+)–Cl-(SO42-) composition typical of crater lakes in active volcanic systems. These observations are complemented by the δ2HVSMOW-H2O and δ18OVSMOW-H2O values and the observation of acoustic degassing plumes in Quilotoa during the 2017 survey. The high concentrations of CO2 and He measured in dissolved and bubbling gases suggest a significant contribution of such gases from volatile-rich fluids. The thermal stratification observed in Cuicocha volcanic lake is confirmed by a corresponding stratification of dissolved gases. The temporal evolution of diffuse CO2 emission measured from the water surface of Cuicocha and Quilotoa volcanic lakes and the 3He/4He ratio measured at the bubbling gases present maximum values in 2012 and 2014, respectively. The maximum values of diffuse CO2 emission of Cuicocha volcanic lake occurred before high LP seismicity; therefore, an input of magmatic CO2 cannot be excluded. Unfortunately, geophysical records are not available for Quilotoa volcanic lake. The estimated normalized diffuse CO2 emissions from Cuicocha and Quilotoa volcanic lakes were ∼27 t⋅d−1·km−2 (excluding the maximum of the 2012 survey) and ∼94 t⋅d−1·km−2, respectively. These values are of the same order of magnitude as those obtained in other volcanic-hydrothermal systems of the world.
The combination of CO2 efflux, hydrogeochemical (temperature, chemical and isotopic composition of water in vertical profiles, dissolved gases in the water column and bubbling gases) and hydroacoustic (in the case of Quilotoa) studies has been demonstrated to be a powerful tool for monitoring the volcanic activity and to infer the behavior and dynamics of both systems (fluid injections, movement of water masses, origin of dissolved gases, etc).
Cuicocha and Quilota volcanic lakes are potentially dangerous due to the possible accumulation of CO2 (Gunkel et al., 2008). The results observed in this work show the existence of different water masses in both lakes, with an increase in the concentration of dissolved gases with depth. However, no significant temporal variations are observed during the investigated period. The study of diffuse CO2 emissions and possible gas stratifications through ES and vertical profiles of dissolved gases is important for monitoring changes in the volcanic activity and its hazards at these potentially dangerous lakes.
Both lakes present a limited program of volcanic monitoring to date. The presence in Ecuador of volcanoes that present recurrent volcanic events has focused volcanic monitoring efforts on these volcanoes, leaving aside natural hazards associated with volcanic lakes such as Cuicocha and Quilotoa. Their volcanic surveillance should be a priority task, due to the presence of a considerable amount of population living around these lakes. From our point of view, obtaining more complete geophysical data sets (seismic, deformations, etc) to better link temporal variations in lake chemistry, gas flow, temperature, etc. with processes operating at depth within volcanic systems, would be of great scientific and social value. The implementation of a full geophysical program, together with continued monitoring of diffuse CO2 emissions and an increase in the geochemical sampling period, is required in both lakes to effectively monitor volcanic variations and significantly improve the surveillance of these systems.
There are hundreds of volcanic lakes around the world that represent an important hazard due to the potential occurrence of phreatomagmatic or limnic eruptions. The geophysical and geochemical methods used in this study could be applied to these volcanic lakes to monitor their activity and potential hazards.
Data Availability Statement
The raw data supporting the conclusions of this article will be made available by the authors, without undue reservation.
Author Contributions
GM participated in sampling, chemical and isotopic analysis of samples, treatment of data and manuscript writing. TT, NP, PH, LS, EP, and MA-R treatment of data and manuscript writing. TT and EP participated also in the sampling. MC, MA, and CA participated in sampling and contributed chemical and isotopic analysis of samples.
Funding
This research was supported by the project “TFassistance” financed by the Program Tenerife INNOVA of the Cabildo Insular de Tenerife, the Centro Panamericano de Estudios e Investigaciones Geográficas (CEPEIGE) and the Universidad de las Fuerzas Armadas ESPE, Ecuador.
Conflict of Interest
The authors declare that the research was conducted in the absence of any commercial or financial relationships that could be construed as a potential conflict of interest.
Publisher’s Note
All claims expressed in this article are solely those of the authors and do not necessarily represent those of their affiliated organizations, or those of the publisher, the editors and the reviewers. Any product that may be evaluated in this article, or claim that may be made by its manufacturer, is not guaranteed or endorsed by the publisher.
Acknowledgments
Special thanks are given for logistical support from the Reservas Ecológicas Cotocachi-Cayapas and Ilinizas. We would also like to thank Anaí Bustos, Nadia Serrano and all the students at the Universidad de las Fuerzas Armadas ESPE, Ecuador for their participation in the field work. Special thanks to the Brigade of Special Forces Patria of the Ecuadorian Army, for their help during Quilotoa survey in 2014. We would also like to thank Matthew James Pankhurst and Dina Lopez for their revision of written English and constructive comments that greatly improved the quality of paper.
Supplementary Material
The Supplementary Material for this article can be found online at: https://www.frontiersin.org/articles/10.3389/feart.2021.741528/full#supplementary-material
References
Aguilera, E., Chiodini, G., Cioni, R., Guidi, M., Marini, L., and Raco, B. (2000). Water Chemistry of Lake Quilotoa (Ecuador) and Assessment of Natural Hazards. J. Volcanology Geothermal Res. 97, 271–285. doi:10.1016/S0377-0273(99)00168-7
Almeida-Vaca, M. A. (2016). Estudio petrográfico y geoquímico del volcán Cotacachi–provincia de Imbabura. Bachelor's thesis. Quito, Ecuador: Escuela Politécnica Nacional, 107pp.
Andrade, C., Cruz, J. V., Viveiros, F., Branco, R., and Coutinho, R. (2019). CO2 Degassing From Pico Island (Azores, Portugal) Volcanic Lakes. Limnologica. 76, 72–81. doi:10.1016/j.limno.2019.04.001
Andrade, C., Cruz, J. V., Viveiros, F., and Coutinho, R. (2021). Diffuse CO2 Emissions From Sete Cidades Volcanic Lake (São Miguel Island, Azores): Influence of Eutrophication Processes. Environ. Pollut. 268, 115624. doi:10.1016/j.envpol.2020.115624
Andrade, C., Viveiros, F., Cruz, J. V., Coutinho, R., and Silva, C. (2016). Estimation of the CO2 Flux From Furnas Volcanic Lake (São Miguel, Azores). J. Volcanology Geothermal Res. 315, 51–64. doi:10.1016/j.jvolgeores.2016.02.005
Anzidei, M., Carapezza, M. L., Esposito, A., Giordano, G., Lelli, M., and Tarchini, L. (2008). The Albano Maar Lake High Resolution Bathymetry and Dissolved CO2 Budget (Colli Albani Volcano, Italy): Constrains to hazard Evaluation. J. Volcanology Geothermal Res. 171, 258–268. doi:10.1016/j.jvolgeores.2007.11.024
Brehme, M., Giese, R., Dokuz, U. E., and Bulut, F. (2021). Fluid Pathways Identified Beneath Narlı Lake (Central Anatolia) Show the Geothermal Potential of Former Volcanoes. Sci. Rep. 11, 1–8. doi:10.1038/s41598-021-87743-5
Brehme, M., Giese, R., Suherlina, L., and Kamah, Y. (2019). Geothermal Sweetspots Identified in a Volcanic lake Integrating Bathymetry and Fluid Chemistry. Sci. Rep. 9, 1–10. doi:10.1038/s41598-019-52638-z
Bustos-Gordón, E. A., and Serrano-Abarca, N. L. (2014). Análisis de la distribución espacial de la emisión difusa de CO2 en las calderas volcánicas Cuicocha y Quilotoa como sustento técnico para la toma de decisiones en la gestión de riesgos. Bachelor's thesis. Ecuador: Universidad de las Fuerzas Armadas ESPE.Matriz Sangolquí, 118pp.
Capasso, G., Favara, R., and Inguaggiato, S. (2000). Interaction Between Fumarolic Gases and Thermal Groundwaters at Vulcano Island (Italy): Evidences From Chemical Composition of Dissolved Gases in Waters. J. Volcanology Geothermal Res. 102, 309–318. doi:10.1016/s0377-0273(00)00193-1
Capasso, G., and Inguaggiato, S. (1998). A Simple Method for the Determination of Dissolved Gases in Natural Waters. An Application to Thermal Waters From Vulcano Island. Appl. Geochem. 13, 631–642. doi:10.1016/S0883-2927(97)00109-1
Cardellini, C., Chiodini, G., Frondini, F., Avino, R., Bagnato, E., Caliro, S., et al. (2017). Monitoring Diffuse Volcanic Degassing During Volcanic Unrests: the Case of Campi Flegrei (Italy). Sci. Rep. 7, 6757–6815. doi:10.1038/s41598-017-06941-2
Cardellini, C., Chiodini, G., and Frondini, F. (2003). Application of Stochastic Simulation to CO2flux From Soil: Mapping and Quantification of Gas Release. J. Geophys. Res. 108, 2425. doi:10.1029/2002JB002165
Chiodini, G., Cioni, R., Guidi, M., Raco, B., and Marini, L. (1998). Soil CO2 Flux Measurements in Volcanic and Geothermal Areas. Appl. Geochem. 13, 543–552. doi:10.1016/s0883-2927(97)00076-0
Christenson, B. W. (2000). Geochemistry of Fluids Associated With the 1995-1996 Eruption of Mt. Ruapehu, New Zealand: Signatures and Processes in the Magmatic-Hydrothermal System. J. Volcanology Geothermal Res. 97, 1–30. doi:10.1016/S0377-0273(99)00167-5
Clarke, W. B., Jenkins, W. J., and Top, Z. (1976). Determination of Tritium by Mass Spectrometric Measurement of 3He. Int. J. Appl. Radiat. Isotopes. 27, 515–522. doi:10.1016/0020-708X(76)90082-X
Craig, H. (1961). Isotopic Variations in Meteoric Waters. Science. 133, 1702–1703. doi:10.1126/science.133.3465.1702
Craig, H., and Lupton, J. E. (1976). Primordial Neon, Helium, and Hydrogen in Oceanic Basalts. Earth Planet. Sci. Lett. 31, 369–385. doi:10.1016/0012-821x(76)90118-7
Delmelle, P., and Bernard, A. (1994). Geochemistry, Mineralogy, and Chemical Modeling of the Acid Crater Lake of Kawah Ijen Volcano, Indonesia. Geochimica et Cosmochimica Acta. 58, 2445–2460. doi:10.1016/0016-7037(94)90023-x
Deutsch, C., and Journel, A. (1998). GSLIB: Geostatistical Software Library and User’s Guide. New York: Oxford University Press.
Di Muro, A., Rosi, M., Aguilera, E., Barbieri, R., Massa, G., Mundula, F., et al. (2008). Transport and Sedimentation Dynamics of Transitional Explosive Eruption Columns: the Example of the 800 BP Quilotoa Plinian Eruption (Ecuador). J. Volcanology Geothermal Res. 174 (4), 307–324. doi:10.1016/j.jvolgeores.2008.03.002
Garrison, J. M., and Davidson, J. P. (2003). Dubious Case for Slab Melting in the Northern Volcanic Zone of the Andes. Geol. 31 (6), 565–568. doi:10.1130/0091-7613(2003)031<0565:dcfsmi>2.0.co;2
Giggenbach, W. F. (1988). Chemical Techniques in Geothermal Exploration. In:D'Amore, F(coordinator), Application of geochemistry in geothermal reservoir development. Rome: UNITAR/UNDP publication, 119–142. doi:10.1016/0016-7037(88)90143-3
Giggenbach, W. F. (1991). Isotopic Composition of Geothermal Water and Steam Discharges. Application of Geochemistry in Geothermal Reservoir Development. UNITAR, 253–273. (F. D’Amore coordinator).
Giggenbach, W. F. (1992). Isotopic Shifts in Waters From Geothermal and Volcanic Systems Along Convergent Plate Boundaries and Their Origin. Earth Planet. Sci. Lett. 113, 495–510. doi:10.1016/0012-821x(92)90127-h
Goepel, A., Lonschinski, M., Viereck, L., Büchel, G., and Kukowski, N. (2015). Volcano-Tectonic Structures and CO2-Degassing Patterns in the Laacher See Basin, Germany. Int. J. Earth Sci. (Geol Rundsch). 104, 1483–1495. doi:10.1007/s00531-014-1133-3
Gunkel, G., Beulker, C., Grupe, B., and Viteri, F. (2008). Hazards of Volcanic Lakes: Analysis of Lakes Quilotoa and Cuicocha, Ecuador. Adv. Geosci. 14, 29–33. doi:10.5194/adgeo-14-29-2008
Gunkel, G., Beulker, C., Grupe, B., and Viteri, F. (2009). Survey and Assessment of post Volcanic Activities of a Young Caldera lake, Lake Cuicocha, Ecuador. Nat. Hazards Earth Syst. Sci. 9, 699–712. doi:10.5194/nhess-9-699-2009
Gunkel, G., and Beulker, C. (2009). Limnology of the Crater lake Cuicocha, Ecuador, a Cold Water Tropical lake. Internat. Rev. Hydrobiol. 94, 103–125. doi:10.1002/iroh.200811071
Gutscher, M. A., Malavieille, J., Lallemand, S., and Collot, J. Y. (1999). Tectonic Segmentation of the North Andean Margin: Impact of the Carnegie Ridge Collision. Earth Planet. Sci. Lett. 168 (3-4), 255–270. doi:10.1016/s0012-821x(99)00060-6
Hall, M. L., and Mothes, P. A. (2008). Quilotoa Volcano - Ecuador: An Overview of Young Dacitic Volcanism in a Lake-Filled Caldera. J. Volcanology Geothermal Res. 176, 44–55. doi:10.1016/j.jvolgeores.2008.01.025
Hanuš, V. (1987). Deep Seismically Active Fracture Zones in Ecuador and Northern Peru. Stud. Geophys. Geod. 31, 8–25. doi:10.1007/BF01638202
Hernández, P. A., Melián, G. V., Somoza, L., Arpa, M. C., Pérez, N. M., Bariso, E., et al. (2017). The Acid Crater lake of Taal Volcano, Philippines: Hydrogeochemical and Hydroacoustic Data Related to the 2010-11 Volcanic Unrest. Geol. Soc. Lond. Spec. Publications. 437, 131–152. doi:10.1144/SP437.17
Hernández, P. A., Mori, T., Padrón, E., Sumino, H., and Pérez, N. (2011). Carbon Dioxide Emission From Katanuma Volcanic Lake, Japan. Earth Planet. Sp. 63, 1151–1156. doi:10.5047/eps.2011.06.038
Hillebrant, C. (1989). Estudio geovolcanológico del Complejo Volcánico Cuicocha Cotacachi y sus aplicaciones. Provincia de Imbabura. Unpubl. Thesis Escuela Politécnica Nacional. Quito: Ecuador.
Huttunen, J. T., Alm, J., Liikanen, A., Juutinen, S., Larmola, T., Hammar, T., et al. (2003). Fluxes of Methane, Carbon Dioxide and Nitrous Oxide in Boreal Lakes and Potential Anthropogenic Effects on the Aquatic Greenhouse Gas Emissions. Chemosphere. 52, 609–621. doi:10.1016/S0045-6535(03)00243-1
IGEPN (2010). Informe Sísmico para el año 2010. Quito: Ecuador. www.igepn.edu.ec.
IGEPN (2018). Informe Anual del Complejo Volcánico Cotacachi y Cuicocha – 2018. Quito: Ecuador. www.igepn.edu.ec.
IGEPN (2019). Informe Anual del Complejo Volcánico Cotacachi y Cuicocha – 2019. Quito: Ecuador. www.igepn.edu.ec.
Inguaggiato, C., Censi, P., Zuddas, P., D'Alessandro, W., Brusca, L., Pecoraino, G., et al. (2016). Zirconium-Hafnium and Rare Earth Element Signatures Discriminating the Effect of Atmospheric Fallout From Hydrothermal Input in Volcanic Lake Water. Chem. Geology. 433, 1–11. doi:10.1016/j.chemgeo.2016.04.002
Inguaggiato, S., Hidalgo, S., Beate, B., and Bourquin, J. (2010). Geochemical and Isotopic Characterization of Volcanic and Geothermal Fluids Discharged From the Ecuadorian Volcanic Arc. Geofluids. 10, 525–541. doi:10.1111/j.1468-8123.2010.00315.x
Inguaggiato, S., Pecoraino, G., and D'Amore, F. (2000). Chemical and Isotopical Characterisation of Fluid Manifestations of Ischia Island (Italy). J. Volcanology Geothermal Res. 99, 151–178. doi:10.1016/s0377-0273(00)00158-x
Jordán, T. E., Isacks, B. L., Allmendinger, R. W., Brewer, J. A., Ramos, V. A., and Ando, C. J. (1983). Andean Tectonics Related to Geometry of Subducted Nazca Plate. Geol. Soc. America Bull. 94 (3), 341–361. doi:10.1130/0016-7606(1983)94<341:atrtgo>2.0.co;2
Karolyte, R., Serno, S., Johnson, G., and Gilfillan, S. M. V. (2017). The Influence of Oxygen Isotope Exchange Between CO2 and H2O in Natural CO2-Rich Spring Waters: Implications for Geothermometry. J. Appl. Geochem. 84, 173–186.
Matsuda, J., Matsumoto, T., Sumino, H., Nagao, K., Yamamoto, J., Miura, Y., et al. (2002). The 3He/4He Ratio of the New Internal He Standard of Japan (HESJ). Geochem. J. 36, 191–195. doi:10.2343/geochemj.36.191
Mazot, A., Schwandner, F. M., Christenson, B., de Ronde, C. E. J., Inguaggiato, S., Scott, B., et al. (2014). CO2Discharge From the Bottom of Volcanic Lake Rotomahana, New Zealand. Geochem. Geophys. Geosyst. 15, 577–588. doi:10.1002/2013GC004945
Mazot, A., and Taran, Y. (2009). CO2 Flux From the Volcanic Lake of El Chichón (Mexico). Geofísica Int. 48 (1), 73–83. doi:10.22201/igeof.00167169p.2009.48.1.100
Melián, G., Hernández, P. A., Padrón, E., Pérez, N. M., Barrancos, J., Padilla, G., et al. (2014). Spatial and Temporal Variations of Diffuse CO2 degassing at El Hierro Volcanic System: Relation to the 2011-2012 Submarine Eruption. J. Geophys. Res. Solid Earth. 119, 6976–6991. doi:10.1002/2014JB011013
Melián, G., Somoza, L., Padrón, E., Pérez, N. M., Hernández, P. A., Sumino, H., et al. (2017). Surface CO2 Emission and Rising Bubble Plumes from Degassing of Crater Lakes in São Miguel Island, Azores. Geol. Soc. Lond. Spec. Publications 437 (1), 233–252. doi:10.1144/SP437.14
Mothes, P. A., and Hall, M. L. (2008). The Plinian Fallout Associated With Quilotoa's 800 Yr BP Eruption, Ecuadorian Andes. J. Volcanology Geothermal Res. 176, 56–69. doi:10.1016/j.jvolgeores.2008.05.018
Padrón, E., Hernández, P. A., Toulkeridis, T., Pérez, N. M., Marrero, R., Melián, G., et al. (2008). Diffuse CO2 Emission Rate From Pululahua and the Lake-Filled Cuicocha Calderas, Ecuador. J. Volcanology Geothermal Res. 176, 163–169. doi:10.1016/j.jvolgeores.2007.11.023
Panchana-Guerra, C. D. (2015). Estudio de los domos del Volcán Quilotoa y su correlación con la estratigrafía del volcán. Bachelor's thesis. Quito, Ecuador: Escuela Politécnica Nacional, 178pp.
Parkinson, K. J. (1981). An Improved Method for Measuring Soil Respiration in the Field. J. Appl. Ecol. 18, 221–228. doi:10.2307/2402491
Pérez, N. M., Hernández, P. A., Padilla, G., Nolasco, D., Barrancos, J., Melían, G., et al. (2011). Global CO2 Emission From Volcanic Lakes. Geology. 39 (3), 235–238. doi:10.1130/G31586.1
Rodriguez, F., Toulkeridis, T., Sandoval, W., Padilla, O., and Mato, F. (2017). Economic Risk Assessment of Cotopaxi Volcano, Ecuador, in Case of a Future Lahar Emplacement. Nat. Hazards. 85 (1), 605–618. doi:10.1007/s11069-016-2589-1
Rosi, M., Landi, P., Polacci, M., Di Muro, A., and Zandomeneghi, D. (2004). Role of Conduit Shear on Ascent of the Crystal-Rich Magma Feeding the 800-Year-BP Plinian Eruption of Quilotoa Volcano (Ecuador). Bull. Volcanology. 66 (4), 307–321. doi:10.1007/s00445-003-0312-z
Rouwet, D., Christenson, B., Tassi, F., Vandemeulebrouck, J., and Vandemeulebrouck, J. (2015). (Editors). Volcanic Lakes Springer. Advances in Volcanology, 533. doi:10.1007/978-3-642-36833-2
Rouwet, D., Mora-Amador, R., Ramírez-Umaña, C. J., González, G., and Inguaggiato, S. (2017). Dynamic Fluid Recycling at Laguna Caliente (Poás, Costa Rica) Before and During the 2006-Ongoing Phreatic Eruption Cycle (2005-10). Geological Society 437, 73–96. doi:10.1144/SP437.11
Rouwet, D., Tassi, F., Mora-Amador, R., Sandri, L., and Chiarini, V. (2014). Past, Present and Future of Volcanic lake Monitoring. J. Volcanology Geothermal Res. 272, 78–97. doi:10.1016/j.jvolgeores.2013.12.009
Rozanski, K., and Araguás, L. (1995). Spatial and Temporal Variability of Stable Isotope Composition of Precipitation Over the South American continent. Bulletin de l'Institut francais d'etudes andines 24 (3), 379–390.
Sano, Y., Urabe, A., WakitaChiba, H. H., Chiba, H., and Sakai, H. (1985). Chemical and Isotopic Compositions of Gases in Geothermal Fluids in Iceland. Geochem. J. 19, 135–148. doi:10.2343/geochemj.19.135
Sano, Y., and Wakita, H. (1985). Geographical Distribution of3He/4He Ratios in Japan: Implications for Arc Tectonics and Incipient Magmatism. J. Geophys. Res. 90, 8729–8741. doi:10.1029/jb090ib10p08729
Sierra, D., Hidalgo, S., Almeida, M., Vigide, N., Lamberti, M. C., Proaño, A., et al. (2021). Temporal and Spatial Variations of CO2 Diffuse Volcanic Degassing on Cuicocha Caldera Lake - Ecuador. J. Volcanology Geothermal Res. 411, 107145. doi:10.1016/j.jvolgeores.2020.107145
Simkin, T., and Siebert, L. (1994). Volcanoes of the World. Tucson: Smithsonian Institution, Geoscience Press, 349.
Tassi, F., Vaselli, O., Fernández, E., Duarte, E., Martínez, M., Delgado, A., et al. (2009). Morphological and Geochemical Features of Crater Lakes in Costa Rica: an Overview. J. Limnology. 68, 1–13. doi:10.4081/jlimnol.2009.193
Keywords: geochemistry of water, volcanic gases, gas emissions, volcanic lake, Cuicocha and Quilotoa lakes, Ecuador
Citation: Melián GV, Toulkeridis T, Pérez NM, Hernández PA, Somoza L, Padrón E, Amonte C, Alonso M, Asensio-Ramos M and Cordero M (2021) Geochemistry of Water and Gas Emissions From Cuicocha and Quilotoa Volcanic Lakes, Ecuador. Front. Earth Sci. 9:741528. doi: 10.3389/feart.2021.741528
Received: 14 July 2021; Accepted: 11 November 2021;
Published: 13 December 2021.
Edited by:
Agnes Mazot, GNS Science, New ZealandReviewed by:
Ery Catherine Hughes, GNS Science, New ZealandJennifer Lewicki, United States Geological Survey, United States
Copyright © 2021 Melián, Toulkeridis, Pérez, Hernández, Somoza, Padrón, Amonte, Alonso, Asensio-Ramos and Cordero. This is an open-access article distributed under the terms of the Creative Commons Attribution License (CC BY). The use, distribution or reproduction in other forums is permitted, provided the original author(s) and the copyright owner(s) are credited and that the original publication in this journal is cited, in accordance with accepted academic practice. No use, distribution or reproduction is permitted which does not comply with these terms.
*Correspondence: G. V. Melián, Z2xhZHlzQGl0ZXIuZXM=