 Theresa Diener1,2
 Ingo Sasgen2*
 Cécile Agosta3
 Johannes J. Fürst1
 Matthias H. Braun1
 Hannes Konrad4Xavier Fettweis5
- 1Department of Geography and Geosciences, Institute of Geography, Friedrich-Alexander Universität Erlangen-Nürnberg, Erlangen, Germany
- 2Division of Glaciology, Alfred-Wegener-Institut Helmholtz-Zentrum Für Polar- und Meeresforschung, Bremerhaven, Germany
- 3Laboratoire des Sciences du Climat et de l'Environnement (LSCE), Gif-sur-Yvette, France
- 4Satellite-based Climate Monitoring, Deutscher Wetterdienst, Offenbach am Main, Germany
- 5Department of Geography, SPHERES research unit, University of Liège, Liège, Belgium
The dynamic stability of the Antarctic Ice Sheet is one of the largest uncertainties in projections of future global sea-level rise. Essential for improving projections of the ice sheet evolution is the understanding of the ongoing trends and accelerations of mass loss in the context of ice dynamics. Here, we examine accelerations of mass change of the Antarctic Ice Sheet from 2002 to 2020 using data from the GRACE (Gravity Recovery and Climate Experiment; 2002–2017) and its follow-on GRACE-FO (2018-present) satellite missions. By subtracting estimates of net snow accumulation provided by re-analysis data and regional climate models from GRACE/GRACE-FO mass changes, we isolate variations in ice-dynamic discharge and compare them to direct measurements based on the remote sensing of the surface-ice velocity (2002–2017). We show that variations in the GRACE/GRACE-FO time series are modulated by variations in regional snow accumulation caused by large-scale atmospheric circulation. We show for the first time that, after removal of these surface effects, accelerations of ice-dynamic discharge from GRACE/GRACE-FO agree well with those independently derived from surface-ice velocities. For 2002–2020, we recover a discharge acceleration of -5.3 ± 2.2 Gt yr−2 for the entire ice sheet; these increasing losses originate mainly in the Amundsen and Bellingshausen Sea Embayment regions (68%), with additional significant contributions from Dronning Maud Land (18%) and the Filchner-Ronne Ice Shelf region (13%). Under the assumption that the recovered rates and accelerations of mass loss persisted independent of any external forcing, Antarctica would contribute 7.6 ± 2.9 cm to global mean sea-level rise by the year 2100, more than two times the amount of 2.9 ± 0.6 cm obtained by linear extrapolation of current GRACE/GRACE-FO mass loss trends.
1 Introduction
One of the most profound consequences of global warming is the retreat of ice sheets and glaciers worldwide, with the exception of only a few locations (WCRP Global Sea Level Budget Group, 2018). The increasing atmosphere and ocean temperatures in the Arctic have led to substantial ice loss of Arctic glacier systems (Wouters et al., 2019). For the Greenland Ice Sheet, mass loss has exceeded mass gain by about 30% (Sasgen et al., 2020; Velicogna et al., 2020). In Antarctica, current mass loss of grounded ice exceeds mass gain only by about 6%, yet it is progressively increasing (Shepherd et al., 2018; Rignot et al., 2019a). Satellite observations show ice-shelf thinning (Paolo et al., 2015) and collapse (Scambos, 2004) as well as ice-stream thinning and grounding line retreat, inducing changes that propagate far into the ice sheet’s interior (Jenkins et al., 2018; Konrad et al., 2018; Shepherd et al., 2019). Models provide further evidence that such perturbations along the ice sheet margin can entail changes far inland (Fürst et al., 2016; Reese et al., 2018). Since the 1990s, enhanced ice shelf disintegration has occurred along the Antarctic Peninsula, reducing buttressing and causing acceleration of tributary glaciers (De Angelis, 2003; Silva et al., 2020). In the Amundsen Sea Embayment, West Antarctica, submarine melting, enhanced by upwelling of comparably warm Circumpolar Deep Water (Jenkins et al., 2018; Nakayama et al., 2018), has initiated thinning of ice shelves, leading to acceleration of grounded ice propagating inland, further perpetuating retreat and destabilization of the ice sheet in this region (Konrad et al., 2017; Selley et al., 2021). In East Antarctica, in contrast, changes in ice flow or ice shelf stability are less frequent; however, regional grounding line retreat is observed for Totten glacier (Li et al., 2015), while ice-shelf thickening is observed in some parts of Dronning Maud Land (Smith et al., 2020).
With a retrograde bedrock, below current sea level in most parts, West Antarctica is at risk for complete disintegration when ocean temperatures exceed certain thresholds (Sutter et al., 2016; Arthern and Williams, 2017). Simulations five centuries into the future have shown that West Antarctica may eventually contribute up to 3 m of global sea-level rise in high-impact, low-probability scenarios (DeConto and Pollard, 2016), with updated assessments indicating a likely contribution between -7.8 and 30.0 cm in the year 2100 for unmitigated climate change (Seroussi et al., 2020). Furthermore, projections show competing influences of increasing snow accumulation versus increasing ice-dynamic losses in future scenarios for the Antarctic Ice Sheet (Seroussi et al., 2020; Edwards et al., 2021). Separating mass loss acceleration caused by temporary variations in snow accumulation and sustained ice-dynamic trends in satellite observations, and connecting these changes to the respective underlying processes and drivers, is critical for evaluating risks of surpassing dynamical thresholds of ice sheet disintegration (Garbe et al., 2020).
During the past decades, advancements in satellite observation have remarkably improved our capability to monitor the mass balance state of the Antarctic Ice Sheet, augmenting sparse in-situ measurements. Radar and laser altimetry together with models of the snow and firn densification, as well as gravimetry measurements, facilitated differential estimates of mass change at regular time intervals (Shepherd et al., 2018). Equally important, interferometric radar enabled the determination of surface-ice velocities, providing estimates of the changes of the ice-dynamic discharge across the grounding line, representing the mass output of the ice sheet (Mouginot et al., 2014; Rignot et al., 2019a). Together with modelling estimates of the surface-mass balance, the mass input to the ice sheet, the mass balance of the Antarctic Ice sheet has been estimated by subtraction in the so-called mass budget method (Rignot et al., 2008). Using a suite of methods and satellite observations of altimetry, gravimetry and interferometry, the community produced a consensus estimate that the mass change of grounded ice in Antarctica tripled from -53 ± 29 Gt yr−1 to -159 ± 26 Gt yr−1 between 1992 and 2017 (Shepherd et al., 2018).
Here, we aim to estimate ice discharge based on the mass balance equation.
where
The outline of this paper is as follows. First, we describe the input data sets GRACE/GRACE-FO and SMB, along with their uncertainties. Next, we introduce the time series analysis performed on the data in order to recover accelerations of the mass change and their uncertainties. Then, we explain the assumptions underlying the extrapolation of the sea level contributions to the year 2100. After that, we present our estimates of the mass trends, the interannual mass changes and their relation to atmospheric circulation patterns, as well as the mean cumulative discharge rate. Finally, we present accelerations of cumulative discharge in comparison with published values, discuss their drivers and show implications for global sea level rise in the year 2100.
2 Materials and Methods
2.1 GRACE/GRACE-FO Data
We estimate mass changes of the Antarctic Ice Sheet from 2002 to 2020 based on data from the GRACE (2002–2017) and the GRACE-FO (launched 2018, operational) satellite missions that provide nearly continuous monthly measurements of the time-varying gravity field of the Earth. Based on the Stokes potential coefficients (Level-2 data) issued by the missions’ Science Data System (SDS), which are a spherical harmonic representation of the Earth’s gravity field changes, mass redistribution on the Earth surface can be derived (Tapley et al., 2004, 2019). We use Release 06 (RL06) Level-2 data from the three GRACE/GRACE-FO SDS teams; German Research Centre for Geosciences (GFZ) (Dahle et al., 2019), Centre for Space Research University of Texas, Austin, United States (CSR) (Bettadpur, 2018; Save, 2019) and Jet Propulsion Laboratory, California Institute of Technology (JPL) (Yuan, 2019), as well their combination (AV RL06) (Sasgen et al., 2020). A comparison of time series of mass change obtained from the four Level 2 GRACE/GRACE-FO data sets is shown in Supplementary Figure S1.
The data capture 191 out of 218 possible months during the missions’ operation; 163 monthly solutions from GRACE covering April 2002 to June 2017 and 28 solutions from GRACE-FO covering June 2018 to November 2020. To estimate uncertainties in the derived mass change time series associated with processing choices and corrections, we additionally consider Level-3 mass change gridded products for Antarctica provided by the Technical University of Dresden (TUD) published via the GravIS data portal (Sasgen et al., 2019a) and the CSR RL06 Mascons (Save et al., 2016). All GRACE/GRACE-FO Level 2 and 3 data used in this study are publicly available (Data availability).
2.2 Inversion for Mass Change
We invert the monthly GRACE/GRACE-FO gravity fields for mass changes in Antarctica using a spectral inversion method similar to Jacob et al. (2012), modifying the forward modelling approach in the spatial domain previously applied to Antarctica (Sasgen et al., 2013). For this, we define spatial patterns of mass change, from either satellite observations or modelling, within 25 drainage basins of the ice sheet (Figure 1), calculate their spectral gravity field signature, and adjust these spectra by scaling in order to minimize the difference to the observed spectrum represented by the GRACE/GRACE-FO Stokes coefficients. Prior to adjustment, we limit the representation of the GRACE/GRACE-FO coefficients to the region of Antarctica by employing a spectral mask of the ice sheet using a buffer zone of 200 km (Martinec, 1989). Finally, we obtain the total mass change within in each drainage basin by spatial integration of the scaled mass distribution underlying the forward models. The optimal adjustment factors are estimated by weighted least-squares, allowing us to account for the noise structure in the data set of GRACE/GRACE-FO coefficients.
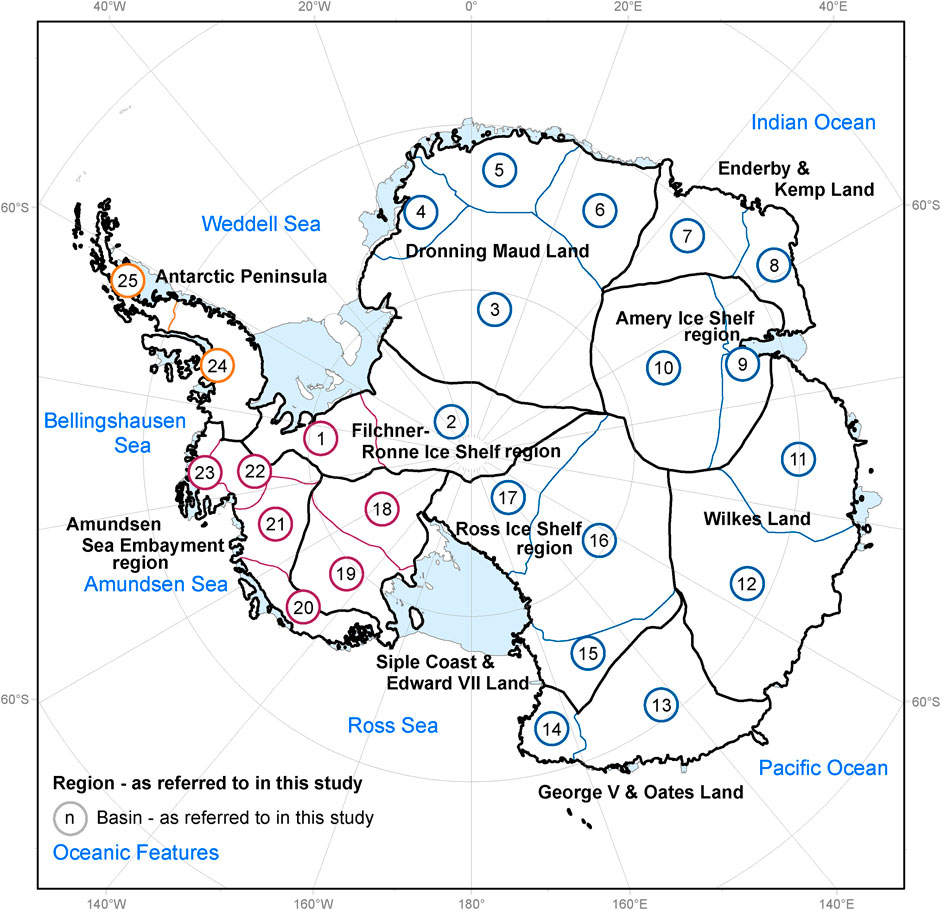
FIGURE 1. Drainage basins and regional division of the Antarctic Ice Sheet. The continental Antarctic Ice Sheet is divided into 25 drainage basins following Sasgen et al. (2013). The basins are further grouped into ten larger entities (regions), named according to their characteristic geographical feature, such as the adjacent ocean embayment or ice shelf (black lines). The basins are attributed to East Antarctica (blue lines), West Antarctica (red lines) and the Antarctic Peninsula (yellow lines). Labels locate geographic features discussed in the text. The projection is Polar Stereographic centered at 90°S and 0°E, with the true latitude of 71°S and WGS84 (EPSG:3031).
We compose a forward model by assuming that the spatial pattern of mass change corresponds to CryoSat-2 rates of mass change (Sasgen et al., 2019b) for trends and accelerations, and the mean surface mass balance (van Wessem et al., 2018) for the remaining, de-trended temporal components. We find that evaluating GRACE/GRACE-FO data at the basin scale is relatively insensitive to the mass distribution underlying the forward model. We quantify the uncertainty of our results associated with these processing choices by comparing with the independently derived Level-3 mass change products TUD COST-G (Sasgen et al., 2019a) and the CSR RL06 Mascons (Save et al., 2016) (Data availability). A sensitivity analysis using a spectral circular mask extending from the South Pole to 60°S, as well as using no masking produces consistent results.
An advantage of the spectral inversion method is that uncertainties of the GRACE/GRACE-FO coefficients can be used directly as weighting factors in the least-squares adjustment without propagation to the spatial domain. Here, we estimate these uncertainties of the GRACE/GRACE-FO coefficients from the root-mean squared residual of each coefficient’s time series. We note that the spectral inversion estimates are very similar to previous results performed in the spatial domain (Sasgen et al., 2013; Sasgen et al., 2019b), however, show a slightly lower noise level and better agreement with the expected fluctuations of the surface mass balance. The results fall within the range of a multi-source ensemble of GRACE mass balances for Antarctica undertaken as part of the Ice Sheet Mass Balance Inter-Comparison Exercise (IMBIE2) (Shepherd et al., 2018) (Supplementary Figure S2).
As a final step, we correct the trends of mass change for each basin for the signal induced by glacial-isostatic adjustment (GIA) using the arithmetic average of the models IJ05 R2 (Ivins et al., 2013), AGE1 (Sasgen et al., 2013) and ICE-6G_D (Peltier et al., 2015) (Supplementary Figure S3). These GIA models are a subset of the larger ensemble investigated for the IMBIE2 (Shepherd et al., 2018) and selected as they have shown to reproduce GPS-inferred uplift rates in Antarctica (Martín-Español et al., 2016), except for high uplift rates measured in the Amundsen Sea Embayment region (Barletta et al., 2018). At the same time, the models are constructed using independent approaches and largely different input data (Supplementary Table S2 in Shepherd et al., 2018), allowing us to reflect regional variability in the GIA patterns. In addition, it has been shown that applying this GIA correction produces GRACE mass rates consistent with CryoSat-2 mass rates for the time period 2011–2017 (Sasgen et al., 2019b). As the consistency with GPS-inferred uplift rates implies similar response magnitudes and patterns, the uncertainty of GIA derived from the model differences is smaller compared to the full IMBIE2 ensemble.
We acknowledge two limitations related to our GIA correction. First, regional optimized models with improved fit to the GPS uplift rates exist for the Amundsen Sea Embayment region (Barletta et al., 2018), the Antarctic Peninsula (Nield et al., 2014), and the Siple Coast (Nield et al., 2016), yielding GIA-induced apparent mass changes of 17 Gt yr−1, 3 Gt yr−1, and a range of ±6–8 Gt yr−1, respectively. However, these predictions are based on regional Earth structure models and cannot be simply superimposed with continent-wide GIA simulations adopting a global average Earth structure. Moreover, it has been shown that adopting a thin elastic lithosphere may produce large localized uplift rates without a large impact on the gravity field change at the spatial resolution of GRACE/GRACE-FO (Sasgen et al., 2017). However, we note that mass loss rates in the Amundsen Sea Embayment region could be underestimated by 10 Gt yr−1 to 14 Gt yr−1 Barletta et al. (2018).
Another limitation is the assumption that GIA is approximately linear over short time periods and has henceforth no impact on accelerations measured with GRACE/GRACE-FO. Barletta et al. (2018) have shown that for Amundsen Sea Embayment region, underlain by a low-viscous upper mantle, the GIA rate increases over time. The authors state an increase of the GIA rates of about 2% per year, equivalent to a per year increase of the GIA-induced apparent rate of mass change of +0.3 Gt yr−1. However, the acceleration of GIA in this region remains an issue of investigation, as it strongly depends on the poorly known load changes during the past century. In addition, adding the effect of this local response based on a specific viscosity structure to the continent-wide GIA corrections would introduce an inconsistency we can not resolve within this study.
2.3 Uncertainty of GRACE/GRACE-FO Mass Change
We estimate the uncertainty of the monthly GRACE/GRACE-FO mass changes at the basin scale from two components; the time varying, normalized noise level of the GRACE/GRACE-FO gravity field solutions, and the residual variability of the mass change within each basin. To obtain the noise level of each monthly solution, we calculate the coefficient’s residual time series
Apart from the stochastic noise associated with the GRACE/GRACE-FO coefficients, long-term mass changes may contain systematic differences arising from processing choices, background models and corrections, such as the GIA correction (Martín-Español et al., 2016; Shepherd et al., 2018) or the ocean and atmosphere de-aliasing during Level-2 data processing (Dobslaw et al., 2017; Hardy et al., 2017). Here, we empirically estimate the uncertainty of the trends and accelerations from the differences of our mass change time series with the publicly available Level-3 mass change products TUD COST-G (Sasgen et al., 2019a) and the CSR RL06 Mascons (Save et al., 2016) (Data availability). To increase the sample size, we estimate the linear trend and acceleration by randomly selecting 163 out of 191 monthly solutions from each data set and repeating this procedure 1,000 times in a bootstrap approach. In addition, we estimate the uncertainty of the GIA adjustment correction based on the standard deviation of model realizations entered into IMBIE2 (Shepherd et al., 2018) (Supplementary Figure S3). The total uncertainty of the GRACE/GRACE-FO trend and acceleration components is estimated as the quadratic sum of the respective propagated monthly uncertainties (stochastic) and the cross-solution empirical uncertainties, including uncertainties of the correction for GIA in the linear trend component (systematic). The standard deviations of the linear trends and accelerations and their stochastic and systematic components are shown in Supplementary Figure S5.
2.4 Surface Mass Balance
We approximate the SMB over the grounded part of the Antarctic Ice Sheet by net accumulation, calculated as total snowfall, minus snowmelt and evaporation based on the re-analyses product ERA-5 of the European Centre for Medium-Range Weather Forecasts (ECMWF) for the time period January 1979 to September 2020 (Copernicus Climate Change Service, 2017). The data are provided on a regular 0.25° × 0.25° geographic grid, yielding a spatial resolution of approximately 15 km along the coast of West Antarctica (latitude ∼73°S). In addition, we use 35 km × 35 km output of regional climate model MARv3.6 (Agosta et al., 2019) for quantifying uncertainties related to the surface mass balance component (see following section). In contrast to the Greenland Ice Sheet, which experiences extensive summer melt, snowfall constitutes almost the entire surface-mass balance over grounded ice in Antarctica. Our analysis of ERA-5 data shows that snowmelt amounts to less than 1% of the regionally averaged surface mass balance, with some exception along the Antarctic Peninsula (up to 4%), confirming previous results (Lenaerts et al., 2012; Agosta et al., 2019). We estimate storage changes as measured by GRACE/GRACE-FO by integrating monthly estimates of SMB, hereafter referred to as cumulative SMB,
2.5 Uncertainty of Surface Mass Balance
We estimate the uncertainty of cumulative SMB based on four model realizations, which involve the ERA-5 reanalysis and three MARv3.6 simulations with different lateral forcing (ECMWF ERA-Interim, MERRA2 and JRA-55) (Agosta et al., 2019). Thus, the uncertainty derived from this ensemble encompasses deviations in the large-scale atmosphere circulation, as well as inherent modelling differences. We separate the uncertainty analysis into three temporal components, reflecting differences between de-trended monthly estimates, the linear trend and the acceleration of the cumulative SMB estimates, respectively. The differences are analyzed for moving 15-years time windows within the time period covered by all four realizations (1979–2015). While deviations of detrended monthly cumulative SMB estimates tend to reflect random fluctuations introduced by differences in the atmosphere forcing and climate modeling, deviations of long-term changes (e.g., trends and accelerations) will arise from potential biases and different sensitivities in the responses of the models to the same forcing. Thus, similar to the GRACE/GRACE-FO analysis, we consider the random monthly uncertainties of ±55 Gt (Supplementary Figure S4) and their propagated uncertainties of the trends and accelerations (hereafter named stochastic; ±10 Gt yr−1 and ±0.5 Gt yr−2, respectively). As a second component, we estimate systematic uncertainties of the SMB trends and accelerations, amounting to ±9 Gt yr−1 and ±0.4 Gt yr−2, respectively (Supplementary Figure S5). The total uncertainty is obtained by quadratic summation of the propagated monthly and the systematic uncertainties.
2.6 Time Series Analysis
For each basin, we decompose the time series of mass change from GRACE/GRACE-FO and cumulative SMB using least-squares linear regression with a quadratic temporal model consisting of offset,
In the regression, we employ time variable (stochastic) monthly uncertainties for GRACE/GRACE-FO, which reduces the influence of low-quality monthly solutions, for example at the end of the GRACE mission in 2017 (Supplementary Figure S4). We assume constant uncertainties and therefore equal weighting for the monthly cumulative SMB estimates, in the absence of representative time-variable monthly uncertainties. Note that throughout this paper, accelerations are presented as the temporal derivative of the rates (factor 1/2 in Eq. 2).
The offset
2.7 Grouping Basins Into Regions
The comparison of GRACE/GRACE-FO mass changes,
2.8 Discharge Estimate and Uncertainties
The mass changes
For fast-flowing ice streams and fixed geometries,
Note that
We compare rates and accelerations of
2.9 Extrapolation of Sea-Level Contribution
In the following, we will extrapolate sea level rise caused by the recovered mass balance trends and ice-dynamic accelerations to the year 2100 (here; 80 years). As a sensitivity experiment, we distinguish between the extrapolation based on the GRACE/GRACE-FO mass balance
The quadratic extrapolation is supported by Ice Sheet Model Intercomparison 6 (ISMIP6) of the Coupled Model Intercomparison Project Phase 6 (CMIP6) projections of Antarctica’s contribution to sea-level rise until the year 2100, which suggest a time evolution well-approximated by a second-order polynomial, across models and model set ups, as well as using various climate forcing (Payne et al., 2021). Note, however, that despite similar temporal characteristics of the projections, the complex interplay of physical processes in response to the climate forcing governs the actual path of each simulation. We chose to extrapolate to the year 2100 as the typical time frame of ice sheet model projections. In addition, (Lowry et al., 2021), show that ice-sheet model projections forced by RCP2.6 and RCP8.5 scenarios become significantly different only after 2100 (at the 68% confidence level).
We would like to emphasize limitations of this extrapolation. First, mass balance and dynamic acceleration are assumed to prevail unchanged until the end of this century, implying no changes in the external forcing. Next, we neglect possible long-term changes in SMB, which have been shown to have an important impact on the sea-level contribution Payne et al. (2021). In addition, we extrapolate present-day mass balance components based on a relatively short time period of 19 years. Wouters et al. (2013) have estimated the uncertainty in mass trend estimates due to stochastic variability of the Antarctic Ice Sheet as function of observation length. For the contribution of SMB and a 19-years time series, Wouters et al. (2013) estimate a stochastic variability of ±3.4 Gt yr−2 for the acceleration (denoted according to Eq. 2) and ±3.9 Gt yr−1 for the rates (Figure 3 in Wouters et al., 2013). In addition, the authors suggest a contribution from ice dynamic variability an order of magnitude lower. The uncertainty of the rates (±3.9 Gt yr−1) and the dynamic acceleration (±0.3 Gt yr−2, denoted according to Eq. 2) caused by stochastic variability is added to the propagated uncertainties of the indirect method in the extrapolation of the sea-level contribution. Note that the uncertainty in the extrapolation is based only on the propagation of the uncertainty of the presented-day trends and accelerations; it does not included process-related uncertainties, which could possibly be estimated in a Monte Carlo approach based on the CMIP6 output. In the following, we assume a volume density of water of 997 kg m−3 and the area of the ocean of 361·106 km2, such that 360 Gt of ice-mass loss causes 1 mm of global mean sea-level rise.
3 Results
3.1 Antarctic Ice-Mass Balance in the GRACE/GRACE-FO Period
Regional mass changes and their associated linear trends are estimated based on 191 monthly GRACE and GRACE-FO gravity solutions for the Antarctic Ice Sheet (Figure 2). For the entire ice sheet, rates of mass change,
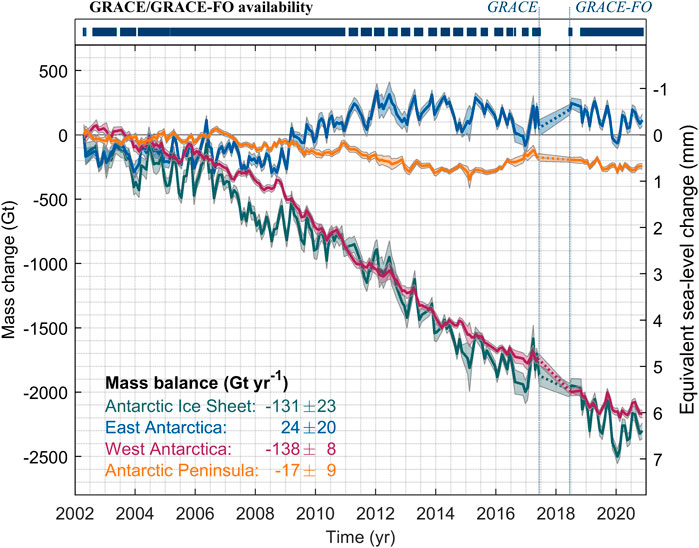
FIGURE 2. Mass change of the Antarctic Ice Sheet from April 2002 to September 2020. Time series of mass change from the GRACE and GRACE-FO missions,
The three main subdivisions of the Antarctic Ice Sheet (Figure 1) show different mass evolutions. The year 2009 marks a transition to mass gain in East Antarctica, continuing until 2012, and increased loss rates in West Antarctica (Figure 2). The mass gain in East Antarctica is mainly a consequence of high precipitation events in Dronning Maud Land (Boening et al., 2012) (Supplementary Figure S6), cancelling out the increasing losses in West Antarctica after 2009 in the mass balance of the whole ice sheet. Apart from long-term trends, all regions exhibit substantial interannual fluctuations (Supplementary Figure S6). East Antarctica contributes the most to the interannual fluctuations of the entire ice sheet, which appear random, however, reflect the superposition of asynchronous mass signals arising from accumulation variability within smaller regions of this largest part of Antarctica, discussed later. In contrast, the mass balance in West Antarctica dominates the mass loss signal of the entire Antarctic Ice Sheet (-138 ± 23 Gt yr−1 versus -131 ± 8 Gt yr−1, respectively), with an additional contribution from the Antarctic Peninsula.
3.2 Interannual Mass Changes due to Snow Accumulation
Next, we investigate the interannual variations of the mass changes
At the basin scale, including the 3-month moving average (Supplementary Figure S6), correlations lie above 0.8 for twelve of the 25 basins. These basins show a large magnitude of the SMB variability with respect to GRACE/GRACE-FO uncertainties. We identify two regions where de-trended GRACE/GRACE-FO mass changes correlate remarkably well with SMB fluctuations; basins 20 through 24 in the Amundsen and Bellingshausen Sea Embayment region (coefficient >0.92) and basins 4 through 8 in Dronning Maud Land (coefficient >0.85). Highly correlated, with coefficients above 0.83, are basins 11 through 13 in East Antarctica, while remaining basins show moderate correlation. For example coefficients for basins 14 through 17, adjacent to the Ross Sea, range between 0.38 and 0.64. A likely reason is that magnitudes of variation in
3.3 Discharge Rates From the Indirect Method
Rates of cumulative discharge,
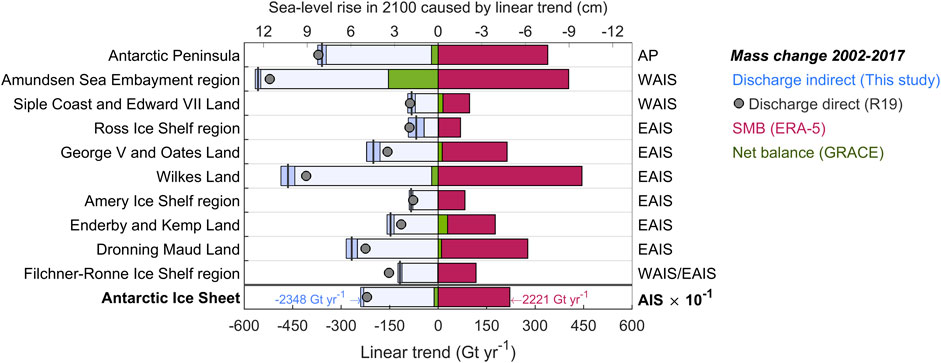
FIGURE 3. Rate of mass change and its components for ten regions in Antarctica for 2002 to 2017. The rate of mass change,
For 2002–2020, we obtain an average annual surface mass balance,
3.4 Discharge Accelerations From the Indirect Method
In the following, we present basin-scale estimates of the acceleration of the mass change from GRACE/GRACE-FO,
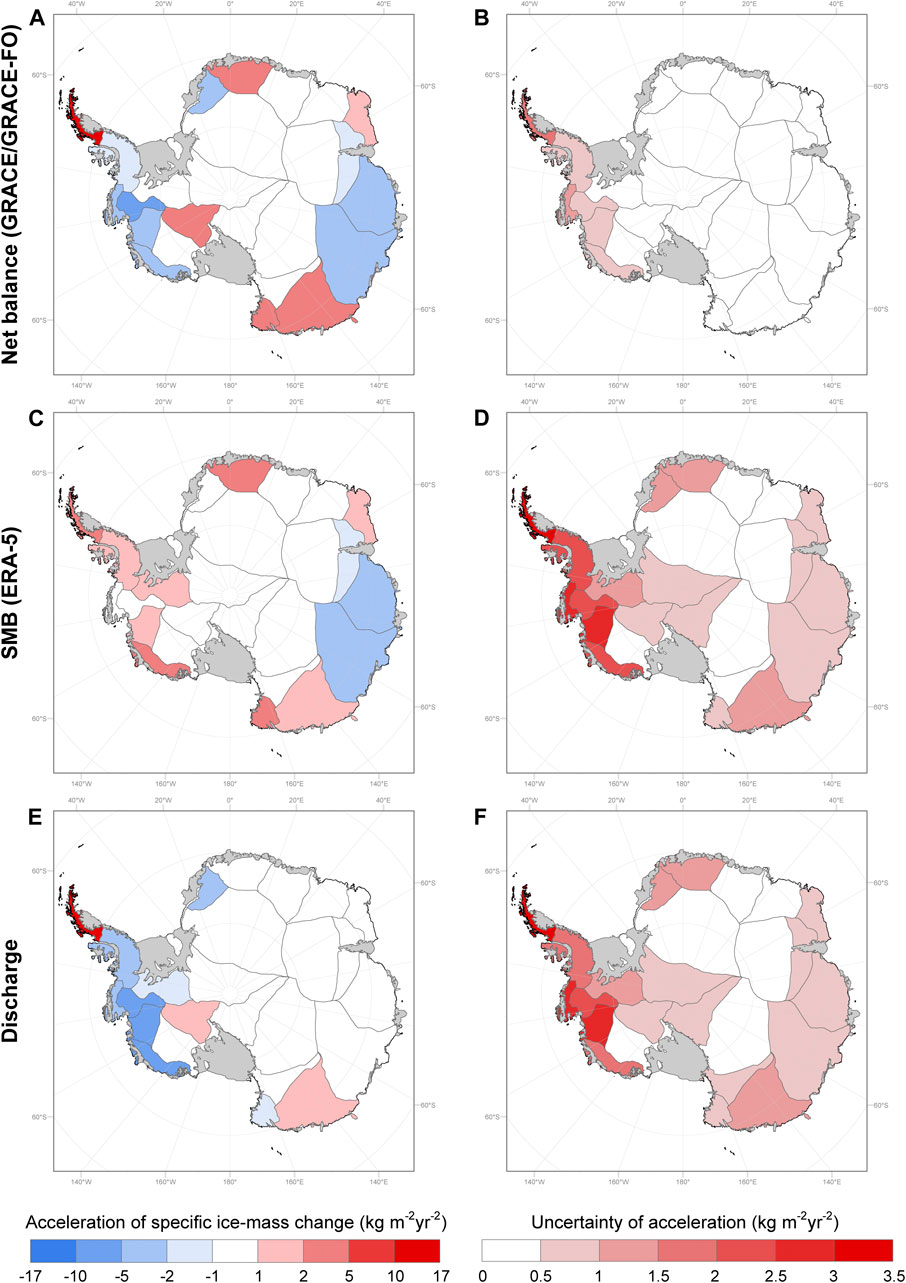
FIGURE 4. Acceleration of mass change and its components for 25 drainage basins in Antarctica between 2002 and 2020. Shown are the accelerations of (A) mass change
3.4.1 GRACE/GRACE-FO Mass Change
The GRACE/GRACE-FO data recover dominant accelerations of mass change
3.4.2 Surface-Mass Balance
In contrast to the mass change, SMB exhibits less heterogeneous acceleration estimates in 2002–2020, with positive values of
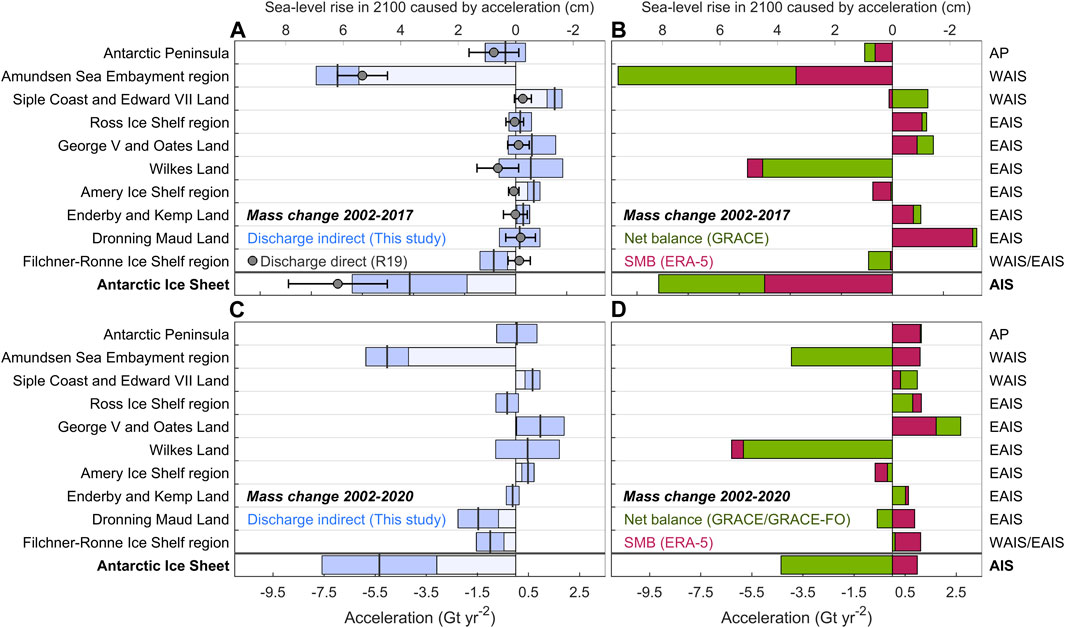
FIGURE 5. Acceleration of cumulative ice-dynamic discharge for ten regions in Antarctica. (A) The acceleration of cumulative discharge,
3.4.3 Ice-Dynamic Discharge
The acceleration of
The dominant uncertainty in our indirect estimate of the cumulative discharge acceleration is introduced by uncertainties of the SMB component, typically between ±0.2 Gt yr−2 and ±0.4 Gt yr−2 for each basin (Supplementary Figure S5). These exceed uncertainties of the GRACE/GRACE-FO accelerations by a factor of about three for all basins. However, there are differences in the patterns of the uncertainties from GRACE/GRACE-FO and the SMB component (Figure 4). The GRACE/GRACE-FO uncertainties are introduced mainly by stochastic uncertainties of the GRACE/GRACE-FO coefficients (Supplementary Figure S5), known to increase towards lower latitudes. Consequently, basins covering areas further away from the pole show larger uncertainties. In contrast, SMB uncertainties are largest in high-accumulation areas such as coastal West Antarctica, pointing to systematic, signal-dependent uncertainties, inferred from the differences between SMB models (Supplementary Figure S5). Therefore, accelerations of cumulative discharge estimated by the indirect method depend critically on the accuracy of the SMB component and similar analysis will profit from future model developments (Mottram et al., 2020).
4 Discussion
4.1 Antarctic Ice-Mass Balance in the GRACE/GRACE-FO Period
Concerning rates of mass change,
4.2 Atmospheric Circulation Patterns and Snow Accumulation
To show the impact of atmospheric circulation patterns in the Southern Hemisphere on the interannual mass changes presented earlier, we now calculate temporal correlations with climate indices. In particular, we investigate the Southern Oscillation Index (SOI) (Parker, 1983) and the Southern Annular Mode (SAM) (Thompson, 2002), reflecting atmosphere pressure differences, as well as the NIÑO 3.4/4 indices, derived from gradients in sea-surface temperatures in the central Pacific (Trenberth, 1975). Previous studies have shown correlation of these indices with monthly rates of precipitation in Antarctica (Turner, 2004). As we analyze storage changes of the ice sheet represented by cumulative sums of monthly fluxes, we cumulate the indices analogous to the processing of the SMB data to enable a direct comparison.
The cumulative SMB,
The results show that interannual variations of
4.3 Comparison of the Direct and Indirect Acceleration Estimates
For the entire Antarctic Ice Sheet, as well as for eight out of the ten regions, accelerations of cumulative discharge obtained in this study show agreement with the independent direct estimates within uncertainties between 2002 and 2017 (Rignot et al., 2019b) (Figure 5). Largest values of acceleration of
We further investigate the robustness of our approach to recover the quasi-stationary accelerations of
In contrast to the uncertainties of the rates of
4.4 Relation to Drivers of Changing Ice Discharge
Our study locates the largest acceleration of
For many glacier systems, retreating and thinning ice shelves have triggered fundamental ice-dynamic responses. For example, the mass loss of the Getz Ice Shelf (adjacent to basin 20) was followed by an increase in the velocity of the tributary glaciers in the period of 2007–2013, as well as dynamic glacier thinning and grounding line retreat between 2010 and 2013 (Joughin et al., 2014; Rignot et al., 2014; Chuter et al., 2017; Gardner et al., 2018). An increase in ice discharge by 6% is determined for the Pine Island, Thwaites, Haynes, Pope, Smith and Kohler Glaciers between 2008 and 2015, which equals an acceleration of -2.4 Gt yr−2 (Gardner et al., 2018), somewhat lower than in this study (basins 21 and 22; -3.1 ± 0.7 Gt yr−2). Overall, our estimates of cumulative discharge acceleration are in line with the increase of 77% in this sector from 1973 to 2013 (Rignot et al., 2019a).
In basins 1 and 2 of the Filchner-Ronne Ice Shelf region, we detect moderate acceleration of
For the Antarctic Peninsula, our results show no significant change in ice-dynamic discharge, which is in contrast to the direct estimates, indicating moderate acceleration (Figure 5). At the basin scale, we identify discharge deceleration (+1.3 ± 0.4 Gt yr−2) in northern and acceleration (-1.2 ± 0.7 Gt yr−2) in the southern part of the Antarctic Peninsula (Figure 4). Evaluating GRACE/GRACE-FO data over this elongated and narrow region is challenging and may be subject to biases introduced by processing choices, even though our analysis using published mass change products CSR RL06 Mascons and TUD COST-G yields consistent results. In addition, estimates of the SMB component could be biased due to the limited resolution of the ERA-5 re-analysis data. This could be clarified in future studies using higher resolution products. However, projections suggest that glacier discharge is substantially less sensitive to collapse of the Larsen C Ice Shelf along the northern Peninsula (basin 25) than the southern George IV Ice Shelf (basin 24) (Schannwell et al., 2018). Less frequent events of ice shelf disintegration compared to the 1990s are possibly related to incipient near-surface temperature cooling (Turner et al., 2016), even though most observations indicate increasing discharge for both basins (Wouters et al., 2015; Cook et al., 2016; Hogg et al., 2017).
In contrast to most of West Antarctica, cumulative discharge decelerates along the Siple Coast and Edward VII Land (basins 18 and 19; +0.7 ± 0.3 Gt yr−2) feeding the Ross Ice Shelf. During the last 4 decades, glaciers along the Siple Coast showed reduced ice flow (Rignot et al., 2019a) and experienced mass gain between 1992 and 2017 (Schröder et al., 2019). The Whillans Ice Stream is anticipated to slow down (Joughin et al., 2005), and stagnate by 2070 (Thomas et al., 2013), in-line with a discharge deceleration of 25.3% during 1997 and 2009, when including the adjacent Mercer Ice Stream (Gardner et al., 2018). The reduction in ice velocity is not only present near the grounding line, where the mass loss finally occurs, but reaches a few hundred kilometers inland (Scheuchl et al., 2012).
The Ross Ice Shelf region in East Antarctica (basins 15 through 17) include complex terrain of the Transantarctic Mountains (Fretwell et al., 2013). For this region, our estimates of acceleration
George V and Oates Land (basins 13 and 14) show moderate dynamic deceleration,
For Wilkes Land (basins 11 and 12), East Antarctica, we identify no significant acceleration of
The Amery Ice Shelf region exhibits only small values of dynamic acceleration
Enderby Land and Kemp Land (basins 7 and 8) show no sign of acceleration of cumulative discharge in the investigation period, in agreement with direct observations (Figure 5). However, for Dronning Maud Land (basins 3 through 6) we isolate an acceleration of -1.5 ± 0.8 Gt yr−2 for
4.5 Extrapolated Sea-Level Contribution From Antarctica
Next we extrapolate the present-day mass balance (-131 ± 23 Gt yr−1) together with the acceleration of
The extrapolation including accelerations yields with 7.6 ± 2.9 cm a sea-level contribution that lies within the medium range of -8 and 30 cm of CMIP5/ISMIP6 projections for unmitigated climate change (Seroussi et al., 2020) and the CMIP6/ISMIP6 ensemble evaluation of Edwards et al. (2021), projecting likely contribution between -5 and 14 cm by year 2100. Lowry et al. (2021) show that limiting projections to trajectories satisfying present-day observations considerably reduces the ensemble spread caused by uncertainties in model parameters, for example related to ice rheology and sliding. As the uncertainty of the present-day observations expressed as sea-level rise in 2100 (±2.9 cm) is considerably lower than the ensemble spread, we expect that evaluating the projection ensembles with observed trends and accelerations will further confine the range of likely trajectories.
We emphasize the severe limitation that our extrapolation assumes constant rate of
5 Conclusion
The mass evolution of the Antarctic Ice Sheet is a crucial factor for projecting future sea level rise. We have investigated accelerations of mass change
Assuming that acceleration of cumulative discharge and current rates of mass loss are persistent features in Antarctica, we obtain, by extrapolation, a contribution of 7.6 ± 2.9 cm of the ice sheet to global mean sea level rise by the year 2100. Our extrapolation to 2100 falls within with the range of -5–14 cm of sea-level rise obtained from larger CMIP6/ISMIP6 ensembles of numerical projections (Edwards et al., 2021), indicating the potential of present-day trend and acceleration estimates to further tighten the range of plausible model trajectories (Lowry et al., 2021). We conclude that satellite monitoring is essential for identifying the current evolution pathway of Antarctica, offering a valuable constraint on complex projections of future sea-level rise.
Data Availability Statement
The raw data supporting the conclusion of this article will be made available by the authors, without undue reservation.
Author Contributions
TD and IS developed the study and carried out the data analysis. CA and XF provided MAR model output and provided input to the SMB analysis. JJF supported the detailed analysis with regard to ice-dynamic adjustment and the interpretation of ice-discharge variations. MHB provided input to the regional analysis of the Antarctic Peninsula. HK provided input to the regional analysis of West and East Antarctica. All authors contributed the writing and editing of the paper.
Funding
IS acknowledges funding by the Helmholtz Climate Initiative REKLIM (Regional Climate Change), a joint research project of the Helmholtz Association of German Research Centres (HGF), as well as support by the Open Access Publication Funds of Alfred-Wegener-Institut Helmholtz-Zentrum für Polar-und Meeresforschung.
Conflict of Interest
The authors declare that the research was conducted in the absence of any commercial or financial relationships that could be construed as a potential conflict of interest.
Publisher’s Note
All claims expressed in this article are solely those of the authors and do not necessarily represent those of their affiliated organizations, or those of the publisher, the editors and the reviewers. Any product that may be evaluated in this article, or claim that may be made by its manufacturer, is not guaranteed or endorsed by the publisher.
Acknowledgments
The authors kindly thank Jonathan L. Bamber and Anthony Mémin for their constructive comments that have helped us improve our manuscript. Further, we thank Thomas Vikhamar Schuler for additional comments and his editorial assistance in the publication process.
Supplementary Material
The Supplementary Material for this article can be found online at: https://www.frontiersin.org/articles/10.3389/feart.2021.741789/full#supplementary-material
References
Agosta, C., Amory, C., Kittel, C., Orsi, A., Favier, V., Gallée, H., et al. (2019). Estimation of the Antarctic Surface Mass Balance Using the Regional Climate Model MAR (1979-2015) and Identification of Dominant Processes. The Cryosphere 13, 281–296. doi:10.5194/tc-13-281-2019
Arthern, R. J., and Williams, C. R. (2017). The Sensitivity of West Antarctica to the Submarine Melting Feedback. Geophys. Res. Lett. 44, 2352–2359. doi:10.1002/2017GL072514
Barker, L. J., Hannaford, J., Chiverton, A., and Svensson, C. (2016). From Meteorological to Hydrological Drought Using Standardised Indicators. Hydrol. Earth Syst. Sci. 20, 2483–2505. doi:10.5194/hess-20-2483-2016
Barletta, V. R., Bevis, M., Smith, B. E., Wilson, T., Brown, A., Bordoni, A., et al. (2018). Observed Rapid Bedrock Uplift in Amundsen Sea Embayment Promotes Ice-Sheet Stability. Science 360, 1335–1339. doi:10.1126/science.aao1447
Bettadpur, S. (2018). GRACE UTCSR Level-2 Processing Standards Document for Level-2 Product Release 0006. Available at: ftp://isdcftp.gfz-potsdam.de/grace/DOCUMENTS/Level-2/GRACE_CSR_L2_Processing_Standards_Document_for_RL06.pdf.
Boening, C., Lebsock, M., Landerer, F., and Stephens, G. (2012). Snowfall‐driven Mass Change on the East Antarctic Ice Sheet. Geophys. Res. Lett. 39, L21501. doi:10.1029/2012gl053316
Brancato, V., Rignot, E., Milillo, P., Morlighem, M., Mouginot, J., An, L., et al. (2020). Grounding Line Retreat of Denman Glacier, East Antarctica, Measured with COSMO‐SkyMed Radar Interferometry Data. Geophys. Res. Lett. 47, e2019GL086291. doi:10.1029/2019GL086291
Chuter, S. J., Martín-Español, A., Wouters, B., and Bamber, J. L. (2017). Mass Balance Reassessment of Glaciers Draining into the Abbot and Getz Ice Shelves of West Antarctica. Geophys. Res. Lett. 44, 7328–7337. doi:10.1002/2017GL073087
Cook, A. J., Holland, P. R., Meredith, M. P., Murray, T., Luckman, A., and Vaughan, D. G. (2016). Ocean Forcing of Glacier Retreat in the Western Antarctic Peninsula. Science 353, 283–286. doi:10.1126/science.aae0017
Copernicus Climate Change Service (2017). ERA5: Fifth Generation of ECMWF Atmospheric Reanalyses of the Global Climate. Copernicus Climate Change Service Climate Data Store (CDS), Date of Access. Available at: https://cds.climate.copernicus.eu/cdsapp#!/home (Accessed November 4, 2019).
Cullather, R. I., Bromwich, D. H., and Van Woert, M. L. (1996). Interannual Variations in Antarctic Precipitation Related to El Niño-Southern Oscillation. J. Geophys. Res. 101, 19109–19118. doi:10.1029/96JD01769
Dahle, C., Murböck, M., Flechtner, F., Dobslaw, H., Michalak, G., Neumayer, K., et al. (2019). The GFZ GRACE RL06 Monthly Gravity Field Time Series: Processing Details and Quality Assessment. Remote Sensing 11, 2116. doi:10.3390/rs11182116
De Angelis, H., and Skvarca, P. (2003). Glacier Surge after Ice Shelf Collapse. Science 299, 1560–1562. doi:10.1126/science.1077987
DeConto, R. M., and Pollard, D. (2016). Contribution of Antarctica to Past and Future Sea-Level Rise. Nature 531, 591–597. doi:10.1038/nature17145
Dobslaw, H., Bergmann-Wolf, I., Dill, R., Poropat, L., Thomas, M., Dahle, C., et al. (2017). A New High-Resolution Model of Non-tidal Atmosphere and Ocean Mass Variability for De-aliasing of Satellite Gravity Observations: AOD1B RL06. Geophys. J. Int. 211, 263–269. doi:10.1093/gji/ggx302
Durand, G., and Pattyn, F. (2015). Reducing Uncertainties in Projections of Antarctic Ice Mass Loss. The Cryosphere 9, 2043–2055. doi:10.5194/tc-9-2043-2015
Edwards, T. L., Nowicki, S., Marzeion, B., Hock, R., Goelzer, H., Seroussi, H., et al. (2021). Projected Land Ice Contributions to Twenty-First-century Sea Level Rise. Nature 593, 74–82. doi:10.1038/s41586-021-03302-y
Fogt, R. L., and Bromwich, D. H. (2006). Decadal Variability of the ENSO Teleconnection to the High-Latitude South Pacific Governed by Coupling with the Southern Annular Mode*. J. Clim. 19, 979–997. doi:10.1175/JCLI3671.1
Fretwell, P., Pritchard, H. D., Vaughan, D. G., Bamber, J. L., Barrand, N. E., Bell, R., et al. (2013). Bedmap2: Improved Ice Bed, Surface and Thickness Datasets for Antarctica. Cryosphere Discuss. 7, 375. doi:10.5194/tcd-6-4305-2012
Fürst, J. J., Durand, G., Gillet-Chaulet, F., Tavard, L., Rankl, M., Braun, M., et al. (2016). The Safety Band of Antarctic Ice Shelves. Nat. Clim Change 6, 479–482. doi:10.1038/nclimate2912
Garbe, J., Albrecht, T., Levermann, A., Donges, J. F., and Winkelmann, R. (2020). The Hysteresis of the Antarctic Ice Sheet. Nature 585, 538–544. doi:10.1038/s41586-020-2727-5
Gardner, A. S., Moholdt, G., Scambos, T., Fahnstock, M., Ligtenberg, S., van den Broeke, M., et al. (2018). Increased West Antarctic and Unchanged East Antarctic Ice Discharge over the Last 7 Years. The Cryosphere 12, 521–547. doi:10.5194/tc-12-521-2018
Gomez, N., Mitrovica, J. X., Tamisiea, M. E., and Clark, P. U. (2010). A New Projection of Sea Level Change in Response to Collapse of marine Sectors of the Antarctic Ice Sheet. Geophys. J. Int. 180, 623–634. doi:10.1111/j.1365-246X.2009.04419.x
Greenbaum, J. S., Blankenship, D. D., Young, D. A., Richter, T. G., Roberts, J. L., Aitken, A. R. A., et al. (2015). Ocean Access to a Cavity beneath Totten Glacier in East Antarctica. Nat. Geosci 8, 294–298. doi:10.1038/ngeo2388
Hardy, R. A., Nerem, R. S., and Wiese, D. N. (2017). The Impact of Atmospheric Modeling Errors on GRACE Estimates of Mass Loss in Greenland and Antarctica. J. Geophys. Res. Solid Earth 122, 10,440–10,458. doi:10.1002/2017JB014556
Hogg, A. E., Shepherd, A., Cornford, S. L., Briggs, K. H., Gourmelen, N., Graham, J. A., et al. (2017). Increased Ice Flow in Western Palmer Land Linked to Ocean Melting. Geophys. Res. Lett. 44, 4159–4167. doi:10.1002/2016gl072110
Ivins, E. R., James, T. S., Wahr, J., O. Schrama, E. J., Simon, K. M., and Simon, K. M. (2013). Antarctic Contribution to Sea Level Rise Observed by GRACE with Improved GIA Correction. J. Geophys. Res. Solid Earth 118, 3126–3141. doi:10.1002/jgrb.50208
Jacob, T., Wahr, J., Pfeffer, W. T., and Swenson, S. (2012). Recent Contributions of Glaciers and Ice Caps to Sea Level Rise. Nature 482, 514–518. doi:10.1038/nature10847
Jenkins, A., Shoosmith, D., Dutrieux, P., Jacobs, S., Kim, T. W., Lee, S. H., et al. (2018). West Antarctic Ice Sheet Retreat in the Amundsen Sea Driven by Decadal Oceanic Variability. Nat. Geosci 11, 733–738. doi:10.1038/s41561-018-0207-4
Joughin, I., Bindschadler, R. A., King, M. A., Voigt, D., Alley, R. B., Anandakrishnan, S., et al. (2005). Continued Deceleration of Whillans Ice Stream, West Antarctica. Geophys. Res. Lett. 32, n/a. doi:10.1029/2005gl024319
Joughin, I., Smith, B. E., and Medley, B. (2014). Marine Ice Sheet Collapse Potentially under Way for the Thwaites Glacier Basin, West Antarctica. Science 344, 735–738. doi:10.1126/science.1249055
Joughin, I., and Tulaczyk, S. (2002). Positive Mass Balance of the Ross Ice Streams, West Antarctica. Science 295, 476–480. doi:10.1126/science.1066875
Kaitheri, A., Mémin, A., and Rémy, F. (2021). Inter-Annual Variability in the Antarctic Ice Sheets Using Geodetic Observations and a Climate Model. Remote Sensing 13, 2199. doi:10.3390/rs13112199
Konrad, H., Gilbert, L., Cornford, S. L., Payne, A., Hogg, A., Muir, A., et al. (2017). Uneven Onset and Pace of Ice‐dynamical Imbalance in the Amundsen Sea Embayment, West Antarctica. Geophys. Res. Lett. 44, 910–918. doi:10.1002/2016GL070733
Konrad, H., Shepherd, A., Gilbert, L., Hogg, A. E., McMillan, M., Muir, A., et al. (2018). Net Retreat of Antarctic Glacier Grounding Lines. Nat. Geosci 11, 258–262. doi:10.1038/s41561-018-0082-z
Lenaerts, J. T. M., van den Broeke, M. R., van de Berg, W. J., van Meijgaard, E., and Kuipers Munneke, P. (2012). A New, High-Resolution Surface Mass Balance Map of Antarctica (1979-2010) Based on Regional Atmospheric Climate Modeling: SMB ANTARCTICA. Geophys. Res. Lett. 39, n/a. doi:10.1029/2011gl050713
Levermann, A., Winkelmann, R., Albrecht, T., Goelzer, H., Golledge, N. R., Greve, R., et al. (2020). Projecting Antarctica's Contribution to Future Sea Level Rise from Basal Ice Shelf Melt Using Linear Response Functions of 16 Ice Sheet Models (LARMIP-2). Earth Syst. Dynam. 11, 35–76. doi:10.5194/esd-11-35-2020
Li, X., Rignot, E., Morlighem, M., Mouginot, J., and Scheuchl, B. (2015). Grounding Line Retreat of Totten Glacier, East Antarctica, 1996 to 2013. Geophys. Res. Lett. 42, 8049–8056. doi:10.1002/2015gl065701
Li, X., Rignot, E., Mouginot, J., and Scheuchl, B. (2016). Ice Flow Dynamics and Mass Loss of Totten Glacier, East Antarctica, from 1989 to 2015. Geophys. Res. Lett. 43, 6366–6373. doi:10.1002/2016GL069173
Lovell, A. M., Stokes, C. R., and Jamieson, S. S. R. (2017). Sub-decadal Variations in Outlet Glacier Terminus Positions in Victoria Land, Oates Land and George V Land, East Antarctica (1972-2013). Antarctic Sci. 29, 468–483. doi:10.1017/s0954102017000074
Lowry, D. P., Krapp, M., Golledge, N. R., and Alevropoulos-Borrill, A. (2021). The Influence of Emissions Scenarios on Future Antarctic Ice Loss Is Unlikely to Emerge This century. Commun. Earth Environ. 2, 221. doi:10.1038/s43247-021-00289-2
Mankoff, K. D., Solgaard, A., Colgan, W., Ahlstrøm, A. P., Khan, S. A., and Fausto, R. S. (2020). Greenland Ice Sheet Solid Ice Discharge from 1986 through March 2020. Earth Syst. Sci. Data 12, 1367–1383. doi:10.5194/essd-12-1367-2020
Martín‐Español, A., King, M. A., Zammit‐Mangion, A., Andrews, S. B., Moore, P., and Bamber, J. L. (2016). An Assessment of Forward and Inverse GIA Solutions for Antarctica. J. Geophys. Res. Solid Earth 121, 6947–6965.
Martinec, Z. (1989). Program to Calculate the Spectral Harmonic Expansion Coefficients of the Two Scalar fields Product. Comput. Phys. Commun. 54, 177–182. doi:10.1016/0010-4655(89)90043-X
Mémin, A., Flament, T., Alizier, B., Watson, C., and Rémy, F. (2015). Interannual Variation of the Antarctic Ice Sheet from a Combined Analysis of Satellite Gravimetry and Altimetry Data. Earth Planet. Sci. Lett. 422, 150–156. doi:10.1016/j.epsl.2015.03.045
Miles, B. W. J., Jordan, J. R., Stokes, C. R., Jamieson, S. S. R., Gudmundsson, G. H., and Jenkins, A. (2021). Recent Acceleration of Denman Glacier (1972-2017), East Antarctica, Driven by Grounding Line Retreat and Changes in Ice Tongue Configuration. The Cryosphere 15, 663–676. doi:10.5194/tc-15-663-2021
Morlighem, M., Rignot, E., Binder, T., Blankenship, D., Drews, R., Eagles, G., et al. (2020). Deep Glacial Troughs and Stabilizing Ridges Unveiled beneath the Margins of the Antarctic Ice Sheet. Nat. Geosci. 13, 132–137. doi:10.1038/s41561-019-0510-8
Mottram, R., Hansen, N., Kittel, C., van Wessem, M., Agosta, C., Amory, C., et al. (2020). What Is the Surface Mass Balance of Antarctica? an Intercomparison of Regional Climate Model Estimates. Ice sheets/Antarctic. doi:10.5194/tc-2019-333
Mouginot, J., Rignot, E., and Scheuchl, B. (2014). Sustained Increase in Ice Discharge from the Amundsen Sea Embayment, West Antarctica, from 1973 to 2013. Geophys. Res. Lett. 41, 1576–1584. doi:10.1002/2013gl059069
Nakayama, Y., Menemenlis, D., Zhang, H., Schodlok, M., and Rignot, E. (2018). Origin of Circumpolar Deep Water Intruding onto the Amundsen and Bellingshausen Sea continental Shelves. Nat. Commun. 9, 3403. doi:10.1038/s41467-018-05813-1
Nield, G. A., Barletta, V. R., Bordoni, A., King, M. A., Whitehouse, P. L., Clarke, P. J., et al. (2014). Rapid Bedrock Uplift in the Antarctic Peninsula Explained by Viscoelastic Response to Recent Ice Unloading. Earth Planet. Sci. Lett. 397, 32–41. doi:10.1016/j.epsl.2014.04.019
Nield, G. A., Whitehouse, P. L., King, M. A., and Clarke, P. J. (2016). Glacial Isostatic Adjustment in Response to Changing Late Holocene Behaviour of Ice Streams on the Siple Coast, West Antarctica. Geophys. J. Int. 205, 1–21. doi:10.1093/gji/ggv532
Paolo, F. S., Fricker, H. A., and Padman, L. (2015). Volume Loss from Antarctic Ice Shelves Is Accelerating. Science 348, 327–331. doi:10.1126/science.aaa0940
Parker, G. B., and Pryor, D. S. (1983). The Other Side of Statistical Significance. Meteorol. Mag. 13, 183. doi:10.1111/j.1445-5994.1983.tb02682.x
Payne, A. J., Nowicki, S., Abe‐Ouchi, A., Agosta, C., Alexander, P., Albrecht, T., et al. (2021). Future Sea Level Change under Coupled Model Intercomparison Project Phase 5 and Phase 6 Scenarios from the Greenland and Antarctic Ice Sheets. Geophys. Res. Lett. 48, e2020GL091741. doi:10.1029/2020GL091741
Peltier, W. R., Argus, D. F., and Drummond, R. (2015). Space Geodesy Constrains Ice Age Terminal Deglaciation: The Global ICE-6G_C (VM5a) Model. J. Geophys. Res. Solid Earth 120, 450–487. doi:10.1002/2014JB011176
Reese, R., Gudmundsson, G. H., Levermann, A., and Winkelmann, R. (2018). The Far Reach of Ice-Shelf Thinning in Antarctica. Nat. Clim Change 8, 53–57. doi:10.1038/s41558-017-0020-x
Rignot, E., Bamber, J. L., Van Den Broeke, M. R., Davis, C., Li, Y., Van De Berg, W. J., et al. (2008). Recent Antarctic Ice Mass Loss from Radar Interferometry and Regional Climate Modelling. Nat. Geosci 1, 106–110. doi:10.1038/ngeo102
Rignot, E. J., Gogineni, S. P., Krabill, W. B., and Ekholm, S. (1997). North and Northeast Greenland Ice Discharge from Satellite Radar Interferometry. Science 276, 934–937. doi:10.1126/science.276.5314.934
Rignot, E., Mouginot, J., Morlighem, M., Seroussi, H., and Scheuchl, B. (2014). Widespread, Rapid Grounding Line Retreat of Pine Island, Thwaites, Smith, and Kohler Glaciers, West Antarctica, from 1992 to 2011. Geophys. Res. Lett. 41, 3502–3509. doi:10.1002/2014gl060140
Rignot, E., Mouginot, J., Scheuchl, B., Van den Broeke, M., van Wessem, M. J., and Morlighem, M. (2019a). Four Decades of Antarctic Ice Sheet Mass Balance from 1979-2017. Proc. Natl. Acad. Sci. USA 116, 1095–1103. doi:10.1073/pnas.1812883116
Rignot, E., Mouginot, J., Scheuchl, B., van den Broeke, M., van Wessem, M. J., and Morlighem, M. (2019b). Four Decades of Antarctic Ice Sheet Mass Balance from 1979-2017. Proc. Natl. Acad. Sci. USA 116, 1095–1103. doi:10.1073/pnas.1812883116
Rintoul, S. R., Silvano, A., Pena-Molino, B., van Wijk, E., Rosenberg, M., Greenbaum, J. S., et al. (2016). Ocean Heat Drives Rapid Basal Melt of the Totten Ice Shelf. Sci. Adv. 2, e1601610. doi:10.1126/sciadv.1601610
Sasgen, I., Groh, A., and Horwath, M. (2019a). GFZ GravIS RL06 Ice-Mass Change Products. GFZ Data Serv. 2. doi:10.5880/GFZ.GRAVIS_06_L3_ICE
Sasgen, I., Konrad, H., Helm, V., and Grosfeld, K. (2019b). High-Resolution Mass Trends of the Antarctic Ice Sheet through a Spectral Combination of Satellite Gravimetry and Radar Altimetry Observations. Remote Sensing 11, 144. doi:10.3390/rs11020144
Sasgen, I., Konrad, H., Ivins, E. R., Van den Broeke, M. R., Bamber, J. L., Martinec, Z., et al. (2013). Antarctic Ice-Mass Balance 2003 to 2012: Regional Reanalysis of GRACE Satellite Gravimetry Measurements with Improved Estimate of Glacial-Isostatic Adjustment Based on GPS Uplift Rates. The Cryosphere 7, 1499–1512. doi:10.5194/tc-7-1499-2013
Sasgen, I., Martín-Español, A., Horvath, A., Klemann, V., Petrie, E. J., Wouters, B., et al. (2017). Joint Inversion Estimate of Regional Glacial Isostatic Adjustment in Antarctica Considering a Lateral Varying Earth Structure (ESA STSE Project REGINA). Geophys. J. Int. 211, 1534–1553. doi:10.1093/gji/ggx368
Sasgen, I., Wouters, B., Gardner, A. S., King, M. D., Tedesco, M., Landerer, F. W., et al. (2020). Return to Rapid Ice Loss in Greenland and Record Loss in 2019 Detected by the GRACE-FO Satellites. Commun. Earth Environ. 1, 8. doi:10.1038/s43247-020-0010-1
Save, H., Bettadpur, S., and Tapley, B. D. (2016). High-resolution CSR GRACE RL05 Mascons. J. Geophys. Res. Solid Earth 121, 7547–7569. doi:10.1002/2016jb013007
Save, H. (2019). GRACE Follow-On CSR Level-2 Processing Standards Document. Available at: ftp://isdcftp.gfz-potsdam.de/grace-fo/DOCUMENTS/Level-2/GRACE-FO_CSR_L2_Processing_Standards_Document_for_RL06.pdf.
Scambos, T. A. (2004). Glacier Acceleration and Thinning after Ice Shelf Collapse in the Larsen B Embayment, Antarctica. Geophys. Res. Lett. 31, L18402. doi:10.1029/2004GL020670
Schannwell, C., Cornford, S., Pollard, D., and Barrand, N. E. (2018). Dynamic Response of Antarctic Peninsula Ice Sheet to Potential Collapse of Larsen C and George VI Ice Shelves. The Cryosphere 12, 2307–2326. doi:10.5194/tc-12-2307-2018
Scheuchl, B., Mouginot, J., and Rignot, E. (2012). Ice Velocity Changes in the Ross and Ronne Sectors Observed Using Satellite Radar Data from 1997 and 2009. The Cryosphere 6, 1019–1030. doi:10.5194/tc-6-1019-2012
Schröder, L., Horwath, M., Dietrich, R., Helm, V., van den Broeke, M. R., and Ligtenberg, S. R. M. (2019). Four Decades of Antarctic Surface Elevation Changes from Multi-mission Satellite Altimetry. The Cryosphere 13, 427–449. doi:10.5194/tc-13-427-2019
Selley, H. L., Hogg, A. E., Cornford, S., Dutrieux, P., Shepherd, A., Wuite, J., et al. (2021). Widespread Increase in Dynamic Imbalance in the Getz Region of Antarctica from 1994 to 2018. Nat. Commun. 12, 1133. doi:10.1038/s41467-021-21321-1
Seroussi, H., Nowicki, S., Payne, A. J., Goelzer, H., Lipscomb, W. H., Abe-Ouchi, A., et al. (2020). ISMIP6 Antarctica: a Multi-Model Ensemble of the Antarctic Ice Sheet Evolution over the 21st century. The Cryosphere 14, 3033–3070. doi:10.5194/tc-14-3033-2020
Shepherd, A., Gilbert, L., Muir, A. S., Konrad, H., McMillan, M., Slater, T., et al. (2019). Trends in Antarctic Ice Sheet Elevation and Mass. Geophys. Res. Lett. 46, 8174–8183. doi:10.1029/2019GL082182
Shepherd, A., Ivins, E., Rignot, E., Smith, B., van den Broeke, M., Velicogna, I., et al. (2018). Mass Balance of the Antarctic Ice Sheet from 1992 to 2017. Nature 558, 219–222. doi:10.1038/s41586-018-0179-y
Silva, A. B., Arigony-Neto, J., Braun, M. H., Espinoza, J. M. A., Costi, J., and Jaña, R. (2020). Spatial and Temporal Analysis of Changes in the Glaciers of the Antarctic Peninsula. Glob. Planet. Change 184, 103079. doi:10.1016/j.gloplacha.2019.103079
Smith, B., Fricker, H. A., Gardner, A. S., Medley, B., Nilsson, J., Paolo, F. S., et al. (2020). Pervasive Ice Sheet Mass Loss Reflects Competing Ocean and Atmosphere Processes. Science 368, 1239–1242. doi:10.1126/science.aaz5845
Sutter, J., Gierz, P., Grosfeld, K., Thoma, M., and Lohmann, G. (2016). Ocean Temperature Thresholds for Last Interglacial West Antarctic Ice Sheet Collapse. Geophys. Res. Lett. 43, 2675–2682. doi:10.1002/2016GL067818
Sutterley, T. C., Velicogna, I., Rignot, E., Mouginot, J., Flament, T., van den Broeke, M. R., et al. (2014). Mass Loss of the Amundsen Sea Embayment of West Antarctica from Four Independent Techniques. Geophys. Res. Lett. 41, 8421–8428. doi:10.1002/2014GL061940
Tapley, B. D., Bettadpur, S., Watkins, M., and Reigber, C. (2004). The Gravity Recovery and Climate Experiment: Mission Overview and Early Results. Geophys. Res. Lett. 31, L09607. doi:10.1029/2004gl019920
Tapley, B. D., Watkins, M. M., Flechtner, F., Reigber, C., Bettadpur, S., Rodell, M., et al. (2019). Contributions of GRACE to Understanding Climate Change. Nat. Clim. Change 9, 358–369. doi:10.1038/s41558-019-0456-2
Thomas, R., Scheuchl, B., Frederick, E., Harpold, R., Martin, C., and Rignot, E. (2013). Continued Slowing of the Ross Ice Shelf and Thickening of West Antarctic Ice Streams. J. Glaciol. 59, 838–844. doi:10.3189/2013jog12j122
Thompson, D. W. J., and Solomon, S. (2002). Interpretation of Recent Southern Hemisphere Climate Change. Science 296, 895–899. doi:10.1126/science.1069270
Tong, X., Liu, S., Li, R., Xie, H., Liu, S., Qiao, G., et al. (2018). Multi-track Extraction of Two-Dimensional Surface Velocity by the Combined Use of Differential and Multiple-Aperture InSAR in the Amery Ice Shelf, East Antarctica. Remote Sensing Environ. 204, 122–137. doi:10.1016/j.rse.2017.10.036
Trenberth, K. E. (1975). A Quasi-Biennial Standing Wave in the Southern Hemisphere and Interrelations with Sea Surface Temperature. Q.J R. Met. Soc. 101, 55–74. doi:10.1002/qj.49710142706
Turner, J., Lu, H., White, I., King, J. C., Phillips, T., Hosking, J. S., et al. (2016). Absence of 21st century Warming on Antarctic Peninsula Consistent with Natural Variability. Nature 535, 411–415. doi:10.1038/nature18645
Turner, J. (2004). The El Niño-Southern Oscillation and Antarctica. Int. J. Climatol. 24, 1–31. doi:10.1002/joc.965
van Wessem, J. M., van de Berg, W. J., Noël, B. P. Y., van Meijgaard, E., Amory, C., Birnbaum, G., et al. (2018). Modelling the Climate and Surface Mass Balance of Polar Ice Sheets Using RACMO2 - Part 2: Antarctica (1979-2016). The Cryosphere 12, 1479–1498. doi:10.5194/tc-12-1479-2018
Velicogna, I., Mohajerani, Y., A, G., Landerer, F., Mouginot, J., Noel, B., et al. (2020). Continuity of Ice Sheet Mass Loss in Greenland and Antarctica from the GRACE and GRACE Follow‐On Missions. Geophys. Res. Lett. 47, e2020GL087291. doi:10.1029/2020GL087291
WCRP Global Sea Level Budget Group (2018). Global Sea-Level Budget 1993–present. Earth Syst. Sci. Data 10, 1551–1590. doi:10.5194/essd-10-1551-2018
Wouters, B., Bamber, J. L., Van den Broeke, M. R., Lenaerts, J. T. M., and Sasgen, I. (2013). Limits in Detecting Acceleration of Ice Sheet Mass Loss Due to Climate Variability. Nat. Geosci 6, 613–616. doi:10.1038/ngeo1874
Wouters, B., Gardner, A. S., and Moholdt, G. (2019). Global Glacier Mass Loss during the GRACE Satellite Mission (2002-2016). Front. Earth Sci. 7, 96. doi:10.3389/feart.2019.00096
Wouters, B., Martin-Español, A., Helm, V., Flament, T., van Wessem, J. M., Ligtenberg, S. R. M., et al. (2015). Dynamic Thinning of Glaciers on the Southern Antarctic Peninsula. Science 348, 899–903. doi:10.1126/science.aaa5727
Yuan, D.-N. (2019). GRACE Follow-On JPL Level-2 Processing Standards Document for Level-2 Product Release 06. Available at: http://icgem.gfz-potsdam.de/GRACE-FO_JPL_L2_Processing_Standards_Document_for_RL06.pdf.
Keywords: Antarctica, GRACE/GRACE-FO, ice-dynamic discharge, surface mass balance, sea-level rise (SLR), mass balance, ISMIP6, climate indices
Citation: Diener T, Sasgen I, Agosta C, Fürst JJ, Braun MH, Konrad H and Fettweis X (2021) Acceleration of Dynamic Ice Loss in Antarctica From Satellite Gravimetry. Front. Earth Sci. 9:741789. doi: 10.3389/feart.2021.741789
Received: 15 July 2021; Accepted: 29 November 2021;
Published: 24 December 2021.
Edited by:
Thomas Vikhamar Schuler, University of Oslo, NorwayReviewed by:
Jonathan L. Bamber, University of Bristol, United KingdomAnthony Mémin, Université Côte d’Azur, France
Copyright © 2021 Diener, Sasgen, Agosta, Fürst, Braun, Konrad and Fettweis. This is an open-access article distributed under the terms of the Creative Commons Attribution License (CC BY). The use, distribution or reproduction in other forums is permitted, provided the original author(s) and the copyright owner(s) are credited and that the original publication in this journal is cited, in accordance with accepted academic practice. No use, distribution or reproduction is permitted which does not comply with these terms.
*Correspondence: Ingo Sasgen, aW5nby5zYXNnZW5AYXdpLmRl