 Renette Jones-Ivey
 Abani Patra
 Marcus Bursik
- 1Institute for Computational and Data Sciences, University at Buffalo, Buffalo, NY, United States
- 2Data Intensive Studies Center (DISC), Tufts University, Medford, MA, United States
- 3Center for Geohazards Studies, University at Buffalo, Buffalo, NY, United States
Probabilistic hazard assessments for studying overland pyroclastic flows or atmospheric ash clouds under short timelines of an evolving crisis, require using the best science available unhampered by complicated and slow manual workflows. Although deterministic mathematical models are available, in most cases, parameters and initial conditions for the equations are usually only known within a prescribed range of uncertainty. For the construction of probabilistic hazard assessments, accurate outputs and propagation of the inherent input uncertainty to quantities of interest are needed to estimate necessary probabilities based on numerous runs of the underlying deterministic model. Characterizing the uncertainty in system states due to parametric and input uncertainty, simultaneously, requires using ensemble based methods to explore the full parameter and input spaces. Complex tasks, such as running thousands of instances of a deterministic model with parameter and input uncertainty require a High Performance Computing infrastructure and skilled personnel that may not be readily available to the policy makers responsible for making informed risk mitigation decisions. For efficiency, programming tasks required for executing ensemble simulations need to run in parallel, leading to twin computational challenges of managing large amounts of data and performing CPU intensive processing. The resulting flow of work requires complex sequences of tasks, interactions, and exchanges of data, hence the automatic management of these workflows are essential. Here we discuss a computer infrastructure, methodology and tools which enable scientists and other members of the volcanology research community to develop workflows for construction of probabilistic hazard maps using remotely accessed computing through a web portal.
1 Introduction
Characterizing potential volcanic eruption hazard scenarios involves many factors. In many cases, potential scenarios have been encapsulated in hazard maps for particular volcanoes, some of which have been constructed using modern computational simulations of volcanic flows (Calder et al., 2015). Such maps can suffer from their static nature, being difficult to adapt to changing eruption situations, or unforeseen eruption scenarios. Use of computer simulations to construct the maps presents one pathway to readily updating them. Although deterministic simulation tools are available for modeling evolving or unforeseen volcanic hazard scenarios, including those that involve dangerous pyroclastic flows and ash clouds (Stein et al., 2015; Takarada, 2017), in most cases, parameters and initial conditions for the governing equations will be poorly constrained and must be treated as random variables to be sampled (Dalbey, 2009). For the construction of hazard maps based on the resulting ensembles of deterministic computer runs, accurate outputs, obtained through careful consideration of input and parameter ranges, and propagation of the resulting uncertainty to output quantities of interest, are needed to properly estimate probabilities (Spiller et al., 2014; Bayarri et al., 2015). While there exist several current efforts at making simulation tools available online for use by volcanologists (Takarada et al., 2014; Woodhouse et al., 2021), none support the complexity required by the uncertainty quantification processes, thereby restricting access to such analysis to specialists reducing their routine use in effective hazard management.
Characterizing the output uncertainty due to parametric and input boundary value uncertainty simultaneously involves using ensemble based methods to fully explore the parameter and input spaces. Complex tasks, such as running thousands of instances of a deterministic model with parameter and input uncertainty, need to be well-defined and repetitive to make them good candidates for automation (Rohit et al., 2014). We have programmed a workflow of tasks, executing ensemble simulations of pyroclastic flows and ash clouds to run in parallel and analyze the simulations outputs, leading to twin computational challenges of managing large amounts of data and performing CPU intensive processing. The resulting flow of work requires complex sequences of tasks, interactions, and exchanges of data, hence automatic management of the workflow is essential to producing orderly, usable and timely output.
Here we discuss the computer workflow, which is based on a well-established scientific infrastructure (McLennan and Kennell, 2010), as well as a methodology that enables scientists and other members of the volcanology research community to construct conditional probabilistic hazard assessments given potential eruption scenarios at any volcano in the world. In exploring potential hazardous volcanic flows with models and computer simulations, we have designed the workflow to seek answers to questions such as “What is the probability of flow depth reaching a critical value at a particular location during a volcanic eruption?” or “What is the probability of having an ash cloud at a particular location within a specified height range following a volcanic eruption?” Such questions need to be explored by geoscientists and policy makers, often under short timelines during an evolving crisis, making it essential that the answers are available using the best science, but not requiring complicated and slow manual processes. With the workflows introduced herein, we facilitate timely answers to critical hazard analysis questions using tools to provide online access to automated workflows for volcanic hazard assessment.
2 Materials and Methods
2.1 Hazard Map Workflow Architecture
Volcanic probabilistic hazard map workflow development requires expertise and collaboration between diverse volcanology research scientists and cyberinfrastructure experts. Scientific HUBs provide the perfect platform for fostering this collaboration. The VHub science HUB, provides an online resource for modeling and analysis in volcanology research and risk mitigation. To make volcanic hazard analysis easier for the end researcher to access, VHub portal based access to computational workflows for pyroclastic flows and ash clouds transports have been developed. These workflows are based on the Pegasus Workflow Management System (WMS) architecture which is integrated into the HUBzero framework. A high level overview of the underlying workflow architecture is shown in Figure 1A. In this section, details of the workflow architecture are described. In Section 2.2, two implementations of this workflow architecture are presented.
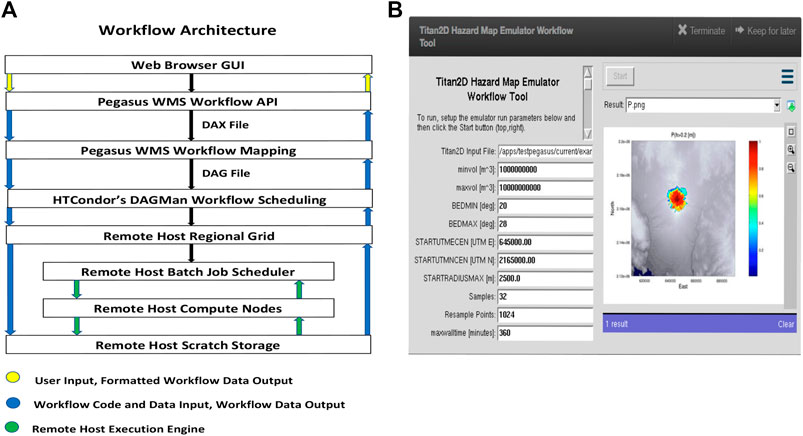
FIGURE 1. (A) Workflow using multiple hardware and system software units, and (B) graphical user interface of workflow for a hazard map based on Titan2D tool.
2.1.1 Computer Infrastructure Platform
VHub is hosted at the San Diego Supercomputer Center and is built on the HUBzero platform for Scientific Collaboration. An advantage of using the HUBzero platform is that users can launch software tools with a web browser without having to download, compile, or install code on local systems (McLennan and Kennell, 2010).
The VHub portals are accessible to the volcanological and meteorological community from anywhere in the world. The portals provide user-friendly access to the advanced scientific resources using a web browser. Using the portals, researchers and operational scientists can execute models of hazards from volcanic debris avalanches to atmospheric ash transport without direct participation of an array of computational scientists and computing professionals.
VHub’s architecture consists of a database server and webserver; an execution host that runs software containers for computational tools; and middleware—software that coordinates the container sessions with user sessions (Sperhac et al., 2021). HUBzero System Administrators handle user accounts and interaction, including registering and subsequently authenticating users, controlling access to tools and other hosted resources.
2.1.2 Workflow Tools
Users interface with VHub by running computational tools. When a user runs a computational tool on VHub, a virtual container is started on the execution host. Each tool container has been configured to support specific computational needs, such as memory or disk space. Additional execution host servers may be deployed to scale up either the number of users supported, the resource footprint for tool sessions, or both. Finally, tools needing additional resources or parallel execution can submit jobs to a remote host’s compute cluster. VHub enables members of the volcanology research community to deploy hazard map workflow tools that a user can interact with. VHub tools are maintained via a development lifecycle which guides users through a framework for publishing their tools on VHub; subversion control, testing, verification and review by domain scientists and HUBzero System Administrators prior to publication on the VHub website (Sperhac et al., 2021).
An important consideration for the development of a hazard map workflow tool is to abstract the complexity of the workflow from users. A user friendly graphical user interface (GUI) (Figure 1B) gives the user control over each analysis, and hides the complexities of the workflow implementation from the user, such as controlling the bounds of uncertainty for each simulation run. The GUI also provides the user with easy access to output of workflows. Ultimately, the results could provide a path forward for the routine construction of probabilistic, spatio-temporal pyroclastic flow and ash cloud hazard maps.
2.1.3 Workflow Management
The Pegasus Workflow Management System (WMS) (Deelman et al., 2015) provides the structured platform required for implementing the workflows. The Pegasus WMS automates and manages the execution of the jobs required to run the workflows, including staging the jobs, distributing the work, submitting the jobs to run on a remote host, as well as handling data flow dependencies and overcoming job failures. The integration of the Pegasus WMS into the HUBzero framework has brought the power of automated workflows to many more users (McLennan et al., 2015). The Pegasus WMS consists of Pegasus and its workflow engine, the directed acyclic graph manager (DAGMan) within HTCondor (Couvares et al., 2007; Deelman et al., 2015). HTCondor is a workload scheduling system for computational jobs. HTCondor provides a job queuing mechanism and resource monitoring capabilities. DAGMan is a meta-scheduler for HTCondor, which is a service for executing multiple jobs with dependencies among them; it manages dependencies between jobs at a higher level than does the HTCondor scheduler (University of Wisconsin–Madison Center for High Throughput Computing, 2021). Pegasus uses DAGMan and the rest of the HTCondor stack to execute the workflows (Figure 1A).
Pegasus workflows are described in an abstract format via abstract workflow (DAX) files which are directed acyclic graphs in XML format. The abstract format means that the description does not include data and software locations; these are looked up at planning time, enabling portability of the workflows. A DAX generating Application Programming Interface (API) is used to create the DAX file for a workflow. For the workflows described herein, a python script is invoked. The DAX file provides the primary input to Pegasus and defines the jobs required for executing the workflow, the job dependencies, and the input and output files for each job. With the HUBzero submit tool, a simple submit command verifies that the jobs pass HUBzero security checks and dispatches the workflow to the Pegasus WMS for execution (McLennan et al., 2015).
The Pegasus WMS is flexible and supports a wide variety of execution environments (Deelman et al., 2015). For the Titan2D Hazard Emulator and Bent-Hysplit Workflow tools, Pegasus jobs are submitted to the University at Buffalo Center for Computational Research’s (CCR’s) generally accessible academic compute cluster, UB-HPC, via a UB-HPC regional grid (Neeman et al., 2010). Pegasus takes the abstract description and determines where to execute the jobs and where to access the data. Pegasus augments the DAX with data movement directives and compiles a directed acyclic graph (DAG). The resulting DAG is then given to HTCondor’s DAGMan. DAGMan, as directed by the DAG, orders the jobs according to their dependencies, and submits the jobs ready for execution to the remote host, UB-HPC. At the remote host, the SLURM (Simple Linux Utility for Resource Management) Workload Manager provides the framework for queuing jobs, allocating compute nodes, and starting the execution of jobs. A challenge for executing the Pegasus jobs on VHub is the limited home disk space each user has. To overcome this challenge, Pegasus scratch directories are located in CCR’s high performance global scratch space which is accessible from all UB-HPC compute nodes.
System level implementation details for Pegasus, including setting up the mapping via the site and transformation catalogs that Pegasus requires, are abstracted from workflow developers; Steven Clark, HUBzero, and Steven Gallo, CCR, set up the Pegasus WMS lower level interfaces for the workflows.
When a SLURM job execution completes, the final status of the finished job is returned to Pegasus. If the final status indicates a job failure, Pegasus will retry re-executing the job. For the current VHub Pegasus implementation, Pegasus will retry to execute a failed job no more than two times.
A working directory for either the Titan2D Hazard Map Emulator or Bent-Hysplit Workflow tool is created in the user’s VHub home folder’s data/sessions directory when the tool is launched. Workflow input files generated by the GUI are stored in this work directory. When a workflow execution is started, input files required by the workflow and specified in the DAX, are uploaded by Pegasus to the Pegasus scratch directory. When a workflow’s execution is complete, output files generated by the workflow and specified in the DAX, are downloaded by Pegasus from the Pegasus scratch directory to the tool’s work directory. In addition, Pegasus status and analysis information is returned in a file called pegasus.analysis. If workflow errors occurs, the pegasus.analysis file will contain details for the errors. For the Bent-Hysplit Workflow tool, output files are moved from the work directory to a dated run created when the workflow’s execution is started.
2.2 Hazard Map Workflow Tools
Two tools were developed using the computer infrastructure and methodology outlined in the previous section. Both tools are currently published on the VHub website, these are the Titan2D Hazard Map Emulator Workflow Tool for Volcanic Pyroclastic Flow Transport Hazards and the Bent-Hysplit Workflow Tool for Volcanic Ash Cloud Transport Hazards. In this section, details of these workflow tools are described.
2.2.1 Volcanic Mass Flow Hazard Map
Titan2D (Patra et al., 2005) is a computer program for simulating granular avalanches over digital elevation models of natural terrain. The program is designed for simulating geological mass flows such as pyroclastic flows, debris flows, debris avalanches and landslides. Titan2D combines numerical simulations of a flow with digital elevation data of natural terrain supported through a Geographical Information System (GIS) interface.
The Titan2D program is based upon a depth-averaged model of an incompressible continuum, a “shallow-water” granular flow. The conservation equations for mass and momentum are solved with different rheological properties modeling the interactions between the grains of the medium and one another, an interstitial fluid or the basal surface. The resulting hyperbolic system of equations is solved using a parallel, adaptive mesh, Godunov scheme.
The shallow-water model conservation equations solved by Titan2D are given by:
where, U is a vector of conserved state variables, F is a vector of mass and momentum fluxes in the x-direction, G is a vector of mass and momentum fluxes in the y-direction, and, S is a vector of driving and dissipative force terms.
The Titan2D tools solve Eq. 1 numerically for flow depth and a depth-averaged velocity at every grid point in the mesh. To run Titan2D, a digital elevation map (DEM) of the region of interest is read into the computer, together with flow-specific parameters such as the material friction angles, initial volume, initial direction and initial velocity.
For the construction of the Titan2D hazard map, the flow-specific parameters and the DEM may be poorly characterized, and should be viewed as uncertain (Stefanescu et al., 2012).
One way to quantify the uncertainty is to use Monte Carlo type sampling, which requires multiple runs of the Titan2D simulator. Each run of Titan2D takes 20 min or more on a single processor, so Monte Carlo type sampling is considered too expensive.
To make the hazard map construction more accessible (Dalbey, 2009), created estimates of expectation and associated uncertainty, for given locations and sparse guiding data, using a statistical surrogate model called the Bayes Linear Method developed by Goldstein (Goldstein, 1995). Sets of flow-specific and DEM parameters are generated using Latin Hypercube Sampling and Titan2D simulations at these inputs are performed. Latin Hypercube Sampling requires fewer design points to fill a design space as compared to Monte Carlo. The data is used to create a statistical surrogate Bayes linear emulator, which attempts to fit a piecewise polynomial and an error model through the available numerical data from the simulator. The emulator s(x) may be written as:
where sx is a quantity of interest (e.g., maximum flow depth attained at a location, β are least square coefficients, x is the vector of input variables and the error ϵ is modeled as Gaussian with 0 mean normal distribution with variance σ. (Dalbey, 2009) carefully lays out a process for adapting the work of Goldstein (Goldstein, 1995) to adjust the expectation and variance implicit in the model above with data from the numerical simulator. The emulator acts as a fast surrogate of the simulator. To surmount the cost of emulator construction for full field simulations where the correlation structures lead to the need for inverting very large matrices, a localized approximation is used [in a process quite similar to the well studied Gaussian Markov random fields (Rue and Held, 2005)]. This is key to constructing a multi-level Bayesian hierarchical emulator from an ensemble of training simulations. The hierarchical nature allows the emulator components to be constructed and evaluated concurrently (Figure 2A). However, this leads to much greater complexity in the workflow, and challenges in automation.
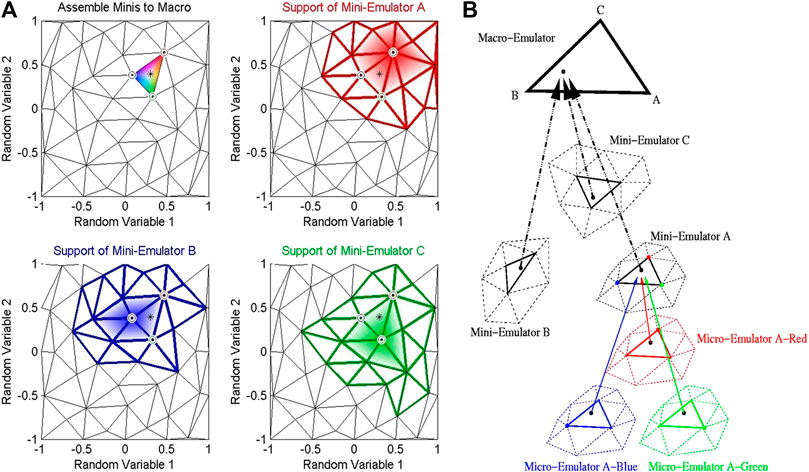
FIGURE 2. Example mini-emulators. (A) Tessellation of the input parameter space showing micro-emulator support of mini-emulators. (B) Assembly of the hierarchy of emulators to produce the macro-emulator (Dalbey, 2009).
As implemented, the hierarchical emulator is an ensemble of smaller emulators, each covering a portion of the uncertain input space. Using Delaunay triangulation, tessellation of sample points is performed to generate a set of triangles whose nodes are sample sites in the input space. A mini-emulator centered about each sample is constructed using only those samples in the neighborhood of the central sample. The adjusted mean and variance of the mini-emulators are calculated for arbitrary re-sample points. The adjusted means and variances of the mini-emulators are combined in a weighted sum. The mini-emulators are then aggregated into a macro-emulator (Figure 2B). The macro-emulator is re-sampled to produce the conditional probabilistic hazard map.
The steps required to implement the workflow and the parallelization strategy are highlighted in Table 1.

TABLE 1. Titan2D hazard map workflow parallelization strategy.
The speed-up provided by the parallel workflow is n-fold over the corresponding sequential processing. The actual speed-up is dependent on machine considerations. For example, sharing compute nodes with other programs may reduce the speed-up. Usage and performance of UB-HPC cluster nodes resources are monitored via UB CCR’s Open XDMoD tool (Sperhac et al., 2020). When a workflow’s execution is complete, the XDMoD user interface enables workflow developers to view important information about a workflow’s task execution on a CCR compute node such as the executable information and summary statistics.
The VHub Titan2D Hazard Map Emulator Workflow Tool extends capability provided by the VHub Titan2D Mass-Flow Simulation Workflow Tool and produces ASCII formatted and Portable Network Graphics files containing information on the conditional probability of a Titan2D flow depth reaching a critical height over a period of time following a volcanic eruption, given a user defined eruption scenario. Titan2D and Matlab/Octave scripts developed by Dalbey (2009), provide the base software required to implement this tool. A GUI is displayed when the tool is launched. The GUI provides the user interface for defining the eruption scenario and for controlling and running a Titan2D Hazard Map Emulator workflow. This tool was developed based on the HUBzero Pegasus tutorial (pegtut) and presents a HUBzero Rappture (Rapid application Infrastructure) interface. Rappture is a toolkit within the HUBzero platform that makes it easy to develop a graphical user interface for scientific modeling tools (McLennan, 2009).
A python input file contains the parameters for running Titan2D. An ensemble of Titan2D executions provide sample data for this tool. Users enter the name of a python input file for running Titan2D into the GUI’s Titan2D Input File text box.
The Titan2D Hazard Map Emulator Workflow tool handles uncertainty in input parameters given ranges for these parameters specified via GUI text boxes. These are minimum volume (minvol), maximum volume (maxvol), minimum bed friction (BEDMIN), maximum bed friction (BEDMAX), starting center coordinate in easting and northing (STARTUTMECEN, STARTUTMNCEN), and starting mass radius (STARTRADIUSMAX). Sets of flow-specific and DEM parameters are generated using Latin Hypercube Sampling in conjunction with the specified ranges these parameters. The generated parameter sets are used to modify the user specified python input file for each Titan2D ensemble execution.
The GUI processes the user input and determines the executable jobs, job dependencies, and the input and output files for each job required to implement the workflow tasks displayed in Figure 3, calls Pegasus WMS API functions to create a DAX file, and, submits the workflow to Pegasus for execution (Figure 1A and Section 2.1.3).
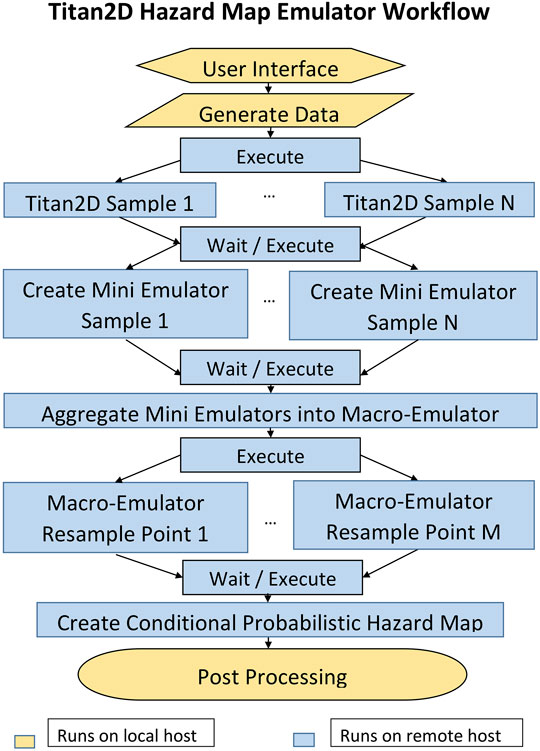
FIGURE 3. Titan2D hazard map workflow tasks for pyroclastic flows and other surficial mass flows. Pegasus monitors the completion of task executions by determining when required output files are created by the tasks.
2.2.2 Volcanic Ash Cloud Transport Hazard Map
Bent is a theoretical model of a volcanic eruption plume developed by (Bursik, 2001; Pouget et al., 2016), based on applying the equations of motion for a non-Boussinesq, particle-laden source in a plume-centered coordinate system. Bent outputs plume trajectories and rise heights, as well as pyroclast loadings as a function of height, and provides input for the Air Resources Laboratory volcanic ash transport and dispersion model (VATD), HYSPLIT. The Bent and HYSPLIT models require input data on volcanic source conditions as well as the wind field; the NCEP/NCAR Reanalysis model is currently the default in use for wind speed, although this can easily be changed to a higher resolution model. As this is a non-federal implementation of HYSPLIT, forecast wind fields cannot be used1. HYSPLIT is used to propagate ash particles in the windfield. The Bent-Hysplit workflow comprises a coupling of the Bent, HYSPLIT and Reanalysis models.
Some of the source parameters for the Bent and HYSPLIT models, specifically vent radius, vent source velocity, both of which affect plume height, and mean and standard deviation of ejecta grain size, which affect the distance carried, may be poorly characterized, and should be viewed as uncertain (Madankan et al., 2014).
The Bent-HYSPLIT workflow automates previous work for uncertainty in predictions from a model of volcanic ash transport in the atmosphere arising from uncertainty in both eruption source parameters and the model wind field (Stefanescu et al., 2014). Previous work used PUFF as the VATD model, and Weather Research and Forecasting (WRF) as the wind field model.
To implement the Bent-HYSPLIT-Reanalysis coupling, a quantity of interest is considered, for example, ash concentration at a specific location through time. Let the quantity of interest be represented as a random variable, xk, whose time evolution is given by HYSPLIT:
In Eq. 3, Θ = {θ1, θ2, …} represents uncertain initial conditions or system parameters such as the vent radius, eruption velocity, mean grain size and grain size variance, and
Figure 4, adapted from (Madankan et al., 2014), displays a comparison for the number of points needed to find the 8th order moment in four dimensions using Clenshaw-Curtis points [94 (6561)], Gauss-Legendre points [54 (625)], and CUT points (161 CUT points). The CUT points are very efficient relative to other quadrature driven sampling schemes and are used in our workflow here. Using the CUT points, the output moments are approximated as a weighted sum of the output of simulation runs at these carefully selected values of uncertain parameters.
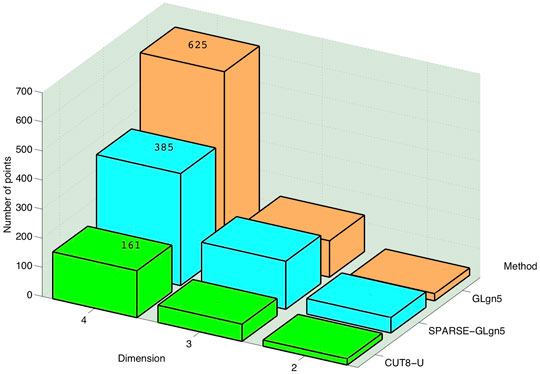
FIGURE 4. Points needed to find 8th order moment in 2–4 dimensions using different sampling techniques.
The conditional probability of having ash at a specific height is then given by:
where, wi are the weights associated with the wind field ensemble, while wq are those obtained from using the CUT or generalized polynomial chaos (gPC) expansion (Marcus et al., 2012).
The expected value of ash at a given height is then:
Sets of uncertain input values generated using polynomial chaos quadrature (PCQ), CUT sampling and Bent simulations of the inputs are performed. Control files are created using the Bent output, which are used as input to HYSPLIT; and HYSPLIT simulations are performed. The resulting HYSPLIT ensemble is used to construct a surrogate model, which in turn is sampled to create a conditional probabilistic hazard map. Ensemble methods that explore full parameter space are crucial to obtaining good probabilistic estimates and insights into the potential for hazardous flow. The steps required to implement the workflow are shown in Table 2. The ability to parallelize these steps are exploited in the workflow construction.

TABLE 2. Bent hysplit workflow parallelization strategy.
The VHub Bent-Hysplit Workflow Tool extends capabilities of the VHub puffin tool and produces a netCDF formatted file containing information on the conditional probability of ash concentrations at specific heights, times and locations following a volcanic eruption, given a user defined eruption scenario. A GUI is displayed when the tool is launched. The GUI provides the user interface for defining the eruption scenario, for controlling and running a Bent-Hysplit workflow, and, for streamlining access to other websites for obtaining information required by the workflow.
Bent requires column formatted radiosonde files containing atmospheric parameters for the currently selected volcano eruption date and time. The GUI provides the ability to automatically download weather balloon radiosonde files obtained in HTML format from the University of Wyoming Weather Web webpage. The software searches a master location identifier database to determine World Meteorological Organization (WMO) stations closest to the volcano, and then an attempt is made to retrieve a radiosonde file from the closest WMO station for the selected eruption date and time. HYSPLIT requires NOAA Air Resources Laboratory (ARL) NCEP/NCAR Reanalysis meteorological data files. The GUI provides the ability to automatically download ARL files from the NCEP/NCAR Reanalysis website “NCEP/NCAR Reanalysis” for the selected eruption date. The GUI also provides the ability to view volcano conditions from the Volcanic Cloud Monitoring—NOAA/CIMSS webpage for the selected volcano.
The Bent-Hysplit Workflow tool handles uncertainty in column (eruption plume) rise height through the Vent Radius and Vent Velocity configuration parameters, which together control mass eruption rate (MER), and uncertainty in the grain size, fine-grain fraction and potential ash accretion through the Grain Mean and Grain Standard Deviation configuration parameters. Polynomial Chaos Quadrature (PCQ) sample points, generated using the Conjugate Unscented Transform method, are used in conjunction with ranges for these parameters specified on the GUI’s Run Control tab to create sets of Bent input values for the parameters. Running Bent with a particular set of input values for these parameters is considered a sample run of Bent. Bent output from each member of the sample run is used in conjunction with other configuration parameters specified on the Run Control tab to create CONTROL and SETUP.CFG files for HYSPLIT; running HYSPLIT with these CONTROL and SETUP. CFG files is considered a sample run of HYSPLIT. HYSPLIT output from all HYSPLIT sample run members is used as input to the tool’s uncertainty quantification analysis software. The output of the tool’s uncertainty quantification analysis software is a NetCDF formatted file, probmap.nc, containing probabilities of ash concentrations greater than specific levels at specific times and locations. In all, 161 sample runs of Bent and HYSPLIT are performed at CUT points, requiring an ensemble of Bent, HYSPLIT and uncertainty quantification analysis tasks, which are encapsulated and executed as a workflow.
The GUI processes the user input and determines the executable jobs, job dependencies, and the input and output files for each job required to implement the workflow tasks displayed in Figure 5, calls Pegasus WMS API functions to create a DAX file, and, submits the workflow to Pegasus for execution (Figure 1A and Section 2.1.3).
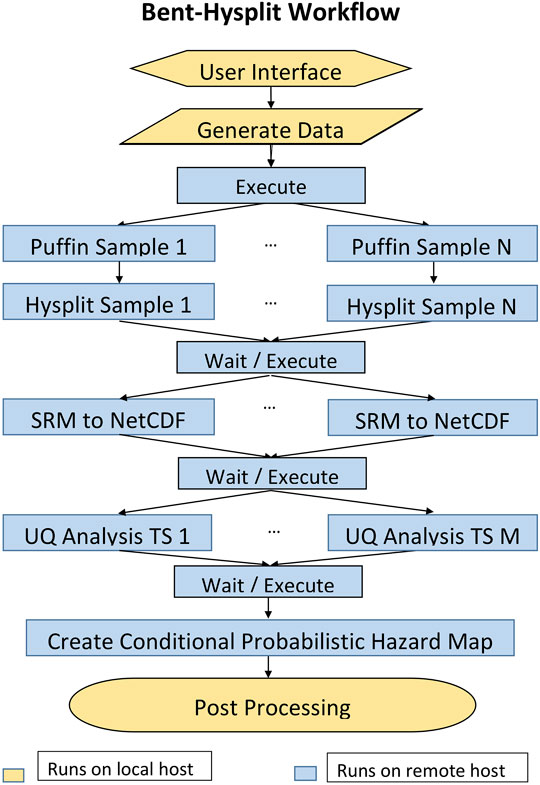
FIGURE 5. Bent-Hysplit workflow tasks for ash clouds. Pegasus monitors the completion of task executions by determining when required output files are created by the tasks.
From previous work, the Bent model has been improved to use either radiosonde or different types of NWP data directly to get atmospheric parameters. An inverse model was added to update source parameter estimates; simulation of collapse behavior and low fountain development was formalized; modules for water were added; double-precision and adaptive step size were added; and umbrella cloud flow and pyroclast fallout completed.
3 Results
3.1 Volcanic Pyroclastic Flow Transport Hazard Map
Azufral, Colombia, is a stratovolcano (1.09°N, 77.72°W/UTM Zone 18N, 197 272 UTM°E, 120615 UTM°N) with a summit elevation of 4,050 m. Mapped pyroclastic flow deposits for the Azufral volcano are shown in Figure 6. These polygons were determined by thorough mapping by the Servicio Geologico Colombiano. If we assume the eruption units were erupted as single events, and the pyroclastic surges and flows are separated into different density currents, the eruption units can be modeled using Titan2D (Williams, 2015).
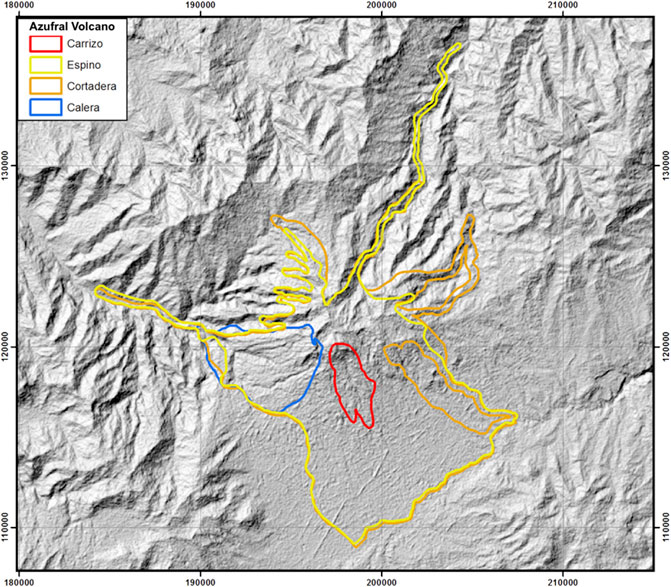
FIGURE 6. Map showing mapped pyroclastic flow deposits for Azufral Volcano (Williams, 2015). Outline is known extent of each named deposit.
Results for running one simulation of a likely flow using Titan2D are displayed in Figure 7. A circular sampling area from which the X and Y coordinate points for source vent centers was chosen. This area encompasses that inside the crater of Azufral. The simulation parameters for running Titan2D are displayed in Table 3. As indicated in Table 3, we assume that the origin of flow is near the crater.
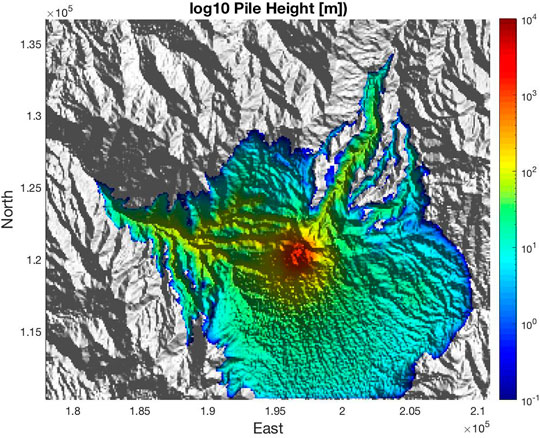
FIGURE 7. Titan2D simulation of a flow at Azufral Volcano showing spread of flow widely in unchannelized areas, and confinement to valleys in channelized areas. Volume used similar to that of Espino and Cortadera flows in Figure 6, producing similar runout distance or extent.
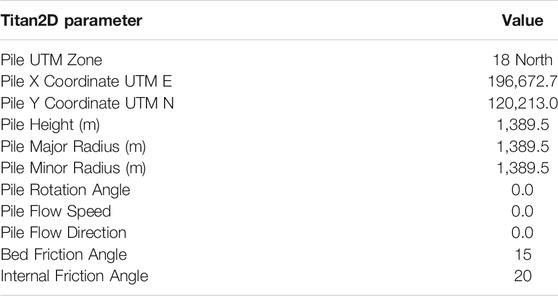
TABLE 3. Titan2D eruption source parameters for Azufral volcano, Colombia.
For Azufral volcano, the initial volume, bed (also known as basal) friction angle and DEM are poorly characterized and Titan2D Hazard Map Workflow software was used to produce conditional probabilistic hazard maps (PHMs). Three separate PHM eruption scenarios were created based on binned volume and apparent basal friction angles for the PDCs derived in Bursik et al. (2005), and Williams (2015). The ranges for the volume and bed friction angle are shown in Table 4. A uniform distribution is used to model the variability of the volume and bed friction angle, as each value in the range of values for these are equally likely to occur.

TABLE 4. Eruption PHM Scenarios for Azufral volcano, Colombia.
Results for the three scenarios are shown in Figures 8–10. The spatially varying hazard criterion that we chose was whether or not the flow depth exceeds 0.2 m during a particular event. The workflow was run with 32 simulated samples of Titan2D.
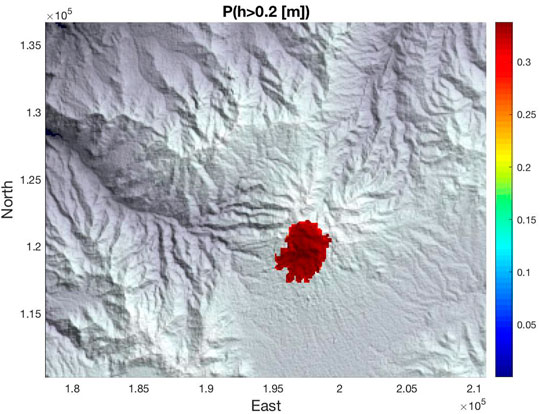
FIGURE 8. Titan2D emulator based probability of exceeding 0.2 m flows in Scenario 1.
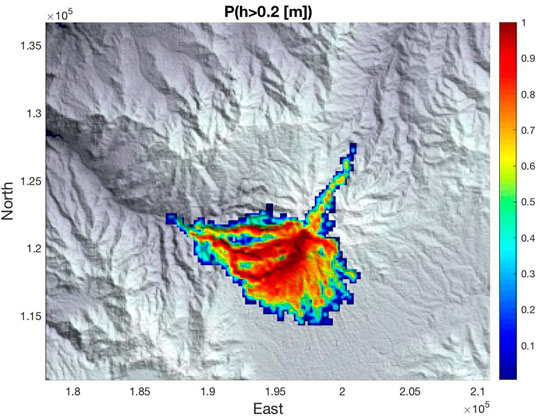
FIGURE 9. Titan2D emulator based probability of exceeding 0.2 m flows in Scenario 2. Note similarity of probability of noticeable flow extent to mapped extent of Carrizo and Calera flows.
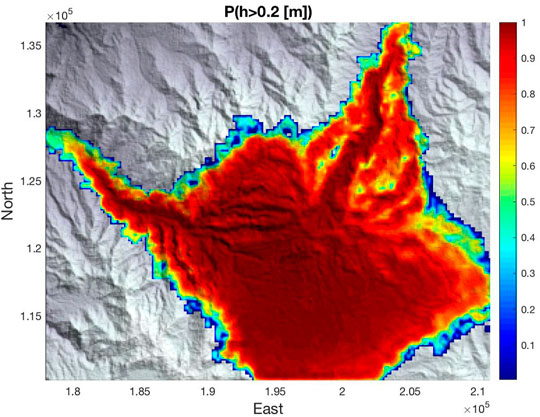
FIGURE 10. Titan2D emulator based probability of exceeding 0.2 m flows in Scenario 3. Note similarity of probability of noticeable flow extent to mapped extent of Cortadera and Espino flows.
Results for Scenario 1 show that due to high bed friction angle values and low volumes, hazards are limited to the area near the crater. Results for Scenario 2 show that flow becomes more probable towards the southern half of the volcanic complex, and potential for flow remains confined to valleys to the west and north. Results for Scenario 3 show that the highest probabilities occur close to the summit of Azufral volcano, on the southern flanks of the volcano and in the bottom of valleys to the west and north.
For the Espino and Cortadera units shown in Figure 6 following (Williams et al., 2017), the magnitude of the eruptions are reasonably within the volume sampling boundary conditions of Scenario 3 (Figure 10). The PDC conditions are highly probable as the Scenario 3 PHM encompasses likely scenarios given a positive correlation with the deposits of Espino and Cortadera.
The standard deviation divided by the probability of hazard, is a measure of the non-confidence in the statistics due to insufficient re-sampling. This measure is displayed for Scenario 2 (Figure 11). The measure cannot be used to directly evaluate the quality of the emulator, although it is possible to obtain a measure of this with some minor modifications and re-evaluations of the re-sample inputs (Dalbey, 2009).
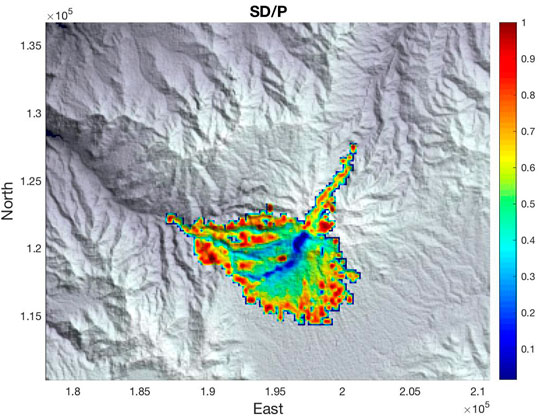
FIGURE 11. Titan2D estimate of non-confidence in emulator based probability assessment for Scenario 2, using the ratio of standard deviation and probability. Lower SD/P is better, showing that near vent, confidence in model output is higher.
3.2 Volcanic Ash Cloud Transport Hazard Map
Kelut (or Kelud), Indonesia, is a stratovolcano (7.93°S, 112.308°E/UTM Zone 49S, 644 177 UTM E, 9123 214 UTM N) with a summit of 1,731 (m) located in the province of East Java. On February 13, 2014, the Indonesian National Board for Disaster Management (Badan Nasional Penanggulangan Bencana-BNPB) reported that a major eruption occurred at Kelut (Global Volcanism Program, 2014). The plume reached a maximum height of 26 km and an umbrella cloud spreading height of around 16–17 km (Figure 12) (Bear-Crozier et al., 2020).
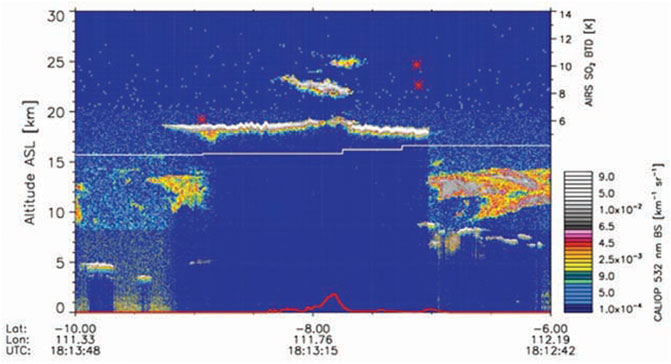
FIGURE 12. CALIOP cross-section through Kelut volcanic cloud from data acquired on 14 February 2014. Top of plume imaged near center; note top of umbrella spreading region at height above 18 km, and compactness of cloud. Lower bright areas near edges are nonvolcanic water-vapor clouds. (Global Volcanism Program, 2014).
We have conducted tests with the Kelut eruption to create a conditional probabilistic hazard map for this event. The potential vent radius, velocity of ejection from the vent, grain mean size and standard deviation are poorly characterized. The ranges for these parameters as well as other eruption source parameters are listed in Table 5. A uniform distribution is used to model the variability of the vent radius, initial velocity, grain mean and standard deviation, as each value in the range of values for these are as equally likely to occur. Figure 13 displays results of analyzing the netCDF formatted probability of ash at height greater and 17,000 m for the 6 h following the eruption on 13 February 2014. The plots were created using the (external) McIDAS software package, from the netCDF file returned by the workflow. The natural color RGB image of the eruption cloud, Figure 14, shows that ash drifted WSW after 2 h. Figure 13 shows that an ash cloud at height near 17 km would have the same WSW drift in movement.
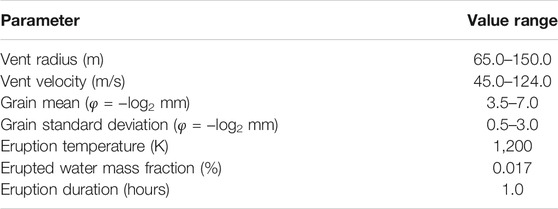
TABLE 5. Eruption source parameters for a hypothetical eruption of Kelut volcano.
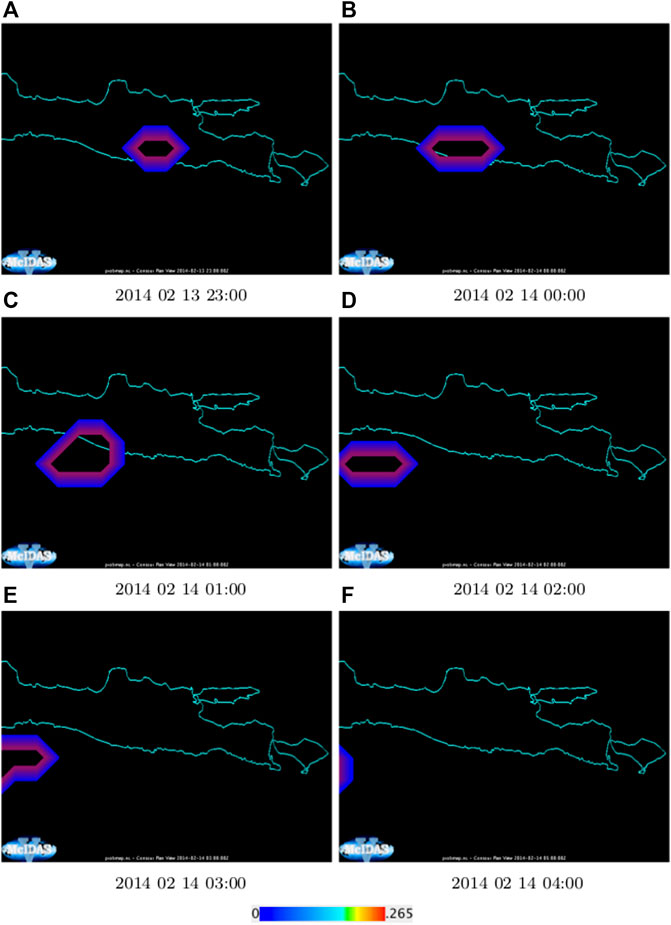
FIGURE 13. (A–F) Conditional probability of ash at height c. 17 km for 6 h following the Kelut volcano eruption February 13, 2014. Plots were created with a low resolution grid. Higher resolution grids may be used via the tool’s Select Meteo Data File input option.
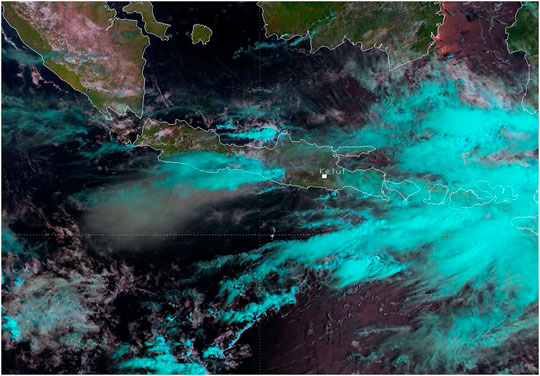
FIGURE 14. Natural color RGB image of Kelut ash cloud (diffuse gray area), taken c. 2 h after the eruption, shows WSW drifting of cloud, consistent with probabilistic estimate of workflow. (EUMESTAT, 2021).
For this exercise, the workflow downloaded the windfield data from the NOAA Air Resources Laboratory (ARL) Gridded Meteorological Archives. The tool also provides the capability for the user to use a windfield data file stored in the user’s home directory on VHub.
4 Conclusion
Workflow hazard map development is generally complex and very inefficient and prone to errors when performed manually. The software modules that are required to run in parallel on multiple processors makes hazard map development inaccessible to many people. The process of downloading and verifying required field data is handled using a simple GUI interface.
This paper presents a computing infrastructure and methodology which enables scientists and other members of the volcanology research community to automate and use complex workflows for construction of probabilistic hazard maps. The work addresses a major scientific challenge; making sophisticated, probabilistic computational hazard map development accessible to a range of potential users. The steps towards usability through use of a web-interface to parameterize and initialize computations is a valuable contribution to the volcanology research community.
Two geologic flow-transport modelling systems applicable to volcanic eruptions, the computational models, the ways of using these models, and the use of Pegasus as a WMS for controlling the execution of these models are presented. The results of two realistic case studies as a means of preliminary evaluation are denoted in the Section 3 and support the viability of this computer infrastructure and methodology for the construction of probabilistic hazard maps.
Data Availability Statement
The original contributions presented in the study are included in the article/Supplementary Material, further inquiries can be directed to the corresponding author.
Author Contributions
All authors contributed to the workflow conceptual design. RJ developed workflow software and ran the simulations. All authors verified and validated the computational results and contributed to writing the manuscript.
Funding
This work was supported by National Science Foundation awards OAC/2125974 and OAC/2004302.
Conflict of Interest
The authors declare that the research was conducted in the absence of any commercial or financial relationships that could be construed as a potential conflict of interest.
Publisher’s Note
All claims expressed in this article are solely those of the authors and do not necessarily represent those of their affiliated organizations, or those of the publisher, the editors and the reviewers. Any product that may be evaluated in this article, or claim that may be made by its manufacturer, is not guaranteed or endorsed by the publisher.
Footnotes
1Alternate versions of the tools with the unrestricted tool PUFF from Univ of Alaska-Fairbanks may also be used with forecast versions of numerical weather prediction models
References
Bayarri, M. J., Berger, J. O., Calder, E. S., Patra, A. K., Pitman, E. B., Spiller, E. T., et al. (2015). Probabilistic Quantification of Hazards: A Methodology Using Small Ensembles of Physics-Based Simulations and Statistical Surrogates. Int. J. Uncertaintyquantification 5 (4), 297–325. doi:10.1615/int.j.uncertaintyquantification.2015011451
Bear-Crozier, A., Pouget, S., Bursik, M., Jansons, E., Denman, J., Tupper, A., et al. (2020). Automated Detection and Measurement of Volcanic Cloud Growth: towards a Robust Estimate of Mass Flux, Mass Loading and Eruption Duration. Nat. Hazards 101 (1), 1–38. doi:10.1007/s11069-019-03847-2
Bursik, M. (2001). Effect of Wind on the Rise Height of Volcanic Plumes. Geophys. Res. Lett. 28, 3621–3624. doi:10.1029/2001gl013393
Bursik, M., Patra, A., Pitman, E. B., Nichita, C., Macias, J. L., Saucedo, R., et al. (2005). Advances in Studies of Dense Volcanic Granular Flows. Rep. Prog. Phys. 68 (2), 271–301. doi:10.1088/0034-4885/68/2/r01
Calder, E., Wagner, K., and Ogburn, S. E. (2015). Volcanic hazard Maps. Glob. volcanic hazards Risk, 335–342. doi:10.1017/cbo9781316276273.022
Couvares, P., Kosar, T., Roy, A., Weber, J., and Wenger, K. (2007). Workflow Management in Condor. London: Springer London, 357–375.
Dalbey, K. (2009). Predictive Simulation and Model Based Hazard Maps of Geophysical Mass Flows. PhD Thesis. Buffalo, NY: Department of Mechanical and Aerospace Engineering, University at Buffalo.
Deelman, E., Vahi, K., Juve, G., Rynge, M., Callaghan, S., Maechling, P. J., et al. (2015). Pegasus, a Workflow Management System for Science Automation. Future Generation Comp. Syst. 46, 17–35. doi:10.1016/j.future.2014.10.008
Eumestat (2021). Kelut Volcano Eruption. Available at: https://www.eumetsat.int/kelut-volcano-eruption (accessed November, , 2021).
Global Volcanism Program (2014). “Report on Kelut,” in Bulletin of the Global Volcanism Network. Editor R. Wunderman (Indonesia: Smithsonian Institution), 39, 2.
Goldstein, M. (1995). Bayes Linear Methods I - Adjusting Beliefs: Concepts and Properties. Durham: University of Durham.
Madankan, R., Pouget, S., Singla, P., Bursik, M., Dehn, J., Jones, M., et al. (2014). Computation of Probabilistic hazard Maps and Source Parameter Estimation for Volcanic Ash Transport and Dispersion. J. Comput. Phys., 39–59. doi:10.1016/j.jcp.2013.11.032
Marcus, B., Jones, M., Carn, S., Dean, K., Patra, A., Pavolonis, M., et al. (2012). Estimation and Propagation of Volcanic Source Parameter Uncertainty in an Ash Transport and Dispersal Model: Application to the Eyjafjallajökull Plume of 14–16 April 2010. Bull. volcanology 74 (10), 2321–2338.
McLennan, M., Clark, S., Deelman, E., Rynge, M., Vahi, K., McKenna, F., et al. (2015). HUBzero and Pegasus: Integrating Scientific Workflows into Science Gateways. Concurrency Computat.: Pract. Exper. 27 (2), 328–343. doi:10.1002/cpe.3257
McLennan, M., and Kennell, R. (2010). HUBzero: A Platform for Dissemination and Collaboration in Computational Science and Engineering. Comput. Sci. Eng. 12 (2), 48–53. doi:10.1109/mcse.2010.41
Neeman, A. G., Gallo, S. M., and Efstathiadis, E. (2010). Collaborative Research in a Regional Grid. Gateway Comput. Environments Workshop, 1–11. doi:10.1109/gce.2010.5676131
Patra, A. K., Bauer, A. C., Nichita, C. C., Pitman, E. B., Sheridan, M. F., Bursik, M., et al. (2005). Parallel Adaptive Numerical Simulation of Dry Avalanches over Natural Terrain. J. Volcanology Geothermal Res. 139 (1-21–21). doi:10.1016/j.jvolgeores.2004.06.014
Pouget, S., Bursik, M., Singla, P., and Singh, T. (2016). Sensitivity Analysis of a One-Dimensional Model of a Volcanic Plume with Particle Fallout and Collapse Behavior. J. Volcanology Geothermal Res. doi:10.1016/j.jvolgeores.2016.02.018
Rohit, S., Patra, A., and Chaudhary, V. (2014). Integrating Data and Compute-Intensive Workflows for Uncertainty Quantification in Large-Scale Simulation: Application to Model-Based hazard Analysis. Int. J. Comp. Math. 91 (4), 730–747. doi:10.1080/00207160.2013.844337
Rue, H., and Held, L. (2005). Gaussian Markov Random Fields: Theory and Applications. Gaussian Markov Random Fields 104, 02.
Sperhac, J., DeLeon, R. L., White, J. P., Jones, M., Andrew, E. B., Jones Ivey, R., et al. (2020). Towards Performant Workflows, Monitoring and Measuring. In 2020 29th International Conference on Computer Communications and Networks, 1–9. doi:10.1109/icccn49398.2020.9209647
Sperhac, J. M., Poinar, P., Jones-Ivey, R., Briner, J., Csatho, B., Nowicki, S., et al. (2021). GHub: Building a Glaciology Gateway to Unify a Community. Concurrency Comput. Pract. Experience 33 (19), e6130.
Spiller, E. T., Bayarri, M. J., Berger, J. O., Calder, E. S., Patra, A. K., Pitman, E. B., et al. (2014). Automating Emulator Construction for Geophysical Hazard Maps. Siam/asa J. Uncertainty Quantification 2 (1), 126–152. doi:10.1137/120899285
Stefanescu, E. R., Bursik, M., Cordoba, G., Dalbey, K., Jones, M. D., Patra, A. K., et al. (2012). Digital Elevation Model Uncertainty and hazard Analysis Using a Geophysical Flow Model. Proc. R. Soc. Lond. A: Math. Phys. Eng. Sci. 468, 1543–1563.
Stefanescu, E. R., Patra, A. K., Bursik, M. I., Madankan, R., Pouget, S., Jones, M., et al. (2014). Temporal, Probabilistic Mapping of Ash Clouds Using Wind Field Stochastic Variability and Uncertain Eruption Source Parameters: Example of the 14 April 2010 Eyjafjallajökull Eruption. J. Adv. Model. Earth Syst. 6 (4), 1173–1184. doi:10.1002/2014ms000332
Stein, A. F., Draxler, R. R., Rolph, G. D., Stunder, B. J. B., Cohen, M. D., and Ngan, F. (2015). NOAA's HYSPLIT Atmospheric Transport and Dispersion Modeling System. Bull. Am. Meteorol. Soc. 96 (12), 2059–2077. doi:10.1175/bams-d-14-00110.1
Takarada, S., Bandibas, J. C., and Ishikawa, Y.Ever Promotion Team, G (2014). Global Earthquake and Volcanic Eruption Risk Management Activities, Volcanic hazard Assessment Support System and Asia-pacific Region hazard Mapping Project in G-EVER. Episodes 37, 321–328. doi:10.18814/epiiugs/2014/v37i4/014
Takarada, S. (2017). The Volcanic Hazards Assessment Support System for the Online Hazard Assessment and Risk Mitigation of Quaternary Volcanoes in the World. Front. Earth Sci. 5, 102. doi:10.3389/feart.2017.00102
University of Wisconsin–Madison Center for High Throughput Computing (2021). HTCondor Manual. University of Wisconsin–Madison.
Williams, M., Bursik, M. I., Cortes, G. P., and Garcia, A. M. (2017). Correlation of Eruptive Products, Volcán Azufral, Colombia: Implications for Rapid Emplacement of Domes and Pyroclastic Flow Units. J. Volcanology Geothermal Res. 341, 21–32. doi:10.1016/j.jvolgeores.2017.05.001
Williams, M. (2015). Eruption History and Pyroclastic Flow Modeling at Azufral Volcano, Colombia. Master Thesis. Buffalo, NY: Department of Geology, University at Buffalo.
Woodhouse, M., Hogg, A., and Phillips, J. Laharflow. Available at: https://www.laharflow.bristol.ac.uk/help/userguide/FrontPage.php (accessed October, 2021).
Keywords: uncertainty quantification, volcanology, hazard mapping, volcanic hazard assessment, Pegasus Workflow Management System, ash cloud, pyroclastic flow
Citation: Jones-Ivey R, Patra A and Bursik M (2022) Workflows for Construction of Spatio-Temporal Probabilistic Maps for Volcanic Hazard Assessment. Front. Earth Sci. 9:744655. doi: 10.3389/feart.2021.744655
Received: 20 July 2021; Accepted: 20 December 2021;
Published: 14 January 2022.
Edited by:
Sara Barsotti, Icelandic Meteorological Office, IcelandReviewed by:
Warner Marzocchi, University of Naples Federico II, ItalyStuart Mead, Massey University, New Zealand
Copyright © 2022 Jones-Ivey, Patra and Bursik. This is an open-access article distributed under the terms of the Creative Commons Attribution License (CC BY). The use, distribution or reproduction in other forums is permitted, provided the original author(s) and the copyright owner(s) are credited and that the original publication in this journal is cited, in accordance with accepted academic practice. No use, distribution or reproduction is permitted which does not comply with these terms.
*Correspondence: Renette Jones-Ivey, cmVuZXR0ZWpAYnVmZmFsby5lZHU=