 Linfei Wang
 Huaishan Liu1,2*
- 1Key Lab of Submarine Geosciences and Prospecting Techniques, College of Marine Geo Sciences, Ocean University of China, Qingdao, China
- 2Laboratory for Marine Mineral Resources, Qingdao National Laboratory for Marine Science and Technology, Qingdao, China
- 3College of Marine Geosciences, Ocean University of China, Qingdao, China
Marine vertical cable seismic (VCS) is a promising survey technique for submarine complex structure imaging and reservoir monitoring, which uses vertical arrays of hydrophones deployed near the seafloor to record seismic wavefields in a quiet environment. Recently, we developed a new type of distributed VCS system for exploration and development of natural gas hydrates preserved in shallow sediments under the seafloor. Using this system and air-gun sources, we accomplished a 3D VCS yield data acquisition for gas hydrates exploration in the Shenhu area, South China Sea. In view of the characteristics of VCS geometry, we implement reverse time migration (RTM) on a common receiver gather to obtain high-resolution images of marine sediments. Due to the unique acquisition method, it is asymmetrical for the reflection path between the sources and the receivers in the VCS survey. Therefore, we apply accurate velocity analysis to common scatter point (CSP) gathers generated from common receiver gathers instead of the conventional velocity analysis based on common depth point gathers. RTM with this reliable velocity model results in high-resolution images of submarine hydrate-bearing sediments in deep water conditions. The RTM imaging section clearly shows the bottom simulating reflector (BSR) and also the reflection characteristics of the hydrate-bearing sediments filled with consolidated hydrates. Moreover, its resolution is relative to that of acoustic logging curves from the nearby borehole, and this imaging section is well consistent with the synthetic seismogram trace generated by the logging data. All these results reveal that VCS is a great potential technology for exploration and production of marine natural gas hydrates.
Introduction
Vertical cable seismic (VCS) is a potential prospective technology for target imaging in geologically complex areas (Krail, 1991; 1993), especially for offshore acquisition (Ikelle and Wilson, 1999). This technology is based on antisubmarine warfare from the US Navy (Krail, 1994). It uses vertical hydrophone array (VHA) to record seismic wavefield, which is moored near the seafloor with a heavyweight anchor. Then, the source can be air-gun or other sources such as sparker, towed by a seismic survey vessel. Higher resolution seismic data can be acquired using vertical cables with no more than 500 m in length at 500 m intervals (Wilson, 2002), compared with conventional marine seismic survey.
From the late 1980s to the early 1990s, Texaco Inc. constructed vertical cables and conducted vertical cable acquisition experiments in the Gulf of Mexico (Krail, 1994; 1997). They obtained high-quality 3D seismic volume with this special method. The edge of the salt dome and the reflectors below salt are clearly imaged using the VCS volume. It is difficult for conventional seismic exploration to overcome this problem. In the summers of 1995 and 1996, the Strathspey Field Group performed the VCS survey in the North Sea (Leach, 1997). The processed dataset shows dramatic improvement over the conventional 3D dataset. Moreover, it provides the partners with an effective assessment of the remaining exploration potential in the Strathspey block. However, VCS has not been widespread used for resource survey owing to its expensive acquisition system and unique processing method. In 2009, JGI Inc. started to develop an integrated VCS acquisition system for hydrothermal deposit exploration and research on corresponding data processing and analysis technique (Asakawa et al., 2012). They carried out the VCS experiment in Lake Biwa and obtained high-resolution 3D images which are better than the conventional surface seismic. Based on this experiment, they manufactured autonomous VCS recording systems in 2010. Using these VCS acquisition systems, they conducted seafloor massive sulphide (SMS) survey in Izena Cauldron in 2011 and 2013, respectively (Asakawa et al., 2014a; 2014b; 2015; 2016). The first survey gives the large-scale and deeper structure of hydrothermal system and the second survey gives the clear structure of SMS deposit. Since 2013, the Guangzhou Marine Geological Survey Bureau of Chinese Geological Survey Bureau and Ocean University of China (OUC) have been developing VCS technology for Natural Gas Hydrates exploration, financially supported with National High-Technology Research and Development Program of China. In 2015, the Guangzhou Marine Geological Survey Bureau of Chinese Geological Survey Bureau manufactured a VCS system composed of multiple ocean bottom seismometers (OBS) and carried out a test with “Fendou4” vessel in the South China Sea (Huang et al., 2016). In the same year, OUC developed a distributed VCS recording system with eight hydrophones and performed an experiment with “Nahai502” vessel in Southeast Hainan Basin (Xing et al., 2016). In 2017, a multi-OBS VCS acquisition system (Wang et al., 2019) and a distributed VCS acquisition system were developed, respectively. Then, the Guangzhou Marine Geological Survey Bureau of Chinese Geological Survey Bureau conducted the first 3D VCS survey for natural gas hydrates in the Shenhu area, South China Sea.
In this study, we review the concept of the VCS survey and present the construction of the distributed VCS acquisition system for exploring the hydrates resources beneath the seafloor, and we process and analyze the VCS dataset recorded by this system in deep water in the South China Sea. In view of the dramatic advantages of reverse time migration (RTM) method, we confirm that RTM helps to better image hydrate-bearing sediments than the other migration method. In order to obtain a reliable velocity model for RTM, we rebuild the common scatter point (CSP) gathers from each common receiver gather of VCS dataset and then perform accurate velocity analysis on these CSP gathers. With this velocity model, we implement RTM on the common receiver point gather of the first receiver and obtain high-quality images of the shallow sediments layers. In comparison with synthetic seismogram made by the P-wave velocity from log data in nearby well, the imaging result presents high resolution relative to acoustic logging curves and provides a better understanding of the characteristic of hydrate-bearing sediments.
Marine Vertical Cable Seismic Exploration
General Concept
VCS technology was first applied in the marine setting (Wilson, 2002). As is illustrated in Figure 1, vertical seismic cable is deployed at the sea bottom which is close to the subsurface target. Multihydrophones compose vertical array, attached to the cable with regular intervals. A set of buoyant spheres is moored on the top of the cable and the heavy anchor is moored at the sea bottom, in order to maintain vertical tension on the cable. Generally speaking, the recording units are arranged in an instrument of buoy, which can record seismic signals continuously. As vertical cable is fixed near the seafloor, the source vessel could shoot along the surveying lines in any azimuth. In addition, VCS acquisition can use various marine sources, such as sparkers and air-gun (Asakawa et al., 2012). In fact, VCS exploration can be considered a multi-offset vertical seismic profiling (VSP). The main difference is that all hydrophones are suspended in sea water for VCS and receiver sensors are arranged in the borehole for VSP. Therefore, VCS has no expensive standby rig time. It also has several advantages over conventional marine seismic exploration (Krail, 1991; Wang, 2003):
1) VCS can provide high-resolution 3D images around submarine targets. Compared with the conventional towed-streamers survey, it does not suffer from the swell at greater depths in seawater. Hence, the VCS data with high signal-to-noise ratio (SNR) is effective for reservoir characterization.
2) Vertical cable is fixed for all shot points, so a true 3D shot record is obtainable. Yield acquisition geometry can be designed to suit exploration and production needs, because it allows complete flexibility in azimuth and offset distribution for survey planning.
3) VCS exploration costs are considerably less than conventional 3D seismic surveys. With no towed-streamers, the seismic vessel can navigate easily and quickly over the survey area. Thus, it greatly reduces the time of data acquisition in yield. In addition, it more economically performs 3D pre-stack depth migration on VCS dataset compared with conventional surface data.
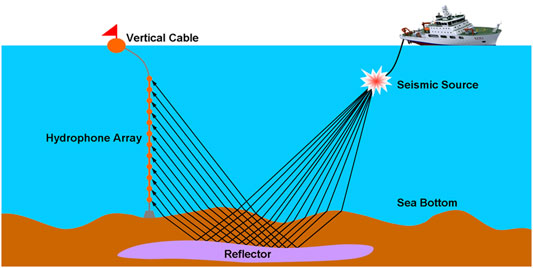
FIGURE 1. Sketch of vertical cable seismic exploration.
Distributed Vertical Cable Seismic Acquisition System
It is becoming increasingly more difficult for exploration and production of natural gas hydrates in geologically complex area. During gas hydrates drilling or production operations, it is unavoidable for hydrate-bearing sediments to destabilize spontaneously as part of geologic processes (Wang et al., 2012). Therefore, the fine structure of hydrate-bearing sediments is indispensable in exploration and development of gas hydrates. It is extremely difficult to achieve this goal for the conventional 3D multi-channel seismic with long streamers. Considering the advantages of VCS, we propose that it is an effective technology to obtain high-resolution 3D images of hydrate-bearing sediments.
After years of painstaking research, we have completed development of a distributed vertical cable seismic (DVCS) acquisition system for natural gas hydrates exploration and production in 2017. Its construction is shown in Figure 2. The DVCS acquisition system uses a high-strength Kevlar stress member in order to satisfy marine engineering requirements. This Kevlar cable length is about 300 m. Twelve hydrophone arrays are attached to outside of the Kevlar cable with 25 m interval and each array is composed of two parallel hydrophones. Six digitizer modules are arranged in the cable and each of them can record seismic data from two hydrophone arrays, respectively. The sampling rate of these digitizer modules is up to 8,000 Hz. With this sampling rate, it can record the data continuously for about 2 weeks in the water depth of about 2,000 m. An accurate atomic clock is assembled in every module in order to correct the recording time. It should be synchronized with the GPS time before deploying this acquisition system. In order to obtain the positions of the vertical cable, three ultra-short base line (USBL) acoustic position systems are deployed on the top, in the middle, and at the end of the cable, respectively. In the beginning of the VCS survey, we can throw the vertical cable into the water from the vessel. Then, it can be autonomously moored on the seabed by a cement anchor at the bottom. By this heavy anchor (about 300 kg) and the buoyancy with several buoys on the top, the seismic vertical cable is being tensioned vertically in the sea water. When retrieving this vertical cable at the end of the survey, we can transmit a release command to the two parallel acoustic releasers by the acoustic communication system. Then, we can download the yield data from those digitizer modules onboard, conveniently.
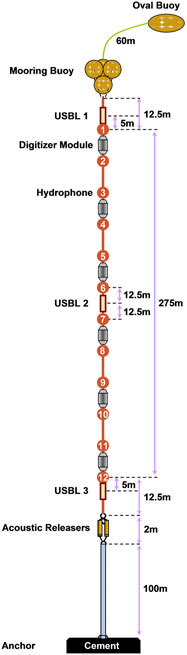
FIGURE 2. Distributed vertical cable seismic acquisition system.
Reverse Time Migration
High-resolution seismic exploration has been widespread used in resources exploration and development in recent years (Li, 2017). Seismic imaging is the most effective approach to map the subsurface structures and locate the target in the geologically complex area (Zhou et al., 2018). Reverse time migration (RTM) has proved to be one of the most vigorous seismic imaging methods. With no limitation on the variations in velocity, reflector dip, and wave type, RTM can achieve the best accuracy among all seismic migration methods (Bednar, 2005). It computes forward-in-time propagation of the source field and the reverse time propagation of the receiver field, without any simplification assumption (Baysal et al., 1983; McMechan, 1983), and the migrated section (or reflectivity estimate) can be obtained by crosscorrelation of these two fields at equal times.
Image fidelity including resolution limitations, position errors, and artifacts are the main challenges for seismic imaging (Zhou, 2014). In practice of exploration geophysics, velocity model building and seismic migration such as RTM are applied jointly and interactively under variety of geology and data conditions. Therefore, an accurate velocity model is essential to implement RTM effectively. Conventional velocity analysis method is not being applied to the VCS data, due to the irregular yield geometry of the VCS survey. Alternatively, an imaging technique based on common scatter point (CSP) gathers has been developed for VCS data processing (Wang, 2003). Based on this method, accurate velocity analysis can be implemented at each imaging position in different depths. Consequently, we can build a reference velocity model with previous processes. What’s more, conventional processing methods are able to implement on the CSP gathers. Another effective approach to obtain the velocity wavefield is to perform velocity analysis on virtual shot gathers produced by seismic interferometry of multiples in the VCS data (Hondori et al., 2019). In this paper, we apply the CSP-based processing method to build the velocity wavefield used for RTM.
Data Acquisition Experiment
The 3D VCS acquisition for natural gas hydrates exploration was carried out by the Guangzhou Marine Geological Survey Bureau in April 2017 to obtain the fine structure of hydrate-bearing sediments in the Shenhu area, South China Sea (Figure 3). Two vertical cables are deployed at the central part of the survey area in this experiment. One is the multi-OBS vertical cable, the other one is the DVCS acquisition system. GI gun array (540 cu. in) is used as the source for this experiment. The shooting area (pink dashed frame in Figure 4) is about 6 km × 6 km with 25 m shot point interval. In total, 60 shot lines spread over this area with 100 m shot line interval, and they are numbered from L13 to L72, respectively. The DVCS acquisition system (12-channel) recorded seismic waves with 0.25 msec sampling rate, continuously. Several days later, a high-quality vertical cable dataset is obtained for hydrate-bearing sediments imaging.
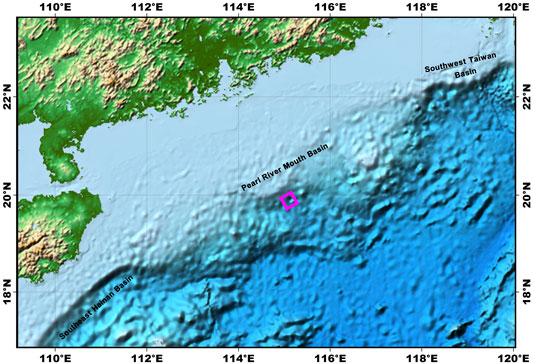
FIGURE 3. Location map of VCS acquisition in the study area. The pink square frame indicates the area of VCS operation.
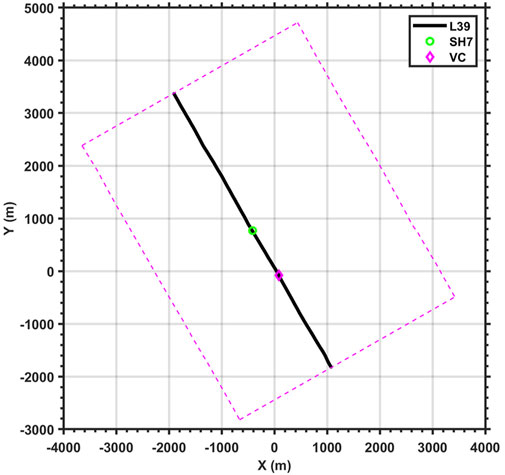
FIGURE 4. Location of Line 39 (black line) in the 3D survey area (pink dashed frame). Blue circle shape indicates the position of Well SH7 and the pink diamond shape indicates the position of the vertical cable.
Surveying Line 39 is the closest to VC among all the shot lines, through Site SH7. The vertical cable is approximately 13 m away from the L39 line. Hence, we mainly focus on hydrate-bearing sediments imaging across this surveying line in this paper. Figure 5A shows a common receiver point gather (just like shot record in conventional surface seismic), sorted by the first channel from the field data in Line 39. It is band-pass filtered to remove low (less than 12 Hz) and high (more than 512 Hz) frequencies. This gather clearly shows the direct wave, seafloor refection, and multiple reflection. In addition, enhanced reflections (ER) with greater amplitudes seem to be present above the weakness reflection zones. Their energy is comparable to that of the direct wave and the seafloor reflection.
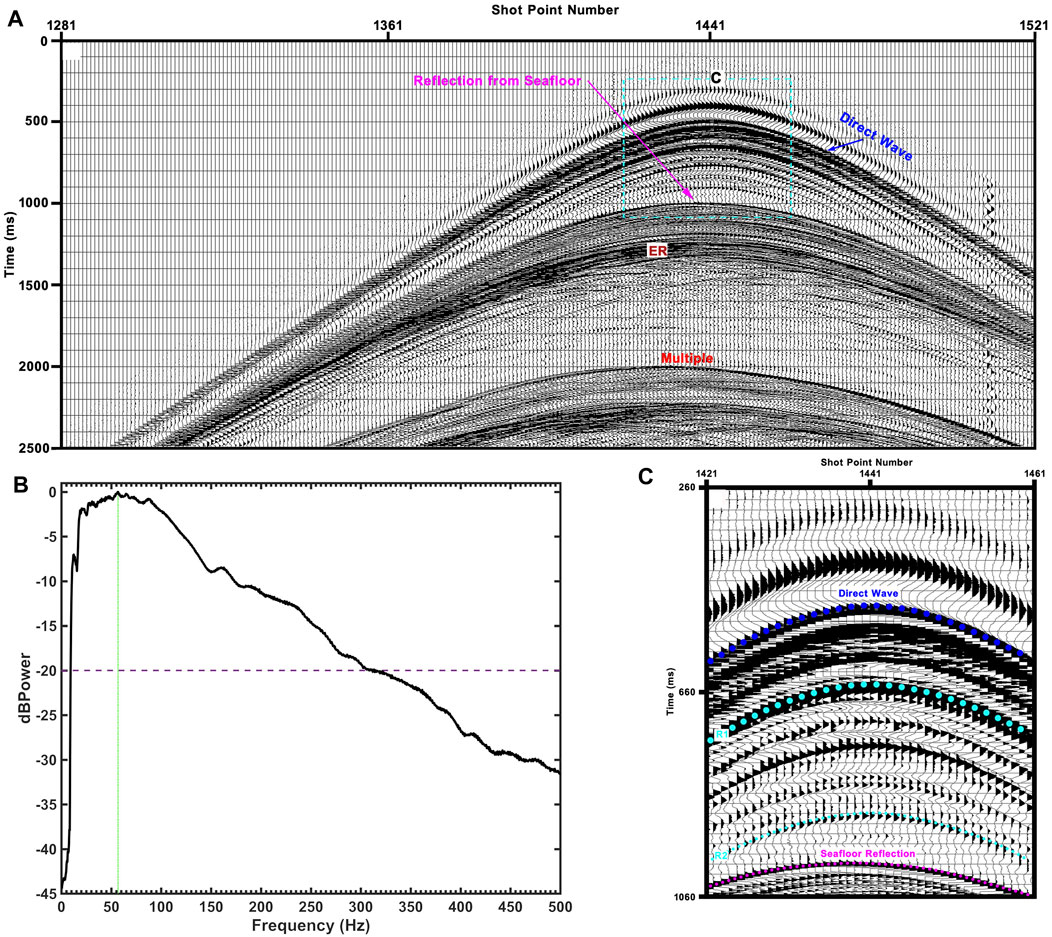
FIGURE 5. (A) Common receiver gather from the first receiver after band-pass filtered. (B) The spectrum of this common receiver gather. (C) The seismic reflections from the seawater layers. The water body reflections occur between dashed line R1 and R2.
Data Processing
Similar to the 3D Walkaway VSP technique, VCS can use VSP processing and imaging workflows for data processing (Bailey et al., 2017). However, there is no universal processing method for VCS dataset up to now. Aiming at primary waves imaging in this paper, we mainly apply the CSP-based approach (Wang, 2003) to process the VCS data. As shown in Figure 6A, the reflection time can be expressed as follows:
where ts is the traveltime from the source to the reflection point, tr is the traveltime from the reflection point to the receiver point, v0 is the acoustic velocity of the seawater, xs is the horizontal distance from the source to the reflection point, xr is the horizontal distance from the receiver to the reflection point, h is the depth of the reflector, hr is the depth of the receiver,
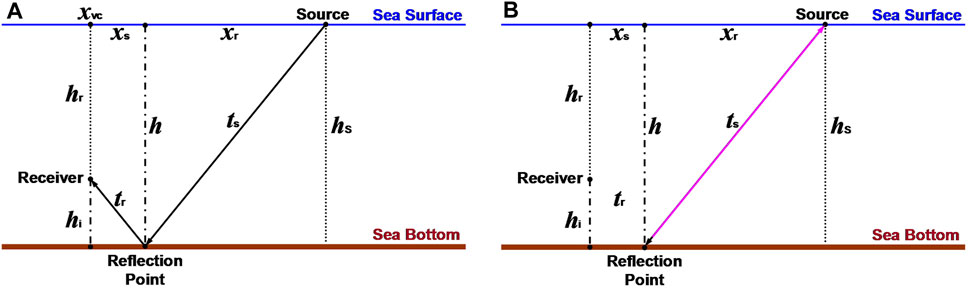
FIGURE 6. The schematic diagram showing generation of CSP gathers from a common receiver gather. (A) The ray path in VCS geometry. (B) The sketch of common scatter point.
As illustrated in Figure 6B, it can be described as a process of time shift (
In this paper, we select one common receiver gather from the first channel (Figure 5A) along the source line L39 to perform seismic imaging process. After initial velocity analysis, we produce a lot of CSP gathers with 6.25 m interval. In fact, the interval of CSP gather can be defined as arbitrary value (for example, 1 m) according to the imaging accuracy. Figure 7 shows three CSP gathers (the direct wave is muted) generated from the first channel, respectively. Among them, CSP 180 is nearly located at the same surface position as the vertical seismic cable. Seafloor reflection and enhanced reflection are clearly recognized in these CSP gathers and their events are continuous. After applying the residual velocity analysis to these CSP gathers, we obtain the more accurate velocity model which is used for RTM (Figure 8). Finally, we implement reverse time migration of the common receiver gather from the first channel with this velocity wavefield and the imaging result is shown in Figure 9A. In this RTM section, we can clearly recognize seafloor reflection and reflections related to marine sediments beneath the seafloor. This imaging section gives useful information to hydrates exploration.
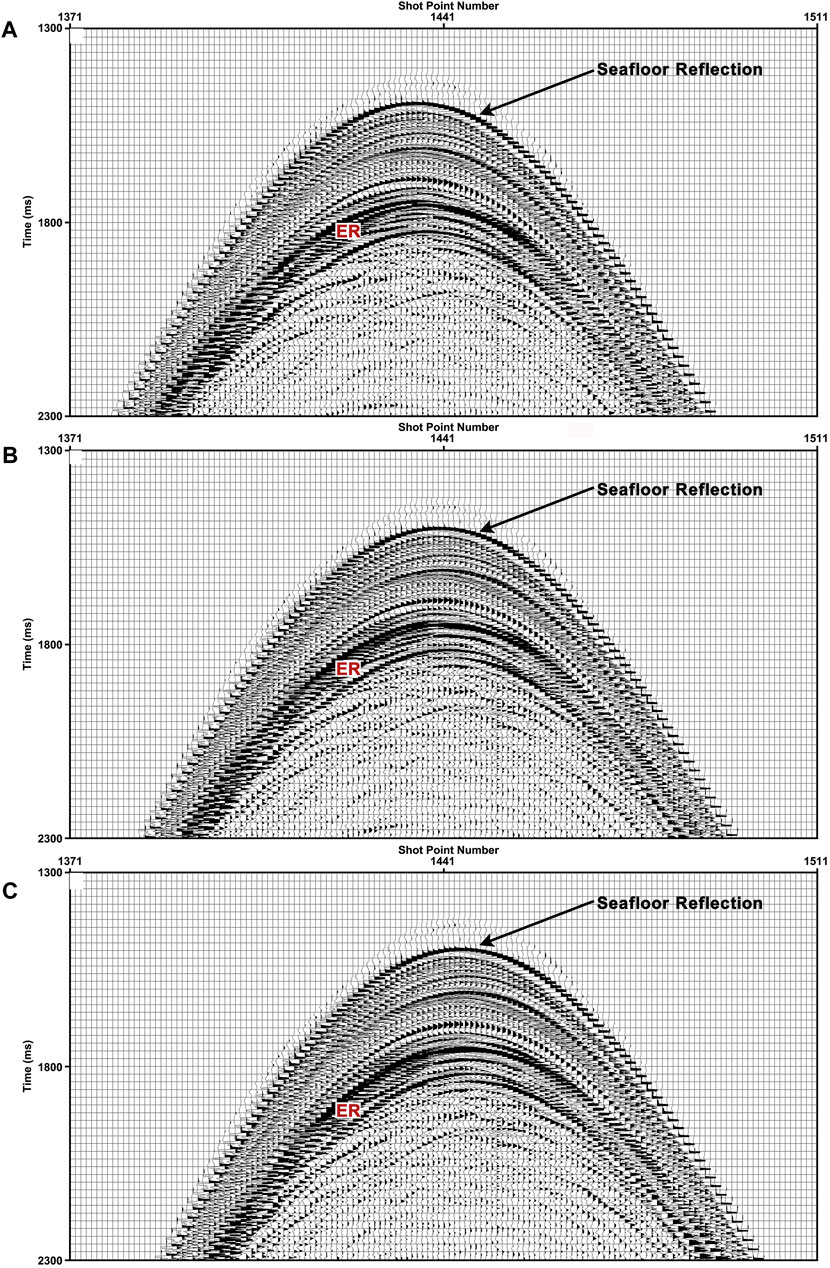
FIGURE 7. The CSP gathers. (A) CSP 165. (B) CSP 180. (C) CSP 195.
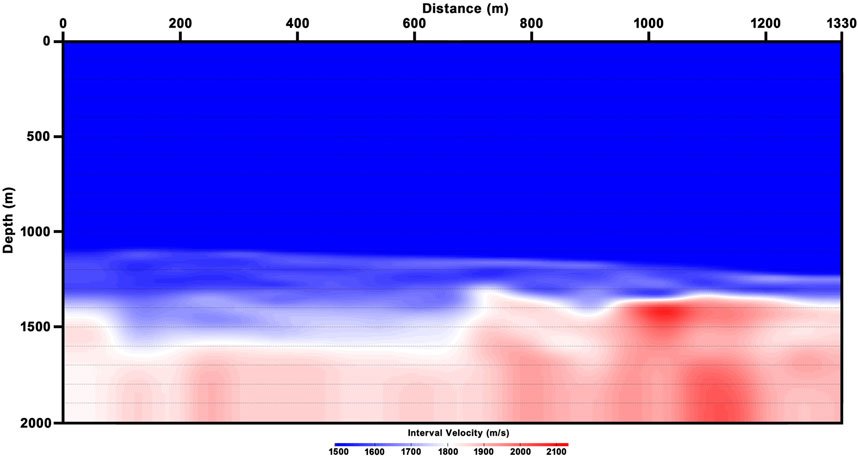
FIGURE 8. Velocity model used for RTM.
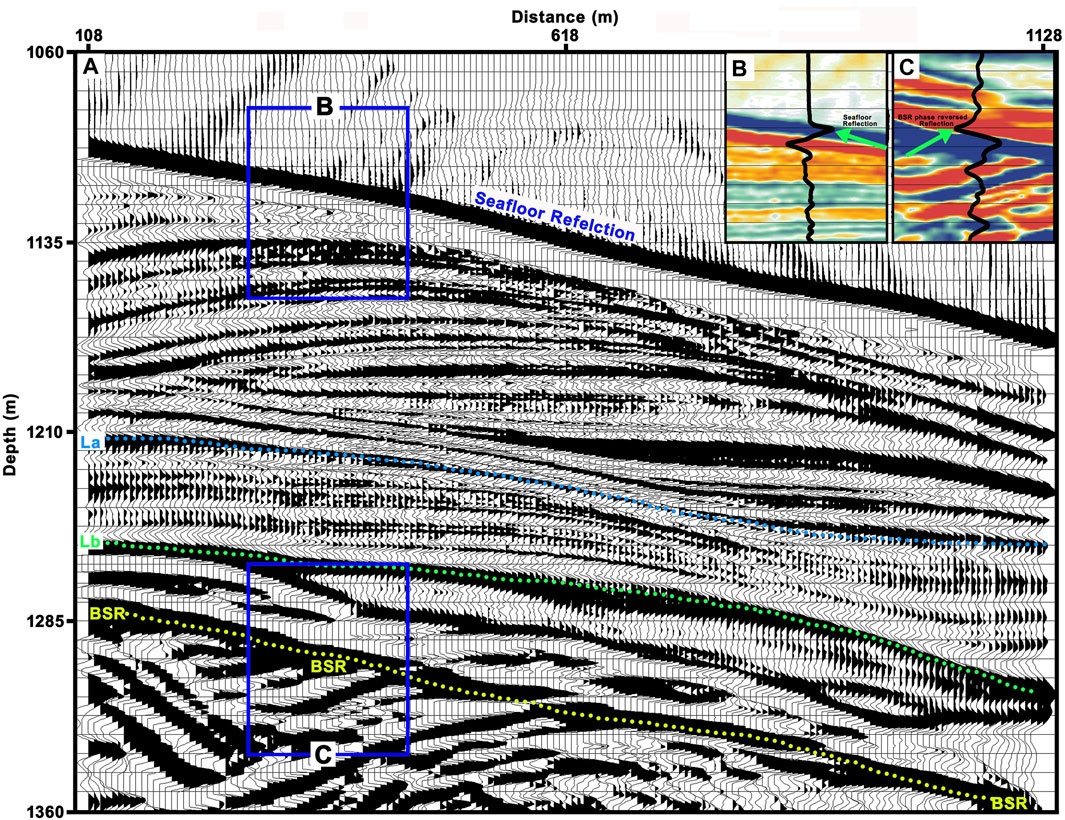
FIGURE 9. (A) The RTM imaging section with velocity model shown in Figure 8. The yellow dotted line shows the BSR. (B) Closeup view shows the signature of seafloor reflection. (C) Closeup view shows the signature of bottom simulating reflector (BSR) which is phase reversed reflection.
Results and Discussion
RTM Is Suitable for VCS Imaging
In principle, RTM offers the best accuracy than that of the other seismic migration methods (Bednar, 2005; Zhou et al., 2018). According to its advantages, RTM can provide depth imaging with better quality in complex geologic structure such as hydrate-bearing sediments. VCS uses vertical arrays of hydrophones to acquire seismic data in marine environment so that the sources and receivers locate at significantly different depths. Consequently, the large elevation difference makes it invalid to process VCS data with conventional method based common midpoint (CMP) theory such as velocity analysis, normal move-out (NMO), common depth point (CDP) stack, and seismic imaging (Wang, 2003). RTM is a shot-based processing, independent of acquisition irregularity. Hence, it can address the large elevation changes by assuming the concept of seismic reciprocity to exchange sources and receivers locations for imaging (Guimarães et al., 1998; Shen et al., 2000). According to reciprocal principle, the common receiver gather would be equivalent to a shot gather where the single receiver would be the source in seawater and the receivers would be the shots generated close to the sea surface. Thus, RTM as a pre-stack shot record migration was applied on this common receiver gather. As a result, it is convenient to implement RTM for VCS dataset, especially for complex geological area.
Seismic migration is the most effective way to image the subsurface, based on seismic reflected waves including scattered and diffracted waves (Zhou et al., 2018). In order to obtain better imaging results, it is essential to build an accurate velocity modeling for seismic migration such as RTM. VCS uses vertical hydrophone array suspended in seawater environment to record seismic wave, compared with horizontal arrays in towed-streamer. As a result, single hydrophone can be used at each receiver point, which provides complete seismic data used for accurate data analysis. Hence, it is possible to build accurate velocity model from VCS dataset. In addition, we establish the reference velocity model by accurate velocity analysis on common scatter point (CSP) gathers. In practice, constructing CSP gathers from common receiver gathers is an initial process of Kirchhoff pre-stack migration (Bancroft and Xu, 1999). By this processing, we can address large elevation changes and the travel times for the source and receiver ray paths can be computed to the actual locations. In particular, CSP gathers can be created at any arbitrary location with VCS dataset for velocity analysis so that the high fold and large offsets enable accurate velocity analysis at each imaging point position (Wang, 2003). If we form a common depth gather in a VCS dataset, it will be sparsely populated in offset and low in fold, since there are only a few receivers for a source in the VCS geometry. Thus, we can obtain more accurate velocity model for RTM based on the idea of CSP gathers, compared with conventional process method. With this reference velocity model, we can obtain better seismic imaging section by performing RTM on VCS dataset. As mentioned above, RTM is an effective way to better image subsurface geologic structure for VCS dataset.
Resolution for VCS Dataset
High-resolution seismic prospecting is profound system engineering, consisting of many links (such as field acquisition, data processing, and interpretation). A weakness in any link may result in the failure of the entire system (Li, 2017). Improving seismic resolution has been a primary issue to be debated in exploration seismology, especially in petroleum exploration.
Compared with conventional seismic exploration, VCS can obtain high-resolution seismic data with high signal-to-noise ratio (SNR). First of all, vertical cable is suspended within the seawater so that the seismic vessel is only towing the source (Wilson, 2002). As a result, we can obtain adequate resolution only by evaluating the interval between the source lines. Secondly, hydrophones are suspended in a quiet environment compared with surface seismic prospecting so that single hydrophone can be used at each receiver point in different water depths (Wang, 2003). It provides adequate bandwidth of the field VCS dataset, which seismic resolution is dependent upon. Thirdly, vertical cables are moored near the seafloor and the hydrophones are close to the target underneath the seabed. Thus, the Fresnel zone is smaller than surface seismic and better imaging results can be obtained from the VCS dataset. Finally, all the hydrophone sensors are suspended within the water column, overcoming receiver coupling problems and avoiding lots of noises such as mechanical cable noise, swell noise, and tail buoy noise. Consequently, the SNR of field VCS dataset is significantly improved and the high-quality data are effective for reservoir characterization. In a word, the seismic resolution of VCS dataset is superior to the surface seismic method.
Figure 5A shows a common receiver point gather from the first channel in Line 39, which is band-pass filtered. By spectrum analysis, we obtain the peak frequency is about 56 Hz (vertical solid line) and the dominant bandwidth is about 10–300 Hz (dashed line). Li (2017) points out seismic resolution is dependent upon the relative bandwidth. For a band-pass filtered wavelet, its low-frequency limit can be defined as
The imaging resolution of vertical cables is superior to surface seismic methods for an image point, horizontal reflector, and dipping reflector (Wilson, 2002). For the sake of preserving the resolution, we perform RTM on the primary reflections in the common receiver gather sorted from original VCS dataset, with accurate velocity model (Figure 8). As shown in Figure 9A, we obtained the imaging section with high resolution and high SNR. Seafloor reflection and sediments waves beneath the seafloor can be clearly recognized from this imaging section. In order to illustrate the high resolution of the imaging section with RTM, the P-wave velocity (the red curve in Figure 10A) from logging data at Site SH7 is superimposed to highlight on the imaging section. It shows that the resolution of the imaging section is relative to that of the P-wave velocity curve, especially around depth of 1249 m. In addition, we calculated the synthetic seismogram (the red curve in Figure 10B) using the extracted source wavelet with the logging data at Site 7. In Figure 10B, seismic traces around Site SH7 agree well with the synthetic seismogram (the red curve). Consequently, this RTM result has adequate resolution to figure out the structure of hydrate-bearing sediments.
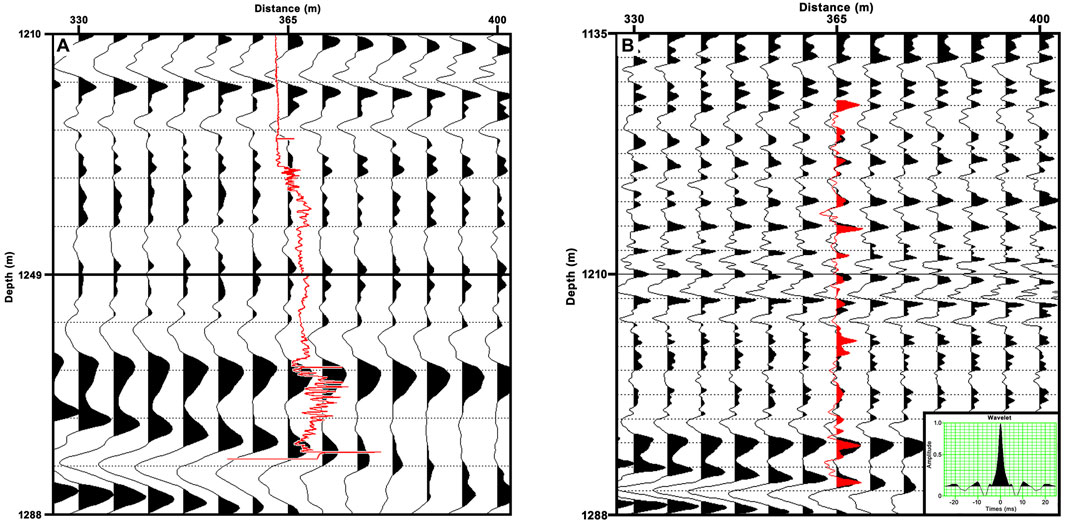
FIGURE 10. (A) The comparison of VCS imaging section through Site SH7. The red curve is the P-wave velocity from the logging data at Site SH7. (B) Synthetic seismogram (the red curve) intersects the imaging section.
Characterization of Hydrate-Bearing Sediments
Bottom simulating reflectors (BSRs) are phase reversed polarity reflections with respect to the seafloor reflection, parallel to the seafloor. In general, the occurrence of the BSRs is used to indicate the presence of gas hydrate on seismic sections (Wang et al., 2014). BSRs coincide with the base of gas hydrate stability zone (BGHSZ) so that it can be used to infer the presence of free gas below the BSRs. Consequently, BSRs are considered as a prominent indication between overlying hydrate-bearing sediments and underlying free gas zone. A high amplitude continuous BSR with reversed polarity was identified on the RTM imaging section through Site SH7, indicated by the yellow dotted line in Figure 9A. This regional BSR cross-cuts the reflection from the normal strata, approximately located at the depth of 1292 m under the sea surface around Site SH7.
The Site SH7 was drilled in water depths of 1,105 m. In the conventional surface seismic section crossing Site SH7, the continuous, prominent BSR was identified at a depth of 181 m below the seafloor (mbsf) and the depth to the BGHSZ at 184 mbsf was calculated from core temperature measurement at this site (Wang et al., 2014). Compared with this depth of BSR inferred by surface seismic, the depth of BSR on the RTM section from VCS dataset is about 187 mbsf. The difference between the two depth values may be caused by different resolution of seismic dataset, so we consider the depth of BSR on VCS RTM section is relatively reliable. High P-wave velocity and resistivity was measured from 155 to 180 mbsf at Site SH7 (Figure 11) and it shows the gas hydrate-bearing sediments layer is about 25 m thick just above the predicted BGHSZ (Wang et al., 2011). Corresponding to this thick layer, these enhanced reflections appear in Figure 9A, between the green dotted line Lb and the yellow dotted line BSR. Free gas is believed to be trapped in unconsolidated sediments, underneath the hydrate-bearing sediments. Figure 11 shows P-wave velocity elevates at depths ranging from 125 to 150 mbsf, and it indicates the lithological changes (Wang et al., 2014). Reflections with respect to these lithological changes appear between the blue dotted line La and the green dotted line Lb in Figure 9A. These reflections reveal the fine structure of hydrate-bearing sediments, which is difficult to obtain this structure by conventional seismic surveys. The variation of these reflections indicates heterogeneous nature of the hydrate-bearing sediments. Considering the characteristics of gas hydrate formation and accumulation, we infer that these hydrate-bearing sediments are partially filled with consolidated hydrates and it leads to lithological changes in sediments layers. As a result, reflections from these hydrate-bearing sediments vary considerably in amplitudes, frequencies, and phases. In summary, RTM section from VCS dataset provides fine structure of hydrate-bearing sediments with high resolution and high SNR.
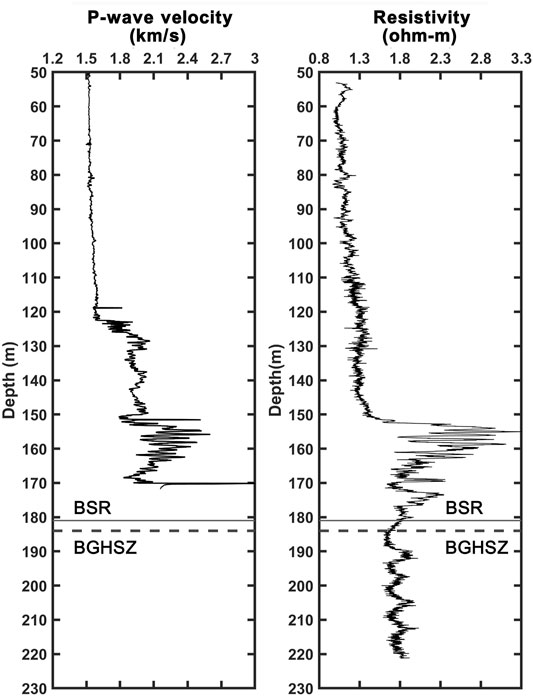
FIGURE 11. Logging data display acquired from Site SH7 from left to right: P-wave velocity and resistivity. Solid line shows the depth of the bottom simulating reflector (BSR) and the dashed line shows the base of gas hydrate stability zone (BGHSZ).
Conclusion
High-quality 3D VCS data were acquired for natural gas hydrates exploration in deep water, South China Sea. However, it is difficult to image these datasets with conventional seismic processing method due to the irregular acquisition characteristics of VCS. We make use of CSP-based technique to perform accurate velocity analysis to obtain a reliable velocity model. Then, we perform RTM on common receiver gather from VCS dataset with this velocity wavefield and obtain the high-resolution image of hydrate-bearing sediments. The imaging section clearly shows BSR and the reflections from sediments partially filled with the consolidated hydrates. It is well in agreement with the synthetic seismogram trace generated by the P-wave velocity from log data at Site SH7, and it illustrates that the imaging result of VCS dataset is of higher resolution and higher SNR than that of the conventional surface seismic exploration. In conclusion, the results clearly show a great improvement in seismic imaging of hydrate-bearing sediments with high resolution which cannot be achieved by conventional seismic survey for hydrates. The VCS survey will become an effective approach to explore and develop natural gas hydrates in the future.
Data Availability Statement
The raw data supporting the conclusions of this article will be made available by the authors, without undue reservation.
Author Contributions
HL and LW contributed to design of the study. ZW debugged the programs of RTM. JZ made synthetic seismogram. LX and YY organized the database. LW wrote the first draft of the manuscript. All authors contributed to manuscript revision, read, and approved the submitted version.
Funding
This work was financially supported by the National Natural Science Foundation of China (No. 91958206), the Fundamental Research Funds for the Central Universities (201964016), the National Key R&D Program of China (No. 2017YFC0307401), the National High-Tech R&D Program (No. 2013AA092501), and the China Scholarship Council.
Conflict of Interest
The authors declare that the research was conducted in the absence of any commercial or financial relationships that could be construed as a potential conflict of interest.
Publisher’s Note
All claims expressed in this article are solely those of the authors and do not necessarily represent those of their affiliated organizations, or those of the publisher, the editors, and the reviewers. Any product that may be evaluated in this article, or claim that may be made by its manufacturer, is not guaranteed or endorsed by the publisher.
Acknowledgments
The authors would like to thank the Guangzhou Marine Geological Survey Bureau of Chinese Geological Survey Bureau for conducting the vertical cable seismic acquisition experiment. They also thank the reviewers for their constructive comments and suggestions, which significantly improved the quality of this paper.
References
Asakawa, E., Murakami, F., Sekino, Y., Okamoto, T., Ishikawa, K., Tsukahara, H., et al. (2012). “Development of Vertical Cable Seismic System, "74th EAGE Conference and Exhibition, Extended Abstr. P008. doi:10.3997/2214-4609.20148328
Asakawa, E., Murakami, F., Tsukahara, H., and Mizohata, S. (2014a). "Vertical Cable Seismic (VCS) Survey for Seafloor Massive Sulphide (SMS) Exploration," in 76th EAGE Conference and Exhibition. Extended Abstr. TH ELI2 14. doi:10.3997/2214-4609.20141468
Asakawa, E., Murakami, F., Tsukahara, H., and Mizohata, S. (2014b). “Development of Vertical cable Seismic (VCS) System for Seafloor Massive Sulfide (SMS),” in Proceedings of 2014 Oceans 76th EAGE Conference and Exhibition (St. John’s, NL: IEEE), 1–7. doi:10.1109/OCEANS.2014.7003171
Asakawa, E., Murakami, F., Tsukahara, H., Mizohata, S., and Tara, K. (2015). “Vertical Cable Seismic (VCS) Survey for SMS Exploration in Izena Cauldron, Okinawa-Trough,” in Vertical Cable Seismic Surveys for SMS exploration in Izena Cauldron, Okinawa-Trough: Offshore Technology Conference. doi:10.4043/25680-MS
Asakawa, E., Tara, K., Murakami, F., Tsukaraha, H., and Mizohata, S. (2016). “Vertical Cable Seismic (VCS) Survey for Buried Hydrothermal Sulfide Deposit,” in Vertical Cable Seismic (VCS) Survey for Buried Hydrothermal Sulfide Deposit: Offshore Technology Conference. doi:10.4043/26583-MS
Bancroft, J. C., and Xu, Y. (1999). “Equivalent Offset Migration for Vertical Receiver Arrays,” in Equivalent offset migration for vertical receiver arrays: SEG Annual Meeting, P1279–P1282. Expanded Abstracts. doi:10.1190/1.1820742
Baysal, E., Kosloff, D. D., and Sherwood, J. W. C. (1983). Reverse Time Migration. Geophysics 48, 1514–1524. doi:10.1190/1.1441434
Bednar, J. B. (2005). A Brief History of Seismic Migration. Geophysics 70 (3), 3mj–20mj. doi:10.1190/1.1926579
Guimarães, M. G., Sekharan, K. K., Sukup, D., and Krail, P. (1998). “3‐D Pre‐stack Depth Migration of Vertical cable Data over SEG/EAGE Physical Model,” in 3-D Pre-stack Depth Migration of Vertical Cable Data Over SEG/EAGE Physical Model: SEG Annual Meeting. SEG-1998-1182. doi:10.1190/1.1820104
Huang, J-Y., Wu, Z-L., Wang, W-W., and Cheng-liang, X. (2016). Key Techniques and Experimental Study of Vertical cable Seismic System for Gas Hydrate. Adv. New Renew. Energ. 4 (3), 219–224. doi:10.3969/j.issn.2095-560X.2016.03.009
Ikelle, L. T., and Wilson, R. J. (1999). Potential Impacts of Vertical cable (VC). The Leading Edge 18 (10), 1154–1157. doi:10.1190/1.1438172
Jamali H., E., Katou, M., Tara, K., Asakawa, E., and Mikada, H. (2019). Mirror Reverse Time Migration Using Vertical cable Seismic Data for Methane Hydrate Exploration. Geophysics 84 (6), B447–B460. doi:10.1190/geo2018-0422.1
Krail, P. M. (1993). Sub‐salt Acquisiton with a marine Vertical cable. Extended Abstr., 1376. doi:10.1190/1.1822401
Krail, P. M. (1994). Vertical cable as a Subsalt Imaging Tool. The Leading Edge 13 (8), 885–887. doi:10.1190/1.1437049
Krail, P. M. (1997). “Vertical cable marine Seismic Acquisition,” in Offshore Technology Conference. doi:10.4043/8315-MS
Leach, P. (1997). Strathspey Vertical-Cable Seismic Survey: A North Sea First. SPE, Abstr., 333–347. doi:10.2118/38508-MS
Li, Qing-Zhong. (2017). High-resolution Seismic Exploration. Tulsa: Society of Exploration Geophysicists.
McMechan, G. A. (1983). Migration by Extrapolation of Time-dependent Boundary Values*. Geophys. Prospect. 31 (3), 413–420. doi:10.1111/j.1365-2478.1983.tb01060.x
M. Krail, P. (1991). Case History Vertical cable 3D Acquisition. Extended Abstr., B052. doi:10.3997/2214-4609.201410933
Shen, Y. Q., Valasek, P. A., Kelly, K. R., Whitmore, N. D., and Wyatt, K. D. (2000). 3-D Prestack Reverse-Time Depth Migration Applied to Vertical Cable Seismic Data. SEG Tech. Progr. Expand. Abstr. 762–766. doi:10.1190/1.1816181
Wang, H. J. (2003). Seismic Imaging and Anisotropic Inversion Using Vertical cable Data. [doctor’s thesis] (Edinburgh]: University of Edinburgh).
Wang, X., Collett, T. S., Lee, M. W., Yang, S., Guo, Y., and Wu, S. (2014). Geological Controls on the Occurrence of Gas Hydrate from Core, Downhole Log, and Seismic Data in the Shenhu Area, South China Sea. Mar. Geology. 357, 272–292. doi:10.1016/j.margeo.2014.09.040
Wang, X., Lee, M., Wu, S., and Yang, S. (2012). Identification of Gas Hydrate Dissociation from Wireline-Log Data in the Shenhu Area, South China Sea. Geophysics 77 (3), B125–B134. doi:10.1190/GEO2011-0324.1
Wang, X., Wu, S., Lee, M., Guo, Y., Yang, S., and Liang, J. (2011). Gas Hydrate Saturation from Acoustic Impedance and Resistivity Logs in the Shenhu Area, South China Sea. Mar. Pet. Geology. 28, 1625–1633. doi:10.1016/j.marpetgeo.2011.07.002
Wang, X., Zhao, Q., Wu, Z., Liu, B., and Huang, T. (2019). Research on Vertical cable Seismic Multiples Imaging Processing. Arab J. Geosci. 12, 129. doi:10.1007/s12517-019-4322-3
Wilson, R. J. (2002). Potential Impacts of Vertical cable Seismic: Modeling, Resolution and Multiple Attenuation. [master’s thesis] ([College Station (TX): Texas A&M University).
Xing, L., Liu, H., Zheng, X., Liu, X., Zhang, J., Wang, L., et al. (2016). Phase Characteristic Analysis of Continuous Depth Air-Gun Source Wavelet. J. Ocean Univ. China 15 (5), 815–824. doi:10.1007/s11802-016-3167-6
Zhou, H.-W., Hu, H., Zou, Z., Wo, Y., and Youn, O. (2018). Reverse Time Migration: A prospect of Seismic Imaging Methodology. Earth-Science Rev. 179, 207–227. doi:10.1016/j.earscirev.2018.02.008
Keywords: vertical cable seismic (VCS), natural gas hydrate, common scatter point gathers, seismic imaging, bottom simulating reflector (BSR)
Citation: Wang L, Liu H, Wang Z, Zhang J, Xing L and Yin Y (2021) Reverse Time Migration of Vertical Cable Seismic Data to Image Hydrate-Bearing Sediments With High Resolution. Front. Earth Sci. 9:751202. doi: 10.3389/feart.2021.751202
Received: 31 July 2021; Accepted: 11 October 2021;
Published: 23 November 2021.
Edited by:
Hao Hu, University of Houston, United StatesReviewed by:
Kelly Liu, Missouri University of Science and Technology, United StatesWu Shiguo, Institute of Deep-Sea Science and Engineering (CAS), China
Copyright © 2021 Wang, Liu, Wang, Zhang, Xing and Yin. This is an open-access article distributed under the terms of the Creative Commons Attribution License (CC BY). The use, distribution or reproduction in other forums is permitted, provided the original author(s) and the copyright owner(s) are credited and that the original publication in this journal is cited, in accordance with accepted academic practice. No use, distribution or reproduction is permitted which does not comply with these terms.
*Correspondence: Huaishan Liu, bGhzQG91Yy5lZHUuY24=; Lei Xing, eGluZ2xlaW91Y0BvdWMuZWR1LmNu