 Xiaoming Xu
 Zhifeng Ding1,2
 Fenglin Niu
- 1Institute of Geophysics, China Earthquake Administration, Beijing, China
- 2Key Laboratory of Earthquake Source Physics, China Earthquake Administration, Beijing, China
- 3Department of Earth, Environmental and Planetary Sciences, Rice University, Houston, TX, United States
- 4State Key Laboratory of Petroleum Resource and Prospecting, Unconventional Gas Institute, China University of Petroleum , Beijing, China
As an important segment of the North China Craton, the Trans-North China Orogen (TNCO) has experienced strong tectonic deformation and magmatic activities since the Cenozoic and is characterized by significant seismicity. To understand the mechanism of the crustal deformation and seismic hazards, we determined the crustal thickness (H), Vp/Vs ratio (κ) and crustal anisotropy (the fast polarization direction φ and splitting time τ) beneath the TNCO and its adjacent areas by analyzing receiver function data recorded by a dense seismic array. The (H, κ) and (φ, τ) at a total of 309 stations were measured, respectively. The Moho depth varies from ∼30 km beneath the western margin of the Bohai bay basin to the maximum value of ∼48 km beneath the northern Lüliang Mountain, which shows the positive and negative correlations with the elevation and the Bouguer anomaly. The average φ is roughly parallel to the strikes of the faults, grabens and Mountains in this study area, whereas a rotating distribution is shown around the Datong-Hannuoba volcanic regions. Based on the φ measured from the Moho Ps and SKS/SKKS phases, we propose that the crustal deformation and seismic hazards beneath the TNCO could be due to the counterclockwise rotation of the Ordos block driven by the far-field effects of the India-Eurasian collision.
Introduction
The North China Craton (NCC) as the largest and oldest known Archean craton in China is located in the eastern margin of the Eurasian plate (Zhao et al., 2001). The NCC consists of the western NCC (WNCC) and the eastern NCC (ENCC), which are separated by a Paleoproterozoic orogen, the Trans-North China Orogen (TNCO) (Figure 1). The WNCC, mainly including the Ordos Block (OB) and its surrounding Grabens, the Hetao Graben (HTG) and the Weihe Graben (WHG), is dominated by the stable and thick lithosphere, while the ENCC underwent significant reactivation and destruction during Mesozoic and Cenozoic (Chen and Ai, 2009; Zhu et al., 2011). The TNCO, a composite unit composed of the Lüliang Mountain (LLM), the Taihang Mountain (THM) and the Fenhe Graben (FHG), was formed by the collision of the ENCC and WNCC in the Late Paleoproterozoic (∼1.8 Ga), resulting in the final amalgamation of the NCC (Zhao et al., 2001). As a transition zone of the surface topography, lithospheric thickness (Chen and Ai, 2009) and gravity anomalies (Deng et al., 2014) between the ENCC with lithospheric thinning and the WNCC remaining stable cratonic roots, the TNCO has been accompanied by complicated tectonic deformation and magmatic activity during the episodic geological evolution (Ren et al., 2002; Xu et al., 2004; Zhu et al., 2011). The relative movement of the TNCO estimated from GPS is at a rate of ∼5–11 mm/year (Shen et al., 2000; Zhao et al., 2015), which is characterized by the distribution of strong earthquakes (Xu and Ma, 1992; Gao et al., 2020) (Figure 1). The mechanism of crustal deformation is important in understanding the tectonic evolution and seismic hazards in this study area. However, the details on crustal deformation beneath the TNCO and its adjacent areas are still being discussed and debated recently (Tian and Zhao, 2013; Zhang et al., 2016; Yang et al., 2018; Schellart et al., 2019; Zheng et al., 2019; Cai et al., 2021; Chang et al., 2021). Further studies on crustal structure and anisotropy are essential for constraining the crustal deformation mechanism.
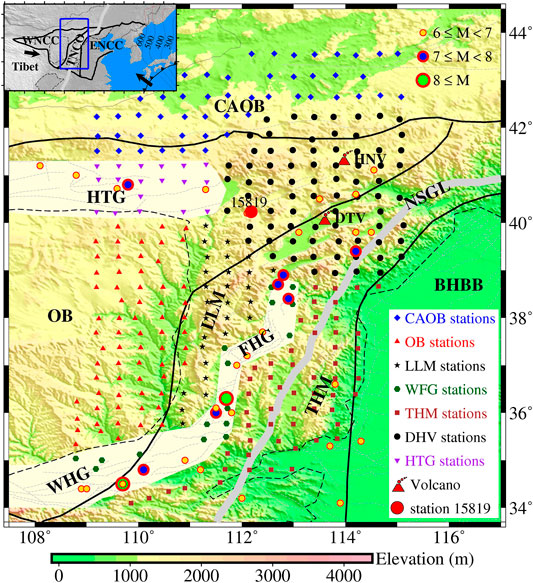
FIGURE 1. Tectonic setting map showing the seismic stations used in this study. Stations located in different blocks are indicated with different symbols. The red solid circle represents station 15,819 as an example of the H-κ analysis and crustal anisotropy in Figures 2,3. The color circles with red solid line are the large historic earthquakes (M ≥ 6, Liu and Wang, 2012). The thick gray line denotes the North-South Gravity Line (NSGL). Lightyellow regions are Hetao, Weihe and Fenhe grabens. DTV, the Datong Volcano; HNV, the Hannuoba Volcano; CAOB, the Central Asia Orogenic Belt; OB, the Ordos Block; LLM, the Lüliang Mountain; THM, the Taihang Mountain; BHBB, the Bohai Bay Basin; HTG, the Hetao Graben; WHG, the Weihe Graben; FHG, the Fenhe Graben. Inset shows the location of the Trans-North China Orogen with the blue rectangular. The black thick arrowhead indicates the absolute plate motion (APM) direction from GSRM v2.1 model (Kreemer et al., 2014).
Crustal deformation can produce anisotropy on the wavelength scale of seismic waves (Nicolas and Christensen, 1987; Mainprice and Nicolas, 1989). Therefore, measurements of crustal anisotropy can also help us understand the mechanism of crustal deformation and the process of tectonic evolution. Generally, the upper crustal anisotropy is attributed to the stress-induced alignment of cracks (Crampin and Peacock, 2008), while seismic anisotropy in the mid-to-lower crust and upper mantle is more likely to be caused by strain-induced lattice preferred orientation of minerals (Meissner et al., 2002). S waves from local earthquakes located in the upper crust have been used to estimate the upper crustal anisotropy beneath the ENCC (Gao et al., 2011). In the upper mantle, seismic anisotropy is commonly determined by the splitting of the SKS/SKKS phases (Zhao et al., 2008; Chang et al., 2017; 2021). There is a gap, obviously, between seismic anisotropy derived from local S waves and teleseismic SKS/SKKS phases to measure the mid-to-lower crustal anisotropy. Sherrington et al. (2004) pointed out that seismic anisotropy inside the mid-to-lower crust cannot be ignored when we look at the crustal deformation. The Ps phase from receiver functions, a P-to-S converted wave at the Moho, is an ideal phase to estimate seismic anisotropy within the whole crust.
We noticed that Liu and Niu (2012) developed a comprehensive technique that employed the radial (R) and transverse (T) receiver functions to compute the crustal anisotropy and Sun et al. (2012) further added a harmonic analysis to enhance the robustness of the measurements. Based on these methods, crustal anisotropy beneath the southeastern and northeastern Tibetan plateau was calculated to investigate the mechanism of the crustal deformation and thickening (Sun et al., 2012; Wang et al., 2016; Xu et al., 2018). Yang et al. (2018) and Zheng et al. (2019) also measured the splitting of the Moho Ps phases from receiver functions and observed the spatial distribution of crustal anisotropy beneath the northeastern TNCO, respectively. Results mentioned above confirmed that crustal anisotropy has been successfully estimated from the splitting of the Moho Ps phases and performed to study the crustal deformation.
To further improve the understanding of the crustal structure and deformation beneath the TNCO and its adjacent areas, we determined the Moho depth, Vp/Vs ratio and crustal anisotropy using receiver functions extracted from the teleseismic data recorded by a temporary dense array of broadband seismographs in this study. We further discussed the potential implications of the crustal structure evolution and deformation mechanism by comparing other published models (Deng et al., 2014; Shen et al., 2016; Wang et al., 2020; Chang et al., 2021; Huang et al., 2021).
Data and Methods
Data
The ChinArray project plans to roll over mainland China with a transportable array consisting of more than 1,000 broadband seismographs with a station spacing of ∼30–40 km in order to understand the structure of Earth’s interior (ChinArray-Himalaya, 2011). The third phase deployment of the ChinArray project covers an area of 8° × 10° centered at the TNCO (Figure 1). Each seismograph was equipped with a Guralp CMG-3ESP or CMG-3ESPC seismometer and a Reftek 130 data logger. In this study, we used a total of 309 stations with high quality three component waveform recordings from April 2016 to January 2019 and then selected 440 earthquakes (Supplementary Figure S1) with a magnitude greater than 5.0 and an epicentral distance between 30° and 90° to calculate the receiver functions. As shown in Supplementary Figure S1, most of the teleseismic events come from inside the western Pacific subduction zone and the Java trench. However, with the other earthquakes, the overall coverages in backazimuth and distance are reasonably good.
Methods
The true orientation of the two horizontal components is important when we use the three-component recordings of the teleseismic events to generate receiver functions (Zeng, et al., 2020). Therefore we first employed the P wave particle motions of teleseismic events to estimate the true sensor orientation for each station with the method proposed by Niu and Li (2011) before rotating the two horizontal components into the radial (R) and transverse (T) directions based on the great arc raypaths connecting the events and stations.
Following the previous studies (Vinnik, 1977; Niu and Kawakatsu, 1998; Niu et al., 2007), we further projected R and T components to the principal directions (longitudinal, P, and in-plane transverse, SV) estimated from the covariance matrix in order to minimize the P wave energy in the receiver function. We then used the “water-level” deconvolution technique (Clayton and Wiggins, 1976; Ammon, 1991) to compute receiver functions in the frequency domain. The “water level” and the corner frequency of the Gaussian low pass filter were set to be 0.01 and 1.5 Hz, respectively. After careful inspection, a total of 33,772 receiver functions from the 309 stations were selected with a station average of ∼109 receiver functions.
The crustal thickness and average Vp/Vs ratio were estimated at each station by the two-step analysis following Niu et al. (2007). We first computed the initial crustal thickness using the Nth-root stacking technique (Muirhead, 1968; Kawakatsu and Niu, 1994) with the Moho Ps phase alone. By searching for the range of 20–70 km, we defined the depth with the maximum amplitude as the initial crustal thickness. Figure 2A shows the depth stacking at the station 15,819 and a clear P to S conversion peak at ∼48 km. Then a refined H-κ analysis (Zhu and Kanamori, 2000) was used to estimate the final crustal thickness, H, and Vp/Vs ratio, κ:
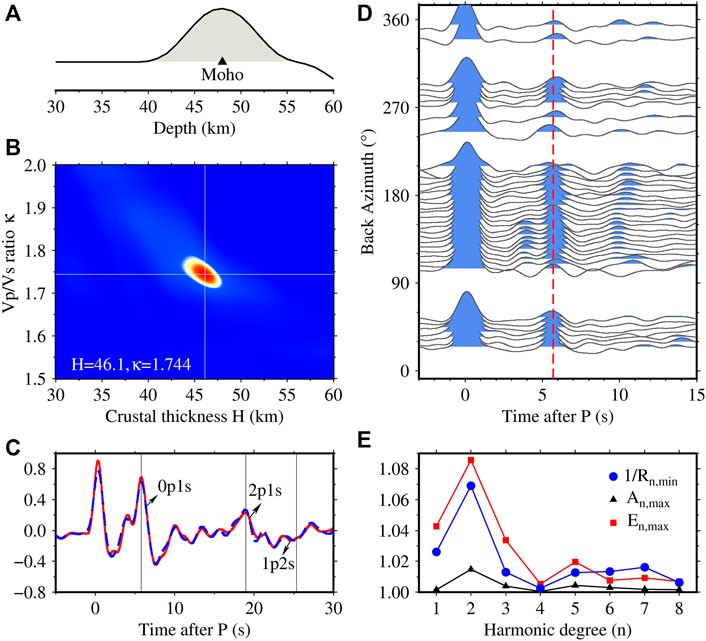
FIGURE 2. (A) denotes the stacked receiver function after the time-to-depth conversion of station 15,819. The maximum peak marked by black triangle indicates the initial Moho depth. (B) is the result of H-κ analysis at station 15,819. The cross white lines indicate the location of the peak amplitude. (C) shows the time domain stacked receiver functions with the Ps slowness (red solid line) and the 2p1s slowness (blue dashed line). Note that amplitude of the phases is larger when they are stacked with the correct slowness. (D) plots the radial receiver functions as a function of back azimuth at the station 15,819. The red dashed lines denote the average arrival time of the Moho Ps phase. (E) indicates the result of harmonic analysis at station 15,819. The reciprocal of the minimum residual, the maximum value of peak amplitude and total energy are plotted as a function of the harmonic degree.
Here K denotes the total number of receiver functions at a given station and ri(t) is the amplitude of the ith receiver function at the relative arrival times of the 0p1s (t1), 2p1s (t2) and 1p2s (t3), following the phase notation of npms introduced by Niu et al. (2007), with respect to the direct P wave. w1, w2, and w3 are the weights of the three time windows, which are assigned to 0.5, 0.25, and 0.25, respectively. c (κ) is a coherence index of the three phases, which is introduced by Niu et al. (2007) to reduce the trade off between H and κ. We searched for H within ±20 km of the initial depth derived from the depth stacking and κ in the range of 1.5–2.0. H and κ were determined when the summed amplitude, s (H,κ), reached its maximum. The result of H-κ analysis at the station 15,819 is shown in Figure 2B, which gives an estimate of H = 46.1 km and κ = 1.744.
For the comprehensive analysis of crustal anisotropy (Liu and Niu, 2012), we first calculated the moveout and made corrections for each station using the estimates of the above H-κ analysis so that all the cluster receiver functions were expected to have a Moho Ps arrival time equivalent to the one with an epicentral distance of 60° and a source depth of 0 km. The R and T receiver functions were further normalized with the peak amplitude of the P wave. Then, we analyzed the R and T receiver functions as a function of back azimuth to study the systematic variations in the peak Ps arrival time of the R receiver functions and polarity changes of the T receiver functions. The normalized maximum amplitude (
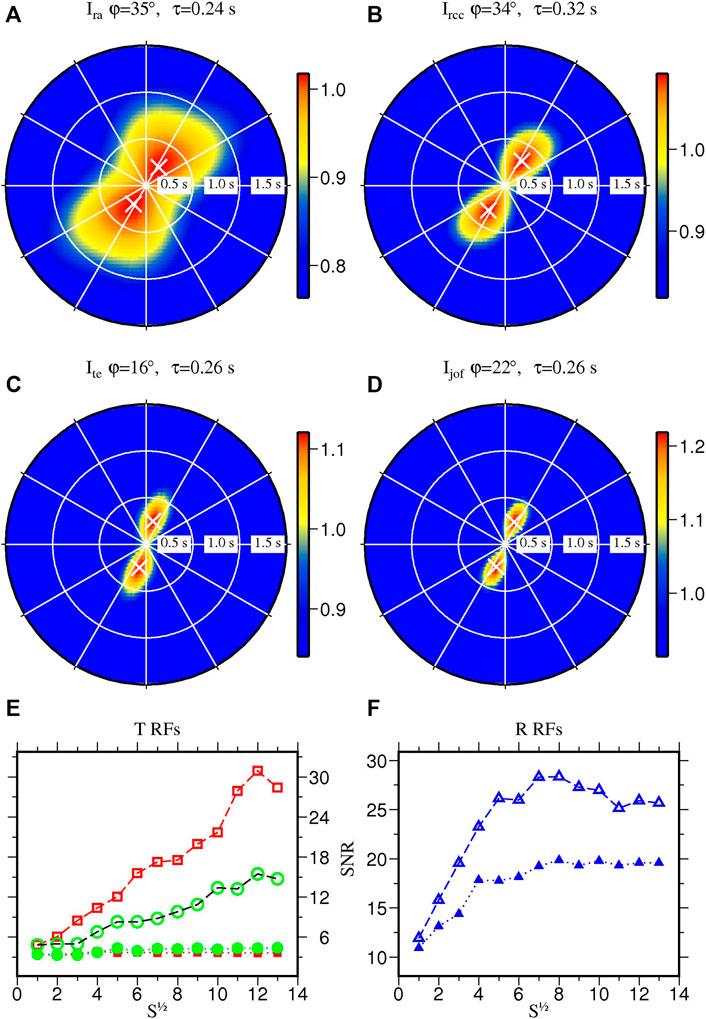
FIGURE 3. Results of crustal anisotropy from the joint analysis with multi-component receiver function data at station 15,819. (A–C) show three individual methods to estimate seismic anisotropy: 1) radial energy maximization with a cosine moveout correction; 2) radial correlation coefficient maximization; 3) transverse energy minimization. (d) is the joint solution. (φ, τ) are searched in the range of 0–360° and 0–1.5 s with an increment of 1° and 0.02 s, respectively. White plus marks the measured (φ, τ) where the objective functions reach to maximum. (E,F) show the calculated SNRs of stacked receiver function data as a function of the square root of the subsample numbers, S1/2. Open and filled symbols in (E,F) indicate SNR calculated from stacks of receiver functions before and after the removal of seismic anisotropy measured by the joint receiver function. More specifically, opened squares shown in (E) indicate stacks from T receiver functions without anisotropy correction but with polarity correction, while opened circles are from T receiver function with no corrections of anisotropy and polarity. Filled squares and circles represent stacks after correction of anisotropy, and with and without polarity correction, respectively.
Results
Based on the H-κ analysis and the crustal anisotropy estimation, we obtained 309 measurements of Moho depth and Vp/Vs ratio (Supplementary Figure S2), and 62 robust parameters of the crustal anisotropy (Figure 5). All estimated results are listed in Supplementary Table S1, which is organized by grouping stations in the following tectonic units: the Central Asia Orogenic Belt (CAOB), the Ordos Block (OB), the Lüliang (LLM) and Taihang (THM) Mountains, the Bohai Bay Basin (BHBB), the Hetao Graben (HTG), the Weihe-Fenhe Graben (WFG) and the Datong-Hannuoba (DHV) Volcano. We also present the average crustal thickness, Vp/Vs ratio, and crustal anisotropy, together with other parameters, in Supplementary Table S2 for the further comparison.
The estimated (H, κ) at 309 stations were interpolated into 1,419 meshed grids of 0.25° × 0.25° to show the lateral variations of Moho depth (Figure 4A) and Vp/Vs ratio (Figure 4B) beneath the study area, respectively. The Moho depth varies from ∼30 to ∼48 km (Figure 4A). Overall, the crust across the study area gradually tends to be thick from the southeast to northwest. Specifically, the thinnest crust, less than 32 km, is observed beneath the western margin of the BHBB while the thickest part (∼48 km) is nearby the northern LLM. The eastern HTG appears to have the highest Vp/Vs ratio up to ∼1.90, while the lowest Vp/Vs ratio, generally below 1.65, is observed between the OB and LLM. The average Vp/Vs ratio of the CAOB is relatively lower in this study area (Supplementary Table S2), but most of the study areas seem to be higher than the global average 1.74 (Kennet et al., 1995; Zhu, 2018).
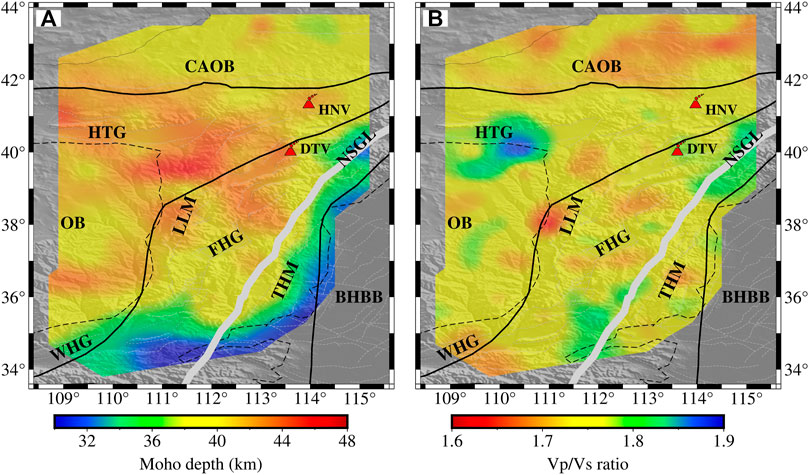
FIGURE 4. Maps show the Moho depth (A) and Vp/Vs ratio (B) in this study. The abbreviations are the same as those defined in the caption of Figure 1.
We measured the crustal anisotropy at all the stations in the study area and listed the estimated parameters in the Supplementary Table S1. However, the crust with weak anisotropy or isotropy beneath the stations does not lead to the corresponding pattern of the harmonic degree (n = 2) and the SNR test (Figure 2E and Figures 3E,F). Among the 309 stations in the study area, 7 stations did not pass the SNR test. We used “−” to indicate the measurements of 42 stations without enough back azimuthal coverage for anisotropy analysis and 7 stations with the Ps phase splitting time greater than the maximum time shift (1.5 s) in the Supplementary Table S1. Combined with the harmonic analysis, a total of 62 reliable measurements with a harmonic order of n = 2 are finally shown in the Figure 5 to characterize the crustal anisotropy beneath the TNCO and its adjacent areas. In addition, we take station 15,819 as an example to exhibit the crustal anisotropy beneath the western DHV (Figure 1), which was measured with the fast polarization direction φ = 22° and splitting time τ = 0.26 s, respectively. The average (φ, τ) of each geological block is also listed in Supplementary Table S2. The average φ measured from most of stations is roughly parallel to the strike of major geological blocks, for example, the strike of the CAOB, LLM, THM, HTG and WFG. The average τ at most of tectonic blocks is approximately 0.3 s and the peak average value (τ = 0.45 s) is located at the WFG. Particularly, stations located at the DHV and their surrounding regions (marked by white ellipse in Figure 5) are distributed in rotating fast polarization directions.
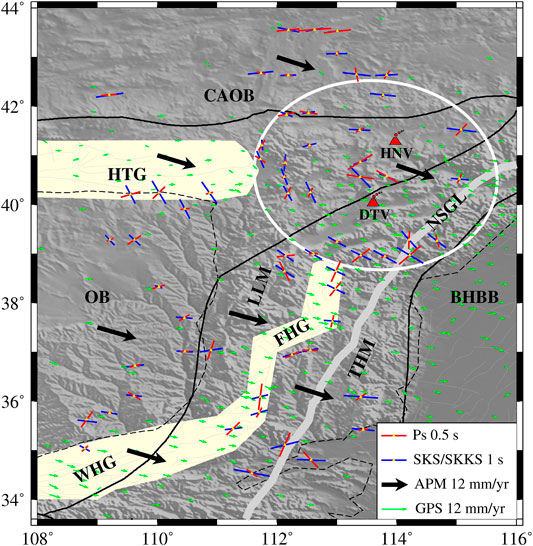
FIGURE 5. Comparison of crustal anisotropy measured from the Moho Ps (the red bar lines) with measurements of the SKS/SKKS splitting (the blue bar lines, Chang et al., 2021), the GPS velocity (the green arrows, Zhao et al., 2015) and the absolute plate motion direction of the GSRM v2.1 model (the black arrows, Kreemer et al., 2014). White solid ellipse outlines the rotating distribution of the fast polarization directions measured from the Moho Ps. The abbreviations are the same as those defined in the caption of Figure 1.
We also compared our Moho Ps fast polarization direction and splitting time at the 62 stations with those measured from the SKS/SKKS phases (blue lines, Chang et al., 2021), the GPS velocity (green arrow, Zhao et al., 2015) and the absolute plate motion (APM, thick black vectors, Kreemer et al., 2014) in the Figure 5. From the average results of these four datasets at each tectonic unite (Supplementary Table S2), we found that the datasets of the CAOB show roughly similar directions, but certain differences at other blocks, the OR, WFG, DHV, LLM and THM. Besides, the Moho Ps splitting times of the tectonic unites are much smaller than those of SKS/SKKS phase. In other words, the SKS/SKKS splitting times are mainly originated inside the mantle beneath the TNCO and its adjacent areas.
Discussion
The distributions of the estimated (H, κ) and (φ, τ) show significant lateral variations, which suggests the crustal structures beneath the TNCO and its adjacent areas are quite complicated. In fact, previous investigations revealed that the TNCO is dominated by the strong tectonic activities and intense seismicity (Xu and Ma, 1992; Liu and Wang, 2012; Li et al., 2015). At least ten earthquakes with magnitude no less than Ms 7.0 in Chinese history occurred beneath the TNCO. Especially, three of devastating earthquakes located in the WFG, i.e., the 1,303 Hongdong Ms 8.0, 1,556 Huaxian Ms 8.3 and 1,695 Linfen Ms 7.8 earthquake, caused serious damages and casualties (Wu and Jia, 1981; Rao et al., 2017). In this study, we utilized the obtained (H, κ) and (φ, τ) to understand the crustal deformation and seismic hazards beneath the TNCO and its adjacent areas.
Moho depth and Vp/Vs ratio are key parameters in constraining the structure and bulk average composition of the crust (Zandt and Ammon, 1995; Christensen, 1996). The crustal composition is classified as low Vp/Vs ratio (κ ≤ 1.76), intermediate values (1.76< κ ≤ 1.81) and high values (κ > 1.81) as the relative abundance of quartz (Vp/Vs = 1.49) and plagioclase (Vp/Vs = 1.87) fluctuates (Zandt and Ammon, 1995; Wang et al., 2010). An increase of plagioclase content and a decrease of quartz content usually give rise to the increase of the Vp/Vs ratio of a rock. Generally, felsic rocks tend to low Vp/Vs ratio as compared to mafic rocks. In this study, the lower Vp/Vs ratios observed at some local regions of the CAOB and central LLM (Figure 4B) imply that the crust has a more content of felsic rocks. The HTG with the highest Vp/Vs ratio (∼1.90) represents more mafic crustal composition here. In fact, the Vp/Vs ratios measured at most of stations are higher than the global average in this study, which is likely to be intermediate to mafic crustal composition.
In addition, the Moho depth gradually thickens from the southeast to northwest in this study area (Figure 4A), which is consistent with the previous results from the receiver functions (Li et al., 2014; Cai et al., 2021), surface wave dispersion (Shen et al., 2016) and the Bouguer anomaly (Deng et al., 2014). According to the Airy isostasty and WGM2012 global model (Bonvalot et al., 2012), the larger anomalies of the negative gravity are usually located at the regions with the higher mountains and thicker crust. The Bouguer anomaly is negatively correlated with the elevation and Moho depth (Supplementary Figure S3A–B) in this study, which indicates that our Moho depth is reliable and robust. Here, the Airy isostatic theory was used to examine the variation of the Moho depth beneath the TNCO and its adjacent areas. Assuming the crustal density as empirical value, Wang et al. (2010) and Tugume et al. (2012) suggested that 1 km uplift of the surface topography corresponds to ∼10 km predicted crustal thickening. The positive correlation between the Moho depth and elevations is shown in Supplementary Figure S3C, but its correlation coefficient is only 0.43. The weak correlation implies that a certain amount of mantle mafic materials compensate for the crust to keep the Airy equilibrium (Ji et al., 2009; Tugume et al., 2012). Furthermore, the Vp/Vs ratio increases roughly with the crustal thinning (Supplementary Figure S3D). Based on the widespread Cenozoic basalts and pyroclastic rocks in the TNCO and its adjacent areas (Xu et al., 2004; Qian et al., 2017), the variation and correlation of our datasets argued above support the model (Ji et al., 2009; Hu et al., 2020) that the underplating of mafic magmas from the partial melting upper mantle intruded into the deep crust to balance the crustal buoyancy. The higher Vp/Vs ratio demonstrates that the crustal composition was compensated by the underplated mafic intrusion when the local crust was gradually thinning during the Cenozoic tectonic extension.
We further argue that the observed crustal anisotropy, associating with other parameters (e.g., the GPS velocity, the APM direction and the φ of the SKS/SKKS phase), reflects the complex crustal deformation beneath the TNCO and its adjacent areas. In the north of the study area, the CAOB as the largest Phanerozoic accretionary orogenic belt has grown significantly in the crust and developed a series of E-W strike slip faults since the Paleo-Asian Ocean closed (Xiao et al., 2003; Windley et al., 2007). The φ measured from Moho Ps and SKS/SKKS phases, as well as the directions of the GPS and APM, are nearly E-W beneath the CAOB (Figure 5 and Supplementary Table S2), which suggests that the whole lithosphere deforms coherently along depth with a compressional direction of N-S. Around the Ordos block, the average φ of the Moho Ps phase trends NE in the southeast and rotates to E-W trending in the north (Figure 5 and Supplementary Table S2). This counterclockwise rotation pattern was also observed by the φ of the SKS/SKKS phase and speculated to be derived from the corresponding asthenospheric flow caused by the northeastward growth and expansion of the Tibetan plateau (Chang et al., 2017, 2021). The ongoing collision of the Indian and Eurasian plates since ∼50 Ma has driven the asthenospheric flow (Chang et al., 2021; Wang et al., 2020) and counterclockwise rotation of the Ordos block (Zhang et al., 1998), which may contribute to generating the left-lateral shear stress in the lithosphere and observed seismic anisotropy around the Ordos block. Another noteworthy feature revealed by this study is the rotating distribution of the fast Moho Ps phase directions around the DHV regions in Figure 5. The mode of the φ around the DHV regions is also consistent with the recently studies of SKS/SKKS splitting (Chang et al., 2021) and surface wave dispersion (Huang et al., 2021). At some active volcanic areas (e.g., the Mount Ruapehu volcano, New Zealand), the anisotropic orientation agreed with our observations and was further inferred to be due to the stress-aligned microcracks caused by the magmatic eruption (Gerst and Savage, 2004; Johnson et al., 2011). The prominent low velocity anomalies from both the traveltime and full waveform tomography have confirmed the existence of the mantle upwelling beneath the DHV regions related to the stagnancy and dehydration of the Pacific slab in the mantle transition zone (Lei, 2012; Tao et al., 2018). In addition to the anisotropies from P wave tomography (Tian and Zhao, 2013) and SKS/SKKS splitting (Chang et al., 2021), we propose that the fossil crustal anisotropy with the rotating φ around the DHV regions is resulted from the asthenosphere upwelling induced by the Pacific plate subduction.
We noticed that the historical destructive earthquakes occurred in the extensional WFG (Figure 1) where the observed average τ is the largest, 0.45 s, in this study area (Supplementary Table S2). GPS measurements, still extending with a rate of ∼4 mm/year (Shen et al., 2000), and large strike-slip rate of master-faults, 5.68–7 mm/year (Xu and Ma, 1992), further indicated the strong crustal deformation inside the WFG. By analyzing the causes of crustal anisotropy and relationship between Moho depth and Vp/Vs ratio above, we speculate that the counterclockwise rotation of the Ordos block driven by the far-field effects of the India-Eurasian collision facilitated the left-lateral shear stress and extensional crustal deformation of the WFG and in turn generated the high seismic hazards.
Conclusion
In this study, we investigated the Moho depth, Vp/Vs ratio and crustal anisotropy beneath the TNCO and its adjacent areas using receiver function data with the H-κ stacking method and the joint inversion scheme. The variations of the Moho depth and Vp/Vs ratio might reveal that the underplated mafic intrusion compensated for the crustal composition and Airy equilibrium. Based on the φ of the Moho Ps and SKS/SKKS phases, we proposed that the CAOB showed a coupling deformation between the crust and mantle, under the N-S compressive stress, with the closure of the Paleo-Asian Ocean. The asthenosphere upwelling induced by the Pacific plate subduction caused the stress-aligned microcracks and the rotating distribution of the crustal anisotropic azimuths around the DHV regions. The observed average φ of the Moho Ps phase and the high seismic hazards are attributed to the counterclockwise rotation of the Ordos block driven by the far-field effects of the India-Eurasian collision.
Data Availability Statement
The original contributions presented in the study are included in the article/Supplementary Material, further inquiries can be directed to the corresponding author.
Author Contributions
XX estimated the receiver functions, calculated the Moho depth, Vp/Vs ratio and crustal anisotropy and wrote the manuscript. ZD provided the raw data and guided the project. LL provided many useful instruction and suggestions. FL offered the corresponding codes and proposed the main ideas of this study. All authors contributed to the article and approved the submitted version.
Funding
This work was supported by the National Natural Science Foundation of China (Grant Nos 41974100, U1839210) and the Special Fund of the Institute of Geophysics, China Earthquake Administration (Grant Nos DQJB16A03, DQJB17A01).
Conflict of Interest
The authors declare that the research was conducted in the absence of any commercial or financial relationships that could be construed as a potential conflict of interest.
Publisher’s Note
All claims expressed in this article are solely those of the authors and do not necessarily represent those of their affiliated organizations, or those of the publisher, the editors and the reviewers. Any product that may be evaluated in this article, or claim that may be made by its manufacturer, is not guaranteed or endorsed by the publisher.
Acknowledgments
The waveform data was provided by China Seismic Array Data Management Center at Institute of Geophysics, China Earthquake Administration (doi: 10.12001/ChinArray.Data). Figures in this study are plotted by the GMT (http://gmt.soest.hawaii.edu/home).
Supplementary Material
The Supplementary Material for this article can be found online at: https://www.frontiersin.org/articles/10.3389/feart.2021.753612/full#supplementary-material
References
Ammon, C. J. (1991). The Isolation of Receiver Effects from Teleseismic P Waveforms. Bull. Seism. Soc. Am. 81 (6), 2504–2510. doi:10.1785/bssa0810062504
Bonvalot, S., Balmino, G., Briais, A., Kuhn, M., Peyrefitte, A., Vales, B. R., et al. (2012). World Gravity Map, 1:50000000 Map. Paris: BGI-CGMW-CNES-IRD.
Cai, Y., Wu, J., Rietbrock, A., Wang, W., Fang, L., Yi, S., et al. (2021). S Wave Velocity Structure of the Crust and Upper Mantle beneath Shanxi Rift, central North China Craton and its Tectonic Implications. Tectonics 40 (4), e2020TC006239. doi:10.1029/2020TC006239
Chang, L., Ding, Z., Wang, C., and Flesch, L. M. (2017). Vertical Coherence of Deformation in Lithosphere in the NE Margin of the Tibetan Plateau Using GPS and Shear-Wave Splitting Data. Tectonophysics 699, 93–101. doi:10.1016/j.tecto.2017.01.025
Chang, L. J., Ding, Z. F., and Wang, C. Y. (2021). Upper Mantle Anisotropy and Implications beneath the central and Western North China and the NE Margin of Tibetan Plateau. Chin. J. Geophys. (in Chinese) 64 (1), 114–130. doi:10.6038/cjg2021O0315
Chen, L., and Ai, Y. (2009). Discontinuity Structure of the Mantle Transition Zone beneath the North China Craton from Receiver Function Migration. J. Geophys. Res. 114, B06307. doi:10.1029/2008JB006221
ChinArray-Himalaya (2011). China Seismic Array Waveform Data of Himalaya Project. Beijing, China: Institute of Geophysics, China Earthquake Administration. doi:10.12001/ChinArray.Data.Himalaya
Christensen, N. I. (1996). Poisson's Ratio and Crustal Seismology. J. Geophys. Res. 101, 3139–3156. doi:10.1029/95jb03446
Clayton, R. W., and Wiggins, R. A. (1976). Source Shape Estimation and Deconvolution of Teleseismic Bodywaves. Geophys. J. Int. 47, 151–177. doi:10.1111/j.1365-246x.1976.tb01267.x
Crampin, S., and Peacock, S. (2008). A Review of the Current Understanding of Seismic Shear-Wave Splitting in the Earth's Crust and Common Fallacies in Interpretation. Wave Motion 45 (6), 675–722. doi:10.1016/j.wavemoti.2008.01.003
Deng, Y., Fan, W., Zhang, Z., and Liang, K. (2014). The Gravity and Isostatic Moho in North China Craton and Their Implications to Seismicity. Earthq. Sci. 27 (2), 197–207. doi:10.1007/s11589-013-0019-y
Gao, M., Grujic, D., and Cheng, Q.-M. (2020). Crustal Density Structures and Isostasy beneath the Western North China Craton, Trans-North China Orogen, and Surrounding Regions. Geosci. Front. 11 (2), 569–580. doi:10.1016/j.gsf.2019.07.003
Gao, Y., Wu, J., Fukao, Y., Shi, Y., and Zhu, A. (2011). Shear Wave Splitting in the Crust in north China: Stress, Faults and Tectonic Implications. Geophys. J. Int. 187, 642–654. doi:10.1111/j.1365-246X.2011.05200.x
Gerst, A., and Savage, M. K. (2004). Seismic Anisotropy beneath Ruapehu Volcano: a Possible Eruption Forecasting Tool. Science 306 (5701), 1543–1547. doi:10.1126/science.1103445
Hu, J., Jiang, N., Guo, J., Fan, W., and Liu, D. (2020). The Role of Basaltic Underplating in the Evolution of the Lower continental Crust. Geochimica et Cosmochimica Acta 275, 19–35. doi:10.1016/j.gca.2020.02.002
Huang, X., Ding, Z. F., and Ning, J. Y. (2021). Rayleigh Wave Phase Velocity and Azimuthal Anisotropy of central North China Craton Derived from Ambient Noise Tomography. Chin. J. Geophys. 64 (8), 2701. doi:10.6038/cjg2021O0442
Ji, S., Wang, Q., and Salisbury, M. H. (2009). Composition and Tectonic Evolution of the Chinese continental Crust Constrained by Poisson's Ratio. Tectonophysics 463 (1-4), 15–30. doi:10.1016/j.tecto.2008.09.007
Johnson, J. H., Savage, M. K., and Townend, J. (2011). Distinguishing between Stress-Induced and Structural Anisotropy at Mount Ruapehu Volcano, New Zealand. J. Geophys. Res. 116, B12303. doi:10.1029/2011JB008308
Kawakatsu, H., and Niu, F. (1994). Seismic Evidence for a 920-km Discontinuity in the Mantle. Nature 371, 301–305. doi:10.1038/371301a0
Kennett, B. L. N., Engdahl, E. R., and Buland, R. (1995). Constraints on Seismic Velocities in the Earth from Traveltimes. Geophys. J. Int. 122, 108–124. doi:10.1111/j.1365-246x.1995.tb03540.x
Kreemer, C., Blewitt, G., and Klein, E. C. (2014). A Geodetic Plate Motion and Global Strain Rate Model. Geochem. Geophys. Geosyst. 15 (10), 3849–3889. doi:10.1002/2014gc005407
Lei, J. (2012). Upper-mantle Tomography and Dynamics beneath the North China Craton. J. Geophys. Res. 117, a–n. doi:10.1029/2012JB009212
Li, B., Sørensen, M. B., and Atakan, K. (2015). Coulomb Stress Evolution in the Shanxi Rift System, North China, since 1303 Associated with Coseismic, post-seismic and Interseismic Deformation. Geophys. J. Int. 203 (3), 1642–1664. doi:10.1093/gji/ggv384
Li, Y., Gao, M., and Wu, Q. (2014). Crustal Thickness Map of the Chinese mainland from Teleseismic Receiver Functions. Tectonophysics 611, 51–60. doi:10.1016/j.tecto.2013.11.019
Liu, H., and Niu, F. (2012). Estimating Crustal Seismic Anisotropy with a Joint Analysis of Radial and Transverse Receiver Function Data. Geophys. J. Int. 188 (1), 144–164. doi:10.1111/j.1365-246X.2011.05249.x
Liu, M., and Wang, H. (2012). Roaming Earthquakes in China Highlight Midcontinental Hazards. Eos Trans. AGU 93 (45), 453–454. doi:10.1029/2012eo450001
Mainprice, D., and Nicolas, A. (1989). Development of Shape and Lattice Preferred Orientations: Application to the Seismic Anisotropy of the Lower Crust. J. Struct. Geology. 11, 175–189. doi:10.1016/0191-8141(89)90042-4
Meissner, R., Mooney, W. D., and Artemieva, I. (2002). Seismic Anisotropy and Mantle Creep in Young Orogens. Geophys. J. Int. 149, 1–14. doi:10.1046/j.1365-246x.2002.01628.x
Muirhead, K. J. (1968). Eliminating False Alarms when Detecting Seismic Events Automatically. Nature 217, 533–534. doi:10.1038/217533a0
Nicolas, A., and Christensen, N. I. (1987). Formation of Anisotropy in Upper Mantle Peridotites: A Review. Rev. Geophys. 25, 111–123. doi:10.1029/gd016p0111
Niu, F., Bravo, T., Pavlis, G., Vernon, F., Rendon, H., Bezada, M., et al. (2007). Receiver Function Study of the Crustal Structure of the southeastern Caribbean Plate Boundary and Venezuela. J. Geophys. Res. 112 (B11), B11308. doi:10.1029/2006jb004802
Niu, F., and Kawakatsu, H. (1998). Determination of the Absolute Depths of the Mantle Transition Zone Discontinuities beneath China: Effect of Stagnant Slabs on Transition Zone Discontinuities. Earth Planet. Sp 50 (11-12), 965–975. doi:10.1186/bf03352191
Niu, F., and Li, J. (2011). Component Azimuths of the CEArray Stations Estimated from P-Wave Particle Motion. Earthq Sci. 24 (1), 3–13. doi:10.1007/s11589-011-0764-8
Qian, S.-P., Ren, Z.-Y., Richard, W., Zhang, L., Zhang, Y.-H., Hong, L.-B., et al. (2017). Petrogenesis of Early Cretaceous Basaltic Lavas from the North China Craton: Implications for Cratonic Destruction. J. Geophys. Res. Solid Earth 122, 1900–1918. doi:10.1002/2016JB013548
Rao, G., Cheng, Y., Lin, A., and Yan, B. (2017). Relationship between Landslides and Active normal Faulting in the Epicentral Area of the AD 1556 M∼8.5 Huaxian Earthquake, SE Weihe Graben (Central China). J. Earth Sci. 28 (3), 545–554. doi:10.1007/s12583-017-0900-z
Ren, J., Tamaki, K., Li, S., and Junxia, Z. (2002). Late Mesozoic and Cenozoic Rifting and its Dynamic Setting in Eastern China and Adjacent Areas. Tectonophysics 344 (3-4), 175–205. doi:10.1016/s0040-1951(01)00271-2
Schellart, W. P., Chen, Z., Strak, V., Duarte, J. C., and Rosas, F. M. (2019). Pacific Subduction Control on Asian continental Deformation Including Tibetan Extension and Eastward Extrusion Tectonics. Nat. Commun. 10, 4480. doi:10.1038/s41467-019-12337-9
Shen, W., Ritzwoller, M. H., Kang, D., Kim, Y., Lin, F.-C., Ning, J., et al. (2016). A Seismic Reference Model for the Crust and Uppermost Mantle beneath China from Surface Wave Dispersion. Geophys. J. Int. 206 (2), 954–979. doi:10.1093/gji/ggw175
Shen, Z.-K., Zhao, C., Yin, A., Li, Y., Jackson, D. D., Fang, P., et al. (2000). Contemporary Crustal Deformation in East Asia Constrained by Global Positioning System Measurements. J. Geophys. Res. 105 (B3), 5721–5734. doi:10.1029/1999jb900391
Sherrington, H. F., Zandt, G., and Frederiksen, A. (2004). Crustal Fabric in the Tibetan Plateau Based on Waveform Inversions for Seismic Anisotropy Parameters. J. Geophys. Res. 109, B02312. doi:10.1029/2002JB002345
Sun, Y., Niu, F., Liu, H., Chen, Y., and Liu, J. (2012). Crustal Structure and Deformation of the SE Tibetan Plateau Revealed by Receiver Function Data. Earth Planet. Sci. Lett. 349-350, 186–197. doi:10.1016/j.epsl.2012.07.007
Tao, K., Grand, S. P., and Niu, F. (2018). Seismic Structure of the Upper Mantle beneath Eastern Asia from Full Waveform Seismic Tomography. Geochem. Geophys. Geosyst. 19 (8), 2732–2763. doi:10.1029/2018GC007460
Tian, Y., and Zhao, D. (2013). Reactivation and Mantle Dynamics of North China Craton: Insight from P-Wave Anisotropy Tomography. Geophys. J. Int. 195, 1796–1810. doi:10.1093/gji/ggt333
Tugume, F., Nyblade, A., and Julià, J. (2012). Moho Depths and Poisson's Ratios of Precambrian Crust in East Africa: Evidence for Similarities in Archean and Proterozoic Crustal Structure. Earth Planet. Sci. Lett. 355-356, 73–81. doi:10.1016/j.epsl.2012.08.041
Vinnik, L. P. (1977). Detection of Waves Converted from P to SV in the Mantle. Phys. Earth Planet. Interiors 15 (1), 39–45. doi:10.1016/0031-9201(77)90008-5
Wang, C.-Y., Zhu, L., Lou, H., Huang, B.-S., Yao, Z., and Luo, X. (2010). Crustal Thicknesses and Poisson's Ratios in the Eastern Tibetan Plateau and Their Tectonic Implications. J. Geophys. Res. 115, B11301. doi:10.1029/2010JB007527
Wang, K., Xiong, X., Zhou, Y., and Feng, Y. (2020). Three-dimensional Thermo-Rheological Structure of the Lithosphere in the North China Craton Determined by Integrating Multiple Observations: Implications for the Formation of Rifts. Sci. China Earth Sci. 63, 969–984. doi:10.1007/s11430-019-9566-1
Wang, Q., Niu, F., Gao, Y., and Chen, Y. (2016). Crustal Structure and Deformation beneath the NE Margin of the Tibetan Plateau Constrained by Teleseismic Receiver Function Data. Geophys. J. Int. 204 (1), 167–179. doi:10.1093/gji/ggv420
Windley, B. F., Alexeiev, D., Xiao, W., Kröner, A., and Badarch, G. (2007). Tectonic Models for Accretion of the Central Asian Orogenic Belt. J. Geol. Soc. 164 (1), 31–47. doi:10.1144/0016-76492006-022
Xiao, W., Windley, B. F., Hao, J., and Zhai, M. (2003). Accretion Leading to Collision and the Permian Solonker Suture, Inner Mongolia, China: Termination of the central Asian Orogenic belt. Tectonics 22 (6), a–n. doi:10.1029/2002TC001484
Xu, X., and Ma, X. (1992). Geodynamics of the Shanxi Rift System, China. Tectonophysics 208, 325–340. doi:10.1016/0040-1951(92)90353-8
Xu, X., Niu, F., Ding, Z., and Chen, Q. (2018). Complicated Crustal Deformation beneath the NE Margin of the Tibetan Plateau and its Adjacent Areas Revealed by Multi-Station Receiver-Function Gathering. Earth Planet. Sci. Lett. 497, 204–216. doi:10.1016/j.epsl.2018.06.010
Xu, Y. G., Chung, S. L., Ma, J., and Shi, L. (2004). Contrasting Cenozoic Lithospheric Evolution and Architecture in the Western and Eastern Sino‐Korean Craton: Constraints from Geochemistry of Basalts and Mantle Xenoliths. J. Geology. 112 (5), 593–605. doi:10.1086/422668
Yang, Y., Yao, H., Zhang, P., and Chen, L. (2018). Crustal Azimuthal Anisotropy in the Trans-North China Orogen and Adjacent Regions from Receiver Functions. Sci. China Earth Sci. 61 (7), 903–913. doi:10.1007/s11430-017-9209-9
Zandt, G., and Ammon, C. J. (1995). Continental Crust Composition Constrained by Measurements of Crustal Poisson's Ratio. Nature 374, 152–154. doi:10.1038/374152a0
Zeng, S., Zheng, Y., Niu, F., and Ai, S. (2020). Measurements of Seismometer Orientation of the First Phase CHINArray and Their Implications on Vector-Recording-Based Seismic Studies. Bull. Seismol. Soc. Am. 111 (1), 36–49. doi:10.1785/0120200129
Zhang, H., Huang, Q., Zhao, G., Guo, Z., and Chen, Y. J. (2016). Three-dimensional Conductivity Model of Crust and Uppermost Mantle at the Northern Trans North China Orogen: Evidence for a Mantle Source of Datong Volcanoes. Earth Planet. Sci. Lett. 453, 182–192. doi:10.1016/j.epsl.2016.08.025
Zhang, Y. Q., Mercier, J. L., and Vergély, P. (1998). Extension in the Graben Systems Around the Ordos (China), and its Contribution to the Extrusion Tectonics of south China with Respect to Gobi-Mongolia. Tectonophysics 285 (1-2), 41–75. doi:10.1016/s0040-1951(97)00170-4
Zhao, B., Huang, Y., Zhang, C., Wang, W., Tan, K., and Du, R. (2015). Crustal Deformation on the Chinese mainland during 1998-2014 Based on GPS Data. Geodesy and Geodynamics 6, 7–15. doi:10.1016/j.geog.2014.12.006
Zhao, G., Wilde, S. A., Cawood, P. A., and Sun, M. (2001). Archean Blocks and Their Boundaries in the North China Craton: Lithological, Geochemical, Structural and P-T Path Constraints and Tectonic Evolution. Precambrian Res. 107, 45–73. doi:10.1016/s0301-9268(00)00154-6
Zhao, L., Zheng, T., and Lü, G. (2008). Insight into Craton Evolution: Constraints from Shear Wave Splitting in the North China Craton. Phys. Earth Planet. Interiors 168, 153–162. doi:10.1016/j.pepi.2008.06.003
Zheng, T., Ding, Z., Ning, J., Liu, K. H., Gao, S. S., Chang, L., et al. (2019). Crustal Azimuthal Anisotropy beneath the central North China Craton Revealed by Receiver Functions. Geochem. Geophys. Geosystems 20, 2235–2251. doi:10.1029/2019gc008181
Zhu, H. (2018). High Vp/Vs Ratio in the Crust and Uppermost Mantle beneath Volcanoes in the Central and Eastern Anatolia. Geophys. J. Int. 214 (3), 2151–2163. doi:10.1093/gji/ggy253
Zhu, L., and Kanamori, H. (2000). Moho Depth Variation in Southern California from Teleseismic Receiver Functions. J. Geophys. Res. 105, 2969–2980. doi:10.1029/1999jb900322
Keywords: North China craton, moho depth, crustal anisotropy, receiver function, ChinArray
Citation: Xu X, Ding Z, Li L and Niu F (2021) Crustal Anisotropy Beneath the Trans-North China Orogen and its Adjacent Areas From Receiver Functions. Front. Earth Sci. 9:753612. doi: 10.3389/feart.2021.753612
Received: 05 August 2021; Accepted: 11 October 2021;
Published: 21 October 2021.
Edited by:
Tianyao Hao, Institute of Geology and Geophysics (CAS), ChinaReviewed by:
Ryan Porter, Northern Arizona University, United StatesAlexis Rigo, UMR8538 Laboratoire de géologie de l’Ecole Normale Supérieure (LG-ENS), France
Copyright © 2021 Xu, Ding, Li and Niu. This is an open-access article distributed under the terms of the Creative Commons Attribution License (CC BY). The use, distribution or reproduction in other forums is permitted, provided the original author(s) and the copyright owner(s) are credited and that the original publication in this journal is cited, in accordance with accepted academic practice. No use, distribution or reproduction is permitted which does not comply with these terms.
*Correspondence: Xiaoming Xu, eHV4aWFvbWluZ0BjZWEtaWdwLmFjLmNu