 Yan Song
 Zhicai Li2
 Yu Gu
Yu Gu Ziniu Xiao
- 1Training Centre, China Meteorological Administration, Beijing, China
- 2Shanxi Climate Center, Taiyuan, China
- 3University of California, Los Angeles, Los Angeles, CA, United States
- 4Institute of Atmospheric Physics, Chinese Academy of Sciences, Beijing, China
Solar activity is one of the main external forcing factors driving the Earth’s climate system to change. The snow cover over the Tibetan Plateau is an important physical factor affecting the East Asian climate. At present, insufficient research on the connection between solar activity and snow cover over the Tibetan Plateau has been carried out. Using Solar Radio Flux (SRF), Solar Sunspot Number (SSN), and Total Solar Irradiance (TSI) data, this paper calculated the correlation coefficients with snow indices over the Tibetan Plateau, such as winter and spring snow depth (WSD/SSD) and snow day number (WSDN/SSDN). These snow indices are obtained from the daily gauge snow data in the Tibetan Plateau. Through correlation analyses, it is found that there are significant synchronous or lag correlations between snow indices and solar parameters on multi-time scales. In particular, the Spring Snow Day Number (SSDN) is of significant synchronous or lag correlation with SRF, SSN, and TSI on multi-time scales. It is further found that SSDN over the Tibetan Plateau has more stable positive correlations with SRF by using the 21-year running mean and cross spectrum analyses. Therefore, SSDN can be ascertained to be the most sensitive snow index to the solar activity compared with other snow indices. Moreover, its influence on summer precipitation of China is strongly regulated by solar activity. In high solar activity years (HSAY), the significant correlated area of summer precipitation in China to SSDN is located further north than that in low solar activity years (LSAY). Such impact by solar activity is also remarkable after excluding the impact of ENSO (i.e., El Niño–Southern Oscillation) events. These results provide support for the application of snow indices in summer rainfall prediction in China.
Introduction
The Tibetan Plateau, which is the largest mountain in the world, has an important impact on the global and regional climate, especially East Asian climate. The thermal and dynamic roles of the plateau are irreplaceable in terms of the onset and maintenance of the East Asian summer monsoon, especially the location of rain belt during flood season in East Asia.
The snow amount over the Tibetan Plateau could affect the thermal difference between Euro-Asian land and the surrounding sea through altering the soil moisture content by snow melting in spring, which is critical to the onset of the following summer monsoon (Bamzai and Marx, 2000; Qian et al., 2003; Zhao et al., 2007; Wei et al., 2008). Therefore, much attention has been paid to the influence of the Tibetan Plateau on the East Asian summer monsoon and the precipitation on the interannual time scale. However, the snow cover over the Tibetan Plateau has obvious interdecadal oscillation itself (Wang et al., 2018). The decline of the East Asian summer monsoon in recent decades is thought to be related to the continuous increase of snow amount in the plateau (Zhang et al., 2004). The anomalous interdecadal oscillation of snow cover in spring and winter is closely related to the shift of abnormal spatial rainfall pattern in summer in Eastern China (Zhang et al., 2008; Ding et al., 2009; Zhou et al., 2009; Wu et al., 2010; Zhao et al., 2010). However, the relationship between snow and summer precipitation in China is uncertain. Under different interdecadal backgrounds of climate change, the spatial correlations of snow and summer precipitation are quite different (Song et al., 2011). Therefore, there may be some other external forcing factors that could modulate the correlation relationship between snow and summer precipitation.
The climate system on the Earth is driven by various external forcing factors, especially the Sun, where the main energy of the Earth comes from. The solar activity could exert considerable impact on the global and regional climate. The regional climatic response to solar activity is often one order of magnitude greater than the global response, due to more sensitive water cycle in the regions (Lean, 2010). Therefore, the signals of regional precipitation that responded to the Sun are relatively stronger.
Many studies examined the impact of solar activity on the East Asian summer monsoon (Zhao et al., 2011; Zhao & Wang, 2014; Wang et al., 2005; Kerr, 2005; Verschuren et al., 2009). The interdecadal variability of the East Asian summer monsoon precipitation could be affected by solar activity, and the effect varied within different time periods (Wasko and Sharma, 2009). Model simulation results show that during the Little Ice Age, the global monsoon rainfall was reduced with weak solar activity and less sunspot number, while during the Middle Ages, the global monsoon was strong (Liu et al., 2009). In history, during the active period of solar activity, the Hadley Circulation expanded, the subtropical dry area extended northward, and the monsoon region shifted northward in the Northern Hemisphere. Simultaneously, most of the land areas around the world had more precipitation due to the monsoon intensification (Hoyt and Schatten, 1997; Haigh et al., 2005; Kodera, 2004; Haigh, 2003; Kushner and Polvani, 2006; Haigh andB, ackbum, 2006).
Recent studies show that the East Asian monsoon intensity was controlled by the solar cycle (Wang et al., 2005; Tan et al., 2008). The interdecadal change of the latitude of rain belt during onset period of the East Asian summer monsoon depends on the sunspot cycle phase, and the responses of precipitation phases in the south and north of the Yangtze River to the solar cycle are totally opposite (Zhao and Han, 2012). It can be explained by the interdecadal locking phase of the intensity and the northern boundary position of Southwest Monsoon flow with the sunspot cycle (Zhao and Han, 2012). In addition, the generalized Meiyu season in East Asia is just the time period with the highest correlation coefficient between the latitude of rain belt of the East Asian Monsoon and the solar cycle. In the high solar activity years (HSAY), the Meiyu rain belt is 1.2° latitude to the north and has a greater interannual variability (Zhao & Wang, 2014). In addition, some studies show that the impact of ENSO (El Niño–Southern Oscillation) on the East Asian climate, the relationships between Arctic Oscillation and the East Asian winter climate, the relation of spring NAO and the following summer precipitation in East Asia, and the connection of the East Asian winter monsoon to the following summer monsoon can all be regulated by the Sun’s 11-year cycle (Chen & Zhou, 2012; Zhou & Chen, 2012; Zhou, 2013 Thesis; Zhou and Chen, 2014). It is demonstrated that the solar cycle affects obviously the interaction between sea and air, as well as among atmospheric internal components. Through the coupling interaction between the Pacific Ocean and the atmosphere, the solar 11-year cycle could affect winter precipitation in Northeast Asia (Song et al., 2019). As we know, there are significant correlations between snow over the Tibetan Plateau and the East Asian summer monsoon, as well as the summer rain belt in Eastern China. Is it possible that such a relationship can be affected by the solar activity? As to the winter and spring snow depths and snow day numbers, which has the most sensitive response to the solar activity? These deserve further study.
Up to now, few studies have focused on the impact of solar activity on snow cover over the Tibetan Plateau and its relationship with summer precipitation in China. Previous studies mainly focused on the influence of different solar irradiance spectrum bands on the snow albedo and snow melting rate (Grenfell et al., 1994; Li et al., 2009; Meinander et al., 2009). Our previous research showed that the winter and spring snow cover over the Tibetan Plateau had significant responses to the Solar Radio Flux (SRF) in the recent 50 years on the interdecadal time scale with significant lag correlations (Song et al., 2016a). The impact of winter snow depth on the following summer precipitation in China was strongly regulated by solar activity (Song et al., 2016b, 2019). The four snow indices are defined as winter and spring snow depth and snow day number, respectively. This paper focuses on detecting the most sensitively responded snow index to the solar activity and the Sun’s regulation on spatial correlation patterns between snow and summer precipitation in China.
Data and Methods
Data
In this paper, SRF data (F10.7 cm data) during 1947–2015 are obtained from the National Oceanic and Atmospheric Administration (NOAA) Data Center (http://www.esrl.noaa.gov/psd/data/correlation/solar.data). The F10.7 cm data are expressed in solar flux units (sfu) where 1 sfu = 10–22 W m−2·Hz−1. The winter SRF is obtained by the average of the data in December and the subsequent January and February. The Solar Sunspot Number (SSN) data for 1770–2014 used in this paper is collected from the Solar Influences Data Analysis Center (SIDC), which is the solar physics research department of the Royal Observatory of Belgium (http://sidc.oma.be/sunspot-data). The Total Solar Irradiance (TSI) reconstruction data during 1610–2013 is downloaded from Laboratory Atmospheric Space Physics of University of Colorado Boulder (Coddington et al., 2015; Kopp et al., 2016) (http://lasp.colorado.edu/home/sorce/data/tsi-data/). The monthly mean data of atmospheric circulation are the reanalysis data from the National Centre for Environmental Prediction/National Center for Atmospheric Research (NCEP/NCAR) in the United States (Kalnay et al., 1996).
The snow indices used in this study are winter and spring snow depth (WSD/SSD) and snow day number (WSDN/SSDN) from 1951 to 2015 (Song et al., 2011). All of these four indices are daily observational data over the Tibetan Plateau from the China Meteorological Information Center. In order to eliminate data discontinuity, the original data have been chosen carefully and interpolated strictly to obtain continuous monthly data over 51 gauge stations of 1961–2015 (Song et al., 2011). The distribution of the observational stations over the Tibetan Plateau is shown in Figure 1, in which black dots indicate gauge stations. The shaded area indicates that the elevation is above 3,000 m. The monthly snow data are the sum of daily snow data in 1 month. SSD and SSDN are obtained by calculating the average of monthly snow depth and snow day number from March to May at each station. Similarly, WSD and WSDN can be defined as the average of snow depth and snow day number from December to January and February of the following year at each station. Thus, we acquire the seasonal snow data of all stations over the plateau.
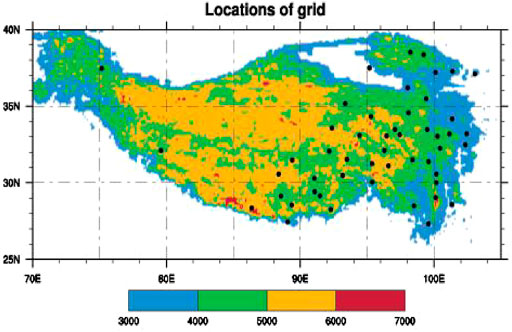
FIGURE 1. The distribution of observation stations over the Tibetan Plateau (the shaded area means that the elevation altitude is above 3,000 m. Black dots indicate observation stations chosen to calculate snow indices over the Tibetan Plateau).
Summer precipitation data over 160 observation stations in China can be obtained from the National Meteorological Information Center, China Meteorological Administration (http://10.1.64.154/). The strong ENSO events data involving strong El Niño and La Niña events are obtained from the National Climate Center of China, which uses the Nino indices data published by the National Oceanic and Atmospheric Administration to calculate the Nino Z SSTA Index, which is the composite Nino index of the area weighted average for Nino1+2, Nino3, and Nino4 zones in the tropical Pacific Ocean (https://www.esrl.noaa.gov/psd/gcos_wgsp/Timeseries/). The climatological mean of all data sets used in this paper is the 30-year average from 1981 to 2010.
Methods
Monte Carlo significance test method: For different data sets with different time scales, it is necessary to use different significance test methods. For example, the Student’s t-test method is adopted to test the significance levels of correlation coefficients of raw data sets. However, for data sets after running mean, Monte Carlo method should be used to test the significance levels (Yan et al., 2003; Zhao and Han, 2005; Zhou et al., 2012), because of the decrease in both data number and degree of freedom.
The detailed steps in computing the critical values of correlation coefficients with the Monte Carlo method are as follows:
(1) Produce two random sample sequences, then compute the correlation coefficient of the two sample sequences after running mean; finally, get 5,000 correlation coefficients after calculating 5,000 times repeatedly.
(2) Arrange the 5,000 correlation coefficients from small to large values, and find the correlation coefficients of No. 5,000 × 90%, 5,000 × 95%, and 5,000 × 99%, respectively, with reliability thresholds of 0.1 significant level, 0.05 significant level, and 0.01 significant level.
(3) Repeat the above steps 40 times, and then get 40 correlation coefficient thresholds of 0.1 significant level, 0.05 significant level, and 0.01 significant level. Average the 40 reliability thresholds of correlation coefficients for 0.1 significant level, 0.05 significant level, and 0.01 significant level to be the required reliability thresholds.
See Zhou and Zheng (1999) for the method to calculate the degree of freedom of new sample series after running mean. The raw data set of winter snow depth over the Tibetan Plateau used in this paper is a discrete time series, 55 years in total, i.e.,
So, the bandwidth of the original data set is
So, the degree of freedom of the new data set is equal to that of the original sequence multiplied by
Therefore, the degree of freedom of the new winter snow depth data set for 55 years after the 11-year running mean is changed to approximately 7.
Composite Mean Difference (CMD) method: The CMD used in this paper is an intuitive way to obtain the spatial pattern by calculating the differences between the strong and weak solar activity composites. CMD is often used to deduce the spatial pattern of the solar cycle response (Camp and Tung, 2007). In this study, we divide all the data into two groups according to the strong and weak solar activity years [e.g., normalized data values larger than zero are ascribed to HSAY, and those smaller than zero are ascribed to low solar activity years (LSAY)] and then calculate the difference between the two groups to obtain a spatial pattern of solar response. The Student’s t-test is used to examine the significance level.
Cross Spectral Analyses
1) Continuous Wavelet Transform (CWT)
Geophysical science often needs to decompose one signal into wavelets. The fourier transform is used to decompose a signal into infinite number of terms, which lose most time-localization information. The continuous wavelet transform (CWT) could decompose a time series into time-frequency space and could be used for feature extraction purposes. The CWT method is often used for analyzing localized intermittent oscillations in a time series, especially the time series that are not normally distributed.
2) Cross Wavelet Transform (XWT)
CWT could be used to examine whether two time series are linked in some way. Therefore, two CWTs could be used to construct the Cross Wavelet Transform (XWT) so as to expose their common power and relative phase in time-frequency space.
The cross wavelet spectrum of two time series X and Y with wavelet transform
3) Wavelet Coherence (WTC)
In this paper, we used another tool to further identify the significant coherence between two CWTs. Even though the common power is low, Wavelet Coherence (WTC) can exhibit how confidence levels against red noise backgrounds are calculated. Different from the cross wavelet power, coherence detects the intensity of the covariance in time-frequency space with a measure of the common power of two time series.
A red noise to determine the 95% statistical confidence level of the coherence is identified by Monte Carlo method (Torrence and Webster, 1999; Jevrejeva et al., 2003).
Results
Relationship Between Solar Activity and the Tibetan Plateau Snow Cover Variations
Time Series of Solar Activity Parameters and Snow Indices Over the Tibetan Plateau
Figure 2 shows the time series of normalized SRF, SSN and TSI, respectively. It can be speculated that the long-term variations of three solar parameters have an obvious 11-year cycle. They signify different meanings when they represent solar activity. SRF is solar radio flux with a 10.7-cm wavelength. SSN is the sunspot number, which is related to the Sun’s magnetic field. TSI is the total solar irradiance of the Sun. If we use different solar parameters to study the impact on climate system, there could be subtle differences.
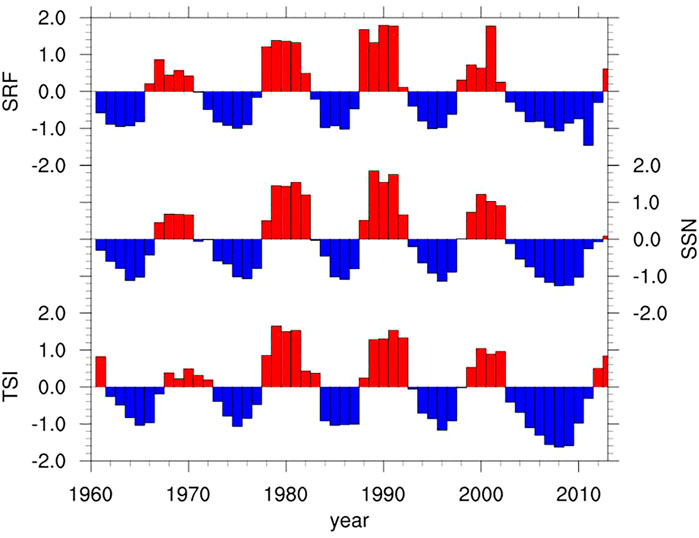
FIGURE 2. Time series of the normalized SRF, SSN, and TSIduring 1961–2013.
Figure 3 is the time series of normalized values of four snow indices with the 11-year running mean. They have very distinct interannual and interdecadal variabilities. On a long time scale, three obvious interdecadal periods are identified, i.e., less snow before the end of the 1970s, more snow from 1980 to 2003, and less snow after the early 2000s, except for WSD with a longer snow period from 1980 to 1999, ending earlier than other snow indices.
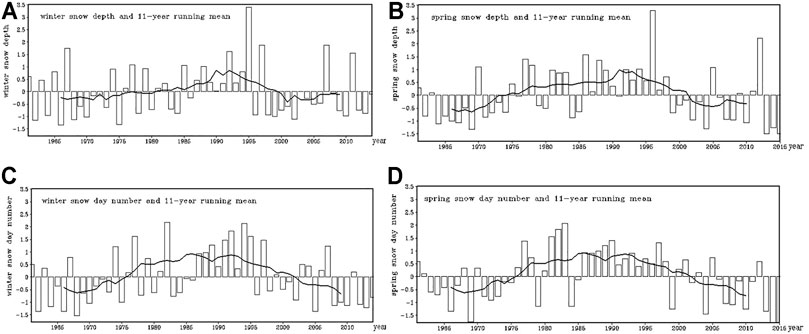
FIGURE 3. Time series of normalized WSD (A), WSDN (B), SSD (C), and SSDN (D) and their interdecadal variations after the 11-year running mean.
Correlation Coefficients of Solar Activity Parameters and Snow Indices Over the Tibetan Plateau on Multi-Time Scales
In order to detect the response of snow indices to the solar activity, we calculate the contemporaneous and lag correlation coefficients between three solar parameters and four snow indices on multi-time scales, including interannual and interdecadal time scales. On interdecadal time scales, the correlation coefficients are calculated after a 9-year running mean (so as to remove the influence of ENSO) and after an 11-year running mean, respectively. The results are presented in Tables 1–4, where *, **, and *** indicate 0.1, 0.05, and 0.01 significance levels, respectively.
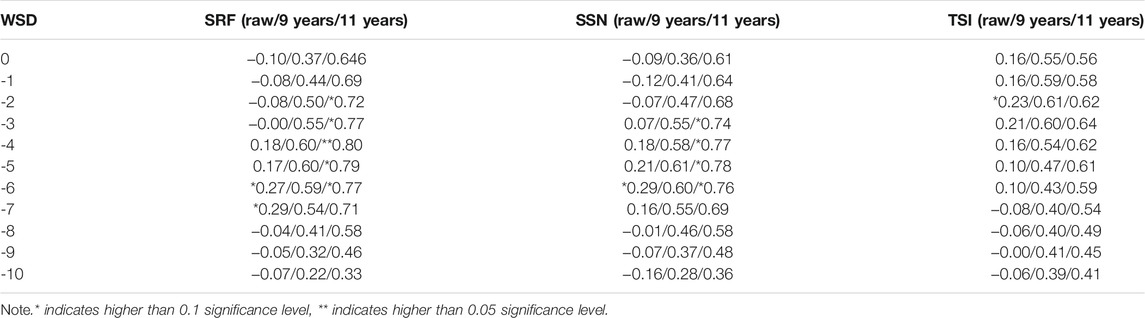
TABLE 1. Correlation coefficients of WSD and SRF, SSN, and TSI on multi-time scales from 1961 to 2015.
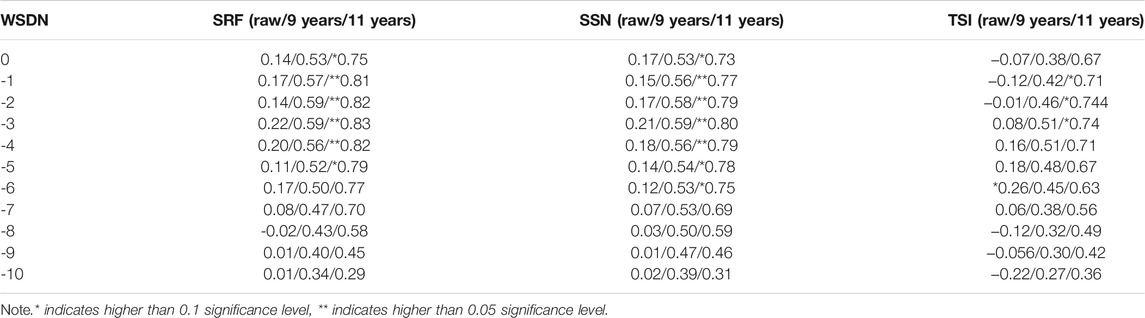
TABLE 2. Correlation coefficients of WSDN and SRF, SSN, and TSI on multi-time scales from 1961 to 2015.
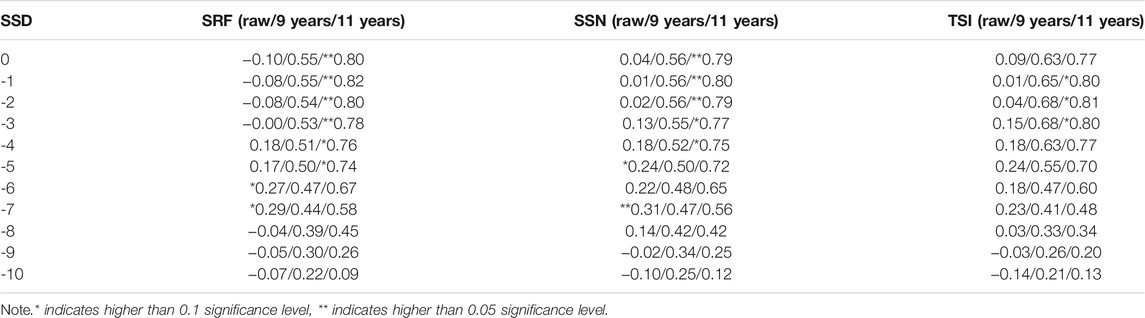
TABLE 3. Correlation coefficients of SSD and SRF, SSN, and TSI on multi-time scales from 1961 to 2015.
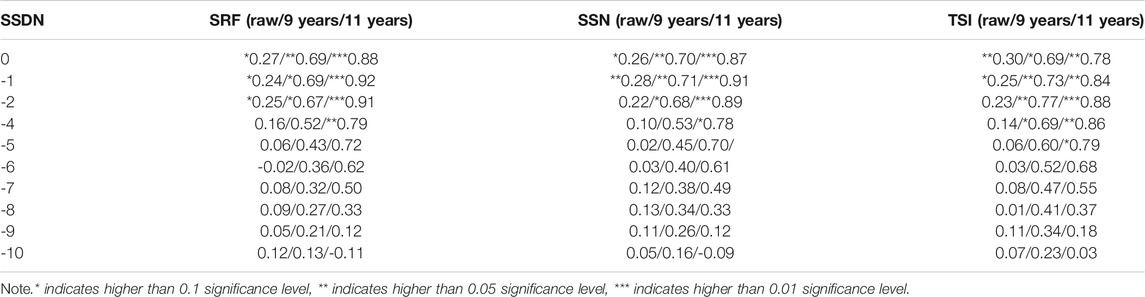
TABLE 4. Correlation coefficients of SSDN and SRF, SSN, and TSI on multi-time scales from 1961 to 2015.
Table 1 lists the correlation coefficients between WSD and SRF, SSN, and TSI. In the first column, 0 indicates contemporary, 1 indicates a lag of 1 year, 2 indicates a lag of 2 years, and so on. In the first line, “raw” indicates the raw data, “9 years” indicates the 9-year running mean data, and “11 years” indicates the 11-year running mean data. Tables 2–4 are similar to Table 1. It is noticeable that WSD has a significant lag correlation with SRF and SSN after the 11-year running mean. In particular, at a lag of 4 years, the lag correlation coefficient with SRF is above 0.05 significance level. Similarly, Tables 2–4 also exhibit the correlation coefficients between WSDN/SSD/SSDN and SRF, SSN, and TSI, respectively. It is also found that WSDN, SSD, and SSDN are highly correlated with a time lag with SRF, SSN, and TSI after the 11-year running mean. WSDN not only has a significant lag but also has contemporaneous correlation coefficients with SRF and SSN, especially at a lag of 1–4 years, with correlation coefficient above the 0.05 significance level. It is noteworthy that SSDN has the closest correlations with three solar parameters after the 11-year running mean. Moreover, SSDN has significant correlations with SRF, SSN, and TSI not only after the 9-year and 11-year running means but also for the unfiltered raw data. After the 9-year running mean, SSDN has not only remarkable contemporaneous correlation coefficients with SRF and SSN at 0.05 significance level, but also remarkable lag correlation coefficients with SSN and TSI at 0.05 significance level. After the 11-year running mean, SSDN has remarkable contemporaneous and lag correlation coefficients with SRF and SSN at 0.01 significance level as well as remarkable contemporaneous and lag correlation coefficients with TSI at 0.05 and 0.01 significance levels, respectively.
Based on the above correlation analyses, it can be deduced that SSDN is the most sensitive snow index response to solar activity because it is significantly correlated with both the original data and running-mean data of three solar parameters.
In order to further detect the correlation of snow indices and solar activity, the 21-year running correlations of four snow indices and SRF are investigated, as shown in Figure 4. It is seen from the figure that the correlations of snow day numbers in winter/spring and SRF are quite stable and present positive correlation coefficients. In particular, SSDN is the most sensitive response snow index to SRF. Comparatively, the 21-year running correlations between snow depth in winter/spring and SRF vary and have obvious transition from positive correlation coefficients to negative correlation coefficients around 1983 (omitted).
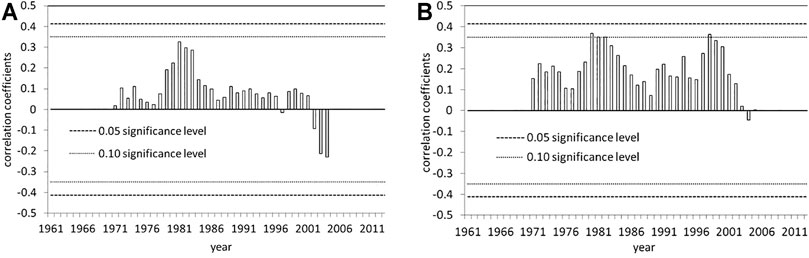
FIGURE 4. The 21-year running correlation coefficients of snow indices and SRF, (A) WSDN and (B) SSDN. Rectangles are snow indices. Short dashed lines indicate 0.05 significance levels, and long dashed lines are 0.01 significance levels, respectively.
Cross Spectral Analyses of Spring Snow Day Number and Solar Radio Flux, Solar Sunspot Number, and Total Solar Irradiance
Figure 5 shows the cross spectral analyses of SSDN and SRF during 1961–2015 as well as SSN and TSI during 1961–2011 to further verify the highly correlated relationship of SSDN and the Sun.
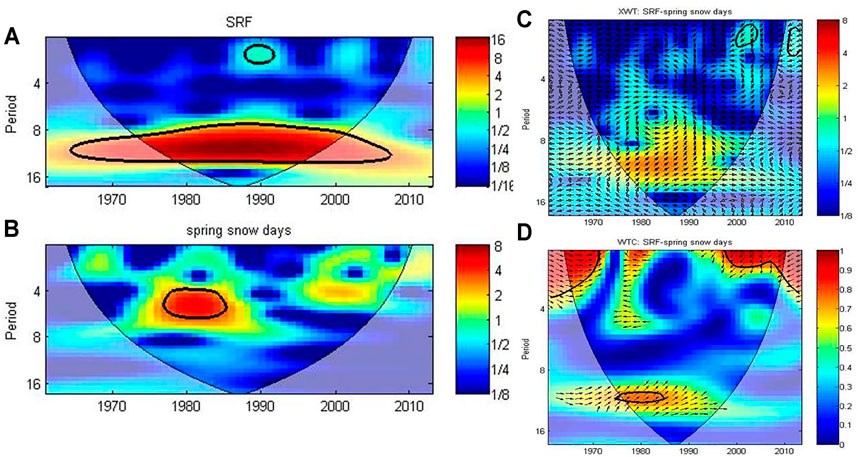
FIGURE 5. Cross spectral analyses of SSDN and SRF. (A) Power spectrum of winter SRF, (B) power spectrum of SSDN, (C) cross wavelet transforms, and (D) square wavelet coherence of SSDN and SRF [thick black contour designates the 0.05 significance level against red noise and the cone of influence (COI) where edge effects might distort thepicture is shown as a lighter shade].
From the power spectrum of winter SRF (Figure 5A), SSN, and TSI (figures omitted), it can be speculated that SRF, SSN, and TSI have an obvious 11-year cycle, but SSDN has no such signal (Figure 5B). However, on longer time scales, it has obvious coherence with SRF, SSN, and TSI. Cross wavelet transforms show that SSDN has a positive correlation with SRF (Figure 5C), SSN, and TSI (figures omitted) on decadal time scales, respectively. From 1980 to 1992, the positive correlation with SSN is significant. Analyses on square wavelet coherence indicate that SSDN has high correlations with SRF (Figure 5D) and SSN (figure omitted) from the mid-1970s to the mid-1980s, and with TSI from the end of the 1960s to the early 1980s (figure omitted). It illustrates that SSDN has indeed positive coherence with solar parameters.
The Correlation of Spring Snow Day Number and Summer Precipitation of China Regulated by Solar Activity
Correlations Between Spring Snow Day Number and Summer Precipitation in China
Figure 6 shows the correlations of SSDN and summer precipitation in China for normal years, HSAY, and LSAY, respectively. HSAY (LSAY) is defined as the year of normalized value of SRF being more (less) than zero. It is seen that there are few highly correlated stations between SSDN and gauge precipitation in China (Figure 6A), but in HSAY (Figure 6B), the number of stations with significant correlation is more than that of normal years. Most parts of Northeast China and North China, as well as the south of the Yangtze River, have significant negative correlation coefficients, which indicates that when the solar activity is strong and SSDN is larger, these areas get less precipitation and are relatively dry. Between the Yellow River and the Yangtze River, significant positive correlation coefficients are identified, especially in the south of the Hetao area. It means that when the Sun is active and SSDN is larger, the precipitation in these areas increases. LSAY (Figure 6C) are accompanied with weakening correlations. However, there are still some stations with significant correlation coefficients in North China, south of the Yangtze River and Southwest China, while the patterns are opposite to those in HSAY. Therefore, solar activity could regulate the correlations between SSDN and summer precipitation in China.
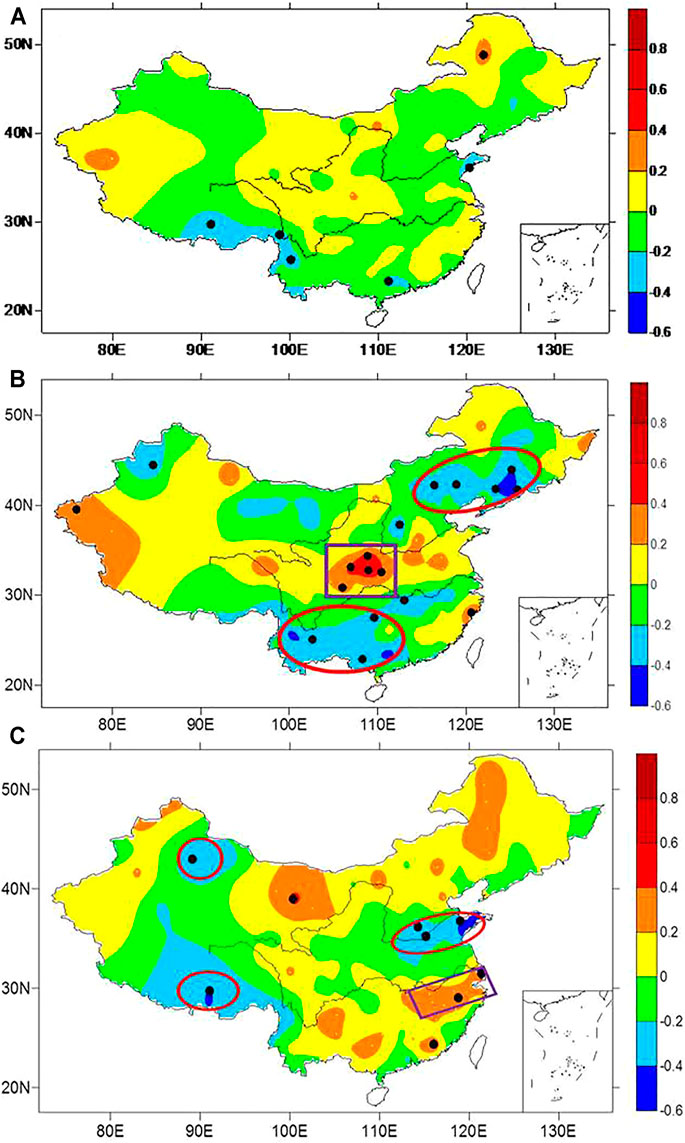
FIGURE 6. Correlation coefficients of SSDN and summer precipitation of China in (A) normal years, (B) HSAY, and (C) LSAY. (Warm colors indicate the positive correlation coefficients, cold colors indicate the negative correlation coefficients, and black dots indicate gauge stations with high correlations at 0.1 significance levels. Red ellipses indicate negative correlation coefficients, and purple rectangles indicate positive correlation coefficients.)
Correlations Between Spring Snow Day Number and Summer Precipitation in China Without El Niño–Southern Oscillation Events
Based on the above analyses, it can be deduced that the correlation between SSDN and summer precipitation in China is regulated by solar activity. However, the data we used could be contaminated by strong ENSO events. As we know, ENSO events would also have strong influence on summer precipitation in China (Zhang et al., 1999; Wu et al., 2003). Therefore, analyses need to be done for HSAY and LSAY years with strong ENSO events (i.e., strong El Niño and La Niña events) excluded.
In order to filter out the impact of ENSO events on summer precipitation in China, the intensity grade of ENSO events issued by the National Climate Center is adopted to calculate partial correlation coefficients of SSDN and summer precipitation in China, as shown in Figure 7.
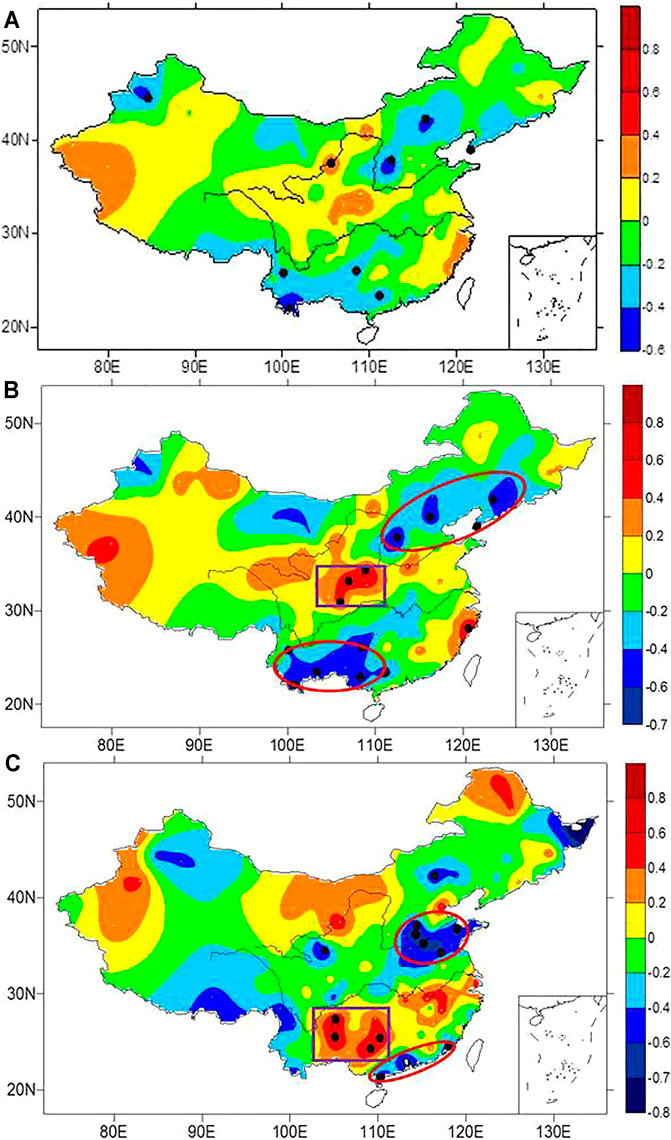
FIGURE 7. Similar to Figure 6 but the partial correlation coefficients of SSDN and summer precipitation in China excluding the impact of ENSO events.
Figure 7 is similar to Figure 6, but it excludes the impact of ENSO events. It is apparent that without the contamination of ENSO events, the correlations between SSDN and summer precipitation in China in Figure 7A have the same pattern as Figure 6A. In particular, in Shandong Peninsula, Southeast of the Tibetan Plateau, Guangdong province and south of Yunnan province, there are significant negative correlations, while there are remarkable positive correlation coefficients in the Daba Mountain area. In HSAY (Figure 7B), the correlation coefficients become more significant than those in normal years (Figure 7A). A number of remarkable negative correlation coefficients are seen in Northeast China, North China, Southwest China, Guizhou, and Guangxi areas, which means that, in HSAY, more spring snow over the Tibetan Plateau could cause less precipitation in these areas. There are significant positive coefficients in the south of Hetao Basin, around Shaanxi, the north of Sichuan, Zhejiang, and Fujian provinces, which indicates that, in HSAY, more spring snow could lead to more precipitation in these areas. In LSAY (Figure 7C), in Shandong province and east of Henan province, i.e., the north of lower reach of Huaihe River and the south of Yellow River, southeast of the Tibetan Plateau, and the Southeast China, there are obvious negative anomalies, indicating that more spring snow could cause less precipitation in these areas. Meanwhile, the positive anomalies are not obvious in Figure 7C. Therefore, in HSAY and LSAY, without the impact of ENSO events, there are obviously different correlation patterns between SSDN and summer precipitation in China, which testifies that the modulation of solar activity to correlation between snow and summer precipitation is valid without the influence from ENSO.
In terms of summer precipitation in China, in order to distinguish the direct influence of solar activity from the indirect influence of snow cover over the Tibetan Plateau, which is caused by solar activity, the composites of summer precipitation in peak years and valley years are investigated, as shown in Figure 8A and Figure 8B, respectively. Compared with Figure 7, the anomaly patterns of summer precipitation in Figure 8 are obviously different. Here, wintertime solar radio flux peak years are selected as the peak years of solar activity namely 1957/58, 1957/68, 1979/80, 1990/91 and 2001/02, respectively; and wintertime solar radio flux valley years are selected as the valley years of solar activity namely 1963/64, 1975/76, 1986/87, 1995/96 and 2008/09. In peak years, around the middle and south of North China, there are negative anomalies, indicating the decreased precipitation there, while in Guangxi, Guizhou, south of Xizang and west of Yunnan, positive anomalies are found with increased precipitation (Figure 8A). In the valley years, less stations can pass the significance test. When SSDN increases, the precipitation in most parts of North China, Shandong Peninsula and a few stations of the Yangtze River Basin increases significantly, and other observation stations can not pass the significance test. The results indicate that, to a certain extent, solar activity could regulate the relationship between snow over the Tibetan Plateau and summer precipitation in China.
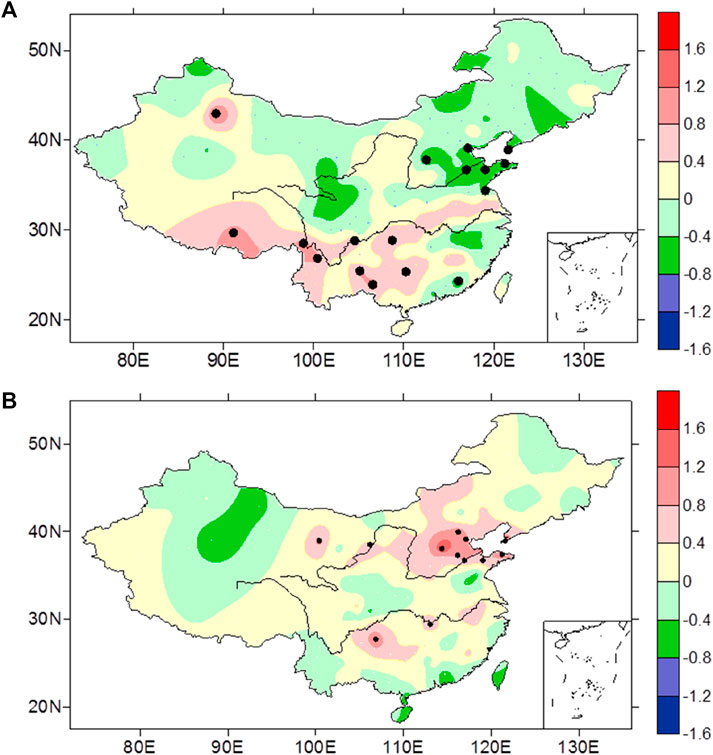
FIGURE 8. Composites of anomalous summer precipitation in China in (A) peak years and (B) valley years, respectively. (Warm colors indicate summer precipitation increases, cold colors indicate that summer precipitation decreases, and black dots indicate gauge stations with high correlations at 0.1 significance levels.)
Summary
In order to explain the anomalous summer precipitation pattern in China in Figure 6, correlation coefficients of SSDN, 500 hPa geopotential height field, and 850 hPa wind field in HSAY are calculated, respectively, as shown in Figure 9A and Figure 9B. It is seen from Figure 9A that a positive correlation coefficient belt is found from northeast to southwest along the east of China, and a negative correlation coefficient belt is identified from Lake Baikal to the west of China. The positive anomaly and negative anomaly present meridional belt distribution. It indicates that much warmer and moister air mass is transported from the Indian Ocean to western China, leading to intensified precipitation over the area. At 850 hPa, there exist two convergent zones in Xinjiang province and south of Hetao area, which correspond to areas with more precipitation in Figure 6B, located at Qinling Mountains and the Daba Mountain area.
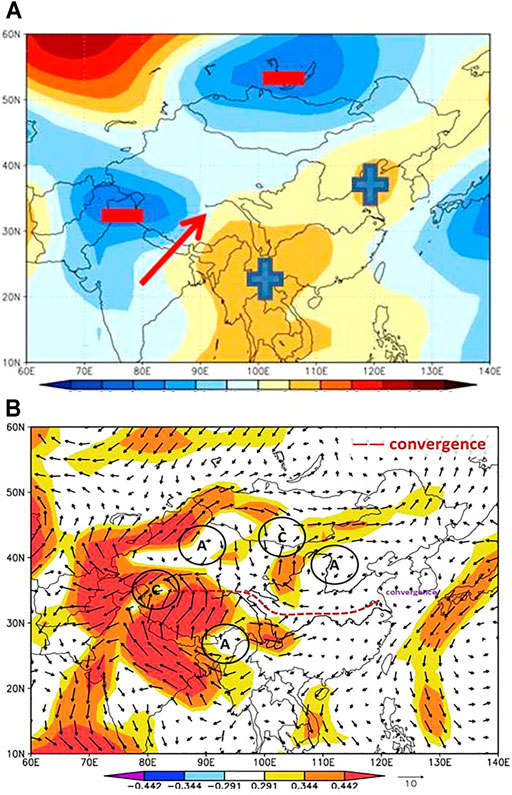
FIGURE 9. Correlation coefficients of SSDN and (A) 500 hPa geopotential height field, (B) 850 hPa wind field in HSAY. (In panel a, “+” represents the positive correlation coefficient, “-” indicates the negative correlation coefficient, and the red arrow is the direction of the air flow. In panel b, “A” represents the anomalous anticyclone, “(C)” is the anomalous cyclone, and “——” means convergent zone. The arrows are air flows. The colored shaded areas indicate that the significance level is more than 0.1. The gray shaded areas indicate that the elevation altitudes are above 1500 m.)
In LSAY, the correlation coefficients between SSDN and geopotential height field on 500 hPa exhibit a zonal belt distribution of negative-north–positive-south, which is conducive to the invasion of cold air as shown in Figure 10A and Figure 10B, to the Yangtze River and further south. The correlation between SSDN and 850 hPa wind field shows that there is an anomalous cyclone in the north part of the bay of Bengal, which is farther south and farther west than that in normal years. This condition is not conducive to the northward penetration of the southwest monsoon flow. There is a pair of vortices in the south of the Yangtze River, i.e., an anomalous cyclone in the north of Guangdong and an anomalous anticyclone over the East China Sea. Between them, there is an obvious southerly anomaly at 115–120ºE in the east of South China, while in the north, a northerly anomaly exists in the coastal area, along with a convergence zone of the northeast to southwest direction in the south of the Yangtze River, which corresponds to the rain belt in Figure 7C. Shandong Peninsula and its west area are divergent zones, corresponding to the area with reduced precipitation in Figure 7C. In addition, the other two convergence zones are located in the north of Hetao and Daxinganling, respectively.
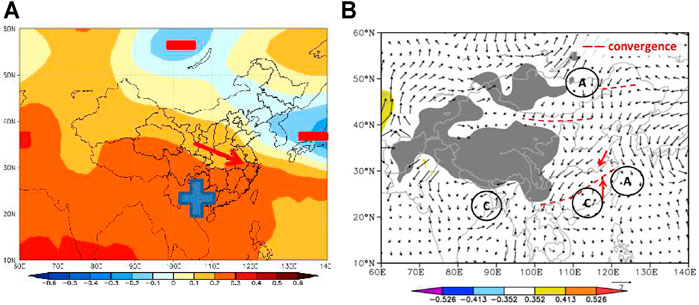
FIGURE 10. Correlation coefficients of SSDN and (A) 500 hPa geopotential height field, (B) 850 hPa wind field in LSAY. (In panel a, “+” represents the positive correlation coefficient, “-” indicates the negative correlation coefficient, and the red arrow is the direction of the air flow. In panel b, “A” represents the anomalous anticyclone, “C” is the anomalous cyclone, and “——” means convergent zone. The arrows are air flows. The colored shaded areas indicate that the significance level is more than 0.1. The gray shaded areas indicate that the elevation altitudes are above 1500 m.)
According to the above results, we get the following summary:
(1) Based on the synchronous and lag correlation coefficients of four snow indices over the Tibetan Plateau and three solar parameters on multi-time scales, it is inferred that SSDN is the most sensitive snow index on multi-time scales. SSDN has consistently positive correlations with SRF after the 21-year running mean, which is further verified by cross spectral analyses of SSDN and SRF, SSN, and TSI.
(2) The correlation coefficients between SSDN and summer precipitation in China are more significant when considering intensity variation of solar activity. In HSAY, the correlation of SSDN and summer precipitation is more significant than that in LSAY. Over Northeast China, North China, Southwest China, Guizhou, and Guangxi, there are obvious negative correlation coefficients, while the south of Hetao Basin, around Shaanxi and the north of Sichuan, and Zhejiang and Fujian provinces experience positive anomalies. In LSAY, the south of North China, the lower reach of Huaihe River, and the Southeast China present obvious negative anomalies, while Southwest China shows positive anomaly. When excluding the influence of strong ENSO events, the regulation of solar activity on the correlation between SSDN and summer precipitation in China is still robust. Furthermore, the direct influence caused by solar activity on summer precipitation in China is obviously different from that caused by snow cover over the Tibetan Plateau. Therefore, it is verified that the correlation coefficients between SSDN and summer precipitation are indeed regulated by solar activity.
Main findings
Spring snow day number is the most sensitive snow index of response to solar activity based on correlation analysis on multi-time scales. The relationship between spring snow day number and summer precipitation in China is regulated by solar activity obviously. Excluding the influence of strong ENSO events, the regulation of solar activity on the above relationship is more obvious.
Data Availability Statement
The raw data supporting the conclusions of this article will be made available by the authors, without undue reservation.
Author Contributions
YS and ZL designed this manuscript; ZL performed the data analysis; YS drafted the manuscript; YG and ZX performed manuscript review and editing.
Funding
This paper is supported by the National Natural Science Foundation of China under Contracts 41575091 and 42075040, the Major National Scientific Research Project of China under Contracts2012CB957803 and 2012CB957800, and the project of Training Center of ChinaMeteorological Administration “Study on Physical Factors to Affect China Climate”. ZL is supported by the Key R and D (Social Development) program of Shanxi Province (201803d31219).
Conflict of Interest
The authors declare that the research was conducted in the absence of any commercial or financial relationships that could be construed as a potential conflict of interest.
Publisher’s Note
All claims expressed in this article are solely those of the authors and do not necessarily represent those of their affiliated organizations, or those of the publisher, the editors, and the reviewers. Any product that may be evaluated in this article, or claim that may be made by its manufacturer, is not guaranteed or endorsed by the publisher.
References
Bamzai, A. S., and Marx, L. (2000). COLA AGCM Simulation of the Effect of Anomalous spring Snow over Eurasia on the Indian Summer Monsoon. Q.J R. Met. Soc. 126, 2575–2584. doi:10.1002/qj.49712656811
Camp, C. D., and Tung, K. K. (2007). Surface Warming by the Solar Cycle as Revealed by the Composite Mean Difference Projection. Geophys. Res. Lett. 34, L14703. doi:10.1029/2007GL030207
Chen, W., and Zhou, Q. (2012). Modulation of the Arctic Oscillation and the East Asian winter Climate Relationships by the 11-year Solar Cycle. Adv. Atmos. Sci. 29, 217–226. doi:10.1007/s00376-011-1095-3
Coddington, O., Lean, J. L., Pilewskie, P., Snow, M., and Lindholm, D. (2015). A Solar Irradiance Climate Data Record. Bull. Am. Meteorol. Soc. doi:10.1175/BAMS-D-14-00265.12
Ding, Y. H., Sun, Y., Wang, Z. Y., Zhu, Y. X., and Song, Y. F. (2009). Inter-decadal Variation of the Summer Precipitation in East China and its Association with Decreasing Asian Summer Monsoon. Part II: Possible Cause. Int. J. Climatol. 29, 19451955. doi:10.1002/joc.1759
Grenfell Thomas, C., Warren Stephen, G., and Mullen Peter, C. (1994). Reflection of Solar Radiation by the Antarctic Snow Surface at Ultraviolet, Visible, and Near-Infrared Wavelengths. J. Geophys. Res., 18,699–18,684. doi:10.1029/94jd01484
Haigh, J. D., Blackburn, M., and Day, R. (2005). The Response of Tropospheric Circulation to Perturbations in Lower-Stratospheric Temperature. J Clim. 18, 3672–3685. doi:10.1175/JCLI3472.1
Haigh, J. D., and Blackburn, M. (2006). Solar Influences on Dynamical Coupling between the Stratosphere and Troposphere. Space Sci. Rev. 125, 331–344. doi:10.1007/s11214-006-9067-0
Haigh, J. D. (2003). The Effects of Solar Variability on the Earth's Climate. Phil. Trans. R. Soc. Lond. Ser. A: Math. Phys. Eng. Sci. 361, 95–111. doi:10.1098/rsta.2002.1111
Hoyt, D. V., and Schatten, K. H. (1997). The Role of the Sun in Climate Change. New York: Oxford University Press, 288.
Jevrejeva, S., Moore, J. C., and Grinsted, A. (2003). Influence of the Arctic Oscillation and El Nin˜o-Southern Oscillation (ENSO) on Ice Conditions in the Baltic Sea: the Wavelet Approach. J. Geophys. Res. 108, 214677. doi:10.1029/2003jd003417
Kalnay, E., Kanamitsu, M., Kistler, R., Collins, W., Deaven, D., Gandin, L., et al. (1996). The NCEP/NCAR 40-year Reanalysis Project. Bull. Amer. Meteorol. Soc. 77, 437–471. doi:10.1175/1520-0477(1996)077<0437:tnyrp>2.0.co;2
Kerr, R. A. (2005). Changes in the Sun May Sway the Tropical Monsoon. Science 308, 787. doi:10.1126/science.308.5723.787
Kodera, K. (2004). Solar Influence on the Indian Ocean Monsoon through Dynamical Processes. Geophys. Res. Lett. 31, L24209. doi:10.1029/2004gl020928
Kopp, G., Krivova, N., Wu, C. J., and Lean, J. (2016). The Impact of the Revised Sunspot Record on Solar Irradiance Reconstructions. Sol. Phys. 291, 2951–2965. doi:10.1007/s11207-016-0853-x
Kushner, P. J., and Polvani, L. M. (2006). Stratosphere-Troposphere Coupling in a Relatively Simple AGCM: Impact of the Seasonal Cycle. J. Clim. 19, 5721–5727. doi:10.1175/JCLI4007.1
Lean, J. L. (2010). Cycles and Trends in Solar Irradiance and Climate. Wires Clim. Change 1, 111–122. doi:10.1002/wcc.18
Li, W., Sun, S., Wang, B., and Liu, X. (2009). Numerical Simulation of Sensitivities of Snow Melting to Spectral Composition of the Incoming Solar Radiation. Adv. Atmos. Sci. 26, 403–412. doi:10.1007/s00376-009-0403-7
Liu, J., Wang, B., Ding, Q., Kuang, X., Soon, W., and Zorita, E. (2009). Centennial Variations of the Global Monsoon Precipitation in the Last Millennium: Results from ECHO-G Model. J Clim. 22, 2356–2371. doi:10.1175/2008jcli2353.1
Meinander, O., Wuttke, S., Seckmeyer, G., Kazadzis, S., Lindfors, A., and Kyroe, E. (2009). Solar Zenith Angle Asymmetry Cases in Polar Snow UV Albedo. Geophysica 45 (1-2), 183–198.
Qian, Y. F., Zhang, G. Y., and Zheng, Y. Q. (2003). Impacts of the Tibetan Plateau Snow Anomaly in Winter and Spring on Precipitation in China in Spring and Summer. Arid Meteorology 21, 1–7.
Song, Y., Zhang, J., Li, Z. C., and Zhao, P. (2011). Interdecadalchange of winter Snow Cover of Tibetan Plateau and its Effect on Summer Precipitation in China. Plateau Meteorology 30, 843–851.
Song, Y., Li, Z. C., Z, N. Xiao., Zhang, J., Li, H. Y., and Zhu, Y. X. (2016b). Analysis on Interdecadal Correlation between Solar Activity and Snow Depth over the Qinghai-Xizang Plateau and East Asian Atmospheric Circulation in winter. Plateau Meteorology 35, 1135–1147. doi:10.7522/j.issn.1000-0534.2015.00059
Song, Y., Li, Z. C., Zhang, J., and Xiao, Z. N. (2016a). Review of Researches of Modulation Effects of Solar Activity on the Snow over Tibetan Plateau and East Asian Summer Monsoon. Adv. Met S&T 6, 148–154.
Song, Y., Li, Z., Gu, Y., Liou, K.-N., Zhang, X., and Xiao, Z. (2019). The Effect of Solar Cycle on Climate of Northeast Asia. J. Meteorol. Res. 33, 885–894. doi:10.1007/s13351-019-8132-z
Tan, L., Cai, Y., An, Z., and Ai, L. (2008). Precipitation Variations of Longxi, Northeast Margin of Tibetan Plateau since AD 960 and Their Relationship with Solar Activity. Clim. Past 4, 19–28.
Torrence, C., and Compo, G. P. (1998). A Practical Guide to Wavelet Analysis. Bull. Amer. Meteorol. Soc. 79, 61–78. doi:10.1175/1520-0477(1998)079<0061:apgtwa>2.0.co;2
Torrence, C., and Webster, P. J. (1999). Interdecadal Changes in the ENSO-Monsoon System. J. Clim. 12, 2679–2690. doi:10.1175/1520-0442(1999)012<2679:icitem>2.0.co;2
Torrence, C., and Webster, P. J. (1998). The Annual Cycle of Persistence in the El Nino-Southern Oscillation. Q. J. R. Meteorol. Soc. 124. doi:10.1256/smsqj.55009
Verschuren, D., Damste, J. S. S., Sinninghe Damsté, J. S., Moernaut, J., Kristen, I., Blaauw, M., et al. CHALLACEA project members (2009). Half-precessional Dynamics of Monsoon Rainfall Near the East African Equator. Nature 462, 637–641. doi:10.1038/nature08520
Wang, Y., Cheng, H., Edwards, R. L., He, Y., Kong, X., An, Z., et al. (2005). The Holocene Asian Monsoon: Links to Solar Changes and North Atlantic Climate. Science 308, 854–857. doi:10.1126/science.1106296
Wang, Z., Wu, R., and Huang, G. (2018). Low-frequency Snow Changes over the Tibetan Plateau. Int. J. Climatol. 38 (2), 949–963. doi:10.1002/joc.5221
Wasko, C., and Sharma, A. (2009). Effect of Solar Variability on Atmospheric Moisture Storage. Geophys. Res. Lett. 36, a–n. doi:10.1029/2008GL036310
Wei, Z. G., Chen, W., and Huang, R. H. (2008). Numerical Simulation of the Influence of the Tibetan Plateau winter-spring Snow Anomalies on the Summer Precipitation in China. Plateau Mountain Meteorology Res. 28 (1), 1–7.
Wu, R., Hu, Z.-Z., and Kirtman, B. P. (2003). Evolution of ENSO-Related Rainfall Anomalies in East Asia. J. Clim. 16 (22), 3742–3758. doi:10.1175/1520-0442(2003)016<3742:eoerai>2.0.co;2
Wu, R., Wen, Z., Yang, S., and Li, Y. (2010). An Interdecadal Change in Southern China Summer Rainfall Around 1992/93. J. Clim. 23 (9), 2389–2403. doi:10.1175/2009jcli3336.1
Yan, H. M., Zhong, M., and Zhu, Y. Z. (2003). The Determination of Degrees of freedom for Digital Filtered Time Series - an Application in the Correlation Analysis between Length of Day Variation and SOI. ActaAstronomicaSinica 44 (3), 324–329.
Zhang, R. H., Wu, B. Y., Zhao, P., and Han, J. P. (2008). The Decadal Shift of the Summer Climate in the 1980s over East China and its Possible Causes. ActaMeterologicaSinica 66, 697–706.
Zhang, R., Sumi, A., and Kimoto, M. (1999). A Diagnostic Study of the Impact of El Niño on the Precipitation in China. Adv. Atmos. Sci. 16, 229–241. doi:10.1007/bf02973084
Zhang, Y., Li, T., and Wang, B. (2004). Decadal Change of the Spring Snow Depth over the Tibetan Plateau: The Associated Circulation and Influence on the East Asian Summer Monsoon*. J. Clim. 17, 2780–2793. doi:10.1175/1520-0442(2004)017<2780:dcotss>2.0.co;2
Zhao, J., and Han, Y. B. (2005). Estimation of Correlation Significance Levelsafter Moving Average. J. Beijing Normal Univ. (Natural Science) 41, 139–141.
Zhao, J., and Han, Y. (2012). Sun's Total Irradiance Reconstruction Based on Multiple Solar Indices. Sci. China Phys. Mech. Astron. 55, 179–186. doi:10.1007/s11433-011-4496-5
Zhao, L., and Wang, J.-S. (2014). Robust Response of the East Asian Monsoon Rainband to Solar Variability. J. Clim. 27 (8), 3043–3051. doi:10.1175/jcli-d-13-00482.1
Zhao, L., Wang, J., and Zhao, H. (2012). Solar Cycle Signature in Decadal Variability of Monsoon Precipitation in China. J. Meteorol. Soc. Jpn. 901, 1–9. doi:10.2151/jmsj.2012-101
Zhao, L., Xu, Y., Wang, J. S., Ding, Y. H., and Xiao, Z. N. (2011). Progress in Studies on the Influence of Solar Activity on Climate Change during the Last 100 Years. Adv. Meteorol. Sci. Tech. 1 (4), 37–48.
Zhao, P., Yang, S., and Yu, R. (2010). Long-term Changes in Rainfall over Eastern China and Large-Scale Atmospheric Circulation Associated with Recent Global Warming. J. Clim. 23 (6), 1544–1562. doi:10.1175/2009jcli2660.1
Zhou, Z. J., and Liu, J. P. (2007). Variability of Tibetan spring Snow and its Associations with the Hemispheric Extratropical Circulation and East Asian Summer Monsoon Rainfall: An Observation Investigation. Journal of Climate 20 (15), 3942–3955. doi:10.1175/jcli4205.1
Zhou, Q., and Chen, W. (2014). Impact of the 11-year Solar Cycle on the Relationship between the East Asian winter Monsoon and the Following Summer Monsoon and the Related Processes. Climatic Environ. Res. 19, 486–496.
Zhou, Q., and Chen, W. (2012). Influence of the 11-year Solar Cycle on the Evolution of ENSO-Related SST Anomalies and Rainfall Anomalies in East Asia. Chin. J. Atmos. Sci. 36, 851–862.
Zhou, Q., (2013). The Impact of 11-year Solar Cycle on Climate in East Asia and its Mechanism, China; Institute of Atmospheric Physics, Chinese Academy of Sciences, 113.
Zhou, X., Zhao, P., Chen, J., Chen, L., and Li, W. (2009). Impacts of Thermodynamic Processes over the Tibetan Plateau on the Northern Hemispheric Climate. Sci. China Ser. D-earth Sci. 52, 1679–1693. doi:10.1007/s11430-009-0194-9
Keywords: solar activity, snow cover over the Tibetan plateau, summer precipitation of China, correlation analyses, East Asian monsoon
Citation: Song Y, Li Z, Gu Y and Xiao Z (2022) Impact of Solar Activity on Snow Cover Variation Over the Tibetan Plateau and Linkage to the Summer Precipitation in China. Front. Earth Sci. 9:756762. doi: 10.3389/feart.2021.756762
Received: 11 August 2021; Accepted: 19 November 2021;
Published: 05 January 2022.
Edited by:
Xiaoming Hu, Sun Yat-sen University, ChinaReviewed by:
Boqi Liu, Chinese Academy of Meteorological Sciences, ChinaYana Li, City University of Hong Kong, Hong Kong, SAR China
Copyright © 2022 Song, Li, Gu and Xiao. This is an open-access article distributed under the terms of the Creative Commons Attribution License (CC BY). The use, distribution or reproduction in other forums is permitted, provided the original author(s) and the copyright owner(s) are credited and that the original publication in this journal is cited, in accordance with accepted academic practice. No use, distribution or reproduction is permitted which does not comply with these terms.
*Correspondence: Yan Song, c29uZ3lhbkBjbWEuZ292LmNu