 Jiaqi Liu
 Reiji Kimura
 Jing Wu
- Arid Land Research Center, Tottori University, Tottori, Japan
Gravels can protect soil from wind erosion, however, there is little known about the effects of fine-grained gravel on aerodynamic characteristics of the near-surface airflow. Drag coefficient, wind-speed gradient, and turbulent transfer coefficient over different coverages of gravel surfaces were investigated in a compact boundary-layer wind tunnel. The drag coefficient of the fine-grained gravel surface reached the maximum value at 15% coverage and then tended to stabilize at gravel coverage 20% and greater. At a height of 4 cm, near-surface airflow on gravel surfaces can be divided clearly into upper and lower sublayers, defined as the inertial and roughness sublayers, respectively. The coefficient of variation of wind speed over gravel surfaces in the roughness sublayer was 8.6 times that in the inertial sublayer, indicating a greater effect of gravel coverage on wind-speed fluctuations in the lower layer. At a height of 4 cm, wind-speed fluctuations under the observed wind speeds were independent of changes in gravel coverage. In addition, an energy-exchange region, where sand particles can absorb more energy from the surrounding airflow, was found between the roughness and inertial sublayers, enhancing the erosional state of wind-blown sand. This finding can be applied to evaluate the aerodynamic stability of the gravel surface in the Gobi Desert and provide a theoretical basis for elucidation of the vertical distributions of wind-blown sand flux.
Introduction
The Gobi Desert is one of the primary geomorphological types widely distributed in arid and semi-arid regions of Mongolia and northern China. It is also one of the main sources of Asian Dust that results from wind erosion (Bian et al., 2011). During the development of the gobi surface, erodible materials (mainly sand grains) gradually decreased because of long-term wind erosion, whereas non-erodible materials (mainly gravel) remained, forming a non-erodible gravel layer that protects the underlying deposits from further erosion (Bagnold, 2012). The inhibiting effect of this gravel surface on wind erosion and wind-blown sand has been studied widely (Zhang et al., 2014; Liu and Kimura, 2018; Liu et al., 2020). Liu and Kimura (2018) pointed out that most sand particles were trapped at 15% coverage of fine-grained gravel on the surface. In a study of aeolian processes over the great gravel surface at Mogao Grottoes, Zhang et al. (2014) suggested that the surface was protected from wind erosion most effectively at an artificial gobi surface with 30% gravel coverage. They also found that the characteristics of aeolian processes changed from aeolian to depositional as gravel coverage increased. Liu et al. (2020) examined blown sand flux over fine-grained gravel surfaces and reported an erosional state at all experimental coverages. However, it is imperfectly known how and to what extent aerodynamic characteristics of airflow over gravel surfaces affect the transition between aeolian and depositional regimes.
Parameters related to wind profiles, such as drag coefficient, wind-speed gradients, and turbulent transfer coefficient, have been developed to evaluate aerodynamic characteristics of airflow near the ground surface (Dong Z. B. et al., 2002). The dimensionless drag coefficient reflects the drag force generated by obstacles in airflow; this coefficient can be applied to assess the wind-blown sand and dust emission potential of gravel surfaces and hence the aerodynamic stability (Dong Z. et al., 2002). In addition, airflow intensity on gravel surfaces can be characterized by wind-speed gradients with height. As one of the important roughness elements, gravels reduce wind velocity (shear stress) by absorbing part of the wind momentum, thus suppressing wind erosion through their drag effect on airflow in the boundary layer (Marticorena et al., 1997). In wind-erosion studies, sand transport is determined by the momentum transfer in the near-ground surface layer. The capacity of airflow to transfer momentum for a given gradient of wind can be expressed by the turbulent transfer coefficient, which represents the intensity of energy exchange in the vertical direction and hence affects the structural characteristics of wind-blown sand (Shao, 2008). Therefore, understanding the aerodynamic characteristics of the near-surface airflow is important for controlling wind erosion.
The drag coefficient, wind-speed gradient, and turbulent transfer coefficient can be measured by field observations or wind tunnel experiments. Field observations provide validation data for simulations, although the variables cannot be controlled. Because those variables are related not only to geometric characteristics of roughness elements (such as size and shape of gravel) but also to natural topography, such uncontrolled conditions lead to difficulties in interpreting field observations. In contrast, in a wind tunnel, parameters are adjustable for specific experimental conditions (Shao, 2008). In realistic modeling, however, the atmospheric boundary layer restricts quantitative research on aerodynamic characteristics of near-surface airflow. In wind tunnel experiments, (Tan et al., 2013) found that the best gravel coverages for reducing wind speed for gravels with diameters of 2, 3, and 5 cm were 25, 35, and 20%, respectively. However, few studies have been done on variations in wind-reduction effect with height above fine-grained gravel surfaces (diameter <10 mm), which is typical in the Mongolian Gobi Desert.
To clarify the effects of gravel surfaces on aeolian transport, we compared the influence of gravel coverage on the drag coefficient, wind-speed gradient, and turbulent transfer coefficient in a compact boundary-layer wind tunnel developed by Liu and Kimura (2017a, 2017b).
Materials and Methods
Experimental Setup of Wind Tunnel
We conducted experiments in a small-scale, open-circuit wind tunnel (Figure 1) at the Arid Land Research Center at Tottori University, Japan. The wind tunnel was 8.25 m long, had a 0.8 m × 0.5 m cross section, and could generate airflow speeds of up to 12 m s−1, controlled by adjustment of a power inverter. Wind speeds were measured with a pitot tube at a height of 20 cm downwind side of the observation space.
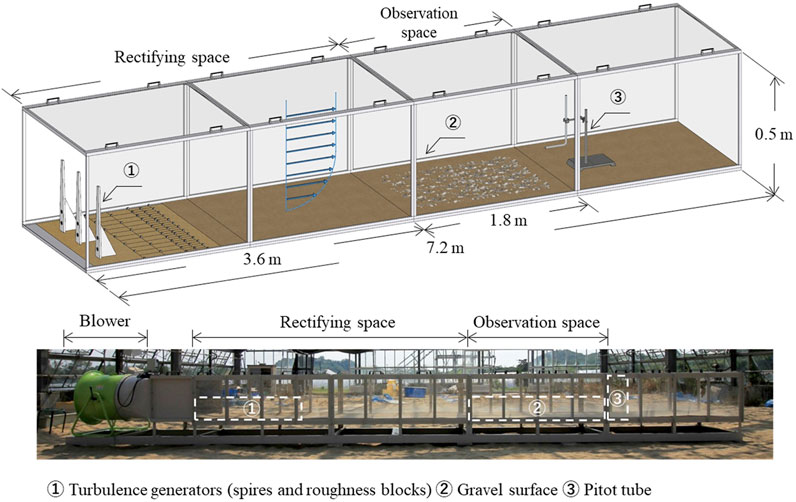
FIGURE 1. Layout of experimental setup and photograph of the wind tunnel.
To ensure experimental conditions in the wind tunnel can reasonably represent those occurring in the natural environment, we designed turbulence generators comprising spires and roughness blocks. We firstly calculated the dimensions of the triangular spires and roughness blocks based on the empirical formulas determined by Irwin (1981) (Figures 2A–C). The use of spires enabled us to generate a boundary layer. More than 90% wind-blown sand movement (mainly saltation) occurs within 30 cm of the surface (Butterfield, 1999; Shao, 2008). By modifying the width of the upper base of the spires without changing their height or base-width (Figure 2F), the wind tunnel produced a boundary layer 34 cm thick, which satisfies the requirement of greater than 30 cm. The use of modified trapezoidal spires also enabled as to achieve an increased roughness length. The wind profiles and turbulence characteristics can be adjusted by arranging the numbers of spires (Niu et al., 2017) and the spatial density of roughness blocks (Liu and Kimura, 2017b). The method was used to obtain uniform distributions of horizontal wind speed in this study (Figures 2C–E). A group of spires and roughness blocks was installed between the blower and the sand bed (Figure 2G) (Liu and Kimura, 2017a). As a result, this system generated a thick boundary layer (34 cm high) over the sand bed, a roughness length of 0.003 ± 0.0007 cm close to that of the natural field environment (Darmenova et al., 2009), and uniform distributions of horizontal wind speed over the observation space.
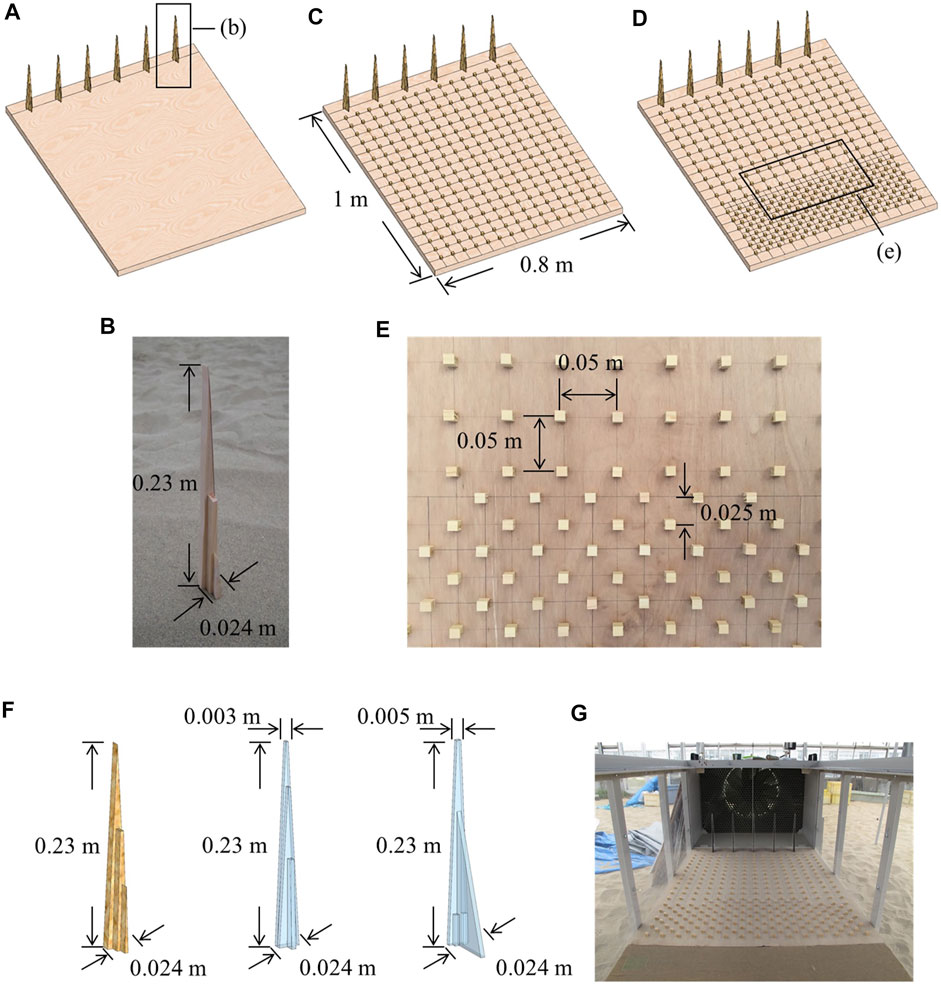
FIGURE 2. Installations of (A) spires based on the original design [see panel (B)] and (C) roughness blocks with adjustment of their spatial density [see panel (D, E)]. (F) Modification of the width of upper base of spires. (G) Photography showing the configuration of the turbulence generator.
We tested the vertical profiles of wind speeds at an incoming flow velocity of 8 m s−1 along the centerline of the wind tunnel at 0.6 m intervals from the start of the observation space (Figure 3A). Wind speed was measured with a pitot-tube anemometer (MK Scientific DT 8920) fixed on a stand. The vertical wind speed profile was measured at 2-cm intervals between 0.4 and 36 cm above the sand surface. We obtained similar logarithmic distributions of vertical speeds and relatively uniform roughness length at the four measuring points in the observation space (Figure 3B).
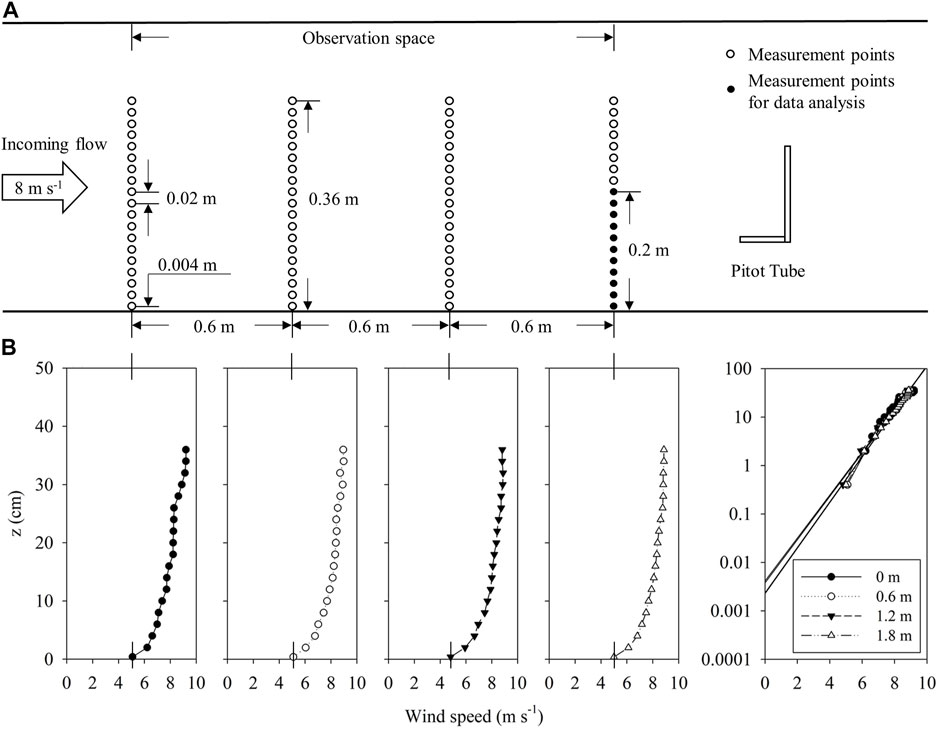
FIGURE 3. (A) Layout of the measurement point of wind speed in the wind tunnel. (B) Wind speed profiles at distances of 0, 0.6, 1.2, and 1.8 m from the start of observation space at incoming flow velocity of 8 m s−1. Wind speed measured at the end of the observation space between 0.4 and 20 cm above the surface (indicated by solid circles) was used for analyzing aerodynamic characteristics of airflow.
Measurement of Wind Speed
To measure wind-speed characteristics, the floor of the wind tunnel was covered with a wooden board coated from the rectifying space to the observation space with sand from the Tottori Sand Dune. The sand served to prevent damage to the anemometer by blown sand and to maintain a consistent surface roughness condition. The measurement of wind-speed characteristics requires the achievement of flow similarity in the wind tunnel (Jensen, 1958; Jensen and Franck, 1963), that is, the roughness parameter of the wind tunnel must be proportional to that in nature:
where
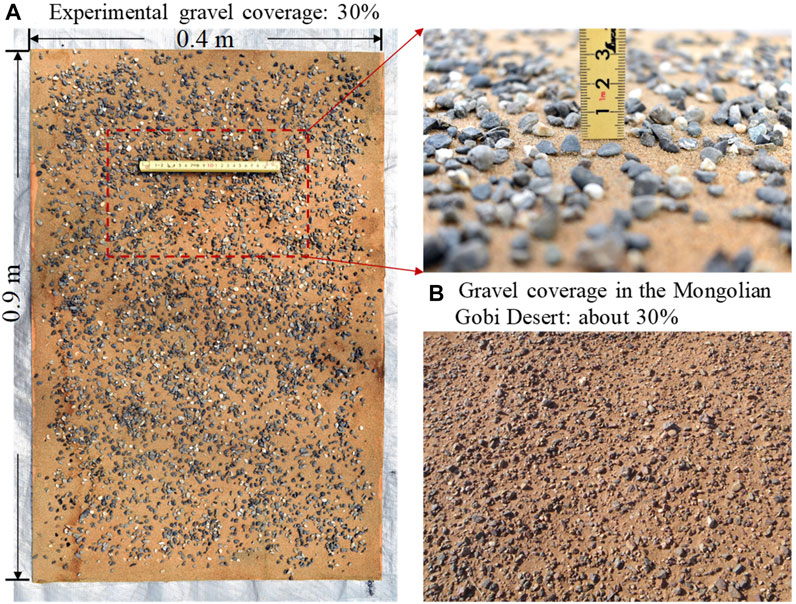
FIGURE 4. Photographs for comparison of gravel size and coverage of 30% (A) in our wind-tunnel experiments and (B) in the Mongolian Gobi Desert (Liu et al., 2020).
We made experimental runs at wind speeds (incoming flow velocities) of 6, 8, and 10 m s−1. The threshold wind speed for saltation was 6 m s−1. The wind speed profile measured by a pitot-tube anemometer between 0.4 and 20 cm above the sand surface at the downwind end of the observation space was used for analysis (Figure 3A). The pitot-tube anemometer has an accuracy of ±2.5% at wind speed of 10 m s−1. Wind speed was recorded at intervals of 1 s to a laptop connected with the device. We tested and obtained similar vertical profiles of wind speed using the average of 1-s measurements over 1, 3, 5, and 10 min. In this paper, the average of 60 readings (1-min average) was used for analysis.
The roughness length, an important parameter that affects airflow conditions, is the height at which wind speed is zero. For a homogeneous underlying surface, the roughness length can be calculated directly from observed data (Garratt, 1994). Assuming that the observed wind speed profile follows Eq. 2 under atmospheric neutral conditions, roughness length and friction velocity are determined from observed wind speed profiles by using a computerized graphical procedure based on this equation.
where
Roughness length
Drag Coefficient
The drag coefficient is defined as the surface resistance to atmospheric flow. The relationship among drag coefficient, height, and roughness length in the surface layer is given by
where
where
The variation of wind-speed gradient over gravel surfaces influences the wind-reduction effect and the inhibiting effect on blown sand flux through its impact on the structural characteristics of wind-blown sand. To quantify this variation, we used the coefficient of variation (CoV), which is a normalized measure of the dispersion of a distribution (Cosseron et al., 2013). Here, we employed CoV to evaluate the dispersion of wind speed distribution under different gravel coverages at each measured height. The coefficient of variation is defined as follows:
Here, μ is the mean of the wind speed and σ is the SD.
In the near-ground surface layer, the exchange and transmission of matter and energy are caused mainly by turbulence. This results in 80–90% of wind-blown sand particles being transported throughout this layer (e.g., Sharp, 1980). The turbulent momentum flux of each unit of time and area can be written as
where
where K is the turbulent transfer coefficient (m2 s−1), which is a physical parameter representing the capacity of the airflow to transfer momentum (Shao, 2008). The value of K can be obtained from
Results and Discussion
Drag Coefficient and Roughness Length Over Gravel Surfaces
We measured the drag coefficient
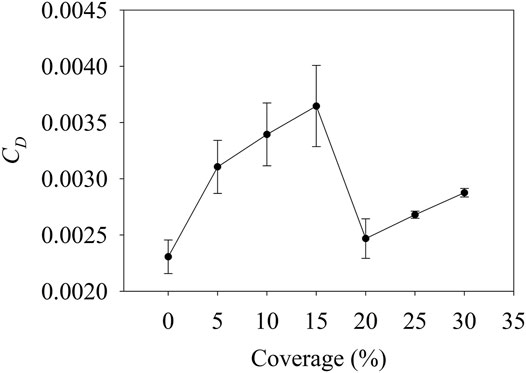
FIGURE 5. Drag coefficient
The variations in
Aerodynamically, the increase of resistance force (drag coefficient) over the gravel surface is associated with the increased surface roughness length, which increases the contact area between the ground surface and airflow. Roughness length
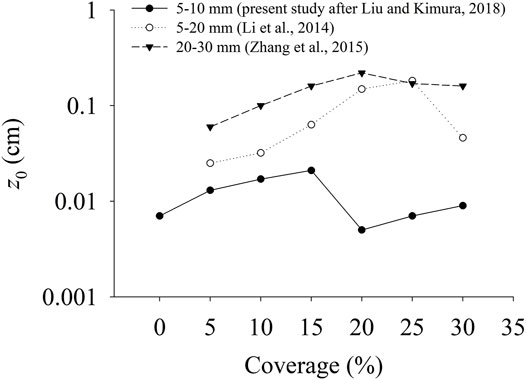
FIGURE 6. Comparison of average roughness length
Wind-Speed Gradient Over Gravel Surfaces
On a flat sand surface, the vertical wind profile increases logarithmically with increasing height. The logarithmic law was also confirmed for the vertical distribution of wind speed over gravel surfaces (Figure 7). As wind speed increased, the effect of gravel surfaces on wind profile became more obvious. At each wind speed, wind speed on the flat sand surface was larger than those over gravel surfaces at a height of 0.4 cm, showing a wind-reduction effect even over surfaces covered by pebbles. Specially, wind speed was the lowest at 15% coverage because of the greatest drag force generated by gravels and the intervening surface (Figure 5). This result indicated that gravel surface at 15% coverage had the best wind-reduction effect.
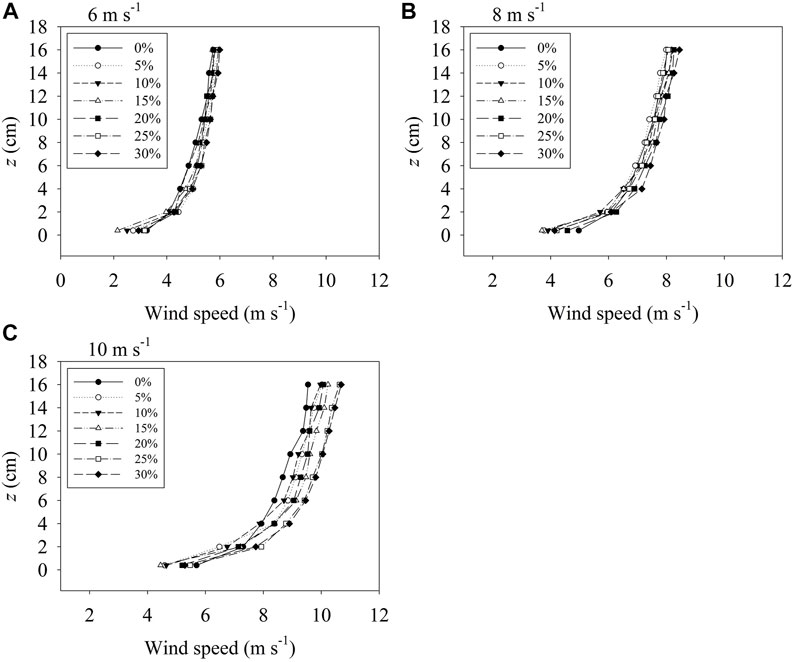
FIGURE 7. Vertical wind profiles at different gravel coverages under wind speeds of (A) 6, (B) 8, and (C) 10 m s−1.
To visualize the wind speed fluctuations more clearly, we compared variations of wind speed at different gravel coverages at each height (Figure 8). At a height of 0.4 cm, which is below the average height of the gravel, wind speed varied greatly with the increase in gravel coverage, showing an opposite trend to that of roughness length (Figure 8A). At gravel coverage of 20% and greater, wind speed tended to be uniform. At a height of 2 cm (about two to four times pebble size), the variation of wind speed differed at each wind speed but tended to stabilize at gravel coverage of 25% and greater. (Figure 8B). In contrast to the wind speed variations at heights below 4 cm, those at heights of 4 cm and above were relatively stable (Figures 8C–I).
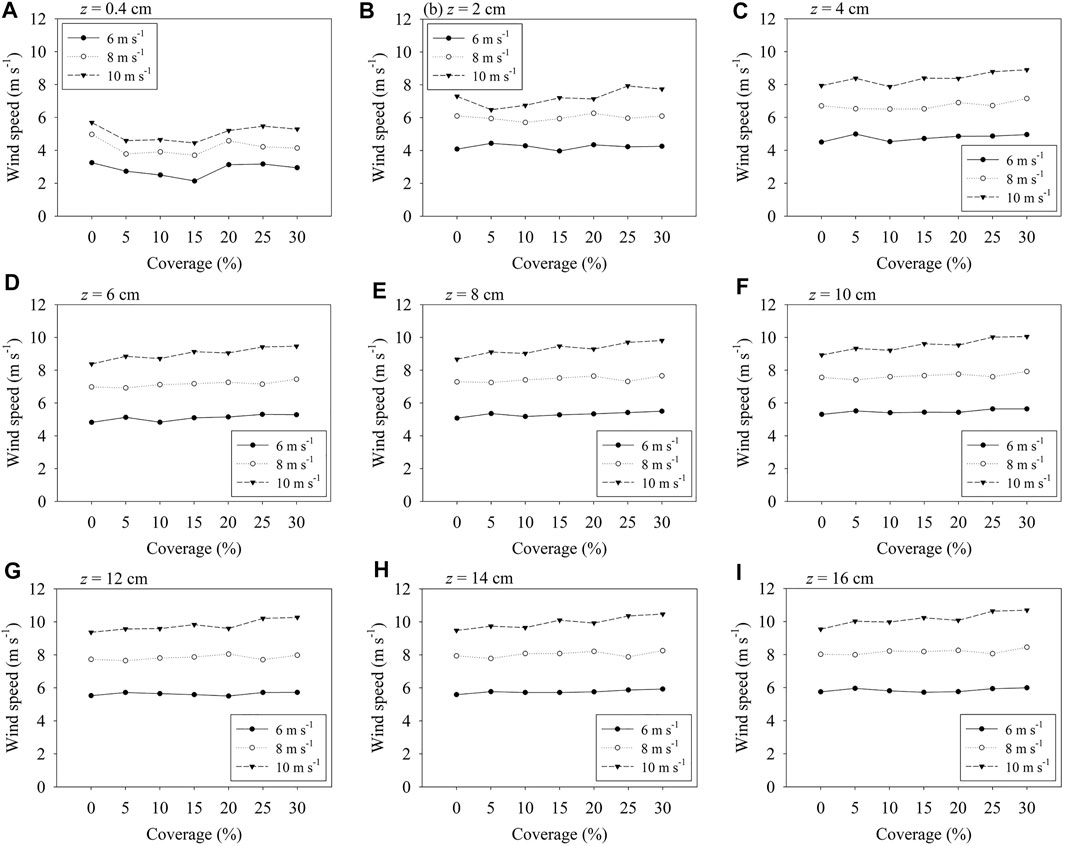
FIGURE 8. Variations in wind speed at different gravel coverages under each wind speed at heights of 0.4–16 cm.
Because of the presence of gravel, airflow near the ground surface in our compact wind tunnel was characterized by two sublayers. The layer below a height of 4 cm was defined as the roughness sublayer, in which airflow was influenced strongly by individual gravel, and the wind speed varied complexly. The layer above 4 cm was defined as the inertial sublayer, where airflow was dominated by the characteristics of the entire gravel bed, and the wind speed varied regularly with gravel coverage. Tan et al. (2012) used large pebbles (2–3 cm) at gravel coverages of 5–80% in wind-tunnel experiments and found that wind speed distribution near the ground surface can be divided clearly into two layers at the height of 2.2 cm. However, because of the different pebble sizes, wind speed decreased as coverage increased from 5 to 35% and tended to be uniform at coverages of 40–80%.
Variation in gravel surface coverage affects the characteristics of the near-ground surface wind profile and thus affects the structural characteristics of wind-blown sand flux (Wu, 1987). CoV of wind speed with gravel coverage differed with height (Figure 9). CoV values were higher in the roughness sublayer (below 4 cm), about 2.7–8.6 times those in the inertial sublayer (above 4 cm), indicating that wind-speed fluctuations are more likely to be affected by the variation in gravel coverage in the roughness sublayer. In the inertial sublayer, wind-speed fluctuation is influenced less by gravel coverage and tended to stabilize. The influence of gravel coverage on wind-speed fluctuation decreased with increasing height, showing notable differences below and above 4 cm, which is the threshold between the roughness sublayer and the inertial sublayer. At the height of 4 cm, approximate CoV values were observed under each wind speed, indicating that wind-speed fluctuation was independent of changes in gravel coverage. The threshold height of 4 cm was in accordance with that defined as the equilibrium point of vertical profiles of wind-blown sand flux over gravel surfaces in our previous study, in which characteristic of blown sand flux was independent of both wind speed and gravel coverage (Liu et al., 2020).
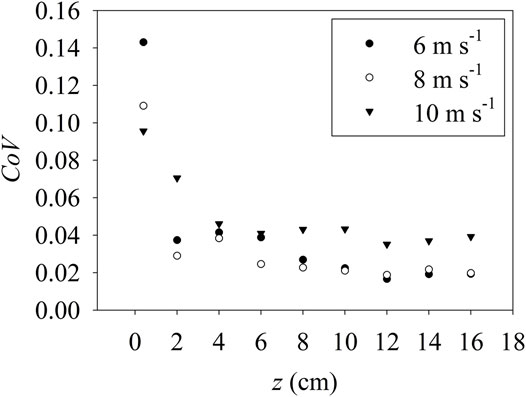
FIGURE 9. Coefficient of variation CoV of wind speed with gravel coverage for wind speeds of 6, 8, and 10 m s−1.
Turbulent Structure Over Gravel Surface
The turbulent transfer coefficient K is a parameter used to quantify the capacity of the flow to transfer momentum through turbulent mixing. To investigate the effect of fine-grained gravel surfaces on the vertical structure of turbulence, we compared the variation of K with height on the flat sand surface (0%) and over gravel surfaces with 15 and 20% coverage at wind speeds of 6, 8, and 10 m s−1 (Figure 10). Here, we discuss only those two coverages where drag coefficient (Figure 5) and roughness length (Figure 6) reached peak and dropped to the minimum. Over the flat sand surface and the fine-grained gravel surface (15 and 20% coverage), K increased with height (Figure 10), which is consistent with the observations of Stull (2012) and Lu and Dong (2006). The reason for this increase is that turbulence intensity near the ground surface was greatest because of the friction force of the ground. However, that is also the region of maximum turbulent energy dissipation. The interactions between turbulence intensity and turbulent energy dissipation resulted in a weaker energy exchange between the turbulent kinetic energy and momentum. The farther from the surface, the more effective the energy exchange was.
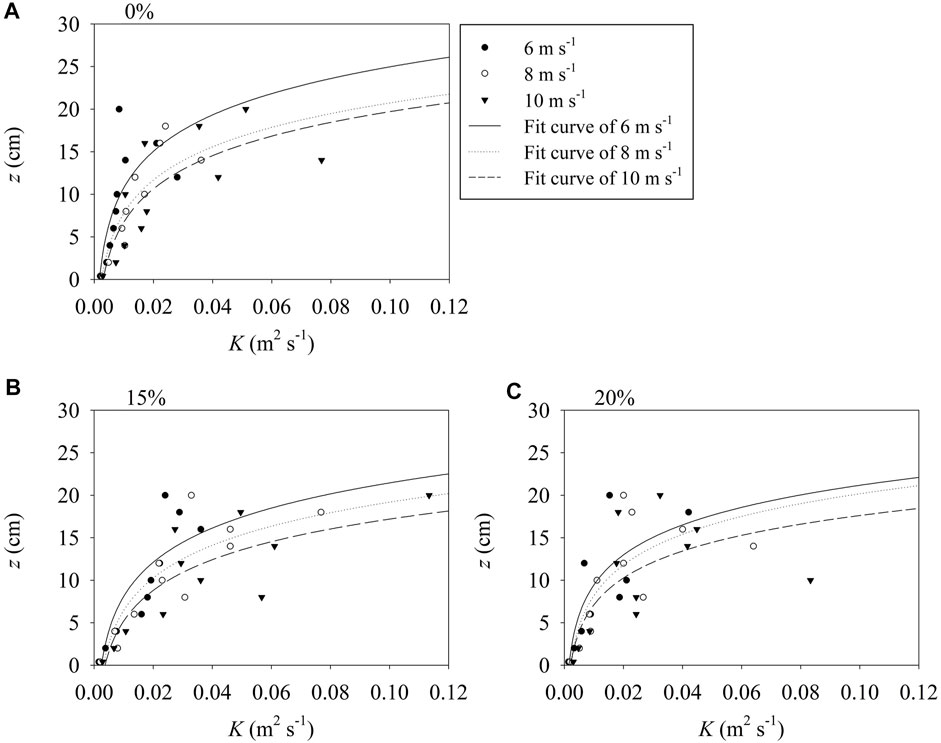
FIGURE 10. Variation of turbulent transfer coefficient K with height at gravel coverages of (A) 0%, (B) 15%, and (C) 20%.
We compared the values of K at each height for different surfaces. We found that the values of K over gravel surfaces were close to those on the sand surface, indicating that the fine-grained gravel surface has little effect on the turbulent energy exchange below 4 cm height, which corresponded to the range of roughness sublayer. Above 4 cm (i.e., inertial sublayer), values of K at gravel coverages of 15 and 20% were obviously higher at heights of 6–10 cm, reaching a maximum of about 3 times that of the flat sand surface. As height increased above 10 cm, the difference in K became smaller, while values of K over gravel surfaces were still slightly higher. Moreover, we also found that at the gravel coverage of 15 and 20%, the average values of K at heights between 6 and 10 cm are 11.8 and 9.5 times than those at 0.4 cm, respectively. The comparison results of K were consistent with the mixing length hypothesis that K is proportional to height (Shao, 2008).
Our findings show that when the roughness sublayer transited to the inertial sublayer, a region of more effective energy exchange formed at heights of 6–10 cm, which we defined as the energy-exchange region (Figure 11). We suggest that this structural characteristic helps to clarify the mechanism of wind-blown sand transport over fine gravel surfaces. During wind-blown sand transport, saltation particles are lifted a short distance above the surface and absorb kinetic energy from the airflow. When these particles hit the ground, they eject more particles into the air, initiating an increase in the number of airborne particles and hence in blown sand flux (Shao, 2008). Over gravel surfaces, saltation particles and bounced particles gain more energy when they transport through the energy-exchange region. Those saltation particles would impact the ground with an accelerating velocity and the bounced particles might be transported higher or farther. Our previous findings have demonstrated that wind-blown sand at all tested coverages of fine gravel (5–30%) maintains an erosional state (Liu et al., 2020); this result might be explained by formation of an energy-exchange region within the turbulent structure.
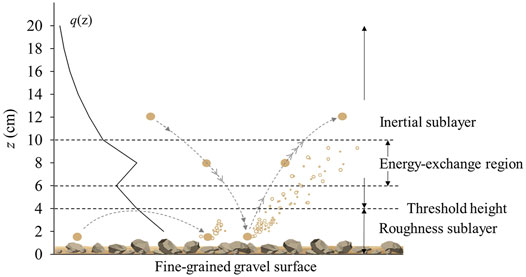
FIGURE 11. An illustration of structural characteristics of the near-surface airflow and sand particle transport in the near-ground surface layer over fine-grained gravel surface. The vertical profile of sand flux q(z) was modified from Liu and Kimura (2018).
In an investigation of vertical profiles of sand flux over fine-grained gravel surfaces, Liu and Kimura (2018) found that a strong peak in blown sand flux appeared at a height of 8 cm when gravel coverage reached 20% (Figure 12). Liu and Kimura (2018) inferred that the peak resulted from the fact that sand particles bounce higher after collisions. We found that the local maximum sand flux occurred at a height in the range of the energy-exchange region (6–10 cm) observed in the current study, where blown sand particles absorb the momentum transferred from turbulent kinetic energy. However, a local maximum blown sand flux at 8 cm was not observed for gravel coverage of 15%; the lack of this local maximum is because
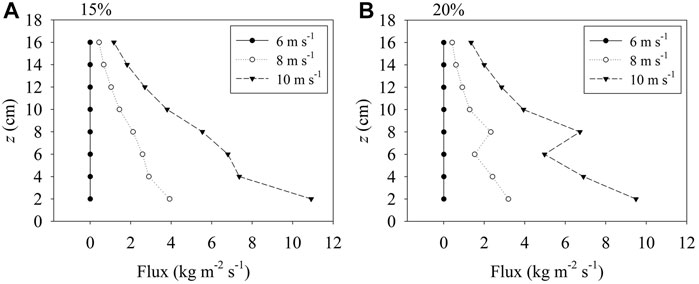
FIGURE 12. Vertical profiles of sand flux under wind speeds of 6, 8, and 10 m s−1 at gravel coverages of (A) 15 and (B) 20% [modified from Liu and Kimura (2018)].
Conclusion
In this study, we examined the effect of gravel coverage (0–30%) on the drag coefficient
1) The response of airflow to the gravel surface are characterized quantitatively by
2) The wind profile near the ground surface was divided into two layers that varied in response to the different characteristics of the wind-speed gradient with gravel coverage: the roughness sublayer below 4 cm and the inertial sublayer above 4 cm. The variation of the wind speed with gravel coverage was more complex in the roughness sublayer but was more uniform in the inertial sublayer. At the height of 4 cm, wind-speed fluctuations were independent of changes in gravel coverage under the observed wind speeds.
3) An energy-exchange region, where sand particles can absorb more energy from the surrounding airflow, might be existed between the roughness sublayer and the inertial sublayer over the fine-grained gravel surfaces. In this region, the most effective transfer of energy appeared at 15% gravel coverage, with a maximum of 3 times the value of K at the same height over the sand surface compared to that over the sand surface without gravel.
Our results provide additional information about the effect of various coverages of fine gravel on wind-speed characteristics near the ground surface. Our findings can be applied to determine the aerodynamic stability of the gobi surface and to provide a reference for elucidation of the structural characteristics of windblown sand flux. Although the wind tunnel reproduced natural surface conditions and the 34-cm boundary layer, the height of the equilibrium point and the range of the energy-exchange region between the roughness sublayer and the inertial sublayer are required to validate field observations. If these variables can be determined in wind tunnels, then we will be able to estimate the wind profile over gravel surfaces accurately and thus improve the accuracy of wind-erosion prediction models.
Data Availability Statement
The raw data supporting the conclusion of this article will be made available by the authors, without undue reservation.
Author Contributions
JL and RK contributed to conception of the start. JL and JW contributed to data analysis and wrote the first draft of the manuscript. All authors contributed to manuscript revision, read, and agreed to the published version of the manuscript.
Funding
This study was supported by Japan Society for the Promotion of Science KAKENHI Grant Numbers 19H04239 and 21K17880.
Conflict of Interest
The authors declare that the research was conducted in the absence of any commercial or financial relationships that could be construed as a potential conflict of interest.
Publisher’s Note
All claims expressed in this article are solely those of the authors and do not necessarily represent those of their affiliated organizations, or those of the publisher, the editors and the reviewers. Any product that may be evaluated in this article, or claim that may be made by its manufacturer, is not guaranteed or endorsed by the publisher.
References
Bian, H., Tie, X., Cao, J., Ying, Z., Han, S., and Xue, Y. (2011). Analysis of a Severe Dust Storm Event over China: Application of the WRF-Dust Model. Aerosol Air Qual. Res. 11 (4), 419–428. doi:10.4209/aaqr.2011.04.0053
Butterfield, G. R. (1999). Near-Bed Mass Flux Profiles in Aeolian Sand Transport: High-Resolution Measurements in a Wind Tunnel. Earth Surf. Process. Landforms 24 (5), 393–412. doi:10.1002/(sici)1096-9837(199905)24:5<393:aid-esp996>3.0.co;2-g
Cosseron, A., Gunturu, U. B., and Schlosser, C. A. (2013). Characterization of the Wind Power Resource in Europe and its Intermittency. Energ. Proced. 40, 58–66. doi:10.1016/j.egypro.2013.08.008
Darmenova, K., Sokolik, I. N., Shao, Y., Marticorena, B., and Bergametti, G. (2009). Development of a Physically Based Dust Emission Module within the Weather Research and Forecasting (WRF) Model: Assessment of Dust Emission Parameterizations and Input Parameters for Source Regions in Central and East Asia. J. Geophys. Res-Atmos. 114 (D14). doi:10.1029/2008JD011236
Dong, Z. B., Liu, X. P., and Wang, X. M. (2002a). Aerodynamic Roughness of Gravel Surfaces. Geomorphology 43 (1-2), 17–31. doi:10.1016/S0169-555x(01)00097-6
Dong, Z., Qu, J., Liu, X., Zhang, W., and Wang, X. (2002b). Experimental Investigation of Drag Coefficients of Gobi Surfaces. Sci. China Ser. D-earth Sci. 45 (7), 609–615. doi:10.1360/02yd9062
Frank, A., and Kocurek, G. (1994). Effects of Atmospheric Conditions on Wind Profiles and Aeolian Sand Transport with an Example from white Sands National monument. Earth Surf. Process. Landforms 19 (8), 735–745. doi:10.1002/esp.3290190806
Garratt, J. R. (1994). The Atmospheric Boundary-Layer - Review. Earth-sci. Rev. 37 (1-2), 89–134. doi:10.1016/0012-8252(94)90026-4
Irwin, H. P. A. H. (1981). The Design of Spires for Wind Simulation. J. Wind Eng. Ind. Aerodyn. 7 (3), 361–366. doi:10.1016/0167-6105(81)90058-1
Jensen, M., and Franck, N. (1963). Model-scale Tests in Turbulent Wind: Part 2. Copenhagen: Danish Technical Press.
Lee, B. E., and Soliman, B. F. (1977). An Investigation of the Forces on Three Dimensional bluff Bodies in Rough wall Turbulent Boundary Layers. J. Fluids Eng. 99 (3), 503–509. doi:10.1115/1.3448828
Li, G. S., Qu, J. J., Li, X. Z., and Wang, W. F. (2014). The Sand-Deposition Impact of Artificial Gravel Beds on the protection of the Mogao Grottoes. Sci. Rep. 4 (1), 4341–4348. ARTN 434110. doi:10.1038/srep04341
Liu, J. Q., and Kimura, R. (2017a). Development of a Method to Make a Boundary Layer with Roughness Length Close to Natural Conditions in a Simple Wind Tunnel. Sand Dune Res. (64), 1–8.
Liu, J. Q., and Kimura, R. (2017b). Study on the Boundary Layer Formation of a Small Simple Type Wind Tunnel. Sand Dune Res. 63 (3), 113–119.
Liu, J., and Kimura, R. (2018). Wind Speed Characteristics and Blown Sand Flux over a Gravel Surface in a Compact Wind Tunnel. Aeolian Res. 35, 39–46. doi:10.1016/j.aeolia.2018.09.005
Liu, J., Kimura, R., and Wu, J. (2020). Vertical Profiles of Wind-Blown Sand Flux over fine Gravel Surfaces and Their Implications for Field Observation in Arid Regions. Atmosphere 11 (10), 1029. doi:10.3390/atmos11101029
Lü, P., and Dong, Z. (2006). Wind Tunnel Experiments on the Turbulent Transmission over the Near Surface Layer of Different Surfaces. Environ. Geol. 50 (7), 983–988. doi:10.1007/s00254-006-0267-4
Marshall, J. K. (1971). Drag Measurements in Roughness Arrays of Varying Density and Distribution. Agric. Meteorol. 8, 269–292. doi:10.1016/0002-1571(71)90116-6
Marticorena, B., Bergametti, G., Gillette, D., and Belnap, J. (1997). Factors Controlling Threshold Friction Velocity in Semiarid and Arid Areas of the United States. J. Geophys. Res. 102 (D19), 23277–23287. doi:10.1029/97jd01303
Niu, J.-q., Zhou, D., and Liang, X.-f. (2017). Experimental Research on the Aerodynamic Characteristics of a High-Speed Train under Different Turbulence Conditions. Exp. Therm. Fluid Sci. 80, 117–125. doi:10.1016/j.expthermflusci.2016.08.014
Raupach, M. R. (1992). Drag and Drag Partition on Rough Surfaces. Boundary-layer Meteorol. 60 (4), 375–395. doi:10.1007/Bf00155203
Shao, Y. P. (2008). Physics and Modelling of Wind Erosion, 37. Dordrecht: Springer Science & Business Media.
Sharp, R. P. (1980). Wind-driven Sand in Coachella Valley, California: Further Data. Geol. Soc. America Bull. 91 (12), 7242–7730. doi:10.1130/0016-7606(1980)91<724:wsicvc>2.0.co;2
Stull, R. B. (2012). An Introduction to Boundary Layer Meteorology, 13. Dordrecht: Springer Science & Business Media.
Tan, L. H., Zhang, W. M., An, Z. S., and Li, J. G. (2012). Response of Wind Velocity Gradient at Boundary Layer to Gravel Coverage. J. Desert Res. (6), 3.
Tan, L., Zhang, W., Liu, B., An, Z., and Li, J. (2013). Simulation of Wind Velocity Reduction Effect of Gravel Beds in a mobile Wind Tunnel Atop the Mogao Grottoes of Dunhuang, China. Eng. Geology. 159, 67–75. doi:10.1016/j.enggeo.2013.03.015
Zhang, W., Tan, L., Zhang, G., Qiu, F., and Zhan, H. (2014). Aeolian Processes over Gravel Beds: Field Wind Tunnel Simulation and its Application Atop the Mogao Grottoes, China. Aeolian Res. 15, 335–344. doi:10.1016/j.aeolia.2014.07.001
Keywords: arid regions, drag coefficient, gravel coverage, turbulent transfer coefficient, wind-speed gradient
Citation: Liu J, Kimura R and Wu J (2021) Aerodynamic Characteristics Over Fine-Grained Gravel Surfaces in a Wind Tunnel. Front. Earth Sci. 9:758910. doi: 10.3389/feart.2021.758910
Received: 21 September 2021; Accepted: 04 November 2021;
Published: 23 November 2021.
Edited by:
Liguang Wu, Fudan University, ChinaReviewed by:
Jiqiang Niu, Southwest Jiaotong University, ChinaQingyuan Liu, Chinese Academy of Meteorological Sciences, China
Copyright © 2021 Liu, Kimura and Wu. This is an open-access article distributed under the terms of the Creative Commons Attribution License (CC BY). The use, distribution or reproduction in other forums is permitted, provided the original author(s) and the copyright owner(s) are credited and that the original publication in this journal is cited, in accordance with accepted academic practice. No use, distribution or reproduction is permitted which does not comply with these terms.
*Correspondence: Jiaqi Liu, cnl1dTczMUB0b3R0b3JpLXUuYWMuanA=