 Viviane Souty
  Audrey Gailler
- CEA, DAM, DIF, Bruyères-le-Châtel, France
Probabilistic Tsunami Hazard Assessment (PTHA) is a fundamental framework for producing time-independent forecasts of tsunami hazards at the coast, taking into account local to distant tsunamigenic earthquake sources. If high resolution bathymetry and topography data at the shoreline are available, local tsunami inundation models can be computed to identify the highest risk areas and derive evidence-based evacuation plans to improve community safety. We propose a fast high-resolution Seismic-PTHA approach to estimate the tsunami hazard at a coastal level using the Bay of Cannes as test site. The S-PTHA process is firstly fastened by performing seismic and tsunami hazards separately to allow for quick updates, either from seismic rates by adding new earthquakes, or from tsunami hazard by adding new scenarios of tsunamis. Furthermore, significant tsunamis are selected on the basis of the extrapolation of a tsunami amplitude collected offshore from low-resolution simulations to an a priori amplitude nearshore using Green’s law. This allows a saving in computation time on high-resolution simulations of almost 85%. The S-PTHA performed in the Bay of Cannes exhibits maximum expected tsunami waves that do not exceed 1 m in a 2500-year period, except in some particular places such as the Old Port of Cannes. However, the probability to experience wave heights of 30 cm in this same period exceeds 50% along the main beach of Cannes and these results need to be considered in risk mitigation plans given the high touristic attraction of the area, especially in summer times.
1 Introduction
The determination of the tsunami hazard is a key challenge worldwide, since the major tsunamigenic earthquakes at Sumatra in December 2004 and Tohoku in March 2011. The Sumatra tsunami is known as the deadliest one within living memory (death toll of 250,000–300,000; Okal, 2011). The failure to warn is essentially due to a deficiency of communication and is partly responsible for the high number of causualities (Okal, 2011). The 2011 Tohoku tsunami caused a great deal of attention, strengthened by the Fukushima Nuclear Power Plant accident. The reactors were stopped after the
Moreover, the above examples also highlight that the management of the tsunami hazard must be done dealing with two timescales. The warning timescale starts with a triggering event in real time such as an earthquake. The historical timescale studies past events to extrapolate to future events. For instance, the operating procedure at warning time scale can be based on a decision matrix, which defines the alert level (e.g., Schindelé et al., 2015). The Deterministic Tsunami Hazard Assessment or the Probabilistic Tsunami Hazard Assessment (PTHA), on the other hand, are two approaches that are usually conducted, at historical scale, for prevention purposes. The Deterministic Tsunami Hazard Assessment appears as the most conservative approach and is used in most of the forecasting tools in operational context. The results obtained merely account for the effects of the worst probable scenario on a few points of interest (POI, e.g., TANDEM, 2020) and do not consider smallest events that could also be significant, especially since they are more frequent. On the contrary, PTHA aggregates numerous scenarios in order to account for a range of tsunami sources as wide as possible (location, intensity, geometry, temporality). The resulting products allow identifying the most affected areas with recurrence possibilities. Then, PTHA provides key outcomes for long-term coastal management (Behrens et al., 2021). Furthermore, in the case of near-field triggering tsunamis that would reach the closest coasts within a few minutes, the real-time warning process is not always fast enough (e.g., Park et al., 2018) even so efforts are made to improve the speed of real-time forecast (e.g., Giles et al., 2021b; Selva et al., 2021). In this particular case, the disaggregation allows to ascertain the most dangerous tsunamigenic sources for a given area considering that the catalogs of seismicity is quite complete. PTHA studies performed using efficient numerical inundation simulations also provide a key upstream complementary information for site-specific hazard assessment (e.g., Gibbons et al., 2020) and evacuation planning (Tonini et al., 2021).
Tsunamis of seismic origin that can spread throughout the Western Mediterranean (WM) basin are not as large, nor as destructive as tsunamis that can be triggered by megathrust earthquakes originated along the subduction zone of the Pacific Rim. The seismicity within the WM can be considered as moderate, and quantifying the associated tsunami hazards remains a key point for planning of integrated community-level preparedness. Some historical earthquakes, indeed, have generated tsunamis with wave heights exceeding 1 m nearshore (Figure 1A). The Imperia earthquake (Mw 6.3–7.5, Italy) of the February 23, 1887 is one of these tsunamigenic-earthquakes and generated waves reaching heights between 1 and 2 m at Cannes and Antibes cities (France, e.g., Eva and Rabinovich, 1997; Larroque et al., 2012). The Boumerdes-Zemmouri tsunamigenic-earthquake (Mw 6.9, Algeria) in the night of the May 21, 2003 induced a rapid draw-down (−1.5 m) along the French Riviera coastlines (e.g., Sahal et al., 2009). This draw-down was accompanied by strong currents and eddies in several harbours, including the Old Port of Cannes. In both cases, the tsunami fortunately did not occur when beaches and harbours were crowed (e.g., summer day-time).
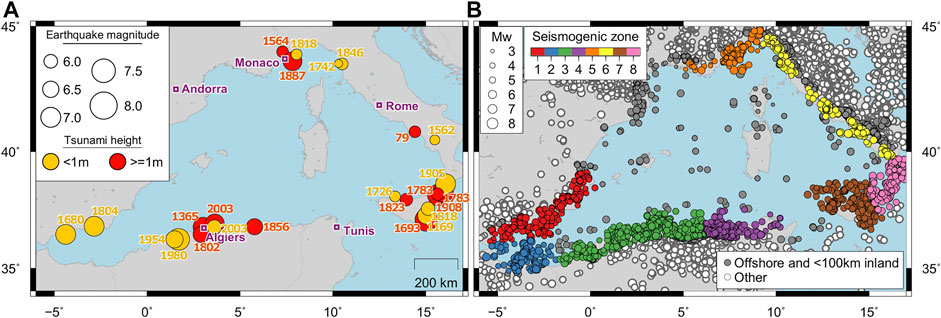
FIGURE 1. (A) Historical tsunamigenic seismicity in the WM basin. Adapted from Figure 1 in Gailler et al. (2013). (B) Repartition of the earthquakes
Since the 2010s, several PTHA studies aiming at constraining the tsunami hazard along the European coastlines can be cited. Most of them simulate tsunamis of seismic origin using a quite coarse long-wave model to extract a Peak Offshore Tsunami Amplitude (POTA), often located at a water depth between 50 and 100 m. Then, the Green’s law (Green, 1838) is used to extrapolate the POTA close to the shore, usually around 1 m (e.g., Selva et al., 2016; Grezio et al., 2020; Selva et al., 2021). The extrapolated value expresses the Peak Coastal Tsunami Amplitude (PCTA). Sørensen et al. (2012) quantify the tsunami hazard due to earthquakes in the Mediterranean Sea this way by building numerous synthetic catalogues based on seismic rates in order to process the PTHA. Lorito et al. (2015) perform a linear approximation of the tsunami propagation in order to build a preliminary S-PTHA. They apply then a two-stage filter to reduce the number of significant sources and then perform non-linear tsunami propagation using the selected sources. A recent regional project, the TSUMAPS-NEAM updates tsunami hazard outcomes along the European coastlines (e.g., Basili et al., 2018; Basili et al., 2021). The POTAs are here extrapolated to PCTAs, using an amplification factor that depends on the POI and the tsunami period (Glimsdal et al., 2019).
These studies relying on S-PTHA use regional approaches, meaning that POTAs are extracted from low resolution simulations throughout the basin thereby reducing the computational cost. The PCTAs are then obtained from empirical amplification laws, that unfortunately results in estimates of wave heights at the coast within a factor of 2 at best (e.g., Gailler et al., 2018), partly because local effects are not taken into account (i.e., resonance in harbours and bays) and there is no distinction between direct and reflected waves. The estimates obtained from the extrapolation of a POTA are therefore a good approximation when used for warning scale forecasting (e.g., Selva et al., 2021). Besides, with such approaches based on amplification laws, the horizontal inundation and the currents are missing. In order to overcome these gaps, recent papers propose a high-resolution S-PTHA with a pre-selection of significant scenarios to simulate inundations at specific coastal sites efficiently (Volpe et al., 2019; Gibbons et al., 2020). Such local S-PTHA compared to more conservative approaches underlines the importance to perform local studies using the proper level of data resolution, to best serve specific risk mitigation actions, without neglecting the quantification of epistemic uncertainties (Tonini et al., 2021).
The aim of this study is to develop an efficient high-resolution S-PTHA proof of concept with sensitivity study to quantify the tsunami hazard associated with earthquakes, based on the a priori knowledge provided by the active fault database of the French tsunami warning center (CENALT). The method will then be operable into any area providing the data availability. The Bay of Cannes (France) is selected as a test case, because this region can be threatened by tsunamis and hosts many inhabitants and tourists. Moreover, Cannes is not a targeted POI in the TSUMAPS-NEAM project despite the historical events such as 1887 Imperia and 2003 Boumerdes earthquakes, whose tsunamis effects were observed at Cannes (e.g., Sahal et al., 2009; Larroque et al., 2012).
A classical S-PTHA scheme is used to design the method (e.g., Grezio et al., 2012; Sørensen et al., 2012; Grezio et al., 2017; Glimsdal et al., 2019; Behrens et al., 2021). The annual probability of the triggering-event is given to the induced tsunami. The effects of the tsunami, i.e., the PCTA, are aggregated with those of other tsunamis and weighted by the annual probability of the triggering-event. The PCTAs are directly extracted from high-resolution simulations (down to 10 m space step accuracy at the coastal level) instead of being extrapolated from POTAs. A selection of the significant tsunami is therefore necessary in order to reduce the computational time.
In this paper, we first present the details of the method, organized such that the seismic rates (Section 2.1) and the tsunami hazard (Section 2.2) are treated independently to perform a fast high-resolution S-PTHA. Especially, we propose a selection of significant tsunamis for which the high-resolution simulations are required (Section 2.2.2). Moreover, a sensitivity study is performed on various epistemic and aleatory uncertainties due to input data and methods, analysed all along the process (Section 2.4). We then show the results of the method applied to the Bay of Cannes (Section 3.2). Finally we discuss the uncertainties and the sensitivity regarding the seismic and tsunami hazards (Sections 4.2, 4.3) and summarize the main outcomes in Section 5.
2 Materials and Methods
2.1 Seismic Rates
2.1.1 Seismogenic Zones
The occurrence of earthquakes depends on the seismotectonic context (e.g., the Sicily region triggers more earthquakes and stronger earthquakes than the Ligurian region). In this study, the WM basin is split into sub-regions depending on their seismic regime in order to determine with higher accuracy the annual rates of earthquakes. These zones are thus defined consistently with the seismic rate and the faulting regime of each region. We choose to follow the partition proposed by Sørensen et al. (2012), where the WM basin is split into eight seismogenic zones (Figure 1B) small enough to represent areas of homogeneous activity (rates and faulting regime) and large enough to contain sufficient earthquakes to characterize the activity (i.e., to build a distribution law).
2.1.2 Earthquake Catalogues Used
Several earthquake catalogues are available, such as the USGS or EMSC ones (European-Mediterranean Seismological Centre, 2020; U.S. Geological Survey, 2020). They are large databases that concatenate earthquake records from several institutes throughout the world and use various magnitude estimates (moment magnitude, body wave magnitude, surface wave magnitude, local magnitude…). These catalogues mostly cover instrumental earthquakes (since ∼1960). Larger and less frequent earthquakes might not have occurred during this instrumental period, creating a temporal incompleteness.
Compiled catalogues such as FCAT-17 (France) and SHARE (Europe) contain historical events directly giving the moment magnitude (Grünthal and Wahlström, 2012; Giardini et al., 2013; Grünthal et al., 2013; Stucchi et al., 2013; Manchuel et al., 2018). The FCAT-17 and SHARE catalogues are not sufficient either, since the records stop in 2009 and 2006, respectively. The occurrence of strong earthquakes during the remaining period until now might also lead to temporal incompleteness. In this study, additional earthquake datasets are also synchronized in order to overcome this drawback and constrain the seismic rates as best as possible (i.e., Table 1).
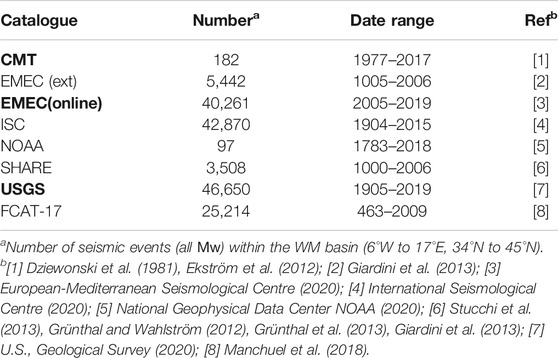
TABLE 1. Earthquake catalogues of reference. Catalogues in bold record only instrumental earthquakes.
The completeness of the resultant catalogue (time, magnitude and space) must still be carefully considered. For instance, the moment magnitude is rarely estimated for the smallest earthquakes. Also, the moment magnitude of historical earthquakes is mostly derived from macro-seismicity by experts and the date and time of the historical earthquakes can be slightly inaccurate. The date-and-time accuracy, fortunately, does not have a heavy influence on the results because annual rates are needed at a long time scale (>100 y).
2.1.3 Magnitude Conversion
The moment magnitudes
2.1.4 Synchronization of the Earthquake Catalogues
This study requires building a recent and complete earthquake catalogue for the WM basin. Thus, earthquakes records were downloaded from several databases up to the December 31, 2018 (Table 1) in order to synchronize them as best as possible. A crude concatenation of the catalogs is first performed, keeping the earthquakes that are located in the WM basin (6°W—17°E, 34°N—45°N) and recorded using the moment magnitude. At this step of the process, the whole magnitude range is kept in order to have truthful distributions.
The transition from a fragile stress regime (upper crust) to a ductile regime (lower crust) enables the removal of deep earthquakes, as they cannot activate a large enough vertical motion of the water column. We assume this transition at 100 km, taking into account a potential error on the earthquake depths provided by the catalogues. Thus, earthquakes deeper than 100 km are considered as non-tsunamigenic and are ignored. In addition, in accordance with the WM basin decision matrix for tsunami warning, earthquakes located farther than 100 km inland are also ignored (Schindelé et al., 2015; Figure 1B).
Finally, earthquakes closer than 60 s in time and 10 km in distance are considered as replicated records. They are mainly due to duplicates between catalogues and are automatically removed, followed by a manual selection refinement. The automatic deletion of the duplicates might also remove some aftershocks despite the fact we want to keep them. Indeed, the strongest aftershocks can also trigger tsunamis and need to be taken into account for the determination of the seismic rates. The resultant catalogue records 5,015 earthquakes spreading from 1048 A.D. to 2018 (see also the supplementary materials). Among them only 73 earthquakes have a
2.1.5 Determination of the Seismic Rates
The earthquake magnitude and occurrence are constrained by the tectonic settings. Furthermore, the aftershocks are strongly correlated to their main-shock. The use of a time-dependent approach would have been appropriate to determine the seismic rates. However, the speed of execution being a key factor in this study, the choice was made to handle all earthquakes as random Poissonian processes.
Then, we assume that the cumulative distribution of the earthquake magnitudes within a seismogenic zone follows a Gutenberg-Richter law and can be expressed, for the magnitude M, in terms of the annual rate λM, by
where
The establishment of seismic monitoring networks on one hand, and the improvement of instruments and methods on the other hand, make possible the detection of smaller earthquakes, lowering the magnitude of completeness of the more recent periods. The magnitude of completeness is then a key parameter because it sets up the magnitude for which we are confident to count every earthquake that actually occurred. The magnitude of completeness corresponds to an earthquake detection threshold and depends on the period of observation and the location. The magnitude of completeness of a period of observation can be determined using 1) the Maximum Curvature method (MAXC, Woessner and Wiemer, 2005), 2) the Goodness of Fit method (GFT, Wiemer and Wyss, 2000), 3) the b-value stability method (MBS, Woessner and Wiemer, 2005; Cao and Gao, 2002), applied with the stability criterion of Shi and Bolt (1982) and 4) the Stepp’s method (Stepp, 1972). All these methods were performed for each seismogenic zone and yield to similar or different results depending on the selected datasets and the values used for the
The method of Weichert (1980) is used to determine the coefficient values of the annual rate expression (Eq. 1) and is based on the maximum likelihood. This method includes seismic rates determined for periods of time that depend on the magnitude such that:
where ti is the period of completeness of the magnitude Mi (M ∈ [Mi − δ; Mi + δ]) with ni events and N the number of all events (N = ∑ni). The β value is found by iterations. Weichert’s method then allows to determine accurate seismic rates even if the historical period is less documented than the instrumental period.
The time and magnitude steps in this study are fixed to 1 year and 0.2, respectively. The method to determine the magnitude of completeness is chosen for each seismogenic zone, such as the annual rates from Weichert’s method fit the data at best (Figure 2A). The distribution laws obtained varies depending on the seismogenic zone (Figure 2B). The North Algerian zone presents the highest annual rates, while the Ligurian coast have the lowest rates. These various distributions reflect well the necessity of processing by seismogenic zone.
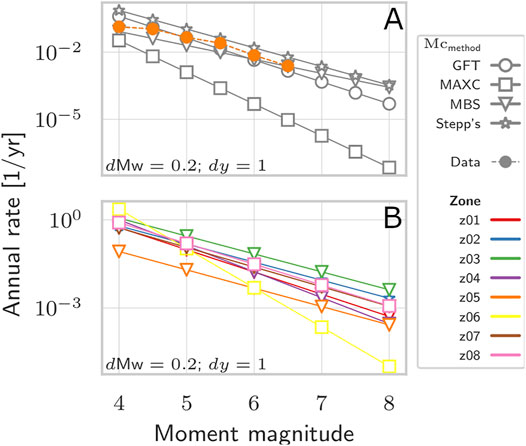
FIGURE 2. Distribution law per seismogenic zone. (A) Comparison of the law of distributions obtained using earthquakes that occured within the Ligurian Coast seismogenic zone (z05), using a 0.2 magnitude step
2.2 Tsunami Hazard
2.2.1 Rupture Scenarios
The fault database of the French Tsunami Warning Center (CENALT) is used to build a catalogue of ruptures at the scale of the WM basin. The database consists in a unit source function system which follows the major structural trends of the seismogenic context of the WM basin (Gailler et al., 2013). To be conservative, the top of all faults in the database reach the seafloor. The length, width, slip and rigidity of each unit segment are set constant (respectively 25 km, 20 km, 1 m, and 35 GPa. For instance, the rupture of a unit source generates a
One or several unit sources can be combined linearly to build a rupture of any moment magnitude
Following the WM decision matrix used in operational context, an earthquake between
The construction of the rupture scenarios is conducted only one time independently of the ROI. From the 1457 unit sources of the CENALT database located inside or closer than 30 km from the seismogenic zones of Sørensen et al. (2012), 15,503 rupture scenarios with
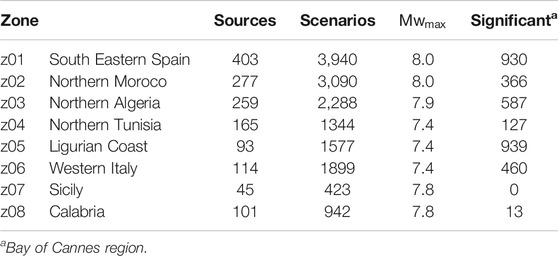
TABLE 2. Number of unit sources and scenarii per seismogenic zone. The number of significant tsunamis are given for the Bay of Cannes region (gr03, Figure 3).
2.2.2 Tsunami Simulations
The objective of our method is to generate a S-PTHA down to the coastal level. The ROI of the S-PTHA is then smaller than the region of the likely sources of tsunamis (Figure 3). For instance, we use a ten-metre resolution topo-bathymetry grid focused on the Bay of Cannes (spreading over 14.8 × 9.8 km2), which was built thanks to the Digital Elevation Models produced within the Litto3d® program.
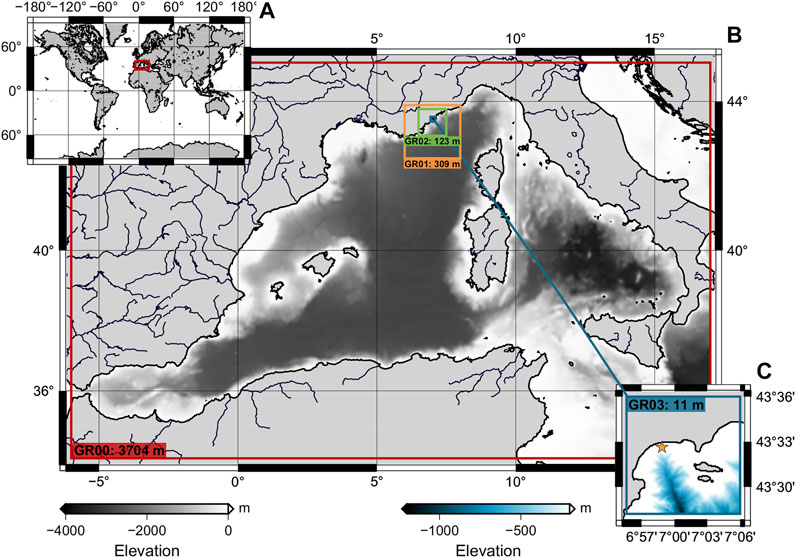
FIGURE 3. Nested grids for high resolution simulations of the tsunami down to the Bay of Cannes. (A) GR00 location (red). (B) Seismic ROI within GR00 boundaries. (C) PTHA ROI within GR03 boundaries (blue). GR00: 691 × 331 nodes, 1.8 Mb. GR01: 721 × 505 nodes, 2.8 Mb. GR02: 901 × 631 nodes, 4.4 Mb. GR03: 1731 × 1301 nodes, 18 Mb. The yellow star, in GR03, shows the location of POTA to estimate
The high-resolution nested grids tsunami simulations are performed with TAITOKO, the code developed at CEA which solves the shallow water equations from rupture properties (Heinrich et al., 2021, CEA). TAITOKO is there set to use a Runge-Kutta scheme, with second order in time and first order in space. The high-resolution simulations are performed using 4 nested grids from 2 min resolution at basin scale to 10 m space step at the local scale (Figure 3). Running more than 15,000 scenarios this way is expensive in term of computational time. So the choice is made to optimize each simulation duration ts as best as possible, taking as reference the Estimated Time Arrival (ETA) of the first wave (obtained using the program TTT from Geoware (GEOWARE, 2007)) plus 30 min. This limitation using the ETA preserves digital artefacts related to the propagation scheme which is robust for earlier waves. More performance schemes exist, but they head to a high increase of the computational time while speed is demanded. This choice implies that maximum wave heights information is only retrieved for the first waves. With the same aim of saving calculation time, the number of high-resolution runs to perform is also reduced by selecting scenarios able to produced a minimum wave height threshold in the bay of Cannes at least. To achieve this, the tsunami simulation for each rupture scenario is first performed in the coarse grid (basin scale, low-resolution) only, in order to collect a POTA where the water depth is about 100 m. The POI offshore is located 6.981031° E; 43.543846° N in the Bay of Cannes, with a depth of 94 m (Yellow star, Figure 3). Second, the Green’s law (Green, 1838) is used to extrapolate each POTA
where
Following the threshold chosen, 22.1% of the 15,503 tsunami scenarios are significant for the Bay of Cannes, matching with 17.6% of the number of hours of tsunami propagation to simulate (Table 2). About 75% of the computational time can subsequently be saved thanks to this selection process of significant tsunami scenarios (Supplementary Figure S1).
2.3 Probabilistic Tsunami Hazard Assessment
2.3.1 Scenario Probability
Synchronized earthquakes are extrapolated to future events over a period of observation by using a distribution law per seismogenic zone (Figure 2B). The extrapolation of the earthquake catalogue to a rupture catalogue spreading over a larger period of observation is made exhaustive. This means that the rupture catalogue is built such that all the
where
2.3.2 Aggregation
The tsunami hazard is obtained by the aggregation of the seismic rates and the PCTAs. The annual probability of a scenario, as given by Eq. 4, is applied to each PCTA of the scenario. The annual probability Ps,h of exceedance of a PCTA, h, at a place s along the coastline, is then estimated by the union of all probabilities of scenarios that can produce a PCTA equal to or greater than h at this place s:
and the probability
2.4 Sensitivity Analyses
Sensitivity analyses were performed in order to determine which parameters influence the most 1) the distribution law determination and 2) which rupture parameters influence the most the PCTAs. In both cases, the Morris’ algorithm (Morris, 1991; Campolongo et al., 2007) is chosen rather than the Sobol’s one (Sobol, 2001). Some parameters sets do not allow determining the parameters of the distribution law using the available earthquakes records. Then, the features cannot be distributed to fulfill the Sobol’s algorithm requirements. The rupture parameters cannot satisfy the required distribution of the Sobol’s feature either because they are constrained by the fault system.
2.4.1 Seismic Rates
The features, that are tested, to perform the sensitivity analysis on the distribution law are.
• the method to determine the magnitude of completeness
• the magnitude interval
• the period interval dy,
• the error on the moment magnitude dm,
• the turning year ti between historical and instrumental records
• the number of earthquakes Neq randomly chosen in the earthquake catalogue (keeping at least 90% of the records).
The Neq parameter is set up to mimic the incompleteness we can have in the catalogue. The effect of the random selection of the earthquakes within the records is also tested. The sensitivity analysis is performed on the parameters β, λ0 and M0 of the distribution law (Eq. 1) and on the annual rate of given magnitudes.
2.4.2 PCTAs
The sensitivity on the PCTAs is analyzed by using the high-resolution simulations. Then, the Morris’ sensitivity analysis tested the features of the rupture scenarios such as their location depending on the coastal POIs (distance and azimuth), the geometry of the rupture (strike, dip, rake angle), the size of the rupture (surface) and the slip of the rupture. The depth of the rupture is not part of the sensitivity analysis as the simulations consider faults reaching the sea floor.
3 Results
The method described above is applied to obtain a high-resolution ( ∼10 m) S-PTHA in the Bay of Cannes. Sixteen representative POIs are selected along the shoreline (Figure 4) to ease the analysis and the discussion about the deaggregation (Figure 9) and the sensitivity analysis of the PCTA (Figure 6).
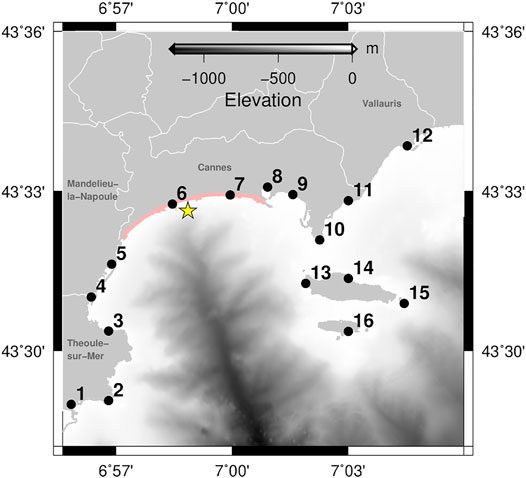
FIGURE 4. Location of the POIs used for the deaggregation and the sensitivity analyses. Yellow star: location of the POTA. Pink line: Boulevard du Midi Louise Moreau at Cannes. White lines inland: city boundaries.
3.1 Sensitivity Analyses
3.1.1 Annual Rates
We performed a sensitivity analysis for the distribution law within the North Algerian (z03) and Ligurian (z05) seismogenic zones (Figure 5). The random selection of the earthquakes itself has no effect on the results, only the number of earthquakes to be selected influences the results. The results of the analysis vary between the two seismogenic zones, but they highlight several common conclusions. The choice of the method to determine the magnitude of completeness is the key parameter (Figures 5A,B), while other parameters have minor effects on the distribution laws when using MAXC and MBS methods (Figures 5C,D). Then, the parameters to determine the distribution law can be set constant and the best distribution can be found by only testing the various methods to find the magnitude of completeness. The results also support the non-linearity of the distribution law.
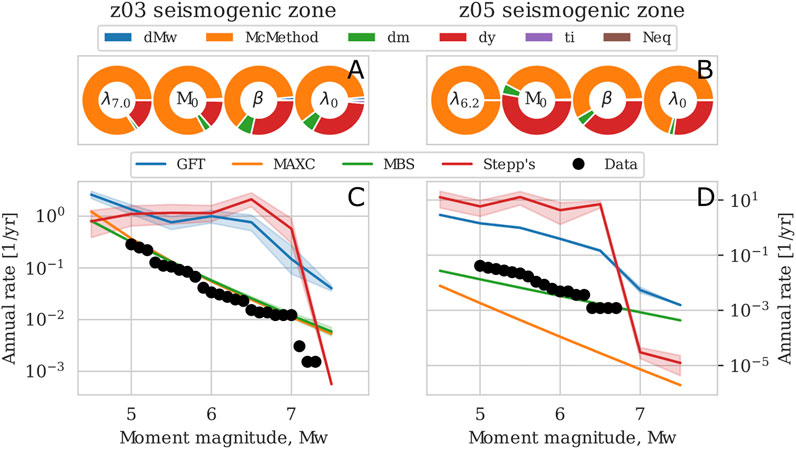
FIGURE 5. Sensitivity on the distribution laws performed on the two most contributing seismogenic zones (z03 and z05). Contribution of the input features to λ6.2, β, λ0 and to M0 of the distribution law in the (A) North Algerian (z03) and (B) Ligurian (z05) seismogenic zones. Mean distribution law per
3.1.2 PCTAs
The analysis is performed on the 16 POIs in Figure 4 to map the coastal variability of the most sensitive features (Figure 6). The three most sensitive parameters on PCTA results are the distance, the strike and the azimuth considering rupture scenarios from all seismogenic zones. The influence of these parameters however varies depending on the place along the coastline. The distance is the most sensitive parameter at each POI except at POIs 3 and 8 (La Petite Fontaine beach in Théoule-sur-Mer and Old Port of Cannes) where the strike becomes more sensitive. This is due to the spread direction of the tsunami, essentially governed by the strike of the rupture. These two POIs are also naturally better protected, allowing a significant tsunami hazard for a few preferential orientations of the main tsunami energy axis only. The slip and the surface of the rupture, (i.e., the moment magnitude) are the least sensitive parameters, because they are strongly constrained to each other by empirical laws (Wells and Coppersmith, 1994).
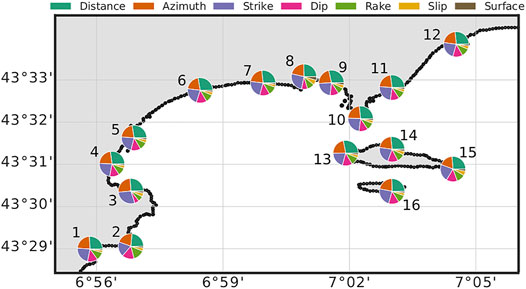
FIGURE 6. Sensitivity of the source parameters on the PCTAs. The pie charts show the sensitivity of each source parameters. The larger is the section, the more the feature is sensitive.
3.2 S-PTHA in the Bay of Cannes
The analysis focuses on the tsunami hazard in terms of the maximum water elevation of the first waves at the coastline (PCTA). The main outcomes of this study indicate that an earthquake generating a tsunami with waves exceeding 1 m locally along the coast in the Bay of Cannes can be expected every 961 years (annual probability of 1.04 × 10⁻³, Figure 7). However, the probability of occurrence of a tsunamigenic earthquake with waves exceeding 1 m along 50% of the coastline drops to 1.14 × 10⁻⁴, hence a 8766-year period. These observations alone do not allow establishing a spatial planning strategy with regard to tsunamis and therefore require a closer look at the hazards.
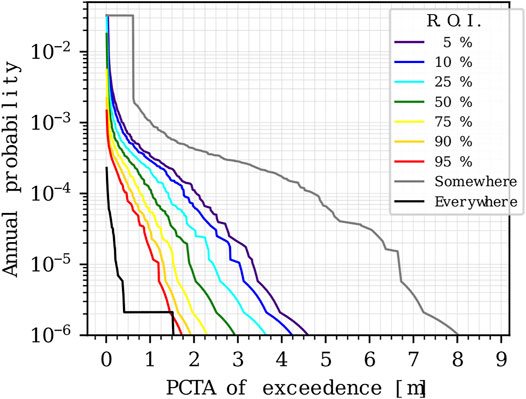
FIGURE 7. Annual probability that a PCTA is being exceeded along a portion of the Bay of Cannes coast. Somewhere: at least at one place; everywhere: at all places (i.e., at all shoreline nodes of the grid).
Then, the above outcomes is analysed at small scale to account for the geometry of the coastline. The hazard maps show the maximum expected PCTAs in 50-, 500- and 2500-year periods (Figures 8A–C), and provide an accurate overview of local PTHA with systematically amplifying coastal POIs compared to the rough regional PTHA estimates of Sørensen et al. (2012). The PCTAs remain below 20 cm for periods shorter than 50 years, and the distribution of the PCTAs provides homogeneous wave heights all along the coastline (Figure 8A). The PCTAs then increase with the period in a non-homogeneous manner (Figures 8A–C and focus in Figure 8I). Indeed, some places, such as the Old Port of Cannes (POI 8), amplify the effects of the tsunami; whereas some other places, such as La Petite Fontaine beach at Théoule-sur-mer (POI 3), are protected from most of the tsunamis effects.
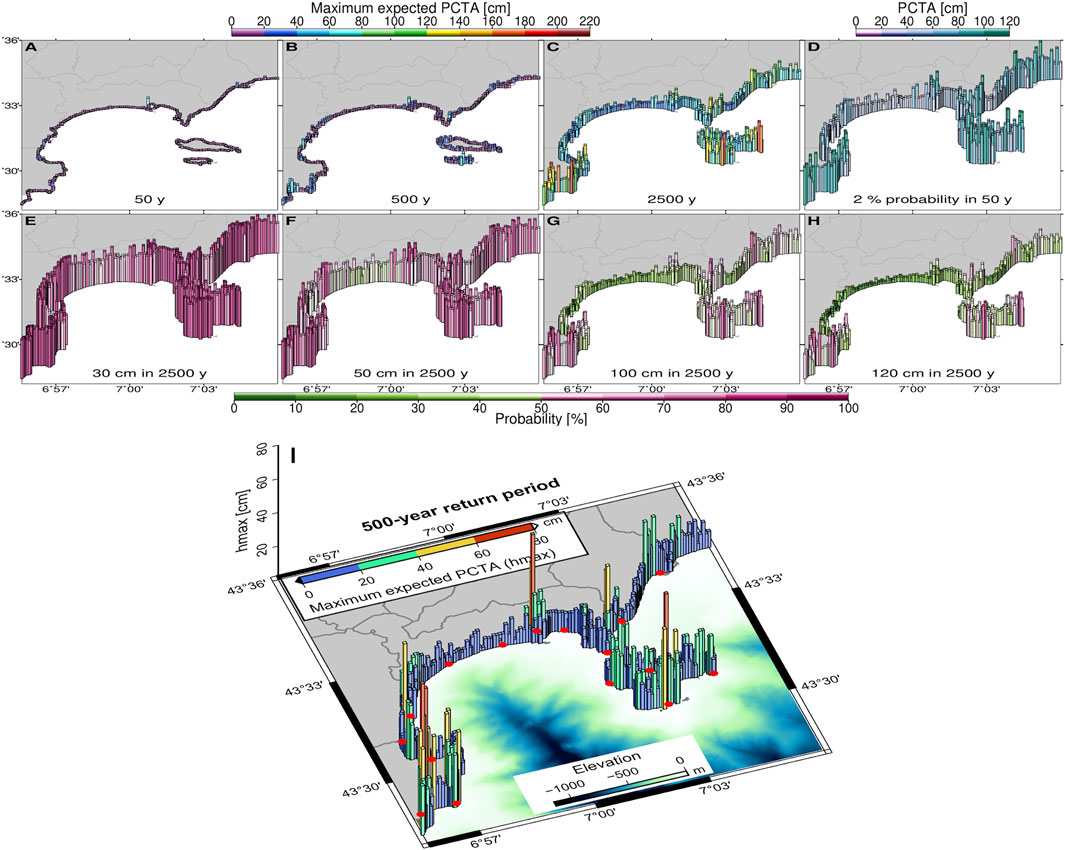
FIGURE 8. Hazard ma+ps: maximum expected PCTAs in (A) a 50-year period, (B) a 500-year period, (C) a 2500-year period. (D) Maximum Considered Tsunami (MCT): The MCT has 2% probability of being exceeded in a 50-year period. This MCT is the reference of engineering in U.S.A. Probability maps: probability to exceed (E) 30 cm, (F) 50 cm, (G) 1 m, (H) 1.2 m in a 2500-year period. (I) Focus on the maximum expected PCTAs in 500-year period. The red dots remind the location of the POIs.
The S-PTHA also provides information on the maximum expected PCTA in a period of time. The probability to exceed a PCTA in a given period is shown in Figures 8E–H. These probability maps are complementary to deterministic hazard maps generally built from the most impacting scenarios for a given area. They highlight the greater occurrence of the hazard linked to smaller waves (e.g., 50 cm, Figure 8F), from which we cannot preclude potential damages. These probability maps show that a wave height of 1 m has a low probability to be exceeded in a period of 2,500 years (Figure 8G). The probability that a tsunami wave exceeds 1 m in a 2500-year period along the Boulevard du Midi Louise Moreau (pink line on Figure 4) is below 20%. The Midi beach (East to POI 7) is the most exposed area along the Boulevard and also the most crowed in the summer holidays. The probability to exceed 1 m in a 2500-year period along the coast of Vallauris is higher and can reach up to 50%. The most exposed places face directly the basin (POIs 1–2, 15–16). The greatest hazard is obtained for the Old Port of Cannes, probably due to resonance effects which amplify the waves. Here, the probability to exceed 1 m in a 2500-year period reaches 70% (POI 8). Naturally, the probability to exceed a PCTA in a period increases with decreasing PCTAs and increasing the periods.
The Maximum Considered Tsunami (MCT), as proposed by the national standard of practice for engineers in the United States, has 2% probability of being exceeded in a 50-year period (corresponding to a return time of 2500 years). The resultant hazard map can help the work of decision for the prioritization of the prevention (Figure 8D). For instance, in the Old Port of Cannes (POI 8), tsunami waves greater than 1 m can be expected every 50 years with a probability of 2%, making this place a priority in terms of preparedness. The preparedness along the Midi beach, crowded in summer times, is not to be omitted either, because waves can reach there 30 cm with 2% probability in 50 years.
The seismogenic zones that contribute the most to the tsunami hazard within the Bay of Cannes are the North Algerian (z03) and the Ligurian (z05) areas (Figure 9). Especially, earthquakes from the Ligurian zone only are able to impact POIs 3 and 8. It is worth noting that among the rupture scenarios selected as significant in the Ligurian seismogenic zone (z05), some ruptures have a moment magnitude below 6.0 (Supplementary Figure S2). This study focuses on PCTAs because there is little flooding in Cannes. However, 41 rupture scenarios generate an inundation above 5 m of altitude, all belonging to the Ligurian seismogenic zone (z05) and with a moment magnitude of 6.7 or above.
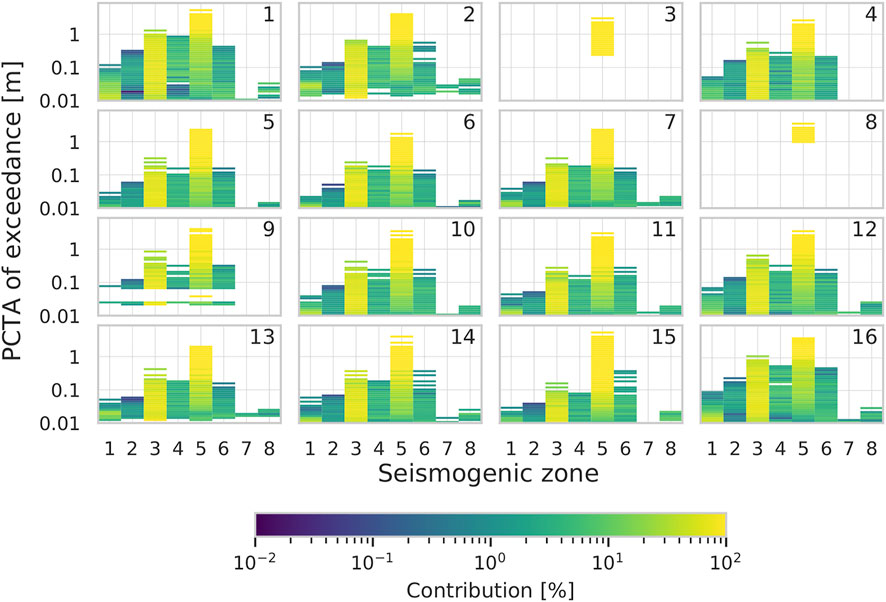
FIGURE 9. Contribution of the seismogenic zones to the tsunami hazard. The number at the upper right of each subplots is the POI reference (Figure 4).
4 Discussion
4.1 Resulting PTHA
The results of the sensitivity analysis on the PCTAs and the high resolution S-PTHA confirm that the coastal geometry influences the tsunami hazard in the Bay of Cannes, with POIs at local scale that are more are less protected depending on the earthquake sources. Furthermore, a recent study of the tsunami hazard in the Bay of Cannes showed that the extended Green’s laws method reproduce high resolution simulation with relative errors up to 25% (Giles et al., 2021a), and concluded that the extrapolation is adequate to rapidly predict a PCTA estimate. This validates the necessity of applying high-resolution PTHA rather than PTHA using offshore extrapolations in order to capture the effects at specific places (bay, harbours, beaches…).
4.2 Actual Tsunami-Earthquake Sources and Seismogenic Zones Definition
The assumption of separated and tsunami-independent basins has relevant implications, such as the effects on the definition of the domain for seismic sources selection and numerical simulations. Regarding the hazard within the WM, it was highlighted that straits like Gibraltar act as a natural barrier for tsunamis generated in the Atlantic, that attenuate strongly while crossing this strait. In addition, the broad and relatively shallow Sicily channel, despite being a less effective barrier, prevents the free propagation of tsunamis between eastern and western Mediterranean (Sørensen et al., 2012). However, the Hellenic arc seismogenic zone should also be added as the strongest earthquakes occurring there can generate a trans-Mediterranean tsunami, i.e., tsunami crossing from the Eastern to the Western Mediterranean basins (e.g., Gailler et al., 2016). One should also note that the earthquake datasets used do not contain any strong pre-historical earthquakes. It would be difficult to integrate them to the study as the seismic rates cannot be validated at geological scales.
Looking at a smaller scale, the seismogenic zones, which are taken from Sørensen et al. (2012) should be updated in order to integrate the earthquakes (for the seismic rates) and the faults (for the rupture scenarios) up to 100 km inland and then join the strategy implemented at the CENALT with the decision matrix of the WM basin (Figure 1B; Schindelé et al., 2015). Additional zones should also be added for spatial completeness in Eastern Spain, Southwestern France (Gulf of Lion area), the Balearic Islands, the Corsica and Sardinia Islands and the Strait of Sicily. The absence of records of earthquakes of Mw>5.5 in these areas does not means it cannot occur. The determination of the seismic law allows extrapolating the seismic rates within an area and the fault combination, as described in Gailler et al. (2013), allows to estimate the maximum moment magnitude that possibly can occur within the same area. Then additional tsunami sources might be available for PTHA processes in the WM basin.
4.3 Faults and Ruptures
The CENALT database of unit sources in some regions might need further investigation to be completed, because the model of the complex fault system of the WM basin may be incomplete, especially far offshore, where active structures are still poorly known (Supplementary Figure S2). We assume that the model is quite complete for the North Algerian and Ligurian seismogenic zones (z03 and z05). An advantage of our method is that we can easily add new unit sources to the fault system and thus new rupture scenarios. The simulation of tsunamis generated by new ruptures has only to be performed once for a given ROI.
Some rupture scenarios, located outside of the seismogenic zones (Supplementary Figure S2), were also selected as being able to generate a significant tsunami in the Bay of Cannes. Their high magnitude lead to low annual rates, and then account for low probability within the tsunami hazards. However, it would be valuable to extend the seismogenic zones to better cover the seismicity further inland.
One should also reminds that all the ruptures scenarios used to process this S-PTHA follow a static and uniform-slip model, reach the seafloor and have a constant shear modulus. Even though introducing more complexity in the rupture dynamic might not have much effects on the PTHA (e.g., An et al., 2018), it would be interesting to test the impact of including heterogeneous slip and rigidity models in the rupture sources dataset through a stochastic approach (e.g., Davies and Griffin, 2019).
4.4 Tsunami Simulations
The tsunami simulation itself is a source of uncertainty. The accuracy of the simulations depends on the choice of the models used to generate and propagate the tsunami (e.g., transfer law used for the tsunami generation that is induced by the rupture motion; shallow water, Boussinesq for the propagation, etc., Heinrich et al., 2021).
The water level fluctuations, related to the atmospheric condition or tides (high tide, low tide, tide coefficient), are also not taken into account in the present study. The tides, in spite of the fact that they are not significant in the WM basin, could be implemented as a source of aleatory uncertainty (e.g., González et al., 2009).
The use of the threshold to select significant tsunamis and the choice of the location of the POTA of reference also impact the results of the S-PTHA. The use of complex amplification laws (e.g., Gailler et al., 2018; Glimsdal et al., 2019) to select significant tsunami can be useful when it’s suitably calibrating for the studied ROI. However, it is not necessary if performing a calibration of the threshold to be a significant tsunami when using a classic Green’s law. A comparison of the tsunami selection and final outcomes using the classic Green’s law and the embedded Green’s law for the area of Cannes (Giles et al., 2021a) can however be performed.
The use of a different threshold for near-fiel and far-field sources should also be explored (Volpe et al., 2019) in order to improve the selection of the significant tsunamis. Indeed, the energy of the near-field tsunami is less dissipated when arriving within the ROI than the energy of the far-field tsunamis, leading to inadequate height extrapolations.
5 Conclusion
The base of a modular procedure to perform high-resolution S-PTHA at the coastal level is proposed. An effort is made to save time on this computationally expensive approach by the use of independent processes for the determination of the seismic and tsunami hazards, by the selection of significant tsunamis for a place using Green’s law, and by the use of an exhaustive rupture catalogue. The low resolution simulations performed first to select significant tsunamis can be re-used to apply the same approach to other coastal ROIs in the WM and save time too. The method is thought such that it is easy to add new a priori knowledge such as additional earthquakes to improve annual rates and new unit faults to build up new ruptures.
This study provides, for the first time, high resolution S-PTHA for the french metropolitan coastlines using the CENALT fault database. Specially, the study supplies an accurate overview of S-PTHA in the Bay of Cannes, both in terms of spacial resolution and wave heights modeling (i.e., based on high resolution tsunami simulations down to 10 m space step), compared to previous rough regional PTHA estimates. Magnitudes 5.5 to 8.0 are covered with annual rates determined from an improved earthquake catalogue spreading from 463 A.D. to 2018. The results highlight that the tsunami hazard in the Bay of Cannes remains low when considering the available data and the limitations of our approach. Indeed, we do not expect that a tsunami which generates PCTAs exceeding 50 cm along more than 50% of the coastlines to happen more than once every 3189 years. The evaluation of the MCT also underlines the portions of the coast where waves are systematically amplified the most and where priority should be given to preparedness. In particular, the Old Port of Cannes shows a MCT exceeding 1 m and beaches can still have MCT locally exceeding 30 cm. The disaggregation highlights that further analysis efforts, such as a confidence analysis, could focus on the Ligurian and North Algerian margins.
In the case of a risk-based study, consideration should be given to extending simulation times to ensure the highest wave in the PTHA. The extension of the simulation time must, however, be reasonable in order not to introduce multiple resonances that can artificially increase the maximum water height. The effects of a tsunami are, also characterized by other parameters such as the wave velocity, the run-up elevation, the inundation distance, the minimum water elevation associated to sea withdrawals, etc. The choice of the parameters of interest depends on why the S-PTHA is needed for, though all these parameters could have been extracted from high-resolution simulations at the same time.
The sensitivity analysis performed in this study shows that the most sensitive parameter to determine the annual rates of a magnitude is the
Some limitations could be overcome in future developments of the proposed approach, for instance, by implementing stochastic sources (with heterogeneous slip and rigidity), by considering water level fluctuation either due to tides or atmospheric conditions, or by perfecting the definition of the seismogenic zones. The use of numerous catalogues of random ruptures instead of a unique exhaustive catalogue should also be considered to determine the confidence interval of the results and therefore give truthful hazard models for tsunami risk mitigation. The modular build of this approach allows to easily implement these ideas in order to improve the relevance of the high-resolution S-PTHA.
Data Availability Statement
The data analyzed in this study is subject to the following licenses/restrictions: Earthquake data are available as described in Table 1. Seismogenic zones are taken from Sørensen et al. (2012). The other raw data supporting the conclusions of this article will be made available by the authors on request. Requests to access these datasets should be directed to YXVkcmV5LmdhaWxsZXJAY2VhLmZy.
Author Contributions
VS and AG contributed to conception and methodology of the study. VS organized data, produced tools and validated them, produced visuals, processed to analyses, wrote the first draft of the manuscript. AG found resources and founding, supervised the study. All authors contributed to manuscript revision, read, and approved the submitted version.
Funding
This study was founded by NARSIS (New Approach to Reactor Safety Improvments, Horizon 2020) H2020 project (http://www.narsis.eu/), with the grant agreement No. 755439.
Conflict of Interest
The authors declare that the research was conducted in the absence of any commercial or financial relationships that could be construed as a potential conflict of interest.
Publisher’s Note
All claims expressed in this article are solely those of the authors and do not necessarily represent those of their affiliated organizations, or those of the publisher, the editors and the reviewers. Any product that may be evaluated in this article, or claim that may be made by its manufacturer, is not guaranteed or endorsed by the publisher.
Acknowledgments
The Service Hydrographique et Oceanographique de la Marine (SHOM) is gratefully acknowledged for making bathymetry and topography data available free of charge on their portal data.shom.fr. City boundaries were collected under the ODbL licence from OpenStreetMap (http://openstreetmap.fr/36680-communes). We want to acknowledge Francois Shindelé and Hélène Hébert for their relevant pre-review. We are thankful to the two reviewers for their questions and comments that enabled us to provide this enhanced manuscript.
Supplementary Material
The Supplementary Material for this article can be found online at: https://www.frontiersin.org/articles/10.3389/feart.2021.765610/full#supplementary-material.
Abbreviations
ETA, estimated time arrival; MCT, maximum considered tsunami; PCTA, peak coastal tsunami amplitude; POI, point of interest; POTA, peak offshore tsunami amplitude; ROI, region of interest; S-PTHA, seismic probabilistic tsunami hazard assessment; WM, western mediterranean.
References
An, C., Liu, H., Ren, Z., and Yuan, Y. (2018). Prediction of Tsunami Waves by Uniform Slip Models. J. Geophys. Res. Oceans 123, 8366–8382. doi:10.1029/2018JC014363
Basili, R., Brizuela, B., Herrero, A., Iqbal, S., Lorito, S., Maesano, F. E., et al. (2018). NEAM Tsunami hazard Model 2018 (NEAMTHM18): Online Data of the Probabilistic Tsunami hazard Model for the Neam Region from the Tsumaps-Neam Project. Available at: https://www.earth-prints.org/bitstream/2122/12739/1/NEAMTHM18_OnlineDataCover.pdf.
Basili, R., Brizuela, B., Herrero, A., Iqbal, S., Lorito, S., Maesano, F. E., et al. (2021). The Making of the NEAM Tsunami hazard Model 2018 (NEAMTHM18). Front. Earth Sci. 8, 753. doi:10.3389/feart.2020.616594
Behrens, J., Løvholt, F., Jalayer, F., Lorito, S., Salgado-Gálvez, M. A., Sørensen, M., et al. (2021). Probabilistic Tsunami Hazard and Risk Analysis: A Review of Research Gaps. Front. Earth Sci. 9, 114. doi:10.3389/feart.2021.628772
Campolongo, F., Cariboni, J., and Saltelli, A. (2007). An Effective Screening Design for Sensitivity Analysis of Large Models. Environ. Model. Softw. 22, 1509–1518. doi:10.1016/j.envsoft.2006.10.004
Cao, A., and Gao, S. S. (2002). Temporal Variation of Seismic b-Values beneath Northeastern Japan Island Arc. Geophys. Res. Lett. 29, 48-1–48-3. doi:10.1029/2001GL013775
Cara, M., Denieul, M., Sèbe, O., Delouis, B., Cansi, Y., and Schlupp, A. (2017). Magnitude M W in Metropolitan France. J. Seismol. 21, 551–565. doi:10.1007/s10950-016-9617-1
Davies, G., and Griffin, J. (2019). Sensitivity of Probabilistic Tsunami Hazard Assessment to Far-Field Earthquake Slip Complexity and Rigidity Depth-Dependence: Case Study of Australia. Pure Appl. Geophys. 177, 1521–1548. doi:10.1007/s00024-019-02299-w
Dziewonski, A. M., Chou, T.-A., and Woodhouse, J. H. (1981). Determination of Earthquake Source Parameters from Waveform Data for Studies of Global and Regional Seismicity. J. Geophys. Res. 86, 2825–2852. doi:10.1029/JB086iB04p02825
Ekström, G., Nettles, M., and Dziewoński, A. M. (2012). The Global CMT Project 2004-2010: Centroid-Moment Tensors for 13,017 Earthquakes. Phys. Earth Planet. Inter. 200-201, 1–9. doi:10.1016/j.pepi.2012.04.002
Eva, C., and Rabinovich, A. B. (1997). The February 23, 1887 Tsunami Recorded on the Ligurian Coast, Western Mediterranean. Geophys. Res. Lett. 24, 2211–2214. doi:10.1029/97GL02110
Gailler, A., Hébert, H., Loevenbruck, A., and Hernandez, B. (2013). Simulation Systems for Tsunami Wave Propagation Forecasting within the French Tsunami Warning center. Nat. Hazards Earth Syst. Sci. 13, 2465–2482. doi:10.5194/nhess-13-2465-2013
Gailler, A., Schindelé, F., and Hébert, H. (2016). “Impact of Hellenic Arc Tsunamis on Corsica (France),” in Global Tsunami Science: Past and Future (Springer), Vol. I, 3847–3862. doi:10.1007/978-3-319-55480-8_10
Gailler, A., Hébert, H., Schindelé, F., and Reymond, D. (2018). Coastal Amplification Laws for the French Tsunami Warning Center: Numerical Modeling and Fast Estimate of Tsunami Wave Heights along the French Riviera. Pure Appl. Geophys. 175, 1429–1444. doi:10.1007/s00024-017-1713-9
GEOWARE (2007). A Tsunami Travel-Time Calculator. [Dataset]. Available at: http://www.geoware-online.com/tsunami.html.
Giardini, D., Grünthal, G., Shedlock, K. M., Zhang, P., and Giardini, D. (2013). Seismic Hazard Harmonization in Europe (SHARE). [Dataset]. Available at: http://www.efehr.org/en/Documentation/specific-hazard-models/europe/overview/. doi:10.12686/SED-00000001-SHARE
Gibbons, S. J., Lorito, S., Macías, J., Løvholt, F., Selva, J., Volpe, M., et al. (2020). Probabilistic Tsunami hazard Analysis: High Performance Computing for Massive Scale Inundation Simulations. Front. Earth Sci. 8, 623. doi:10.3389/feart.2020.591549
Giles, D., Gailler, A., Souty, V., Chouli, A., and Dias, F. (2021a). Automative Approaches for Capturing Localised Tsunami Response - Application to the French Coastlines. J. Geophys. Res. – Oceans (Preprint). doi:10.1002/essoar.10506015.1
Giles, D., Gopinathan, D., Guillas, S., and Dias, F. (2021b). Faster Than Real Time Tsunami Warning with Associated hazard Uncertainties. Front. Earth Sci. 8, 560. doi:10.3389/feart.2020.597865
Glimsdal, S., Løvholt, F., Harbitz, C. B., Romano, F., Lorito, S., Orefice, S., et al. (2019). A New Approximate Method for Quantifying Tsunami Maximum Inundation Height Probability. Pure Appl. Geophys. 176, 1–20. doi:10.1007/s00024-019-02091-w
González, F. I., Geist, E. L., Jaffe, B., Kâno\\uglu, U., Mofjeld, H., Synolakis, C. E., et al. (2009). Probabilistic Tsunami hazard Assessment at seaside, Oregon, for Near-And Far-Field Seismic Sources. J. Geophys. Res. Oceans 114, 1–19. doi:10.1029/2008jc005132
Green, G. (1838). On the Motion of Waves in a Variable Canal of Small Depth and Width. Trans. Cambridge Philos. Soc. 6, 457.
Grezio, A., Sandri, L., Marzocchi, W., Argnani, A., Gasparini, P., and Selva, J. (2012). Probabilistic Tsunami hazard Assessment for Messina Strait Area (Sicily, Italy). Nat. Hazards 64, 329–358. doi:10.1007/s11069-012-0246-x
Grezio, A., Babeyko, A., Baptista, M. A., Behrens, J., Costa, A., Davies, G., et al. (2017). Probabilistic Tsunami hazard Analysis: Multiple Sources and Global Applications. Rev. Geophys. 55, 1158–1198. doi:10.1002/2017rg000579
Grezio, A., Cinti, F. R., Costa, A., Faenza, L., Perfetti, P., Pierdominici, S., et al. (2020). Multisource Bayesian Probabilistic Tsunami hazard Analysis for the Gulf of Naples (Italy). J. Geophys. Res. Oceans 125, e2019JC015373. doi:10.1029/2019jc015373
Grünthal, G., and Wahlström, R. (2012). The European-Mediterranean Earthquake Catalogue (EMEC) for the Last Millennium. J. Seismol. 16, 535–570. doi:10.1007/s10950-012-9302-y
Grünthal, G., Wahlström, R., and Stromeyer, D. (2013). The SHARE European Earthquake Catalogue (SHEEC) for the Time Period 1900–2006 and its Comparison to the European-Mediterranean Earthquake Catalogue (EMEC). J. Seismol. 17, 1339–1344. doi:10.1007/s10950-013-9379-y
Heinrich, P., Jamelot, A., Cauquis, A., and Gailler, A. (2021). Taitoko, an Advanced Code for Tsunami Propagation, Developed at the French Tsunami Warning Centers. Eur. J. Mechanics-B/Fluids 88, 72–88. doi:10.1016/j.euromechflu.2021.03.001
IAEA (2015). The Fukushima Daiichi Accident. Tech. rep., Volume 1/5. Vienna: International Atomic Energy Agency. Description and context of the accident.
International Seismological Centre (2020). ISC-GEM Earthquake Catalogue. [Dataset]. doi:10.31905/d808b825
Larroque, C., Scotti, O., Ioualalen, M., Oona, S., and Mansour, I. (2012). Reappraisal of the 1887 Ligurian Earthquake (Western Mediterranean) from Macroseismicity, Active Tectonics and Tsunami Modelling. Geophys. J. Int. 190, 87–104. doi:10.1111/j.1365-246X.2012.05498.x
Lolli, B., Gasperini, P., and Vannucci, G. (2014). Empirical Conversion between Teleseismic Magnitudes (Mb and Ms) and Moment Magnitude (Mw) at the Global, Euro-Mediterranean and Italian Scale. Geophys. J. Int. 199, 805–828. doi:10.1093/gji/ggu264
Lorito, S., Selva, J., Basili, R., Romano, F., Tiberti, M., and Piatanesi, A. (2015). Probabilistic hazard for Seismically Induced Tsunamis: Accuracy and Feasibility of Inundation Maps. Geophys. J. Int. 200, 574–588. doi:10.1093/gji/ggu408
Manchuel, K., Traversa, P., Baumont, D., Cara, M., Nayman, E., and Durouchoux, C. (2018). The French Seismic CATalogue (FCAT-17). Bull. Earthquake Eng. 16, 2227–2251. doi:10.1007/s10518-017-0236-1
Morris, M. D. (1991). Factorial Sampling Plans for Preliminary Computational Experiments. Technometrics 33, 161–174. doi:10.1080/00401706.1991.10484804
National Geophysical Data Center NOAA (2020). NCEI/WDS Global Significant Earthquake Database, 2150 BC to Present. [Dataset]. doi:10.7289/V5TD9V7K
Okal, E. A. (2011). Tsunamigenic Earthquakes: Past and Present Milestones. Pure Appl. Geophys. 168, 969–995. doi:10.1007/s00024-010-0215-9
Park, H., Cox, D. T., and Barbosa, A. R. (2018). Probabilistic Tsunami Hazard Assessment (PTHA) for Resilience Assessment of a Coastal Community. Nat. Hazards 94 (3), 1117–1139. doi:10.1007/s11069-018-3460-3
Sahal, A., Roger, J., Allgeyer, S., Lemaire, B., Hébert, H., Schindelé, F., et al. (2009). The Tsunami Triggered by the 21 May 2003 Boumerdès-Zemmouri (Algeria) Earthquake: Field Investigations on the French Mediterranean Coast and Tsunami Modelling. Nat. Hazards Earth Syst. Sci. 9, 1823–1834. doi:10.5194/nhess-9-1823-2009
Schindelé, F., Gailler, A., Hébert, H., Loevenbruck, A., Gutierrez, E., Monnier, A., et al. (2015). Implementation and Challenges of the Tsunami Warning System in the Western Mediterranean. Pure Appl. Geophys. 172, 821–833. doi:10.1007/s00024-014-0950-4
Selva, J., Tonini, R., Molinari, I., Tiberti, M. M., Romano, F., Grezio, A., et al. (2016). Quantification of Source Uncertainties in Seismic Probabilistic Tsunami hazard Analysis (SPTHA). Geophys. J. Int. 205, 1780–1803. doi:10.1093/gji/ggw107
Selva, J., Lorito, S., Volpe, M., Romano, F., Tonini, R., Perfetti, P., et al. (2021). Probabilistic Tsunami Forecasting for Early Warning. Nat. Commun. 12, 1–14. doi:10.1038/s41467-021-25815-w
Shi, Y., and Bolt, B. A. (1982). The Standard Error of the Magnitude-Frequency B Value. Bull. Seismol. Soc. Am. 72, 1677–1687. doi:10.1785/bssa0720051677
Sobol, I. M. (2001). Global Sensitivity Indices for Nonlinear Mathematical Models and Their Monte Carlo Estimates. Math. Comput. Simul. 55, 271–280. doi:10.1016/s0378-4754(00)00270-6
Sørensen, M. B., Spada, M., Babeyko, A., Wiemer, S., and Grünthal, G. (2012). Probabilistic Tsunami hazard in the Mediterranean Sea. J. Geophys. Res. Solid Earth 117, 2465–2482. doi:10.5194/nhess-13-2465-2013
Stein, S., and Okal, E. A. (2011). The Size of the 2011 Tohoku Earthquake Need Not Have Been a surprise. Eos, Trans. Am. Geophys. Union 92, 227–228. doi:10.1029/2011eo270005
Stepp, J. C. (1972). “Analysis of Completeness of the Earthquake Sample in the Puget Sound Area and its Effect on Statistical Estimates of Earthquake hazard,” in Proceeding of the 1st International Conference on Microzonazion, Seattle. 897–910.
Stucchi, M., Rovida, A., Capera, A. G. A. G., Alexandre, P., Camelbeeck, T., Demircioglu, M. B., et al. (2013). The SHARE European Earthquake Catalogue (SHEEC) 1000–1899. J. Seismol. 17, 523–544. doi:10.1007/s10950-012-9335-2
TANDEM (2020). TANDEM : Tsunamis in the Atlantic and the English ChaNnel Definition of the Effects through Numerical Modeling. [Dataset]. Available at: http://www-tandem.cea.fr/.
Tonini, R., Di Manna, P., Lorito, S., Selva, J., Volpe, M., Romano, F., et al. (2021). Testing Tsunami Inundation Maps for Evacuation Planning in Italy. Front. Earth Sci. 9, 82. doi:10.3389/feart.2021.628061
Volpe, M., Lorito, S., Selva, J., Tonini, R., Romano, F., and Brizuela, B. (2019). From Regional to Local SPTHA: Efficient Computation of Probabilistic Tsunami Inundation Maps Addressing Near-Field Sources. Nat. Hazards Earth Syst. Sci. 19, 455–469. doi:10.5194/nhess-19-455-2019
Wason, H. R., Das, R., and Sharma, M. L. (2012). Magnitude Conversion Problem Using General Orthogonal Regression. Geophys. J. Int. 190, 1091–1096. doi:10.1111/j.1365-246X.2012.05520.x
Weichert, D. H. (1980). Estimation of the Earthquake Recurrence Parameters for Unequal Observation Periods for Different Magnitudes. Bull. Seismol. Soc. Am. 70, 1337–1346. doi:10.1785/bssa0700041337
Wells, D. L., and Coppersmith, K. J. (1994). New Empirical Relationships Among Magnitude, Rupture Length, Rupture Width, Rupture Area, and Surface Displacement. Bull. Seismol. Soc. Am. 84, 974–1002.
Wiemer, S., and Wyss, M. (2000). Minimum Magnitude of Completeness in Earthquake Catalogs: Examples from Alaska, the Western United States, and Japan. Bull. Seismol. Soc. Am. 90, 859–869. doi:10.1785/0119990114
Keywords: Bay of Cannes (France), earthquake tsunamis, amplification-law filter, high-resolution simulations, probabilistic assessment
Citation: Souty V and Gailler A (2021) Fast High-Resolution S-PTHA Along the Western Mediterranean Sea Coastlines. Application to the Bay of Cannes. Front. Earth Sci. 9:765610. doi: 10.3389/feart.2021.765610
Received: 27 August 2021; Accepted: 12 November 2021;
Published: 07 December 2021.
Edited by:
Manuela Volpe, Istituto Nazionale di Geofisica e Vulcanologia (INGV), ItalyReviewed by:
Roberto Tonini, Istituto Nazionale di Geofisica e Vulcanologia (INGV), ItalyNatalia ZamoraS, Barcelona Supercomputing Center, Spain
Copyright © 2021 Souty and Gailler. This is an open-access article distributed under the terms of the Creative Commons Attribution License (CC BY). The use, distribution or reproduction in other forums is permitted, provided the original author(s) and the copyright owner(s) are credited and that the original publication in this journal is cited, in accordance with accepted academic practice. No use, distribution or reproduction is permitted which does not comply with these terms.
*Correspondence: Viviane Souty , dml2aWFuZS5zb3V0eUBnbWFpbC5jb20=
†Present address: EMSC/CSEM, Bruyères-le-Châtel, France