 Takashi Koi
 Norifumi Hotta
 Yasutaka Tanaka1
- 1Center for Natural Hazards Research, Hokkaido University, Sapporo, Japan
- 2Graduate School of Agricultural and Life Science, The University of Tokyo, Tokyo, Japan
- 3Research Faculty of Agriculture, Hokkaido University, Sapporo, Japan
The earthquake that occurred on 6 September 2018, in the eastern part of the Iburi region of Hokkaido, Japan (the Hokkaido Eastern Iburi Earthquake) caused thousands of shallow landslides in mountain areas. In areas where many landslides occurred, the trees on the slope became large woody debris (LWD) and were supplied to the catchment. Understanding the properties of LWD during the earthquake and its subsequent movement after the earthquake are important to manage the produced LWD and implement disaster prevention measures. This study evaluates the risk of future LWD disasters based on the sequence of LWD generation, its spatial distribution, and LWD relocation linked to temporal fluctuations in rainfall events. The study site is the upper Habiu River catchment (0.37 km2), where multiple shallow earthquake-related landslides occurred. Orthophotos and elevation data acquired before and after the earthquake were used to detect the properties of LWD. To evaluate the risk of an LWD disaster, we examined the correspondence between the hydraulic quantities, including the precipitation for 2 years after the earthquake and the water depth. It was estimated that approximately 7,000 LWD pieces (9,119 m3 km−2) were produced during the earthquake. Orthophoto interpretations indicate that over 80% of the LWD produced at the time of the landslide moved from the slope to the channel accompanied by the landslide debris; some of that then flowed down, accumulated, and formed logjams. In the river channel approximately two years after the earthquake, the destruction of logjams and the clear and drastic movement of LWD could not be confirmed. In this catchment, the uneven LWD distribution and the formation of logjams were fixed almost immediately after the landslide at the time of the earthquake; these characteristics are important when considering future actions. The water depth evaluation based on the difference in the excess return period indicate that the degree of risk differs depending on the deposition location in the channel. This suggests that not all LWD in the catchment are dangerous and that a risk assessment focusing on the LWD location can be effective. This study also makes it possible to determine high priority areas for LWD treatment.
Introduction
In Japan, the current amount of forest accumulation is close to three times that of approximately 50 years ago due to increase of old-growth forests (MAFF, 2018). In mountain areas, large woody debris (LWD) produced by landslides and stream bank erosion, primarily during heavy rainfall events, may flow downstream along with landslide debris or as instream LWD transport during subsequent large flooding events, sometimes with disastrous effects (Ruiz-Villanueva et al., 2014; Lucía et al., 2015; Comiti et al., 2016; De Cicco et al., 2018; Mazzorana et al., 2018). In Japan, LWD generated in the Yosasa River Basin in 1998 blocked bridges in the downstream area and caused widespread flooding (Minami et al., 2000) and, in 2018, a large amount of LWD from a landslide area flowed downstream during a heavy rainfall event in northern Kyushu (Marutani et al., 2017; Moriya et al., 2018).
LWD produced with landslides can be induced not only by heavy rainfall but also by earthquakes. Landslide-driven LWD induced by earthquakes is not expected to move long distances, unlike LWD induced during heavy rainfall events; instead, the LWD remains with the landslide debris and sometimes forms logjam in the catchment. Even though it is unlikely that LWD will cause direct damage in downstream areas during an earthquake, there is a risk that new LWD deposition in the drainage area will float and be transported long distances during subsequent rainfall events. In headwater streams, LWD deposited at river channels has been reported to have moved over the course of a few years (Wohl and Goode, 2008; Dixon and Sear, 2014).
However, the formation of logjams in river channels plays an important role in the formation of the river morphology and ecosystems (Abbe and Montgomery, 1996; Piégay and Gurnell, 1997; Sear et al., 2010) and sediment is accumulated on the upstream side of LWD in river channels, forming step and pool structures (Nakamura and Swanson, 1993; Thompson, 1995; Abe and Nakamura, 1996). LWD captures litter, providing an appropriate environment for aquatic life (Speaker et al., 1984). The formation of step and pool structures and the retention of particle organic matter by LWD improves the growth of fish (Fausch and Northcote, 1992; Riley and Fausch, 1995). In addition, fallen trees in the river channel themselves serve as a source of particle organic matter for mountain streams (Ward and Aumen, 1986). Therefore, removing LWD drastically changes the river morphology and affects fish habitats (Smith et al., 1993; Abe and Nakamura, 1999).
The Intergovernmental Panel on Climate Change (IPCC) reported that, in mid-latitudes of the Northern Hemisphere (30–60°N), where Japan is located, the frequency of heavy precipitation events has increased over the past century (IPCC, 2014). Therefore, in the future, it is expected that a large amount of LWD will be generated and that the relocation of LWD in river channels will become significant during large-scale events. If there is no risk of a large amount of the LWD flowing downstream, it is preferable that the LWD remain in the basin for a long period of time to enable the formation of mountain stream ecosystems. Understanding the LWD production volume, deposition location, and patterns during an earthquake and its subsequent transport after an earthquake are important to properly manage the produced LWD and implement disaster prevention measures.
The earthquake that occurred on 6 September 2018, in the eastern part of the Iburi region of Hokkaido, Japan (the Hokkaido Eastern Iburi Earthquake, MJMA 6.7) caused thousands of shallow landslides over an area of 400 km2 (Osanai et al., 2019; Zhao et al., 2020). In hilly areas where many landslides occurred, the trees on the slopes became driftwood associated with landslide debris, supplying an extremely large amount of LWD to the catchment. In heavy rainfall events, approximately 66% of the LWD pieces in debris flows are discharged to the catchment outlet (Ishikawa et al., 1989). However, almost of all of earthquake-induced LWD is retained in the catchment because of the minimal hydraulic power. In addition, there have been few cases with large amounts of earthquake-generated LWD. Therefore, the generation of LWD by earthquakes and its subsequent movement is not well known. If a large amount of LWD remains in a catchment, as in the case after an earthquake occurrence, the future movement of the LWD may cause damage to bridges or other facilities as a result of driftwood collisions and accumulation and may aggravate flood damage in downstream areas.
This study evaluates the risk of future LWD disasters based on the sequence of LWD generation, its spatial distribution, the temporal fluctuations of rainfall events, and the accompanying relocation of LWD.
Materials and Methods
Study Site
The study site is the upper Habiu River catchment (0.37 km2) of the Atsuma River system (Figure 1A,B). The elevation of the catchment ranges from 111 m to 241 m, the channel length is approximately 1,070 m, and the average channel gradient is 5%. No artificial structures, such as check dams, have been installed in the catchment, and the entire section is a natural river channel. The average annual rainfall at the Abira station of the Automated Meteorological Data Acquisition System (AMeDAS), located approximately 8 km west of the main basin, is 1,053 mm (ranging from 449 mm to 1,615 mm). From mid-December to late March every year, the area is covered with snow. The geology of this catchment is based on Neogene sedimentary rocks, upon which multiple layers of volcanic ejecta from different events are deposited. The entire catchment is a prefectural forest managed by the Hokkaido government and made up of mature broad-leaved forests dominated by Japanese white birch (Betula platyphylla var. japonica Hara) and Japanese oak (Quercus mongolica var. grosseserrata Rehder et Wilson), as well as some planted forests of Japanese larch (Lalix leptolepis Gordon) and Todo fir (Abies sachalinensis). Even though the presence of active faults (earthquake occurrences) approximately 5,000 years ago in this region was noted in surveys of slopes, terrace strata, and river floodplain sediments, no evidence has been found to indicate a large-scale landslide event, such as that caused by the 2018 Hokkaido Eastern Iburi earthquake, for at least the last 10,000 years (Oka, 2019).
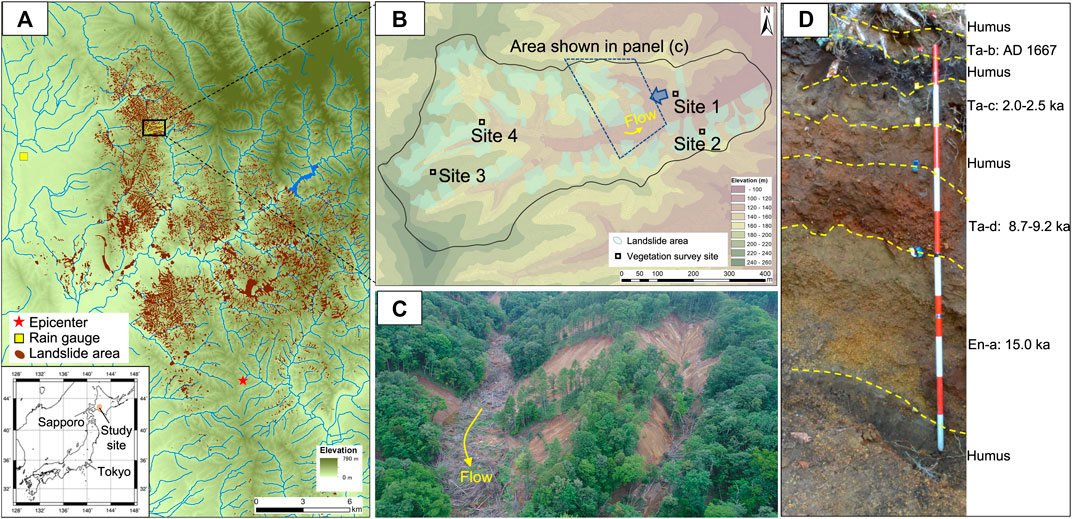
FIGURE 1. Study site description. (A) Landslide distribution induced by the 2018 Hokkaido Eastern Iburi Earthquake. (B) Drainage of the study site. (C) Aerial view of the study site. (D) Geological structure of the study site.
Few earthquake-induced landslides occurred near the epicenter of the 2018 Hokkaido Eastern Iburi earthquake (Figure 1A), with most landslides occurring in a range of 5–22 km from the epicenter (Zhang et al., 2019). The study site is located approximately 20 km northwest of the epicenter, where shallow landslides were particularly concentrated (Figure 1A,B). Because volcanic ejecta is thickly deposited in the areas where many landslides occurred and the distribution of the landslide areas is highly consistent with the distribution of volcanic ejecta, the deposition of volcanic ejecta is thought to be the most important element related to landslide occurrences (Li et al., 2020). At the study site, thick volcanic ejecta from the Shikotsu caldera area is deposited from the surface to a depth of approximately 2 m (Figure 1D). Even though a volcanic ejecta layer originating from Mt. Tarumae (Ta-d) has been observed as being a slide surface for landslides in other areas (Zhang et al., 2019; Li et al., 2020), the volcanic ejecta layer that became the slide surface in the study area is a pumice layer (En-a) with a thickness of approximately 80 cm that was ejected from Mt. Eniwa 15,000 years ago. Three layers of volcanic ejecta (Ta-b, c, d) from Mt. Tarumae, which is also a volcano near the Shikotsu caldera, are deposited above En-a (Figure 1D). Therefore, the landslide debris produced from the landslide slopes was composed of volcanic ejecta with a maximum grain size of 1–2 cm or less, with almost no coarse gravel with larger grain sizes. According to a survey conducted after the earthquake, the grain size distribution of En-a is 4% gravel, approximately 50% sand, and approximately 40% silt, with the remainder being clay with a 50% grain size of approximately 0.1 mm (Osanai et al., 2019).
Data Acquisition
It is possible to acquire LWD information from orthophoto images acquired using unmanned aerial vehicles (UAVs) (Tsunetaka et al., 2021). Aerial photographs and elevation data after the earthquake were acquired twice, immediately after the earthquake (15 September 2018) and approximately 2 years after the earthquake (20 October 2020). These data were used to obtain topographic information and to detect LWD generation, movement, deposition during the earthquake, and subsequent movement after the earthquake. Elevation data prior to the earthquake were also acquired on 1 October 2016. The 2016 data consist of a 5-m grid digital elevation model (DEM) published by the Geospatial Information Authority of Japan (https://fgd.gsi.go.jp/download/menu.php). For the 2018 elevation data, we used a 1-m grid DEM generated from laser profiler data acquired from Hokkaido Prefecture. The 2020 data consist of orthoimage data created using structure from motion technology incorporating photographic UAV (DJI Phantom 4 RTK)-acquired image data, which consist of overlapping vertical aerial photographs.
The hourly rainfall data from 1976 to 2020 were acquired from the AMeDAS Abira station of the Japan Meteorological Agency (https://www.data.jma.go.jp/obd/stats/etrn/). This rainfall station is the closest to the study site. It was confirmed that the rainfall data at the Abira station were more consistent with the storage-type rainfall observation data installed near the study site than data acquired from other rainfall observation stations. Therefore, in this study, the rainfall data at the Abira station were used as is.
Catchment Topography and Earthquake-Induced Landslides
The topographical information of the basin prior to and after the earthquake and the landslide areas that occurred because of the earthquake were identified using Geographic Information System (GIS) software (ArcGIS) based on the 2016 and 2018 DEMs. The landslide and river channel areas after the earthquake were determined from the contour map created from the 2018 DEM and an interpretation of the orthophoto image data; the landslide area, channel length, channel gradient, and river channel width were then calculated.
The catchment was divided into three categories, the upper, middle, and lower reaches, based on the main channel gradient of the topography prior to the earthquake (i.e., the 2016 elevation data; Figure 2). Based on the flow path automatically generated via a topographical analysis by ArcGIS, four sub-catchments were set in the upper reach and one sub-catchment was set in the middle reach, Sub-catchment 2, which has the longest channel length, was treated as the main channel (Figure 2 and Table 1). The landslide area was modeled by interpreting the 2018 and 2020 orthophoto images and creating polygons.
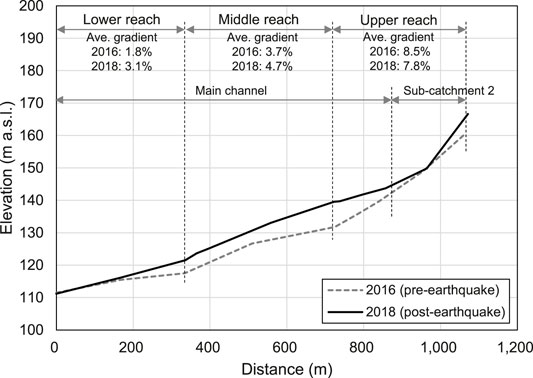
FIGURE 2. Pre- and post-earthquake longitudinal profiles of the river channel Elevation is given in meters above sea level (m a.s.I.).
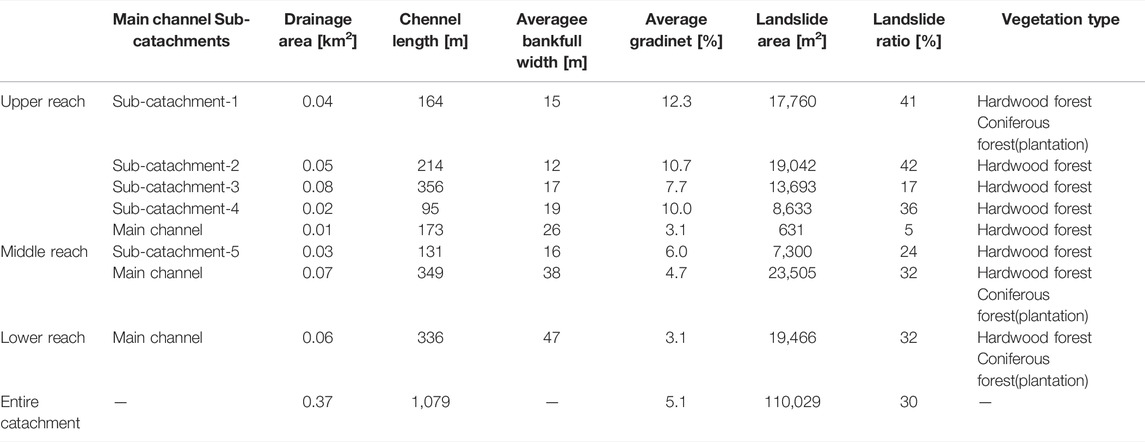
TABLE 1. Summary of the characteristics of the three reaches.
LWD Properties Associated With the Earthquake
At the study site, LWD generated during the earthquake was left in situ without being artificially removed and no planting was carried out on the landslide slopes (Figure 1C). The LWD generation during the earthquake and its location for the next approximately 2 years were identified by conducting a field survey, interpreting orthophoto image data, and performing topographical analyses using multiple elevation data. Because branches and leaves remain with the LWD pieces generated during the earthquake and it is difficult to automate the LWD identification, the number of LWD pieces was measured visually by interpreting the orthophoto images, creating a polyline for each LWD piece, and counting the number of polylines on the GIS. The identified LWD pieces were counted based on only their main trunk, not their branches. There are few shadows in the orthophoto images, and the number of LWD pieces was obtained with high accuracy, except in the logjam regions and areas with buried trees; however, all “visible” pieces were identified.
The position and number of LWD pieces generated during the earthquake were separated into slope and river channel categories using the orthophoto image acquired on 20 October 2020. The orthophoto image was created using Structure from Motion software (Pix4D Mapper). The created orthophoto image was read into ArcGIS, the number of LWD pieces was counted, and the LWD lengths were determined. To identify the LWD pieces generated during the earthquake with higher accuracy, we used a 2020 orthophoto image that was taken from a relatively low altitude (height above ground level of 110 m) and has a relatively high resolution; at this time, the leaves had fallen as a result of the death of the driftwood, making it easy to identify the trunks. The 2018 orthophoto image acquired immediately after the earthquake was used as a supplement. The change in the LWD position after the earthquake was confirmed by comparing the orthophoto image data from 2018 to 2020.
The number and volume of LWD pieces produced by the landslides were estimated by multiplying the standing tree density and the trunk volume obtained from a vegetation survey by the individual landslide areas. The vegetation survey was conducted at four plots (10 m × 10 m) with different tree species and slope orientations: a south-facing slope (broad-leaved forest) and a north-facing slope (plantation coniferous forest) in the downstream area and a south-facing slope (broad-leaved forest) and a north-facing slope (broad-leaved forest) in the upstream area (Figure 1B). The vegetation survey targeted standing trees with a diameter at breast height (DBH) of 10 cm or more, which are generally treated as LWD. From the vegetation survey, trees with a DBH of 30 cm or more (maximum 53 cm) accounted for the largest proportion at 35%, followed by DBHs of 10–14 cm at 23% (Figure 3A). The height of the standing trees with a DBH of 30 cm or more was approximately 20 m (Figure 3B).
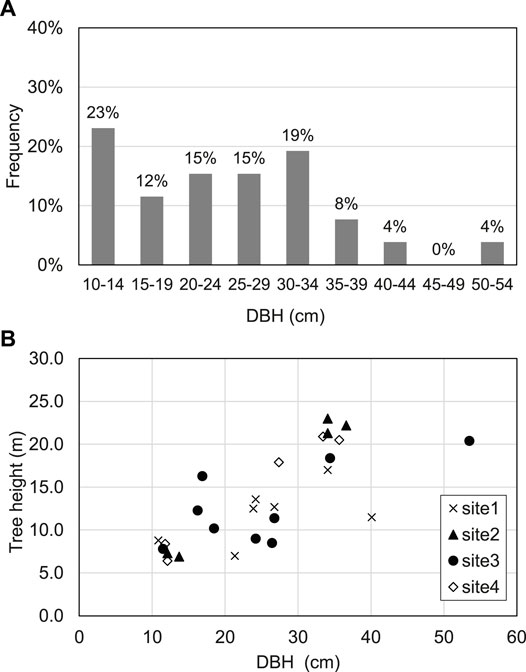
FIGURE 3. Relationship between the diameter at breast height (DBH) of the standing trees and (A) the frequency and (B) the tree height.
The forest stand density was calculated after dividing the region into broad-leaved, coniferous (plantation), and mixed forests according to the vegetation prior to the earthquake; the densities of these sub-regions were 0.07 trees m−2, 0.05 trees m−2, and 0.06 trees m−2, respectively. The density of the standing trees in the mixed forests was the average value of those in the broad-leaved and coniferous forests. The trunk volume was estimated from the DBH and the tree height. The vegetation map published by the Ministry of the Environment was used to determine the vegetation distribution in the basin.
Hydraulic Values
To evaluate the risk of driftwood disasters, we compared the correspondence between the LWD relocation and the hydraulic quantities, such as the precipitation, peak discharge, and normal flow depth, for the approximately 2-year period following the earthquake. Because the entire channel section is a natural river channel and the presence of boulders cannot be confirmed, the influence of obstacles was not considered.
To determine the hydrological record for the 2 years following the earthquake, the peak discharge was calculated after extracting rainfall amounts of over 5 mm in 24 h. There were 72 extracted events in total. Rainfall during snowfall events was excluded. The return periods (2, 10, 20, 50, and 100 years) of the 1-h and 24-h rainfall were calculated using software for statistical analyses of hydrological data (Hydrological Statistics Utility version 1.5), developed by the Japan Institute of Country-ology and Engineering (JICE), and were estimated from the most compatible distributions, i.e., the Gumbel and square-root exponential-type distributions of the maximum, respectively, using the yearly maximum 1-h and 24-h rainfall from 1976 to 2020. Then, the magnitude of the rainfall events experienced during the 2 years was evaluated by comparing the rainfall record with the rainfall of the n-year return period.
Whether or not an LWD piece moves is determined by the drag and friction forces acting on each piece (e.g., Braudrick and Grant, 2000). However, water is significantly involved as a condition for LWD to float and flow, and the magnitude relationship between the water depth and the log diameter is important for log float and flow (Haga et al., 2006; Ruiz-Villanueva et al., 2019). In particular, the necessary condition for a log to travel a long distance occurs when the water depth at the peak discharge is greater than the log diameter (Haga et al., 2002; Haga et al., 2006). Therefore, this study focused on the normal-flow depth at peak discharge as the movement condition for an LWD piece.
Various methods for estimating the peak discharge have been proposed, and the rational formula (e.g., Kadoya and Fukushima, 1976; Hotchkiss and Mccallum, 1995) can estimate the peak discharge from the rainfall record even if a hydrograph is not obtained. This formula is also applicable to small watersheds, such as that of the study site, because it does not consider the influence of the catchment area or the distribution of the rainfall intensity. In this study, the peak discharge (Qp in m3 s−1) during a flood event was determined using the rational formula:
where Cf is the non-dimensional runoff coefficient, Re is the effective rainfall intensity [mm h−1], and A is the drainage area [km2]. In this study, considering that this catchment is a volcanic area and that the slopes were covered with forest but landslides occurred over approximately 30% of the entire area, Cf was set to 0.45 according to the standard for the Hokkaido Prefecture. The Cf value changes depending on the surface conditions of a catchment, and it is reported to be approximately 0.35–0.45 in the forests of Japan (Kadoya, 1988). Considering that this study site is covered by forest with many bared landslide areas, Cf = 0.45 is a reasonable value. Discharge during snowmelt was not included.
The normal-flow depth was calculated as an index related to the movement of the driftwood. Here, because the channel gradient and bankfull width differ between the main channel and the sub-catchment in each reach, the normal-flow depth (h*) was calculated from the following formulas based on Manning’s formula assuming that the river channel has a trapezoidal cross section (Inoue 2008):
where h, h* is the normal flow depth [m], Q is the peak discharge during a rainfall event [m3 s−1], i is the channel gradient, B is the bankfull width [m], n is Manning’s roughness coefficient, and m is the side-slope gradient. The peak discharge was determined by dividing the event peak flow rate by each individual drainage area (i.e., the main channel and the five sub-catchments). The n value is difficult to determine uniformly because it changes significantly, even at the same point, depending on the fluvial topography, riverbed material, and changes in the water depth (Asano et al., 2012). For example, it is estimated to be 0.050–0.100 when there are very large amounts of vegetation in the floodplain (Arcement and Schneider, 1989), while it is estimated to be 0.035–0.100 in a natural river where the river width is larger than 30 m and boulders and brush are present (Chow, 1959). Even though the n value of rivers with large amounts of LWD is not well known, in this study, a value of 0.070, which is generally used in natural mountain watershed rivers in Japan, was adopted.
Results
Spatial Density of LWD Induced by the Earthquake
The total number of LWD pieces generated by the landslides during the earthquake was estimated to be 6,972, and the total volume of the LWD generated was estimated to be 3,386 m3 (Table 2). The number of LWD pieces generated in the upper reach was the highest at 3,999, while that in the lower reach was the lowest at 1,081. In this catchment, landslides occurred at approximately the same rate throughout the entire catchment area; therefore, there was no significant difference in the number and volume of LWD pieces generated per unit area and the unit number for the entire area was estimated to be 18,435 pieces km−2 with an estimated spatial density of 9,119 m3 km−2.

TABLE 2. Generation and depsition of large woody debris (LWD) within each reach.
In Japan, it is estimated that 102–104 pieces km−2 of LWD are induced by heavy rainfall events in comparable catchment areas (Mizuyama et al., 1985; Ishikawa et al., 1989) and the trunk volume has been estimated to be 101–103 m3 km−2 (Ishikawa et al., 1989). Compared with these values, the number and volume of LWD pieces generated during this earthquake was significantly larger.
The number of LWD pieces deposited around the landslide slopes and in the river channel, as confirmed by the orthophoto images, was 5,733 pieces throughout the entire catchment. The number of LWD pieces deposited in the middle reach was the highest at 2,581, while it was the lowest at 926 in the lower reach (Table 2).
The median LWD log length was approximately 4.0 m for both the upper and middle reaches on the landslide slope and in the river channel, while for the lower reach, it was significantly longer with values of 10.0 m on the landslide slope and 5.2 m in the river channel (Figure 4). In particular, the LWD log length on the lower reach landslide slope was nearly in the same range as the median value (12.4 m) of the standing trees obtained from the vegetation survey.
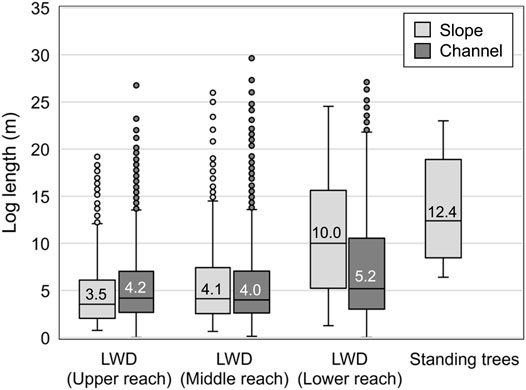
FIGURE 4. Box and whisker plots of the log lengths of the large woody debris (LWD) in the three reaches based on an orthophoto interpretation and that of the standing trees based on a vegetation survey. The line within each box indicates the median value, and the box end lines indicate the 25th and 75th percentiles. The upper and lower whiskers show the maximum and minimum values, respectively, in the range of 1.5 times the median to the quartile interval. The dots indicate outliers, and the numbers indicate the median value.
LWD Location and Deposition Rate
In this catchment, relatively few pieces of LWD remained on the landslide slope and the location of the LWD was unevenly distributed (Figure 5). Some pieces of LWD in the river channel accumulated in a complicated manner and formed logjams around the confluences of the tributaries of the upper reach and in the river channel of the middle reach. There are relatively few pieces of LWD in the upstream regions of the upper reach. Even though LWD is deposited almost evenly throughout the entire river channel in the middle reach, LWD in the lower reach is deposited at the foot of the landslide slopes and there are areas in which LWD is not deposited in the river channel.
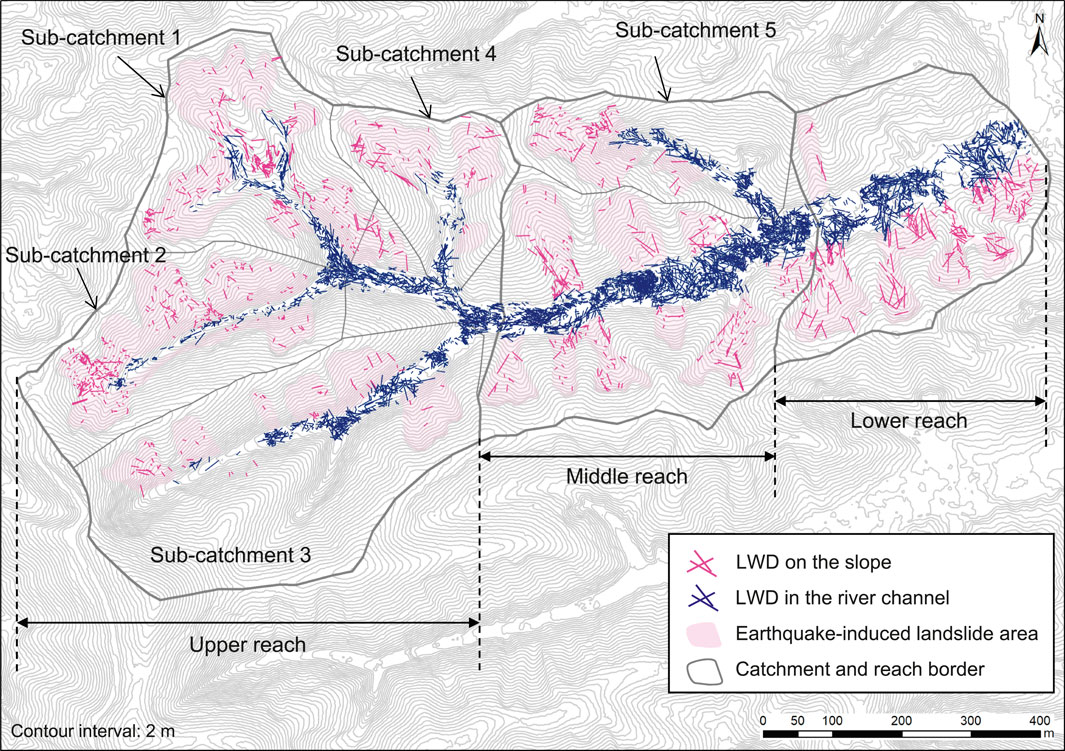
FIGURE 5. Location of LWD generated as a result of the 2018 earthquake. Pink bars indicated pieces of LWD on the stope, and navy blue bars indicate pieces of LWD in the river channel. Light pink areas indicate landslide areas induced by the earthquake.
In this study, the ratio of the number of LWD pieces deposited on slopes or in river channels to the number of LWD pieces generated at the landslide slope is defined as the LWD deposition rate (LWDDR). The number of LWD pieces around the landslide slopes and in the river channels was 5,733 compared with the estimated number of LWD pieces of 6,972 that were generated during the earthquake, making the LWDDR value 82% (the LWDDR value of the landslide slopes was 18% and that of the river channels was 64%; Figure 6A). The LWDDR value on the landslide slopes was 18% throughout the entire catchment, which means that more than 80% of the LWD moved from the slopes to the river channels (Figure 6A). This tendency at the landslide slopes is similar for the three reaches (18–19%).
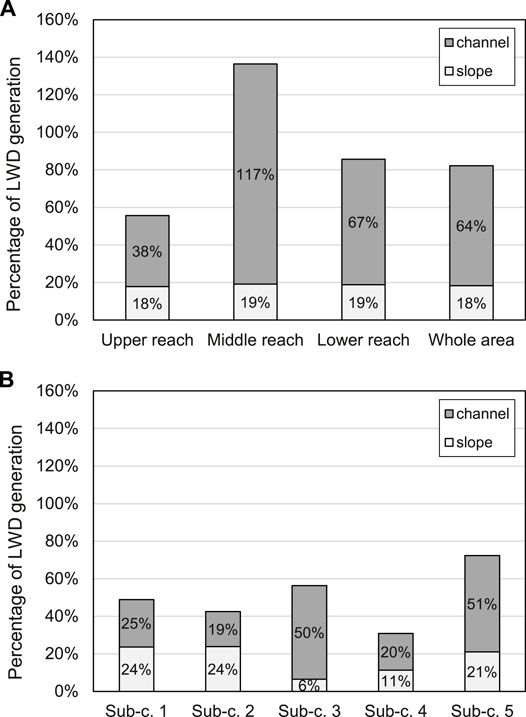
FIGURE 6. Percentage of LWD genelation (LWDDR) within each (A) reach and (B) sub-catchment.
Conversely, the LWDDR values of the river channels vary longitudinally. The LWDDR value in the river channel for the entire catchment is 64%, which is significantly different from the values of 38% for the upper reach, 100% or more for the middle reach, and 67% for the lower reach (Figure 6A). An LWDDR value of 100% or more means that the count includes pieces of LWD produced outside the reach. The LWDDR values of the five sub-catchments vary widely and is relatively small compared with the reach scale (Figure 6B).
Change in the LWD Position After the Earthquake
Comparing the LWD deposits in 2018 and 2020, no clear or drastic change in the LWD position could be confirmed throughout the entire catchment during the approximately 2 years following the earthquake, nor could any destruction of the logjams that formed longitudinally in the river channel be confirmed (Figure 7A-C). In the upper-reach sub-catchments, a few pieces of LWD that had deposited without forming a logjam disappeared or appeared 2 years after the earthquake. In sub-catchment 1, it was confirmed that the LWD that had accumulated in the river channel in 2018 was buried under sediment in 2020 (Figure 8A). In sub-catchment 2, the disappearance and new appearance (via supply from upstream or the slope) of LWD were confirmed in 2020 (Figure 8B). In sub-catchment 3, LWD submerged by the upstream flooding of a logjam was also confirmed (Figure 8C).
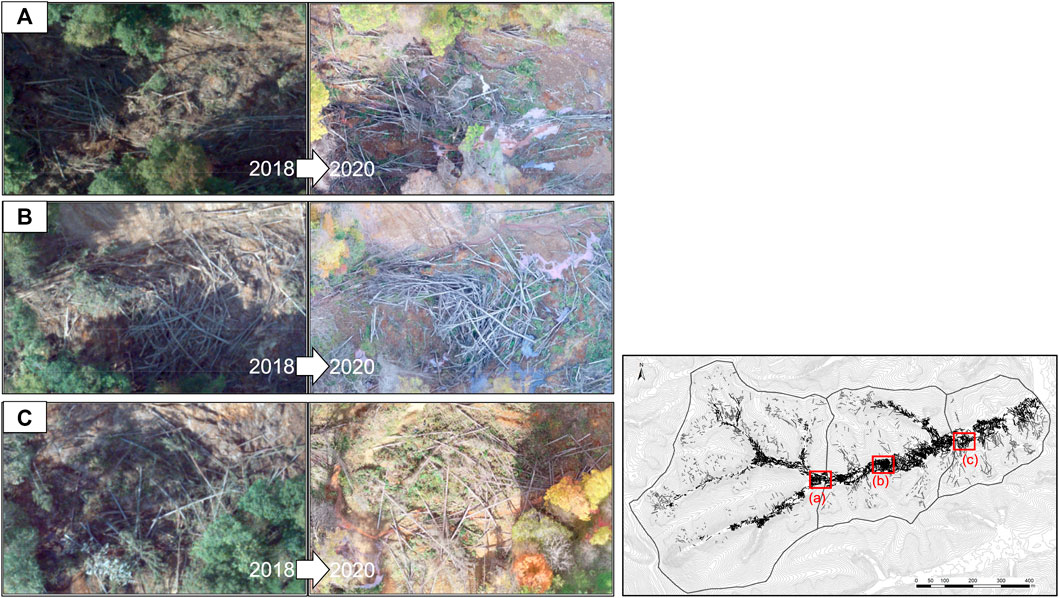
FIGURE 7. Comparison of the LWD locations along the main channel in 2018 and 2020. (A) upper reach, (B) Middle reach and (C) lower reach.
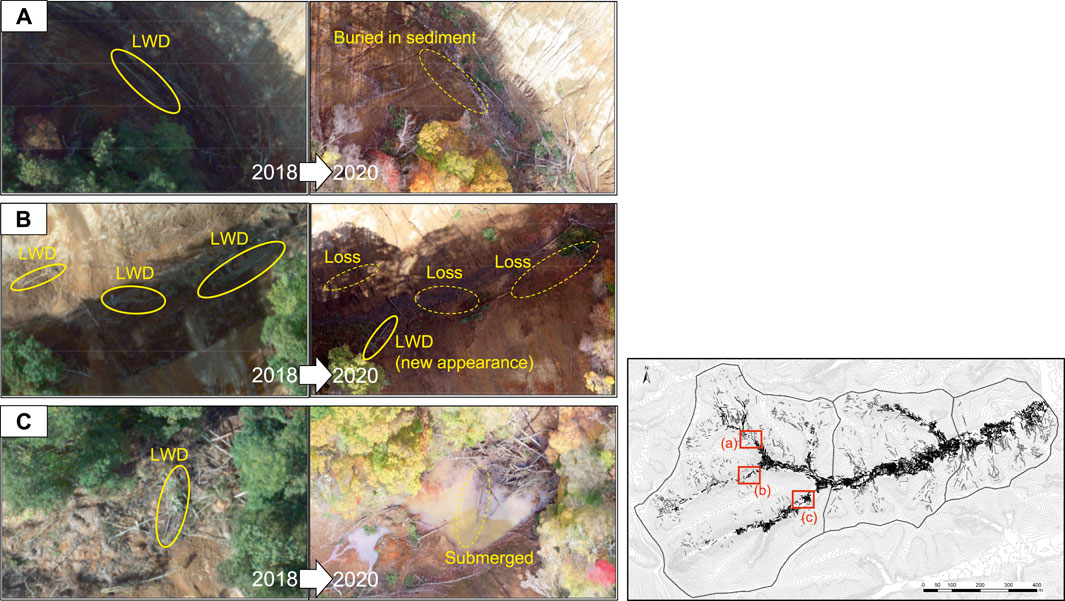
FIGURE 8. Comparison of the LWD locations in the upper stream regions in 2018 and 2020. (A) Sub-catchment 1, (B) Sub-catchment 2 and (C) Sub-catchment 3.
The above indicates that the distribution of the LWD pieces and the formation of logjams were limited to a very restricted range of the sub-catchments. The uneven distribution of the LWD deposition and the formation of logjams in the catchment were determined by the flow at the time of the landslides triggered by the earthquake, and these deposits remained as they were 2 years later with almost no relocation.
Rainfall and Discharge Two years After the Earthquake
The hourly rainfall and 24-h rainfall of events from 6 September 2018, when the earthquake occurred, to 20 October 2020, are shown in Figure 9. The largest amount of rainfall during this period was 19.5 mm h−1 (with a 24-h rainfall of 57 mm) for the 1-h rainfall on 17 August 2019, and 63 mm (with a maximum 1-h rainfall of 9.5 mm h−1) for the 24-h rainfall on 23 September 2019. We calculated the rainfall for 2-years, 10-years, 20-years, 50-years, and 100-years return periods and compared it with the maximum value of the 1-h and 24-h rainfall in the 2 years following the earthquake. We found that all the rainfall events recorded during this period were smaller than the rainfall of the 2-years return period (Figure 9). Therefore, there were no high-magnitude flood events in this catchment during the 2 years following the earthquake.
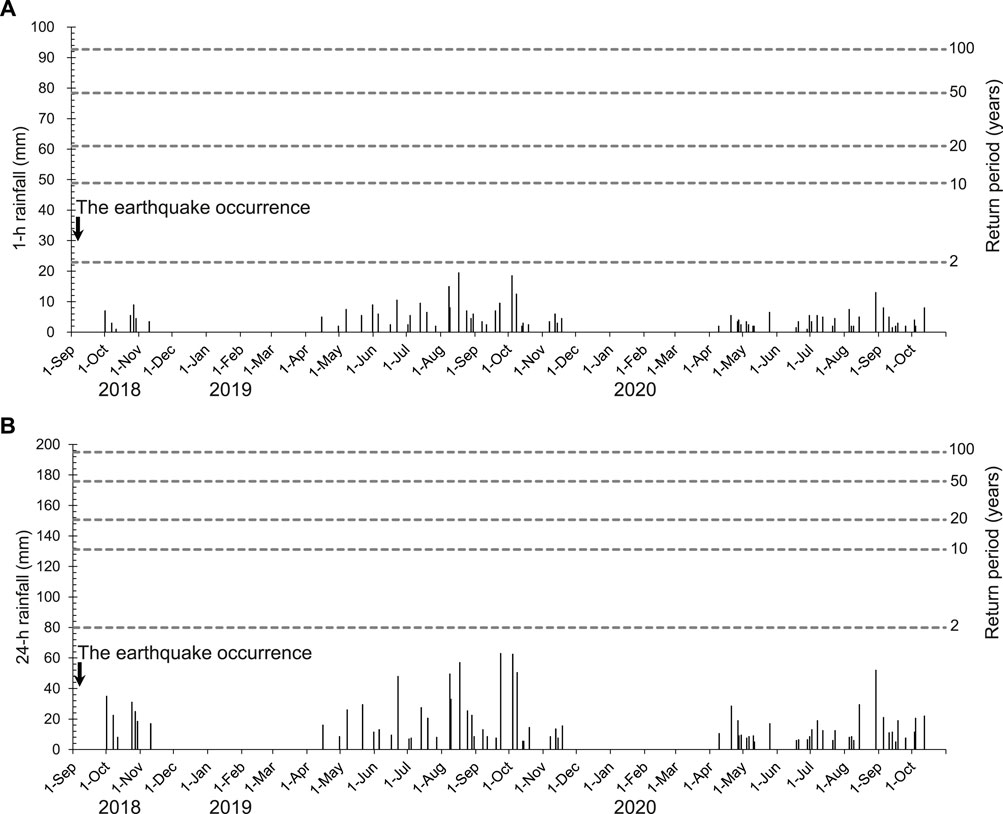
FIGURE 9. Number of actual rainfall events after the 2018 earthquake and the rainfall in various year return periods for the (A) 1-hour rainfall and (B) 24-hour rainfall.
A relatively large flood in the last 2 years occurred on 23 September 2019, with an estimated peak discharge of 46.8 m3 s−1; the normal flow depth is 0.06–0.07 m for the main channel and 0.02–0.04 m for the sub-catchment (Table 3). Pieces of LWD are removed from the riverbed (i.e., via floating) when the water depth increases and the floating limit of the LWD is exceeded (Haga et al., 2006; Ruiz-Villanueva et al., 2019). Haga et al. (2002) focused on the ratio of the h* of the water depth to the diameter of the LWD and showed that LWD travels longer distances in natural river systems when h* equals one or more. The LWD in this study is treated as having a diameter of 10 cm or more; therefore, if the water depth exceeds 10 cm, h* becomes one or more. Because the assumed normal flow depth in actual rainfall events after the earthquake is less than 10 cm, the values of h* in all three reaches did not exceed 1. The rainfall record for the 2 years following the earthquake suggests that the LWD in the study area is unlikely to float and move a long distance.
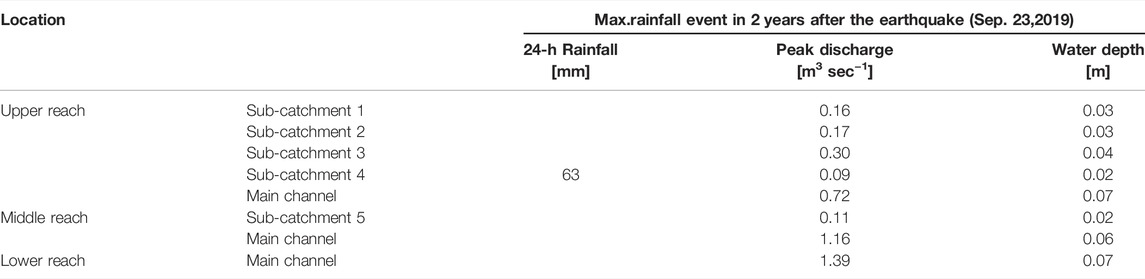
TABLE 3. Characteristics of the hydraulic quantities at the September 23,2019,event.
Discussion
LWD Budget and Dynamics During the Earthquake
In this study, the LWD generated during the earthquake was examined primarily via an orthophoto image acquired in 2020. While a few pieces of the LWD in the upstream river channel were buried in sediment and flooded ponds (Figure 7A, Figure 8A,C), the LWD position did not significantly change after the earthquake, according to a comparison with the LWD position in 2018. Therefore, the LWD position in 2020 is treated as reflecting the state of production at the time of the 2018 earthquake.
The LWDDR value of the entire catchment was estimated at 82%, and the location of the remaining 18% has not been identified. Because there appears to be almost no LWD that flowed out of the catchment, according to the field survey around the catchment outlet, the unknown LWD is likely present in the catchment. It may be that the LWD on the slope was not extracted because it is in the shadow of the standing trees on the edge of the landslide area; however, because there are almost no logjams or burial of LWD on the slope, the LWD can be extracted with higher accuracy on the slope than in the river channel. Here, assuming that the LWD on the slope was not overlooked, the amount of LWD deposition, having been estimated at 82%, must be the result of overlooked LWD in the river channel.
Some of the LWD in the river channel forms logjams, and all of the pieces of LWD inside these logjams may not be discernable in aerial photographs. Especially in the middle reach, LWD is deposited forming logjams throughout the entire main river channel, regardless of the individual landslide locations. In the middle reach, the LWDDR value in the river channel is 117%; this value is even higher if there is no overlooked LWD. In other words, the number of LWD pieces in the middle reach is larger than the production number, suggesting that the LWD generated in the upper reach flowed down through the river channel and that this LWD is included in the middle reach.
Logjams are formed by the accumulation of LWD during the process of transportation (Abbe and Montgomery, 1996). It is likely that the LWD that reached the river channel from the slope at the time of the landslides in the upper reach passed through the river channel of the steep upper reach and moved to the middle reach section, where the channel gradient is relatively gentle, and then accumulated there. This is consistent with the channel slope having become loose only in the upper reach and riverbed aggradation (up to approximately 10 m) having occurred throughout the entire middle reach section (Figure 2), as indicated by comparisons before and after the earthquake.
The LWDDR values in the four sub-catchments of the upper reach were 31–56%, and that of the middle reach was 72%, which is smaller than the LWDDR values of each reach scale, except for sub-catchment 3, which had an LWDDR value of 56% (Figure 6). This suggests that part of the LWD produced in each sub-catchment reached the sub-catchment outlet or exited it. Because LWD accumulates at tributary junctions and form logjams, most of the LWD that flowed downstream stopped around the tributary junction. Based on the longest channel length from the headwater to the tributary junction (sub-catchment 2), the LWD flowed up to approximately >200 m down the channel at the time of the earthquake occurrence.
The LWDDR value of the lower reach is 86%. The log length of the LWD in the lower reach is longer than those in the upper and middle reaches (Figure 4). In the upper and middle reaches, the driftwood length is relatively short because the LWD broke during the process of flowing with the landslide debris or was buried in the sediment when the flow stopped. Conversely, in the lower reach, the landslide debris was deposited almost directly under the landslide slope (Figure 5) and it is possible that it was not affected by damage or burial caused by the flow. Furthermore, because standing trees exist in the river channel near the catchment outlet (Figure 10D), it is thought that long-distance movement of landslide debris including LWD did not occur during the earthquake.
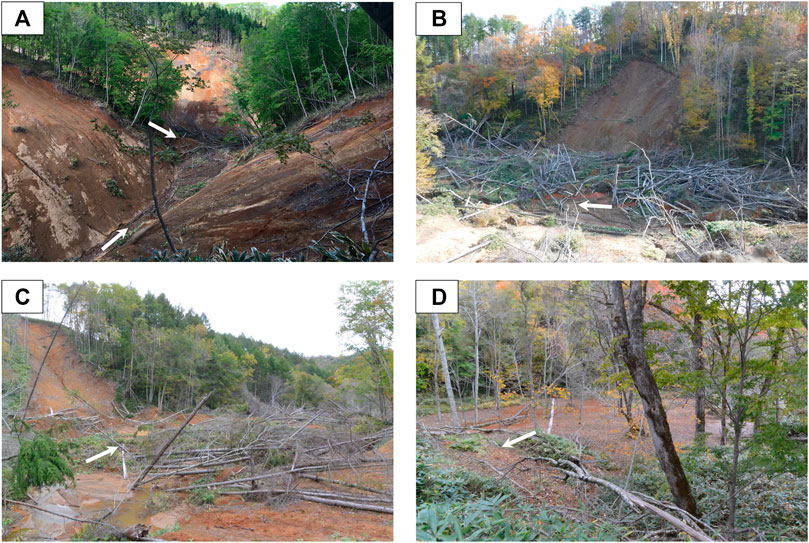
FIGURE 10. Examples of instream LWD deposition after the 2018 earthquake. (A) Logjam at the channel junction in the upper reach (photo taken on 26 March 2021). (B) Logjam at the channel junction in the middle reach (photo taken on 20 October 2021). (C) Logjam at the channel junction in the lower reach (photo taken on 11 October 2019). (D) Tree stand on the channel in the lower reach (photo taken on 14 October 2020). The arrows in each photo indicate the flow direction.
The LWD is thought to have moved up to approximately >200 m in the river channel accompanied by landslide debris in the upstream area, despite the landslides occurring without the direct involvement of rainfall. In this area, the volcanic ejecta, which is the soil layer above the sliding surface, is constantly close to saturation (Aoki et al., 2021). Soil tests conducted after the earthquake showed that the natural water content of En-a was close to the liquid limit (Osanai et al., 2019). Furthermore, the liquidity was relatively high because of the arrangement of the movement distance of the landslide debris (Osanai et al., 2019; Zhao et al., 2020). The locations and the condition of the LWD, as confirmed in this study, indicates that the landslide debris was highly fluid and moved a long distance at the time of the earthquake only in steep upper streams.
Risk Assessment and Catchment Management After LWD Generation
One condition for moving LWD downstream is that the length of the LWD be shorter than the bankfull width (Lienkaemper and Swanson, 1987). In this catchment, the LWD log length is shorter than the width of the river channel (Table 1 and Figure 4); therefore, there is a risk that the LWD will move if there is a large-scale flood in the future, transporting the LWD over long distances. We assume that the LWD moves when h* becomes one or more, based on Haga et al. (2002), and the hazard is discussed with respect to the abundance ratio of the LWD, which changes according to the assumed water depth for various rainfall magnitudes.
From the comparison of the 2018 and 2020 LWD positions, the movement of the LWD could not be clearly confirmed in the actual 2-years rainfall record (<2-years return period rainfall) after the earthquake; however, the LWD is not expected to travel long distances as a result of the average rainfall that occurs during a given year. Here, we calculated the water depths of the 2-years, 10-years, 20-years, 50-years, 100-years, and 400-years return period rainfall. When there is a large amount of preceding rainfall, the soil moisture in the catchment becomes nearly saturated up to the ground surface and Horton-type surface flows occur. Because the effect of the initial loss of rainfall is small and the runoff rate is high in such a case, the water depth when the runoff coefficient (Cf) = 1 was also estimated.
When the water depth is evaluated under normal conditions (Cf = 0.45), a water depth exceeding 10 cm was confirmed to not occur within the 2-years return period (Figure 11). In return periods of more than 10 years, the water depth exceeds 10 cm in the main channels, which is a condition for LWD to travel long distances. However, the maximum water depth is 15.1 cm at the lower reach in the 400-years return period and most of the maximum water depths are less than 15 cm. Even if floating occurs, it represents only approximately 23% of all the LWD (Figure 3) and there is no danger of movement for most of the LWD. In the five sub-catchments, it is assumed that a water depth exceeding 10 cm does not occur, even on the scale of the 400-years return period rainfall, nor does a situation in which the LWD travels a long distance.
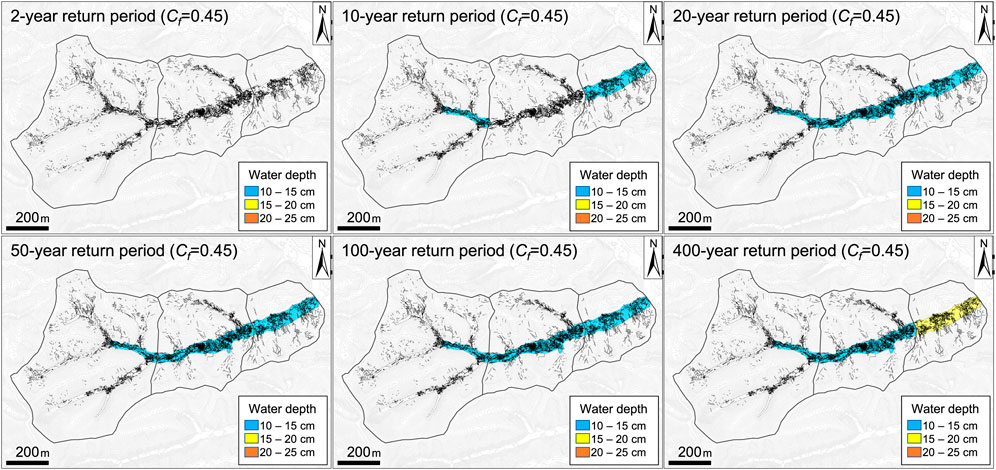
FIGURE 11. Water depths for the various year return periods at the main channel and in the upper stream areas (runoff coefficient Cf = 0.45).
Under the condition that the outflow rate of the catchment is high (Cf = 1.00), the water depth will exceed 10 cm in all main channels, even in the 2-years return period rainfall (Figure 12). Furthermore, it is estimated that a water depth of 15–20 cm can be assumed on the scale of the probability of exceeding the 10-years return period rainfall and that 35% of the LWD (Figure 3) will move a long distance in the main channel if the LWD pieces float. If the more than 50-years return period rainfall is exceeded, the water depth will reach 20–25 cm. In this case, 50% of the LWD pieces will move a long distance if floating occurs, increasing the risk of LWD transportation. In all of the sub-catchments, the water depth exceeds 10 cm for the more than 20-years return periods but the water depth is less than 15 cm and the risk is minimal, even if LWD movement occurs.
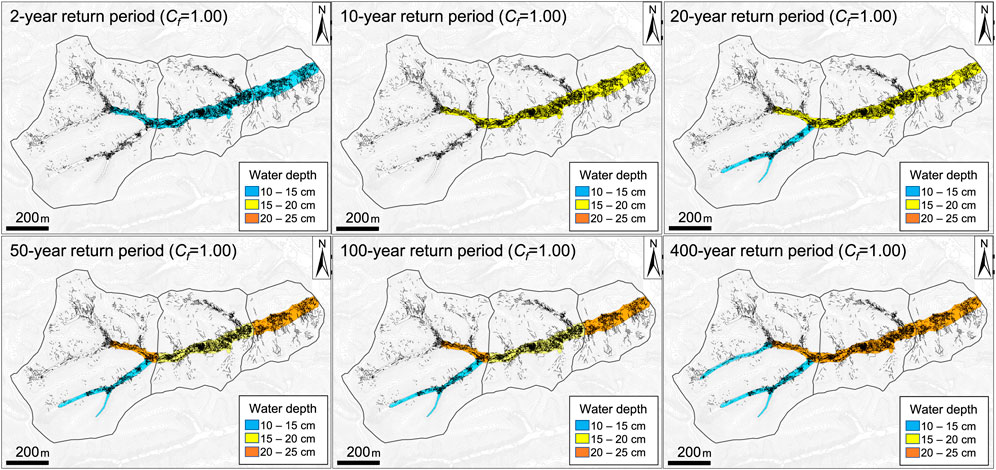
FIGURE 12. Water depths for the various year return periods at the main channel and in the upper stream areas (runoff coefficient Cf = 1.00).
However, even if the water depth is larger than the diameters of the LWD pieces, long-distance movement may not occur. Haga et al. (2002) pointed out that conditions in which the LWD are trapped by obstacles in the channel or buried in gravel also provide great bearing capacity for the LWD. In this catchment, logjams have formed at multiple locations along the river channel and some of the LWD is buried in gravel (Figure 10A–C). It is assumed that, because of the deposition and accumulation conditions of the LWD in this catchment, the LWD will not start to move even if the water depth exceeds the floating water depth limit at times of major flooding after the earthquake.
In addition, it has been found that the residence time of driftwood is 80% or more and 50 years or less, with a maximum of 1,400 years, and the longer the residence time of the LWD, the more the decay of a piece of LWD will progress (Hyatt and Naiman, 2001). The LWD supplied to the river channel is subdivided and flows downstream as it decays (Ward and Aumen, 1986; Seo et al., 2015). Even though half of the LWD pieces are expected to move along the main channel with a rainfall event of the 400-years return period (Figure 12), the risk of disaster associated with this movement may be reduced as the wood pieces are subdivided via decay over time.
The LWD did not move in the actual rainfall events in the 2 years following the earthquake. However, some pieces of LWD will likely move during rainfall events with return periods of more than 10 years and it is assumed that there is a risk that this will cause a disaster. However, the risk is smaller in the sub-catchment of the upper stream than in those of the mainstream. In other words, not all LWD in the catchment is uniformly dangerous. A method for assessing the risk associated with LWD at the catchment scale after LWD generation is shown in Figure 13. The risk is related to where and how far the LWD was transported and deposited after the landslide occurrence; therefore, risk assessments focusing on these characteristics could be effective. In addition, LWD may decay over time, reducing the disaster risk. These facts indicate that, in disaster risk assessments after LWD generation, it is necessary to examine the spatial distribution of the LWD, including logjams, and to perform zoning according to the degree of risk. These zoning results can then be used to determine locations with a higher priority for countermeasures.
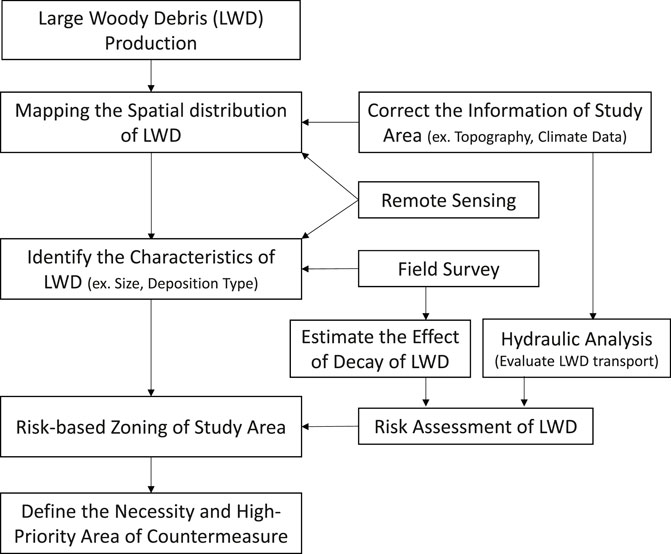
FIGURE 13. Flowchart of the methodology for LWD risk assessment after a event occurrence.
Conclusion
We examined the LWD production, movement, and deposition from landslides generated by the 2018 Hokkaido Eastern Iburi Earthquake and evaluated the future risks associated with LWD movement. Approximately 7,000 pieces (9,119 m3 km−2) of LWD were generated in this area during the earthquake, and more than 80% of these moved from the slope to the river channel. The LWD that reached the river channel stopped flowing at a maximum of 200 m or more from the upper reach to the middle reach and were accompanied by the landslide debris at the time the landslide occurred. The LWD deposited in the main river channel did not move during the 2 years following the earthquake. This was not simply because there were no high-magnitude flooding events but because logjams formed at multiple locations in the river channel and some of the LWD was buried in gravel and submerged in water ponds. Given these conditions of the LWD deposition, there is currently a low risk of the LWD relocating during future flooding. In this catchment, the uneven LWD distribution and the formation of logjams were fixed almost immediately after the landslide at the time of the earthquake; these facts are important when considering future measures. From the water depth evaluation based on the difference in the excess return period, the degree of risk differs depending on the location of the LWD deposition in the channel. This suggests tha t not all LWD in the catchment is dangerous and that risk assessments focusing on the location of the LWD can be effective. This study makes it possible to determine high priority areas for LWD treatment.
Data Availability Statement
The original contributions presented in the study are included in the article/Supplementary Material, further inquiries can be directed to the corresponding author.
Author Contributions
TK designed the study, performed the field survey and the GIS analysis, and wrote the first draft of the manuscript. NH provided ideas to refine the study and acquired the aerial survey data using a UAV. YT organized the GIS data to enable a correct analysis. SK conducted the vegetation survey and an evaluation to properly use the rainfall data. All authors contributed to improving the manuscript.
Funding
This work was supported by JSPS KAKENHI grant numbers JP18H03819 and JP18H03957, the River Fund of the River Foundation, and the project “Development of technology for impacts, mitigation and adaptation to climate change in the sectors of agriculture, forestry, and fisheries” of the Agriculture, Forestry, and Fisheries Research Council.
Conflict of Interest
The authors declare that the research was conducted in the absence of any commercial or financial relationships that could be construed as a potential conflict of interest.
Publisher’s Note
All claims expressed in this article are solely those of the authors and do not necessarily represent those of their affiliated organizations, or those of the publisher, the editors and the reviewers. Any product that may be evaluated in this article, or claim that may be made by its manufacturer, is not guaranteed or endorsed by the publisher.
Acknowledgments
We are deeply grateful to the Department of Fisheries and Forestry, Hokkaido Government, for providing the aerial survey data just after the earthquake and to the Iburi General Subprefectural Bureau, Hokkaido Government, for providing the local information materials. We thank Martha Evonuk, PhD, from Edanz (https://jp.edanz.com/ac) for editing a draft of this manuscript.
References
Abbe, T. B., and Montgomery, D. R. (1996). Large Woody Debris Jams, Channel Hydraulics and Habitat Formation in Large Rivers. Regul. Rivers: Res. Mgmt. 12, 201–221. doi:10.1002/(sici)1099-1646(199603)12:2/3<201::aid-rrr390>3.0.co;2-a
Abe, T., and Nakamura, F. (1996). Pool and Cover Formation by Coarse Woody Debris in a Small Low-Gradient Stream in Northern Hokkaido. J. Jpn. For. Soc. 78, 36–42. (in Japanese with English abstract). doi:10.11519/jjfs1953.78.1_36
Abe, T., and Nakamura, F. (1999). Effects of Experimental Removal of Woody Debris on Channel Morphology and Fish Habitat. Ecol. Civil Eng. 2 (2), 179–190. doi:10.3825/ece.2.179
Aoki, T., Katsura, S. y., Yoshino, T., Koi, T., Tanaka, Y., and Yamada, T. (2021). “Pressure Head Dynamics on a Natural Slope in Eastern Iburi Struck by the 2018 Hokkaido Earthquake,” in Understanding and Reducing Landslide Disaster Risk. WLF 2020. ICL Contribution to Landslide Disaster Risk Reduction. Editors V. Vilímek, F. Wang, A. Strom, K. Sassa, P. T. Bobrowsky, and K. Takara (Cham: Springer), 81–86. doi:10.1007/978-3-030-60319-9_7
Arcement, G. J., and Schneider, V. (1989). Guide for Selecting Manning's Roughness Coe†cients for Natural Channels and Flood plains. US Geol. Surv. Water Supply Paper 2339, 1–38. doi:10.3133/wsp2339
Asano, Y., Hoshino, S., Uchida, T., and Akiyama, K. (2012). Measuring the Flow and Manning’s Roughness Coefficient of Mountain Streams. Jpn. Soc. Erosion Control. Eng. 65, 62–68. (in Japanese with English abstract). doi:10.11475/sabo.65.1_62
Braudrick, C. A., and Grant, G. E. (2000). When Do Logs Move in Rivers? Water Resour. Res. 36 (2), 571–583. doi:10.1029/1999wr900290
Chow, V. T. (1959). Open Channel Hydraulic, International Student Edition. New York: McGraw Hill Book Company, Inc, 680.
Comiti, F., Lucía, A., and Rickenmann, D. (2016). Large wood Recruitment and Transport during Large Floods: a Review. Geomorphology 269, 23–39. doi:10.1016/j.geomorph.2016.06.016
De Cicco, P. N., Paris, E., Ruiz-Villanueva, V., Solari, L., and Stoffel, M. (2018). In-channel wood-related Hazards at Bridges: A Review. River Res. Applic 34, 617–628. doi:10.1002/rra.3300
Dixon, S. J., and Sear, D. A. (2014). The Influence of Geomorphology on Large wood Dynamics in a Low Gradient Headwater Stream. Water Resour. Res. 50, 9194–9210. doi:10.1002/2014WR015947
Fausch, K. D., and Northcote, T. G. (1992). Large Woody Debris and Salmonid Habitat in a Small Coastal British Columbia Stream. Can. J. Fish. Aquat. Sci. 49, 682–693. doi:10.1139/f92-077
Haga, H., Kumagai, T. o., Otsuki, K., and Ogawa, S. (2002). Transport and Retention of Coarse Woody Debris in Mountain Streams: An In Situ Field experiment of Log Transport and a Field Survey of Coarse Woody Debris Distribution. Water Resour. Res. 38, 1. doi:10.1029/2001WR001123
Haga, H., Sakamoto, Y., and Ogawa, S. (2006). Export of Woody Debris from Forested Headwater Catchments. Mizu Kankyo Gakkaishi 29 (4), 207–213. doi:10.2965/jswe.29.207
Hotchkiss, R. H., and Mccallum, B. E. (1995). Peak Discharge for Small Agricultural Watersheds. J. Hydraulic Eng. 121 (1), 36–48. doi:10.1061/(asce)0733-9429(1995)121:1(36)
Hyatt, T. L., and Naiman, R. J. (2001). The Residence Time of Large Woody Debris in the Queets River, Washington, USA. Ecol. Appl. 11 (1), 191–202. doi:10.1890/1051-0761(2001)011[0191:trtolw]2.0.co;2
IPCC (2014). Climate Change 2014: The Physical Science Basis. Contribution of Working Group/to the Fifth Assessment Report of the Intergovernmental Panel on Climate Change. Cambridge, United Kingdom and New York, NY, USA: Cambridge University Press, 1535.
Ishikawa, Y., Mizuyama, T., and Fukuzawa, M. (1989). Generation and Flow Mechanisms of Floating Logs Associated with Debris Flow. J. Jpn. Soc. Eros Control. Eng. 42 (3), 4–10. (in Japanese with English abstract). doi:10.11475/sabo1973.42.3_4
Kadoya, M., and Fukushima, A. (1976). Concentration Time of Flood in Small or Medium River basin. Kyoto Univ. Disaster Prev. Res. Inst. Annuals 19B, 143–152. (in Japanese with English abstract).
Kadoya, M. (1988)., 56. Japan, 1061–1065. (in Japanese, title translated by the author). doi:10.11408/jjsidre1965.56.11_1061Variety of Runoff Characteristics Due to Changes in Land Cover TypeJ. Agric. Eng. Soc.
Li, R., Wang, F., and Zhang, S. (2020). Controlling Role of Ta-D Pumice on the Coseismic Landslides Triggered by 2018 Hokkaido Eastern Iburi Earthquake. Landslides 17, 1233–1250. doi:10.1007/s10346-020-01349-y
Lienkaemper, G. W., and Swanson, F. J. (1987). Dynamics of Large Woody Debris in Streams in Old-Growth Douglas-fir Forests. Can. J. For. Res. 17, 150–156. doi:10.1139/x87-027
Lucía, A., Comiti, F., Borga, M., Cavalli, M., and Marchi, L. (2015). Dynamics of Large wood during a Flash Flood in Two Mountain Catchments. Nat. Hazards Earth Syst. Sci. 15, 1741–1755. doi:10.5194/nhess-15-1741-2015
MAFF (2018). “Annual Report on Forest and Forestry in Japan Fiscal Year 2017 (Summary),” in (Forestry Agency, Ministry of Agriculture, Forestry and Fisheries, Japan). Available at: https://www.maff.go.jp/e/data/publish/index.html#Annual (Accessed August 31, 2021).
Marutani, T., Kaibori, M., Jitousono, T., Mizuno, H., Ohno, H., Shimizu, O., et al. (2017). Sediment-related Disasters by a Heavy Rainfall in the Northern Part of Kyushu-Island, Japan in July 2017. J. Jpn. Soc. Eros Control. Eng. 70 (4), 31–42. (in Japanese with English abstract). doi:10.11475/sabo.70.4_31
Mazzorana, B., Ruiz-Villanueva, V., Marchi, L., Cavalli, M., Gems, B., Gschnitzer, T., et al. (2018). Assessing and Mitigating Large wood-related Hazards in Mountain Streams: Recent Approaches. J. Flood Risk Management 11, 207–222. doi:10.1111/jfr3.12316
Minami, N., Doi, Y., Osanai, N., Takesaki, S., Nakayama, Y., Nonaka, K., et al. (2000). Report of Woody Debris Disaster at Yosasa River on August 1998 in Tochigi Prefecture, Japan. J. Jpn. Soc. Eros Control. Eng. 53 (4), 44–51. (in Japanese with English abstract). doi:10.11475/sabo1973.53.4_44
Mizuyama, T., Ohba, A., and Manzen, H. (1985). Production and Transport of Woody Trash and Logs Associate with Debris Flow Occurrence. J. Jpn. Soc. Eros Control. Eng. 38 (1), 1–6. (in Japanese). doi:10.11475/sabo1973.38.1
Moriya, H., Nihei, Y., Hasebe, Y., Mine, K., Sushimoto, K., Yano, S., et al. (2018). Study on driftwood Disaster in Kita River, Fukuoka Prefecture, Due to 2017 Northern Kyushu Flood. Jjsce B1 74, 1195–I. (in Japanese with English abstract). doi:10.2208/jscejhe.74.I_119510.2208/jscejhe.74.i_1195
Nakamura, F., and Swanson, F. J. (1993). Effects of Coarse Woody Debris on Morphology and Sediment Storage of a Mountain Stream System in Western Oregon. Earth Surf. Process. Landforms 18, 43–61. doi:10.1002/esp.3290180104
Oka, T. (2019). Quaternary Researching the basin of Azuma River and 2018 Hokkaido Eastern Iburi Earthquake. Nagoya Univ. Chronological Res. 3, 11–22. (in Japanese with English abstract). doi:10.18999/nagubc.3.11
Osanai, N., Yamada, T., Hayashi, S.-i., Kastura, S. y., Furuichi, T., Yanai, S., et al. (2019). Characteristics of Landslides Caused by the 2018 Hokkaido Eastern Iburi Earthquake. Landslides 16, 1517–1528. doi:10.1007/s10346-019-01206-7
Piégay, H., and Gurnell, A. M. (1997). Large Woody Debris and River Geomorphological Pattern: Examples from S. E. France and S. England. Geomorphology 19, 99–116. doi:10.1016/S0169-555X(96)00045-1
Riley, S. C., and Fausch, K. D. (1995). Trout Population Response to Habitat Enhancement in Six Northern Colorado Streams. Can. J. Fish. Aquat. Sci. 52, 34–53. doi:10.1139/f95-004
Ruiz-Villanueva, V., Díez-Herrero, A., Ballesteros, J. A., and Bodoque, J. M. (2014). Potential Large Woody Debris Recruitment Due to Landslides, Bank Erosion and Floods in Mountain Basins: a Quantitative Estimation Approach. River Res. Applic. 30, 81–97. doi:10.1002/rra.2614
Ruiz-Villanueva, V., Mazzorana, B., Bladé, E., Bürkli, L., Iribarren-Anacona, P., Mao, L., et al. (2019). Characterization of wood-laden Flows in Rivers. Earth Surf. Process. Landforms 44, 1694–1709. doi:10.1002/esp.4603
Sear, D. A., Millington, C. E., Kitts, D. R., and Jeffries, R. (2010). Logjam Controls on Channel:floodplain Interactions in Wooded Catchments and Their Role in the Formation of Multi-Channel Patterns. Geomorphology 116, 305–319. doi:10.1016/j.geomorph.2009.11.022
Seo, J. I., Nakamura, F., Chun, K. W., Kim, S. W., and Grant, G. E. (2015). Precipitation Patterns Control the Distribution and export of Large wood at the Catchment Scale. Hydrol. Process. 29, 5044–5057. doi:10.1002/hyp.10473
Smith, R. D., Sidle, R. C., Porter, P. E., and Noel, J. R. (1993). Effects of Experimental Removal of Woody Debris on the Channel Morphology of a forest, Gravel-Bed Stream. J. Hydrol. 152, 153–178. doi:10.1016/0022-1694(93)90144-X
Speaker, R., Moore, K., and Gregory, S. (1984). Analysis of the Process of Retention of Organic Matter in Stream Ecosystems. SIL Proc. 22, 1835–1841, 1922-2010. doi:10.1080/03680770.1983.11897582
Thompson, D. M. (1995). The Effects of Large Organic Debris on Sediment Processes and Stream Morphology in Vermont. Geomorphology 11, 235–244. doi:10.1016/0169-555x(94)00064-x
Tsunetaka, H., Mtibaa, S., Asano, S., Okamoto, T., and Kurokawa, U. (2021). Comparison of Length and Dynamics of wood Pieces in Streams Covered with Coniferous and Broadleaf Forests Mapped Using Orthophotos Acquired by an Unmanned Aerial Vehicle. Prog. Earth Planet. Sci. 8, 22. doi:10.1186/s40645-021-00419-6
Ward, G. M., and Aumen, N. G. (1986). Woody Debris as a Source of Fine Particulate Organic Matter in Coniferous Forest Stream Ecosystems. Can. J. Fish. Aquat. Sci. 43, 1635–1642. doi:10.1139/f86-202
Wohl, E., and Goode, J. R. (2008). Wood Dynamics in Headwater Streams of the Colorado Rocky Mountains. Water Resour. Res. 44, W09429. doi:10.1029/2007WR006522
Zhang, S., Li, R., Wang, F., and Iio, A. (2019). Characteristics of Landslides Triggered by the 2018 Hokkaido Eastern Iburi Earthquake, Northern Japan. Landslides 16, 1691–1708. doi:10.1007/s10346-019-01207-6
Keywords: large woody debris, shallow landslide, catchment management, disaster mitigation, risk assesment, the 2018 Hokkaido Eastern Iburi earthquake
Citation: Koi T, Hotta N, Tanaka Y and Katsura S (2022) Generation and Subsequent Transport of Landslide-driven Large Woody Debris Induced by the 2018 Hokkaido Eastern Iburi Earthquake. Front. Earth Sci. 9:769061. doi: 10.3389/feart.2021.769061
Received: 01 September 2021; Accepted: 31 December 2021;
Published: 23 March 2022.
Edited by:
Chong Xu, Ministry of Emergency Management, ChinaReviewed by:
Qiang Zou, Institute of Mountain Hazards and Environment (CAS), ChinaQingxiang Meng, Hohai University, China
Xiaoyi Shao, China Earthquake Administration, China
Copyright © 2022 Koi, Hotta, Tanaka and Katsura. This is an open-access article distributed under the terms of the Creative Commons Attribution License (CC BY). The use, distribution or reproduction in other forums is permitted, provided the original author(s) and the copyright owner(s) are credited and that the original publication in this journal is cited, in accordance with accepted academic practice. No use, distribution or reproduction is permitted which does not comply with these terms.
*Correspondence: Takashi Koi, a29pQGNlbi5hZ3IuaG9rdWRhaS5hYy5qcA==