 R. He1,2
 L. He
L. He L. Ren
- 1MOE Key Laboratory of Deep Earth Science and Engineering, Sichuan University, Chengdu, China
- 2College of Architecture and Environment, Sichuan University, Chengdu, China
- 3Down-Hole Operating Company, CNPC Chuanqing Drilling and Exploration Engineering Co., Ltd, Chengdu, China
Insight into the difference between the mechanical properties of rocks at low and in situ deep reservoir temperatures is vital for achieving a better understanding of fracking technologies with supercritical CO2 and liquid nitrogen. To address this issue, the fracking-related mechanical properties of the Shaximiao Formation sandstone (SS) were investigated through direct tension, uniaxial compression, and three-point bending fracture tests at a typical low temperature (Tlow) of −10°C and a reservoir temperature (Tin situ) of 70°C. The results showed that the tensile strength σt, compressive strength σc, and fracture toughness KIC of the SS were all higher at Tlow than at Tin situ, although to different extents. The KIC of the SS increased slightly more than σt at the lower temperature, while both σt and KIC of the SS increased significantly more than σc at the lower temperature. In addition to the strength, the stiffness (particularly the tensile stiffness) and the brittleness indices of SS were similarly higher at Tlow than at Tin situ. In situ monitoring using the digital image correlation technique revealed that a highly strained band (HSB) always appeared at the crack front. However, because of the inhomogeneous microstructure of the SS, the HSB did not always develop along the line connecting the notch tip to the loading point. This was a possible cause of the highly dispersed KIC values of the SS. The HSB at the crack front was notably narrower at Tlow than at Tin situ, suggesting that low temperatures suppress the plastic deformation of rocks and are therefore beneficial to reservoir stimulation.
Introduction
Tight sandstone gas is widely distributed across China, with favorable exploration zones totaling 32 × 104 km2 in area (Jia et al., 2012). Tight gas sandstone reservoirs are known to have limited or essentially no natural productivity. Hydraulic fracturing is therefore widely applied to stimulate tight gas sandstone reservoirs to enhance their gas production. However, this common fracturing technique requires an extremely large amount of water and causes severe environmental pollution (Gallegos et al., 2015; Thomas et al., 2019). Low water-consuming, pollution-free, and high-efficiency fracturing techniques that can be used to stimulate unconventional hydrocarbon reservoirs are highly desirable. In response, some new water-free fracturing techniques have been developed. Of these, supercritical CO2 fracturing (Wang et al., 2012; Middleton et al., 2015) and liquid nitrogen (LN2) fracturing (Cai et al., 2014; Huang et al., 2020) are the most representative techniques. For these two methods, the contacts between low-temperature fluids and reservoir rocks form low-temperature zones within reservoirs, and during the fracturing process, some rocks are in fact fracked in a low-temperature frozen state and thus develop cracks (Zhang et al., 2018). Therefore, insight into the mechanical properties of rocks at low temperatures is of great significance for a better understanding and implementation of stimulation methods with low-temperature liquids.
The effects of temperature on the mechanical properties of rocks have been extensively investigated. For example, through a series of mechanical tests at temperatures ranging from 20 to 1,200 °C, Wu et al. (2013) found that a temperature increase significantly affected the mechanical performance of a sandstone by reducing both its compressive strength and static Young’s modulus. Rao et al. (2007) examined a sandstone through Brazilian disk, axial compression, and three-point bending (3 PB) tests at different temperatures. They found that the tensile strength, uniaxial compressive strength, and elastic modulus of the sandstone each increased linearly with increasing temperature below a certain threshold (200 or 250°C) and decreased with increasing temperature beyond the threshold. Guo et al. (2020) investigated the effects of heat treatment on the physical and mechanical properties of a shale and found an increase in the uniaxial compressive strength with an increase in the temperature at which the heat treatment was performed. Justo and Castro (2021) analyzed the mechanical properties of four isotropic rocks (a sandstone, a limestone, and two marbles) at various temperatures ranging from room temperature to 250°C and found that both the uniaxial compressive strength and elastic modulus of each rock generally decreased as the temperature increased. The brittleness of a rock was also found to vary with temperature (Sha et al., 2020). For example, through triaxial compression tests at high temperatures, Ding et al. (2016) determined that a temperature increase gradually decreased the brittleness of a sandstone but increased its ductile behavior. Liu and Xu (2015) studied the physical and mechanical properties of granite and sandstone specimens treated at high temperatures and observed a brittle–ductile transition in each specimen as the temperature increased. The evidence suggests that the thermal environment plays an important role in controlling rock brittleness.
Compared to the abovementioned research on the effects of high temperatures, the investigation of the effects of low temperatures on the mechanical properties of rocks is inadequate. Zhong et al. (2019) analyzed a saturated coarse-grained sandstone through uniaxial compression tests at temperatures ranging from 20 to −30°C and found that a temperature decrease led to a continual increase in the elastic modulus and uniaxial compressive strength of the sandstone and a continual decrease in Poisson’s ratio. Xu et al. (2006) investigated the uniaxial and triaxial compressive mechanical properties of a Jiangxi red sandstone and a Hubei shale and found that temperature affected the two rocks to different extents. Specifically, temperature decreases basically increased both the uniaxial compressive strength and elastic modulus of each rock but had more significant impacts on the red sandstone than on the shale. Wang et al. (2016) examined the effects of temperatures ranging from −10 to 20°C on the splitting strength of a rock. They found that under certain circumstances, a temperature decrease increased the tensile strength. However, below a critical temperature, a temperature decrease reduced the tensile strength. In addition, the critical temperature was not fixed but rather depended on factors such as the moisture content. Ashrafi et al. (2020) studied the variation in the uniaxial strength values of three rocks (i.e., a granite, a red travertine, and a walnut travertine) at temperatures ranging from −30 to 30°C. While a temperature decrease increased the uniaxial compressive strength of each rock, the highest rate of increase in the uniaxial compressive strength was observed in the granite. Other researchers (Tang et al., 2010; Pang et al., 2015; Zhang et al., 2016; Song et al., 2019) have examined the low-temperature mechanical properties of rocks and confirmed that physical and mechanical properties at low temperatures differ notably from those at normal and high temperatures.
Crack propagation in rocks is the crux of reservoir fracturing and stimulation. Therefore, in addition to investigating the effects of temperature on their strength and deformation behavior, focusing on the effects of temperature on crack propagation behavior in rocks is necessary. Zuo et al. (2008) analyzed the mesoscale fracture characteristics of a sandstone at temperatures ranging from 25 to 300°C and found that an increase in the temperature from 25 to 150°C led to a greater fracture toughness but that a further increase from 150 to 300°C resulted in a lower fracture toughness of the sandstone. Therefore, 150°C was the critical temperature for the variation in fracture toughness. Yin et al. (2015) reported that a temperature increase from 25 to 800°C resulted in a continual decrease in the fracture toughness of a granite, although its extent varied. Feng et al. (2017) found an increase in the fracture toughness of a sandstone as the temperature increased from 20 to 100°C, followed by a gradual decrease and a significant decrease as the temperature increased from 100 to 500°C and from 500 to 800°C, respectively. Other researchers (Funatsu et al., 2004; Rao et al., 2007; Mahanta et al., 2016; Chandler et al., 2017) have similarly reported that temperature has a significant impact on the fracture toughness of rocks. However, most studies tend to focus on the effects of high temperatures on the fracture properties of rocks, while few investigate the effects of low temperatures. It is difficult to design targeted reservoir stimulation processes based on supercritical CO2 and LN2 fracturing techniques without a clear understanding of the difference in the crack propagation behavior of reservoir rocks at in situ and low temperatures.
In this study, the difference between the mechanical properties of rocks at in situ deep reservoir temperatures and under low-temperature fracking conditions was comprehensively analyzed, providing some important results for future low-temperature liquid fracking practices in the study area. Specifically, a series of direct tension, uniaxial compression, and 3 PB fracture tests were conducted on the Shaximiao Formation sandstone (SS) at the reservoir temperature (Tin situ) (70°C) at a depth of 2000 m and at a typical low temperature (Tlow) (−10°C) encountered in low-temperature reservoir fracturing. The effects of Tin situ and Tlow on the mechanical (i.e., tensile and compressive) and fracture properties of the SS were investigated. In addition, the correlation between the tensile strength and fracture toughness of the SS was examined. For the 3 PB fracture tests, the digital image correlation (DIC) technique was adopted to monitor the crack propagation process of each specimen under subzero and reservoir temperatures. To accurately calculate the fracture toughness of the SS at each temperature, two crack modes—U-shaped notches and ideal cracks—in the specimens were assumed in this work. Moreover, through a comparative analysis, the fracture toughness of the SS at each temperature was determined. Based on the results of the direct tension and uniaxial compression tests, four methods considering the tensile and compressive strength of a given rock were used to calculate the brittleness of the SS at Tlow (−10°C) and Tin situ (70°C).
Experiments
Material and Samples
The investigated sandstone was taken from an outcrop of the Lower Shaximiao (J2s1) Member. The outcrop is located in the Wangcang area (Figure 1), Sichuan Basin, China. The mineralogical composition of this rock was determined by X-ray diffraction analysis, which indicated that the main mineral components of this type of sandstone are quartz (22 wt%), albite (20 wt%), illite (36 wt%), montmorillonite (18 wt%), and clinochlore (4 wt%). Additionally, as revealed in Figure 1, the tested sandstone seemed continuous and homogeneous under visual inspection and was therefore treated as an isotropic rock for simplification.
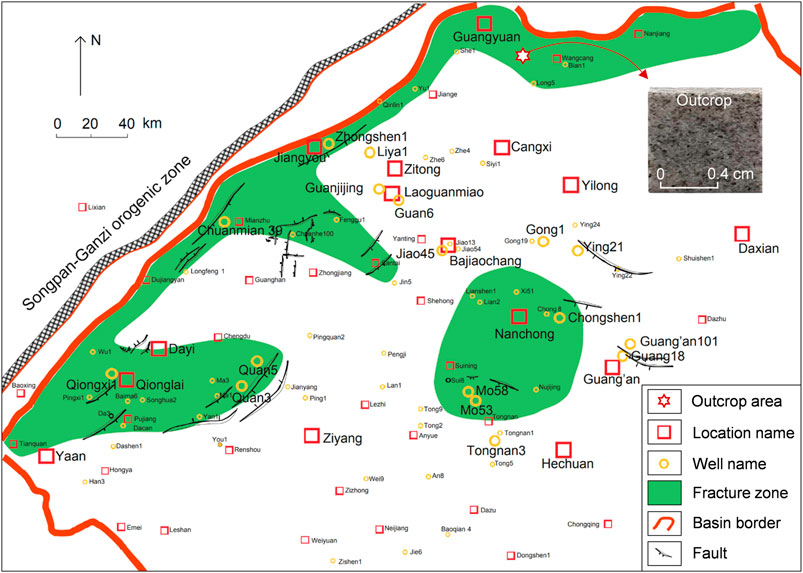
FIGURE 1. Outcrop area and the sandstone studied in this paper (after (Jiang et al., 2009))
Single-edge notched beam (SENB) specimens, as shown in Figure 2A, were used in the 3 PB tests. Each SENB specimen was 39 mm in length (L), 20 mm in height (h), and 8 mm in thickness (b), with a prefabricated crack 8 mm in length (a). All the SENB specimens were polished to reach a roughness within ±0.05 mm on each surface. Unlike in metallic materials, in rock materials, producing perfect crack tips through the fatigue precracking process is very difficult. Therefore, we used a wire saw with a diameter ≤0.3 mm to prefabricate cracks. A group of three specimens was tested at each temperature; that is, a total of six SENB SS specimens were analyzed. Dog bone-shaped specimens, as shown in Figure 2B, were used in the direct tension tests. Each specimen had a total length (L) of 40.90 mm, with two shoulders that were 15, 2.4, and 3 mm in height (H), length (a), and thickness (b), respectively, and a middle tensile section 5 and 10 mm in height 8) and length (L), respectively. In addition, the radius (R) of the arc at the junction of each shoulder and the middle tensile section was 10.5 mm. Square specimens, each of which was 8, 8, and 3 mm in length (L), height (h), and thickness (b), respectively, as shown in Figure 2C, were used in the uniaxial compression tests. Similar to the 3 PB tests, the direct tension and uniaxial compression tests analyzed one group of three specimens at each temperature in each set of tests.
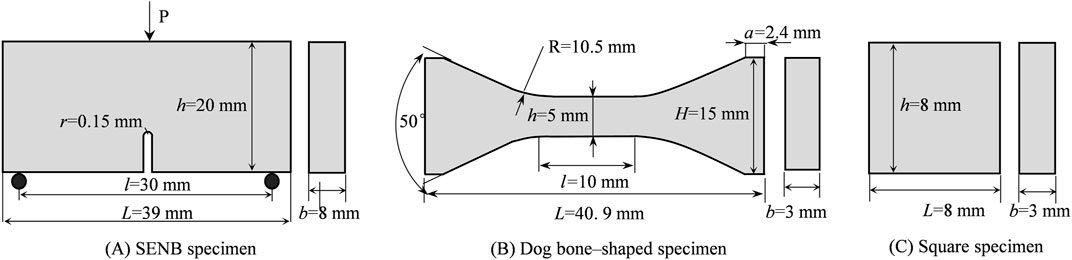
FIGURE 2. Specimen configurations employed in this study.
Procedures
All the tests were completed using the μTS meso scale universal load frame (as shown in Figure 3) at the Key Laboratory of Deep Earth Science and Engineering (Sichuan University), Ministry of Education of China. With a maximum loading force of 4.5 kN, a maximum loading rate of 40 mm/s, a load resolution of 140 mN, a displacement resolution of 5 nm, and a temperature range of −40–200°C in its temperature chamber, this load frame achieves heating and cooling through flow fields; specifically, the apparatus has a high-temperature circulating flow field and a circulating LN2 flow field. Its temperature accuracy and stability are less than 0.5°C. Integrated with a high-flow blower, the system can ensure even heating of each area on the surface of the specimen. In this study, during the test process, the specimen was first cooled to −10°C or heated to 70°C and then loaded in a displacement loading mode. The loading rate was set to 2 × 10⁻⁷ m/s for both the 3 PB and direct tension tests and to 4 × 10⁻⁷ m/s for the compression tests. During each test, the applied load and the load-line displacement were continuously recorded at a system sampling frequency of 100 Hz.
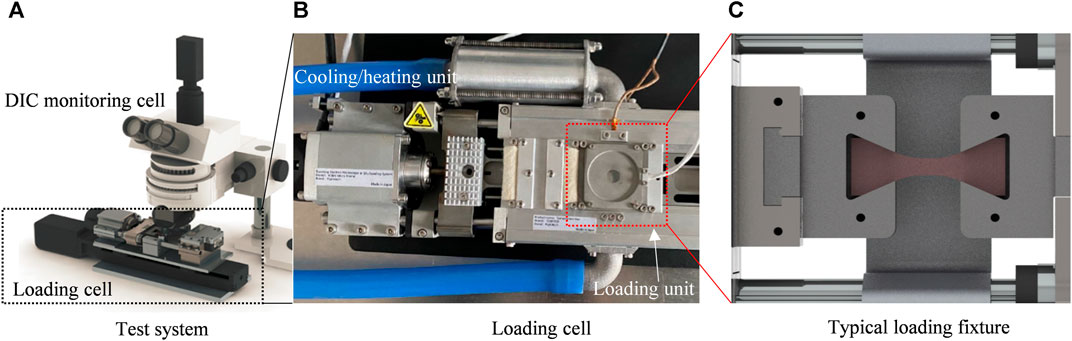
FIGURE 3. Loading device employed in this study.
Results and Analysis
Tensile and Uniaxial Compressive Failure Behavior
As mentioned above, temperature has a significant impact on the tensile mechanical properties of rocks. For example, Lü et al. (2017) observed a continual decrease in the tensile strength σt of a sandstone as the temperature increased from 25 to 300°C and attributed this phenomenon to an increase in the sandstone porosity due to the escape of free and bound water. Inada and Yokota (1984) discovered that pore water in a rock specimen underwent a phase change at a negative ambient temperature, which in turn increased its tensile strength.
All the specimens used in this study were retrieved from natural sandstone outcrops. Table 1 summarizes the test results. The average σt values of the SS were 4.67 and 3.43 MPa at Tlow (−10°C) and Tin situ (70°C), respectively. These results suggest that a low-temperature fluid used to fracture and stimulate a reservoir significantly increases the σt of reservoir rocks. The σt of the SS was approximately 36.09% higher at Tlow (−10°C) than at Tin situ (70°C). An opposite phenomenon was observed by Aoki et al. (1990) in tests of rocks such as mudstone and granite. Specifically, they discovered that σt for each rock remained basically unchanged in the temperature range from −40°C to normal temperature but was much higher at an extremely low temperature (−160°C) than at −40°C. Low temperatures indeed seem to improve the σt of rocks, but this effect depends on rock properties (e.g., lithology and pore water). Figure 4 shows the direct tension load–displacement curves for two SS specimens tested at the two temperatures. At the initial loading stage, the stress–load curves for the two specimens basically coincide with each other. However, as the loading process proceeded, the slope of the load–displacement curve for the specimen tested at Tlow (−10°C) became significantly greater than that for the specimen tested at Tin situ (70°C). In other words, Tlow (−10°C) significantly increased the tensile stiffness of the SS.
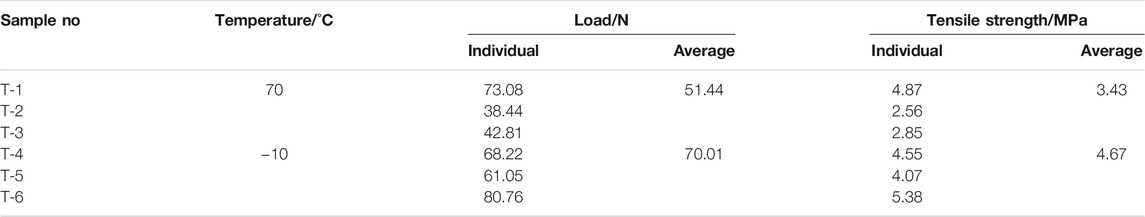
TABLE 1. Testing values of tensile strength.
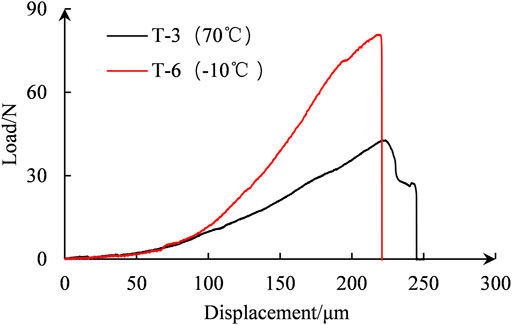
FIGURE 4. Load–displacement curves from direct tension tests.
Figure 5 shows two typical uniaxial compressive stress–strain curves for the SS, and Table 2 summarizes the compressive strengths under different temperature conditions. At the initial loading stage, notable compaction occurred in each SS specimen, and the temperature had a relatively strong impact on its stress–strain curve. As the loading process continued, the axial stress and strain exhibited a nearly linear relationship, and the slope of the stress–strain curve for the specimen tested at Tlow (−10°C) was slightly greater than that for the specimen tested at Tin situ (70°C). In fact, Figure 5 clearly illustrates that the compressive stiffness of the SS was higher at Tlow (−10°C) than at Tin situ (70°C). However, the effects of temperature on the compressive stiffness of the SS were not as significant as those on its tensile stiffness.
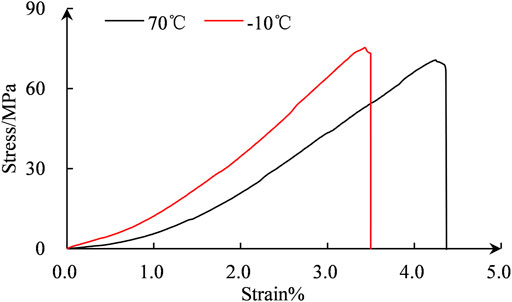
FIGURE 5. Axial stress–strain curves of sandstone under different temperature conditions.

TABLE 2. Testing values of compressive strength.
Brittleness Indices
Assessing the brittleness of rocks is vitally important for developing unconventional hydrocarbon resources. Brittleness indices can be used to quantify the brittleness of rocks and, on this basis, characterize their fracability (He et al., 2016). However, due to the lack of a standard definition and measurement methods for rock brittleness, researchers have established various brittleness indices for specific practical applications. The various definitions to describe rock brittleness are based on the mineral composition (Mathia et al., 2016; Zhang et al., 2017), elastic modulus (Zhang et al., 2016), σc and σt (He et al., 2016), hardness (Lawn and Marshall, 1979), and crack initiation stress of the rock (Wang et al., 2017). In this study, because most of the collected data were related to the strength properties of the SS at the two selected temperatures, we calculated four σt- and σc-based brittleness indices (Hucka and Das, 1974; Altindag, 2010) for the SS, as shown below:
Table 3 summarizes the values of the SS brittleness indices at Tin situ (70°C) and Tlow (−10°C), which were calculated using Eqs. 1–4. The values of all four brittleness indices were calculated based on the σc and σt of the SS but did not agree, as shown in Table 3. The values of B1 and B2 calculated for Tin situ (70°C) were higher than those calculated for Tlow (−10°C). An opposite pattern was found for B3 and B4. That is, the values of B1 and B2 calculated for the two temperatures suggest that Tlow (−10°C) does not increase the brittleness of the reservoir sandstone. In contrast, the calculated values of B3 and B4 indicate that the reservoir sandstone becomes more brittle at Tlow (−10°C). Evidently, the brittleness of the SS at the two temperatures calculated using Eqs. 3, 4 runs counter to the conventional understanding. The brittleness of the SS was indisputably higher at Tlow (−10°C) than at Tin situ (70°C). In fact, according to the forms of Eqs. 1, 2, B1 is the σc/σt ratio, and B2 can be fully expressed in terms of B1. A temperature decrease from Tin situ (70°C) to Tlow (−10°C) leads to a significant increase in σt, which in turn results in decreases in both B1 and B2. This means that these two indices cannot reasonably reflect the SS brittleness at Tin situ (70°C) and Tlow (−10°C). On the other hand, B3 and B4 are calculated based on the product of σc and σt of a rock. If both σc and σt of a rock increase at low temperatures, B3 and B4 will inevitably increase. Therefore, these two indices can satisfactorily reflect the effects of temperature on the brittleness of the SS. Rock brittleness has been considered an important geomechanical parameter among the petrophysical-geomechanical factors for stimulating unconventional reservoirs (Romanson et al., 2011). Under similar crustal stress conditions (and other environmental conditions: temperature, pore pressure, etc.), brittle rocks usually fracture more easily than ductile formations. That is, if there is no substantial difference in the tectonic stress between different strata, the degree of fracture development depends on the brittleness characteristics of the reservoir rock. The above results further show that the SS is much more brittle at low temperatures than at the in situ deep reservoir temperature, so low temperatures should be highly beneficial to reservoir fracturing.
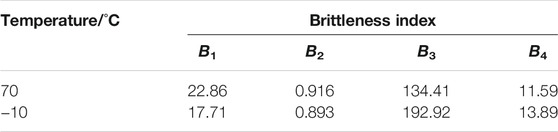
TABLE 3. Brittleness indices of sandstone at different temperatures.
The compression test results showed that the σc values were 78.38 and 82.66 MPa at Tin situ (70°C) and Tlow (−10°C), respectively. This means that when the temperature decreased from Tin situ (70°C) to Tlow (−10°C), σc of the SS increased by only 5.46%, which was much smaller than the increase in σt, suggesting different effects of temperature on σt and σc of the SS. While σc of a rock is significantly affected by temperature and, in most cases, varies in a pattern similar to that of σt, σt and σc vary to different extents at different temperatures (Gautam et al., 2018; Sha et al., 2020). This explains why the brittleness values for the SS at Tlow (−10°C) and Tin situ (70°C) calculated using Eq. 4 differed. This phenomenon does conform to the conventional understanding.
Fracture Properties Under Typical Temperature Conditions
Progressive Failure Behaviors
Figure 6 shows the load–displacement curves obtained from the 3 PB tests conducted at the two temperatures. Note that the load–displacement curve of each SS specimen can be roughly divided into four segments corresponding to the initial loading stage, elastic stage, damage accumulation stage, and postpeak stage. During the initial loading stage, the slope of the curve increased as the displacement increased. As a result, the curve displays a concave shape, reflecting a notably nonlinear behavior. This phenomenon can be attributed to two factors. 1) The internal structure of the SS was inhomogeneous. 2) During the test process, the SS at the notch was in a tensile state. As a result, microcrack closure under uniaxial compression can no longer be used to explain the changes in the SS. During the second stage (i.e., elastic stage), the slope of the curve basically remained constant. As the external load continued to increase, the SS near the notch tip began to sustain damage, which gradually accumulated over time and eventually led to inelastic deformation. Under these conditions, the load–displacement curve is no longer linear. In addition, before the external load peaks, there is a rapid decrease in the slope of the curve and a rapid increase in the extent of the damage sustained by the specimen. The curve displays a convex shape. The duration of this stage was relatively short because of the high brittleness of the SS. During the fourth stage (i.e., postpeak failure stage), as the loading process proceeded, the external load decreased rapidly until the specimen completely failed. Moreover, as shown in Figure 6, while the load–displacement curves obtained at the same temperature are to some extent dispersed, the maximum loads withstood by the specimens were higher at Tlow (−10°C) than at Tin situ (70°C). Specifically, the average maximum loads withstood by the specimens at Tlow (−10°C) and Tin situ (70°C) were 212.84 and 159.18 N, respectively, which is a 25.21% difference.
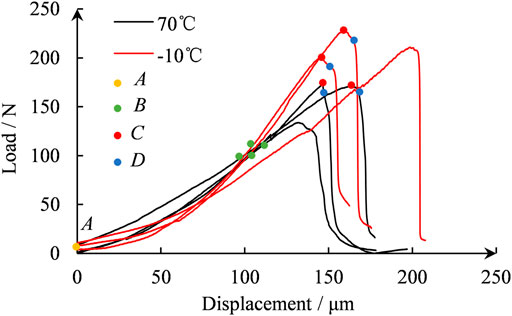
FIGURE 6. Load–displacement curves of three-point bending samples.
Through in situ DIC measurements, the maximum principal strain field around the notch tip was determined, as shown in Figure 7. Regardless of the temperature, as the loading process proceeded, a highly strained band (HSB) appeared at the notch tip and reached its maximum width before the load peaked. In other words, before the notch began to expand, the material first sustained damage at the notch tip, which gradually developed as the loading process proceeded. Consequently, the overall stiffness of the specimen gradually decreased, resulting in the aforementioned concave segment of the load–displacement curve. Afterward, a crack appeared at the notch tip and rapidly propagated along the HSB toward the loading point. A notable change was also observed in the strain field captured using the DIC technique. The HSB at the notch tip disappeared. A comparison of the HSB sizes at the peak loads revealed that the HSB (or damage zone) was significantly narrower at −10°C than at 70°C, suggesting that the temperature decrease shrank the damage zone and lowered the dissipation of energy before the crack propagated through the SS and therefore led to more notable brittle failure behavior. The DIC measurements revealed a marked progressive damage process. Further analysis is required to determine whether the methods of linear elastic fracture mechanics can be directly used to calculate the fracture toughness of the SS examined in this study.

FIGURE 7. Evolution of the maximum principal strain field ahead of a notch tip at different temperatures (A–D correspond to the starting point of the load–displacement curve, a certain point during the elastic stage, the peak load point, and the point at which the load began to decrease rapidly, respectively).
Fracture Toughness
A crack front prefabricated in a rock material is not a sharp crack tip in a mathematical sense. However, a sufficiently narrow notch can to some extent be viewed as an ideal crack. In fact, this is an implicit assumption often made in rock fracture mechanics research (Ren et al., 2016; Chandler et al., 2017; Luo et al., 2017; Shi et al., 2019; Li et al., 2021). The mode I fracture toughness KIC of a SENB specimen can be calculated using the equation recommended by (Liu, 1994):
where l is the distance between the two supporting pins and Pmax is the maximum load during the test.
In fact, preparing ideal cracks in rock materials by cutting is impossible. In other words, the crack prefabricated in this study was in fact a U-shaped notch, whose radius of curvature was, however, very small (only 0.15 mm). The fracture failure of a specimen with a U-shaped notch occurs along the bisector of the notch (Cicero et al., 2015). The global criterion is unsuitable for analyzing strength problems related to stress concentration and gradients caused by geometric discontinuities (e.g., voids and notches) in components. Instead, these problems can be more reasonably analyzed through nonlocal theory (Nui et al., 1994; Pluvinage, 1998). The average stress at a U-shaped notch is obtained by dividing the integral of the opening stress along the bisector of the notch (calculated using Eq. 6) by the length dc of the fracture process zone (FPZ) (calculated using Eq. 7) (Gómez et al., 2006). An average stress equivalent to the rock σt causes crack propagation. In this way, a fracture criterion that incorporates two material parameters, namely, σt and KIC, can be derived (Gómez et al., 2006) as in Eq. 8:
where Kt = σmax/σnom, tip is the stress concentration coefficient, σmax is the maximum stress at the stress concentration site and ρ is the radius of curvature at the tip of the U-shaped notch of the specimen. Based on the specimen dimensions used in this study, Kt was calculated by the finite element method to be 2.53. If (1) h—a >> ρ and dc and (2) ρ and dc are of the same order of magnitude, Eq. 8 can be further simplified to
The use of Eqs. 5, 7, 9 to calculate the KIC of a rock specimen requires that P be replaced by the maximum load Pmax recorded during the fracture test and that parameters such as the geometric dimensions of the rock specimen, the distance between the supporting pins, and the σt of the rock specimen be substituted into the equations. The KIC values calculated using Eqs. 5, 7, 9 are denoted by K0IC, K1IC, and K2IC, respectively.
Table 4 summarizes the results and shows that the KIC values for the SS calculated using Eqs. 5, 8 were in relative agreement and were both lower than those calculated using Eq. 9. These results suggest that the prefabricated U-shaped notch in a rock specimen can to some extent be simplified to a crack if it is narrow enough and that the fracture toughness of the rock specimen can be calculated using the methods of linear elastic fracture mechanics. Luo et al. (2017) noted that Eq. 9 yields KIC values for poly (methyl methacrylate) materials and rock specimens with acceptable and relatively large errors, respectively. This contrast may occur because the relative length of the FPZ, dc/(h—a), is large in a brittle material (e.g., rock) but relatively small in a poly (methyl methacrylate) material (Gómez et al., 2005), so the result produced by Eq. 5 is unsatisfactory. This is also the reason why K2IC is much higher than K0IC and K1IC. Therefore, Eq. 4 yields a more accurate KIC value for a rock specimen than the other equations, especially when the prefabricated notch is not narrow enough.
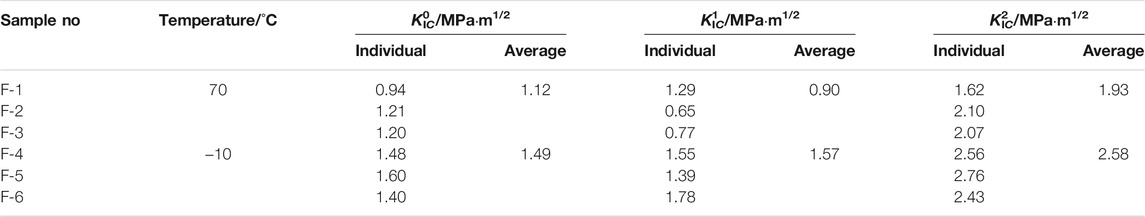
TABLE 4. Test values of fracture toughness.
The test results were somewhat dispersed. In fact, an analysis of the aforementioned relative locations of the damage zone and initial notch shows that because of the inhomogeneous microstructure of the SS, crack initiation on the surface of each specimen did not necessarily occur at the center of the notch tip, which might explain the dispersed results. As shown in Table 4, the KIC values of the SS were 1.57 and 0.90 MPa m1/2 at Tlow (−10°C) and Tin situ (70°C), respectively. That is, the crack propagation resistance of the SS at Tlow (−10°C) was 1.74 times that at Tin situ (70°C), suggesting that Tlow (−10°C) significantly increased the KIC of the SS. Similarly, Dwivedi et al. (2000) tested the fracture toughness of a sandstone at room temperature and −10°C using a cracked chevron-notched Brazilian disk specimen and found that the fracture toughness of the sandstone at −10°C was 1.5 times that at normal temperature. Clearly, the use of a low-temperature fluid to fracture a deep reservoir in fact increases the crack propagation resistance. From this perspective, low-temperature fracturing does not appear to be a good choice. However, the thermal shock caused by LN2 cooling alters the pore structure of a rock and therefore significantly weakens its mechanical performance (Huang et al., 2020). Some micropores aggregate, forming micro- or even macrocracks, which grow into a complex, interconnected crack network after multiple freeze–thaw cycles (Han et al., 2018). For fracturing and stimulating a deep reservoir, connecting natural cracks through artificial cracks to form a complex crack network is the most important step. Low temperatures can precisely promote the opening of internal microcracks in a reservoir and increase the permeability of its rocks, thereby improving the fracturing performance (Cai et al., 2014).
In the 3 PB fracture tests, the failure of each specimen was caused by the tensile stress at the prefabricated notch. Similarly, each specimen in the direct tension tests failed due to the tensile stress at the fracture surface. Since KIC and σt characterize the ability of a rock material to resist mode I crack propagation and tensile fracture, respectively, from a theoretical perspective, these two parameters may be intercorrelated. Actually, rupture of an intact rock specimen is essentially induced by internal cracking; under this scenario, a specific relation between the rock strength and fracture toughness seems reasonable (Zhang, 2002). Earlier studies also revealed a notable linear relationship between KIC and σt in rocks. By analyzing the relationship between KIC and σt in multiple types of rocks, Whittaker et al. (1992) found that these two parameters are basically related to each other through the following equation: σt = 9.35KIC—2.53. Through a statistical analysis, Zhang et al. (1998) found that the KIC of a rock is related to its σt through the following equation: σt = 6.88KIC. For the SS, it was easy to obtain a relation of σt = 3.81KIc at the reservoir temperature condition of 70°C and a relation of σt = 2.97KIC at −10°C. In other words, the relations obtained by Whittaker et al. and Zhang et al. are inapplicable to the current SS. In addition, we found that compared to σt, KIC of the SS increased slightly more when the temperature decreased from Tin situ (70°C) to Tlow (−10°C). The above results incontestably show that there is indeed a certain relationship between the KIC and σt of a rock, which is affected by the testing environment.
Conclusion
A series of experiments on Shaximiao sandstone (SS), including three-point bending, direct tension, and uniaxial compression tests, were systematically implemented under subzero and reservoir temperature conditions, and the related mechanical properties were accordingly investigated and discussed. The following conclusions can be drawn from these experiments:
1) The average tensile strength σt of the SS increased by approximately 36.09% from 3.43 to 4.67 MPa when the temperature decreased from Tin situ (70 °C) to Tlow (−10 °C). In other words, a low-temperature fluid used to fracture and stimulate a reservoir can significantly improve σt of the reservoir rocks.
2) The average uniaxial compressive strength σc of the SS increased by approximately 5.46% from 78.38 to 82.66 MPa when the temperature decreased from Tin situ (70°C) to Tlow (−10°C). That is, a low-temperature fluid can slightly increase the uniaxial σc of reservoir rocks.
3) Four brittleness indices (B1, B2, B3, and B4) of the SS were calculated based on σc and σt. Of these indices, only B3 and B4 could reflect the fact that reservoir rocks were more brittle at low temperatures than at in situ deep reservoir temperatures. The use of B1 or B2 to characterize the brittleness of the SS was therefore unsatisfactory. In addition, low temperatures induced by supercritical CO2 and liquid nitrogen were more beneficial to reservoir fracturing and stimulation.
4) A notable HSB (or damage zone) appeared at the notch tip in each specimen during the 3 PB fracture tests, resulting in a gradual decrease in the overall stiffness of the specimen, which in turn led to a convex segment on the load–displacement curve near the peak load. Clear progressive damage was observed before the complete failure of each specimen. The HSB was significantly narrower at −10°C than at 70°C, suggesting that the temperature decrease contracted the FPZ, resulting in more significant brittle failure behavior of the SS.
5) Due to its small width, the prefabricated notch in each 3 PB test specimen was treated as a U-shaped notch. On this basis, the fracture toughness KIC of the SS was calculated. The results showed that the KIC values of the SS were 49.70 and 28.46 MPa mm1/2 at Tlow (−10°C) and Tin situ (70°C), respectively. In other words, the crack propagation resistance of the SS at Tlow (−10°C) was 1.74 times that at Tin situ (70°C), indicating that Tlow (−10°C) significantly increased the KIC of the SS.
Data Availability Statement
The original contributions presented in the study are included in the article/Supplementary Material, and further inquiries can be directed to the corresponding author.
Author Contributions
RH: Writing—original draft, and Experiments, Analysis. LH: Modification and Supervision. BG: Modification and Supervision, CY: Modification and Supervision. JX: Validation and Supervision. LR: Writing—review and editing, Experiments, Methodology, and Project administration.
Funding
This paper was financially supported by the Science and Technology Department of Sichuan Province (Grant No. 2021YFH0030).
Conflict of Interest
Authors LH, BG, and CMY are employed by Down-Hole Operating Company, CNPC In review Chuanqing Drilling and Exploration Engineering Co., Ltd.
The remaining authors declare that the research was conducted in the absence of any commercial or financial relationships that could be construed as a potential conflict of interest.
Publisher’s Note
All claims expressed in this article are solely those of the authors and do not necessarily represent those of their affiliated organizations, or those of the publisher, the editors and the reviewers. Any product that may be evaluated in this article, or claim that may be made by its manufacturer, is not guaranteed or endorsed by the publisher.
Acknowledgments
The authors express their sincere gratitude to all the reviewers for their comments devoted to improving the quality of this paper.
References
Altindag, R. (2010). Assessment of Some Brittleness Indexes in Rock-Drilling Efficiency. Rock Mech. Rock Eng. 43 (3), 361–370. doi:10.1007/s00603-009-0057-x
Aoki, K., Hibiya, K., and Yoshida, T. (1990). Storage of Refrigerated Liquefied Gases in Rock Caverns: Characteristics of Rock under Very Low Temperatures. Tunnelling Underground Space Techn. 5 (4), 319–325. doi:10.1016/0886-7798(90)90126-5
Ashrafi, J., Faramarzi, L., Darbor, M., Sharifzadeh, M., and Ferdosi, B. (2020). The Effects of Temperature on Mechanical Properties of Rocks. Int. J. Mining Geo-Engineering 54 (2), 147–152. doi:10.1016/0886-7798(90)90126-5
Cai, C., Li, G., Huang, Z., Shen, Z., Tian, S., and Wei, J. (2014). Experimental Study of the Effect of Liquid Nitrogen Cooling on Rock Pore Structure. J. Nat. Gas Sci. Eng. 21, 507–517. doi:10.1016/j.jngse.2014.08.026
Chandler, M. R., Meredith, P. G., Brantut, N., and Crawford, B. R. (2017). “Effect of Temperature on the Fracture Toughness of Anisotropic Shale and Other Rocks,” in Geomechanical and Petrophysical Properties of Mudrocks. Editors E. H. Rutter, J. Mecklenburgh, and K. G. Taylor (London: The Geological Society of London), SP454–456. doi:10.1144/sp454.6
Cicero, S., García, T., and Madrazo, V. (2015). On the Line Method Apparent Fracture Toughness Evaluations: Experimental Overview, Validation and Some Consequences on Fracture Assessments. Theor. Appl. Fracture Mech. 78, 15–19. doi:10.1016/j.tafmec.2015.04.007
Ding, Q.-L., Ju, F., Mao, X.-B., Ma, D., Yu, B.-Y., and Song, S.-B. (2016). Experimental Investigation of the Mechanical Behavior in Unloading Conditions of Sandstone after High-Temperature Treatment. Rock Mech. Rock Eng. 49 (7), 2641–2653. doi:10.1007/s00603-016-0944-x
Dwivedi, R. D., Soni, A. K., Goel, R. K., and Dube, A. K. (2000). Fracture Toughness of Rocks under Sub-zero Temperature Conditions. Int. J. Rock Mech. Mining Sci. 37 (8), 1267–1275. doi:10.1016/s1365-1609(00)00051-4
Feng, G., Kang, Y., Meng, T., Hu, Y.-q., and Li, X.-h. (2017). The Influence of Temperature on Mode I Fracture Toughness and Fracture Characteristics of Sandstone. Rock Mech. Rock Eng. 50 (8), 2007–2019. doi:10.1007/s00603-017-1226-y
Funatsu, T., Seto, M., Shimada, H., Matsui, K., and Kuruppu, M. (2004). Combined Effects of Increasing Temperature and Confining Pressure on the Fracture Toughness of clay Bearing Rocks. Int. J. Rock Mech. Mining Sci. 41 (6), 927–938. doi:10.1016/j.ijrmms.2004.02.008
Gallegos, T. J., Varela, B. A., Haines, S. S., and Engle, M. A. (2015). Hydraulic Fracturing Water Use Variability in the U Nited S Tates and Potential Environmental Implications. Water Resour. Res. 51 (7), 5839–5845. doi:10.1002/2015wr017278
Gautam, P. K., Verma, A. K., Jha, M. K., Sharma, P., and Singh, T. N. (2018). Effect of High Temperature on Physical and Mechanical Properties of Jalore Granite. J. Appl. Geophys. 159, 460–474. doi:10.1016/j.jappgeo.2018.07.018
Gómez, F. J., Elices, M., and Planas, J. (2005). The Cohesive Crack Concept: Application to PMMA at −60°C. Eng. Fracture Mech. 72 (8), 1268–1285. doi:10.1016/j.engfracmech.2004.09.005
Gómez, F. J., Guinea, G. V., and Elices, M. (2006). Failure Criteria for Linear Elastic Materials with U-Notches. Int. J. Fracture 141 (1), 99–113. doi:10.1007/s10704-006-0066-7
Guo, Y., Huang, L., Li, X., Chen, J., and Sun, J. (2020). Experimental Investigation on the Effects of thermal Treatment on the Physical and Mechanical Properties of Shale. J. Nat. Gas Sci. Eng. 82, 103496. doi:10.1016/j.jngse.2020.103496
Han, S., Cheng, Y., Gao, Q., Yan, C., and Han, Z. (2018). Experimental Study of the Effect of Liquid Nitrogen Pretreatment on Shale Fracability. J. Nat. Gas Sci. Eng. 60, 11–23. doi:10.1016/j.jngse.2018.09.023
He, J., Chen, Y., Zhengchun, L., and Samuel, R. (2016). “Global Correlation of Rock Brittleness Indices with Petrophysical and Geomechanical Properties and its Application to the Prediction of Rate of Penetration (ROP),” in IADC/SPE Asia Pacific Drilling Technology Conference (Singapore: Society of Petroleum Engineers), 18. doi:10.2118/180518-ms
Huang, Z., Zhang, S., Yang, R., Wu, X., Li, R., Zhang, H., et al. (2020). A Review of Liquid Nitrogen Fracturing Technology. Fuel 266, 117040. doi:10.1016/j.fuel.2020.117040
Hucka, V., and Das, B. (1974). Brittleness Determination of Rocks by Different Methods. Int. J. Rock Mech. Mining Sci. Geomechanics Abstr. 11 (10), 389–392. doi:10.1016/0148-9062(74)91109-7
Inada, Y., and Yokota, K. (1984). Some Studies of Low Temperature Rock Strength. Int. J. Rock Mech. Mining Sci. Geomechanics Abstr. 21 (3), 145–153. doi:10.1016/0148-9062(84)91532-8
Jia, C., Zheng, M., and Zhang, Y. (2012). Unconventional Hydrocarbon Resources in China and the prospect of Exploration and Development. Pet. Exploration Dev. 39 (2), 139–146. doi:10.1016/s1876-3804(12)60026-3
Jiang, Z., Qiu, L., and Chen, G. (2009). Alkaline Diagenesis and its Genetic Mechanism in the Triassic Coal Measure Strata in the Western Sichuan Foreland Basin, China. Pet. Sci. 6 (4), 354–365. doi:10.1007/s12182-009-0055-3
Justo, J., and Castro, J. (2021). Mechanical Properties of 4 Rocks at Different Temperatures and Fracture Assessment Using the Strain Energy Density Criterion. Geomechanics Energ. Environ. 25, 100212. doi:10.1016/j.gete.2020.100212
Lawn, B. R., and Marshall, D. B. (1979). Hardness, Toughness, and Brittleness: An Indentation Analysis. J. Am. Ceram. Soc. 62 (7-8), 347–350. doi:10.1111/j.1151-2916.1979.tb19075.x
Li, H., Xie, L., Ren, L., He, B., Liu, Y., and Liu, J. (2021). Influence of CO2-water-rock Interactions on the Fracture Properties of sandstone from the Triassic Xujiahe Formation, Sichuan Basin. Acta Geophys. 69 (1), 135–147. doi:10.1007/s11600-020-00533-x
Liu, B. (1994). The Measuring and Testing Techniques of Experimental Fracture and Damage Mechanics. Beijing: The Mechani-calIndustry Press.
Liu, S., and Xu, J. (2015). An Experimental Study on the Physico-Mechanical Properties of Two post-high-temperature Rocks. Eng. Geology. 185, 63–70. doi:10.1016/j.enggeo.2014.11.013
Lü, C., Sun, Q., Zhang, W., Geng, J., Qi, Y., and Lu, L. (2017). The Effect of High Temperature on Tensile Strength of sandstone. Appl. Therm. Eng. 111, 573–579. doi:10.1016/j.applthermaleng.2016.09.151
Luo, L., Yang, J., and Wang, Q. (2017). Concurrent Measurement of Tensile Strength and Fracture Toughness of Quasi-Brittle Material Using U-Notched Beams: Experimental Analysis. J. Basic Sci. Eng. 25 (01), 89–101. doi:10.16058/j.issn.1005-0930.2017.01.009
Luo, Y., Ren, L., Xie, L. Z., Ai, T., and He, B. (2017). Fracture Behavior Investigation of a Typical Sandstone under Mixed-Mode I/II Loading Using the Notched Deep Beam Bending Method. Rock Mech. Rock Eng. 50 (8), 1987–2005. doi:10.1007/s00603-017-1227-x
Mahanta, B., Singh, T. N., and Ranjith, P. G. (2016). Influence of thermal Treatment on Mode I Fracture Toughness of Certain Indian Rocks. Eng. Geology. 210, 103–114. doi:10.1016/j.enggeo.2016.06.008
Mathia, E., Ratcliffe, K., and Wright, M. (2016). Brittleness Index - A Parameter to Embrace or Avoid? Unconventional Resources Technology Conference. San Antonio, Texas: Society of Exploration Geophysicists, American Association of Petroleum Geologists, Society of Petroleum Engineers, 1156–1165.
Middleton, R. S., Carey, J. W., Currier, R. P., Hyman, J. D., Kang, Q., Karra, S., et al. (2015). Shale Gas and Non-aqueous Fracturing Fluids: Opportunities and Challenges for Supercritical CO2. Appl. Energ. 147, 500–509. doi:10.1016/j.apenergy.2015.03.023
Nui, L. S., Chehimi, C., and Pluvinage, G. (1994). Stress Field Near a Large Blunted Tip V-Notch and Application of the Concept of the Critical Notch Stress Intensity Factor (NSIF) to the Fracture Toughness of Very Brittle Materials. Eng. Fracture Mech. 49 (3), 325–335. doi:10.1016/0013-7944(94)90262-3
Pang, L., Wang, Y., and Zheng, X. (2015). Experimental Study on Mechanical Behaviors of sandy Mudstone under Low Temperatures. Geotechnical Invest. & Surv. 43 (05), 18–22.
Pluvinage, G. (1998). Fatigue and Fracture Emanating from Notch; the Use of the Notch Stress Intensity Factor. Nucl. Eng. Des. 185 (2), 173–184. doi:10.1016/s0029-5493(98)00183-6
Rao, Q.-h., Wang, Z., Xie, H.-f., and Qiang, X. (2007). Experimental Study of Mechanical Properties of sandstone at High Temperature. J. Cent. South Univ. Techn. 14 (1), 478–483. doi:10.1007/s11771-007-0311-x
Ren, L., Xie, L. Z., Xie, H. P., Ai, T., and He, B. (2016). Mixed-Mode Fracture Behavior and Related Surface Topography Feature of a Typical Sandstone. Rock Mech. Rock Eng. 49 (8), 3137–3153. doi:10.1007/s00603-016-0959-3
Romanson, R., Pongratz, R., East, L., and Stanjocic, M. (2011). “Novel, Multistage Stimulation Processes Can Help Achieve and Control Branch Fracturing and Increase Stimulated Reservoir Volume for Unconventional Reservoirs,” in SPE EUROPEC/EAGE Annual Conference and Exhibition. Vienna, Austria: Society of Petroleum Engineers. doi:10.2118/142959-ms
Sha, S., Rong, G., Tan, J., He, R., and Li, B. (2020). Tensile Strength and Brittleness of sandstone and Granite after High-Temperature Treatment: a Review. Arab J. Geosci. 13 (14), 598. doi:10.1007/s12517-020-05647-6
Shi, X., Yao, W., Liu, D. a., Xia, K., Tang, T., and Shi, Y. (2019). Experimental Study of the Dynamic Fracture Toughness of Anisotropic Black Shale Using Notched Semi-circular bend Specimens. Eng. Fracture Mech. 205, 136–151. doi:10.1016/j.engfracmech.2018.11.027
Song, Y., Zhang, L., Yang, H., Ren, J., and Che, Y. (2019). Experimental Study on the Creep Behavior of Red Sandstone under Low Temperatures. Adv. Civil Eng. 2019, 2328065. doi:10.1155/2019/2328065
Tang, M., Wang, Z., Sun, Y., and Ba, J. (2010). Experimental Study of Mechanical Properties of Granite under Low Temperature. Chin. J. Rock Mech. Eng. 29 (04), 787–794.
Thomas, L., Tang, H., Kalyon, D. M., Aktas, S., Arthur, J. D., Blotevogel, J., et al. (2019). Toward Better Hydraulic Fracturing Fluids and Their Application in Energy Production: A Review of Sustainable Technologies and Reduction of Potential Environmental Impacts. J. Pet. Sci. Eng. 173, 793–803. doi:10.1016/j.petrol.2018.09.056
Wang, C., Lan, Y., You, Z., Yang, Y., Yu, D. H., Liu, G. H., et al. (2016). Experimental Study of the Effect of Temperature and Moisture State on Rock Brazilian Splitting Strength. J. Glaciology Geocryology 38 (05), 1317–1324. doi:10.1016/j.petrol.2018.09.056
Wang, H., Li, G., and Shen, Z. (2012). A Feasibility Analysis on Shale Gas Exploitation with Supercritical Carbon Dioxide. Energy Sourc. A: Recovery, Utilization, Environ. Effects 34 (15), 1426–1435. doi:10.1080/15567036.2010.529570
Wang, Y., Li, C. H., Hu, Y. Z., and Zhou, X. L. (2017). A New Method to Evaluate the Brittleness for Brittle Rock Using Crack Initiation Stress Level from Uniaxial Stress-Strain Curves. Environ. Earth Sci. 76 (23), 799. doi:10.1007/s12665-017-7117-4
Whittaker, B. N., Singh, R. N., and Sun, G. (1992). Rock Fracture Mechanics. Principles, Design and applications[M]. Amsterdam: Elsevier.
Wu, G., Wang, Y., Swift, G., and Chen, J. (2013). Laboratory Investigation of the Effects of Temperature on the Mechanical Properties of Sandstone. Geotech Geol. Eng. 31 (2), 809–816. doi:10.1007/s10706-013-9614-x
Xu, G., Liu, Q., Peng, W., and Chang, X. X. (2006). Experimental Study Basic Mechanical Behaviors of Rocks under Low Temperatures. Chin. J. Rock Mech. Eng. 25 (12), 2502–2508.
Yin, Q., Jin, H., Su, H., and Zhu, T. T. (2015). Loading Rate Effect on Fracture Properties of Granite after High Temperature. J. China Univ. Mining Techn. 44 (04), 597–603. doi:10.13247/j.cnki.jcumt.000358
Zhang, C., Dong, D., Wang, Y., and Guan, Q. (2017). Brittleness Evaluation of the Upper Ordovician Wufeng-Lower Silurian Longmaxi Shale in Southern Sichuan Basin, China. Energy Exploration & Exploitation 35 (4), 430–443. doi:10.1177/0144598716687929
Zhang, D., Ranjith, P. G., and Perera, M. S. A. (2016). The Brittleness Indices Used in Rock Mechanics and Their Application in Shale Hydraulic Fracturing: A Review. J. Pet. Sci. Eng. 143, 158–170. doi:10.1016/j.petrol.2016.02.011
Zhang, S., Huang, Z., Wang, H., Zhang, H., Zhang, C., and Xiong, C. (2018). Thermal Characteristics Analysis with Local thermal Non-equilibrium Model during Liquid Nitrogen Jet Fracturing for HDR Reservoirs. Appl. Therm. Eng. 143, 482–492. doi:10.1016/j.applthermaleng.2018.07.088
Zhang, X., Zhang, K., Ding, F., Wan, X., and Guo, R. (2016). Experimental Study on Mechanical Properties of Coal Rock Mass at Low Temperature. Saf. Coal Mines 47 (01), 41–43. doi:10.13347/j.cnki.Mkaq.2016.01.011
Zhang, Z., Kou, S. Q., Lindqvist, P. A., and Yu, Y. (1998). The Relationship between the Fracture Toughness and Tensile Strength of Rock. Strength Theories: Applications, Development and Prospects for 21st Century. Beijing: Science Press, 215–219.
Zhang, Z. X. (2002). An Empirical Relation between Mode I Fracture Toughness and the Tensile Strength of Rock. Int. J. Rock Mech. Mining Sci. 39 (3), 401–406. doi:10.1016/s1365-1609(02)00032-1
Zhong, Y., Xiong, Y., Qi, Y., He, W., and Meng, B. (2019). Study on Strength Properties and Failure Modes of Saturated Coarse-Grain sandstone under Low Temperatures. J. Henan Polytechnic University( Nat. Science) 38 (01), 19–25. doi:10.16186/j.cnki.1673-9787.2019.1.4
Keywords: deep rock mechanics, in situ reservoir temperature, hydraulic fracturing, brittleness index, fracture toughness
Citation: He R, He L, Guan B, Yuan CM, Xie J and Ren L (2021) Mechanical Properties of a Typical Jurassic Shaximiao Sandstone Under Subzero and Deep in situ Temperature Conditions. Front. Earth Sci. 9:770272. doi: 10.3389/feart.2021.770272
Received: 11 September 2021; Accepted: 15 November 2021;
Published: 30 November 2021.
Edited by:
Sheng-Qi Yang, China University of Mining and Technology, ChinaReviewed by:
John Browning, Pontificia Universidad Católica de Chile, ChileFuqiong Huang, China Earthquake Networks Center, China
Copyright © 2021 He, He, Guan, Yuan, Xie and Ren. This is an open-access article distributed under the terms of the Creative Commons Attribution License (CC BY). The use, distribution or reproduction in other forums is permitted, provided the original author(s) and the copyright owner(s) are credited and that the original publication in this journal is cited, in accordance with accepted academic practice. No use, distribution or reproduction is permitted which does not comply with these terms.
*Correspondence: L. Ren, cmVubGlAc2N1LmVkdS5jbg==