 Ye Tian
 Haiwei Zhang
 Rui Zhang
 Fan Zhang1
 Zeyuan Liang
- 1Institute of Global Environmental Change, Xi’an Jiaotong University, Xi’an, China
- 2State Key Laboratory of Loess and Quaternary Geology, Institute of Earth Environment, Chinese Academy of Sciences, Xi’an, China
Speleothem calcite stable oxygen isotope (δ18OC) is one of the most widely used proxies in paleoclimate research, and understanding its seasonal-annual variability is very significant for palaeoclimate reconstruction. Five-year precipitation and karst cave water from 2016 to 2021 were monitored in Shennong cave, Jiangxi Province, Southeast China. The local meteoric water line (LMWL) is δD = 8.20 × δ18O + 13.34, which is similar to the global meteoric water line. The stable hydrogen and oxygen isotope (δD and δ18O) characteristics of precipitation and cave water were studied. δ18O and δD of precipitation and cave water show obvious seasonal variations. Lower precipitation δ18O and δD generally occur during summer and autumn compared with higher δ18O and δD values during winter and spring. Meanwhile, low precipitation δ18O values do not only appear in June–July when precipitation is the highest of the year but also appear in August–September when precipitation is limited. The back-trajectory analysis of monsoon precipitation moisture sources shows that the moisture uptake regions vary little on inter-annual scales; the water vapor of rainfall in June–July comes from the South China Sea and the Bay of Bengal, while the moisture source in August–September is mainly from the West Pacific and local area. The El Niño-Southern Oscillation is an important factor affecting the value of δ18O by modulating the percentage of summer monsoon precipitation in the annual precipitation and moisture source. The relationship between amount-weighted monthly mean precipitation δ18O and Niño-3.4 index shows that the East Asian summer monsoon (EASM) intensifies during La Niña phases, resulting in more precipitation in monsoon season (May to September, MJJAS) and lower δ18O values, and vice versa during El Niño phases.
Introduction
Speleothem calcite stable oxygen isotope (δ18OC) records in eastern China are used to reflect the characteristics of the East Asian summer monsoon (EASM) on different timescales (Wang et al., 2001; Cheng et al., 2016; Cheng et al., 2019; Zhang et al., 2019). However, the significance of δ18OC has long been debated. For example, on orbital timescales, the Asian summer monsoon intensity inferred from Chinese speleothem δ18OC records show a significant precession signal and closely follow Northern Hemisphere summer insolation (NHSI) (Wang et al., 2008; Cai et al., 2015; Tan et al., 2015; Cheng et al., 2016; Kathayat et al., 2016; Tan et al., 2018; Cheng et al., 2021), while the Arabian Sea marine multi-proxy records indicate that the Asian summer monsoon intensity lags NHSI ∼8 ka (Clemens et al., 2010; Clemens et al., 2018). Clemens et al. (2010) attributed this discrepancy to the comprehensive influence of the moisture source and moisture transport pathway on speleothem δ18OC. Recently, Cheng et al. (2021) and Zhang et al. (2021) point out that a coherent orbital-scale speleothem δ18OC variability across most Asian monsoon regions (except southeastern China) indeed stems from the NHSI-forced changes in overall monsoon intensity; speleothem and marine records are complementary rather than incompatible, and each record reflects a certain aspect of Asian monsoon dynamics. Speleothem δ18OC records in southeastern China are rather distinct and should not be linked directly to the overall monsoon intensity due to its distinct precipitation seasonality (Zhang et al., 2020; Zhang et al., 2021).
Precipitation δ18O is the dominant factor controlling the δ18OC signal in monsoonal China. The δ18O values of cave water have a direct linkage with the local precipitation; the cave water provides the material that forms stalagmites and represents a link between the external environment and cave deposits (Tooth and Fairchild, 2003; Bradley et al., 2010; Oster et al., 2012). In the northern and southwestern regions of monsoonal China, monsoon rainfall accounts for more than 70% of annual rainfall, while in southeastern China, especially the spring persistent rain region, where the EASM precipitation is equivalent to the non-summer monsoon (NSM) precipitation, the EASM precipitation only accounts for ∼50% of annual rainfall (Zhang et al., 2020). Monitoring data from 2011 to 2013 in Shennong cave, Southeast China, indicate that the speleothem δ18OC values reflect drip water δ18O values inherited from the amount-weighted annual mean precipitation δ18O outside the cave (Zhang et al., 2018). It indicates that the speleothem δ18OC values in southeastern China might be controlled by both EASM and NSM precipitation, which are different from the northern and southwestern regions of monsoonal China where the speleothem δ18OC values are mainly influenced by monsoon precipitation. Hence, understanding the long-term and high-frequency variation of present-day precipitation δ18O in the area where speleothems form can help us interpret past climatic and environmental information stored in speleothem δ18OC (e.g., Wu et al., 2014; Duan et al., 2016; Sun et al., 2018; Wang et al., 2018; Zhang and Li, 2019; Wang et al., 2020).
To further understand the speleothem δ18OC and hydrological process in the spring persistent rain region, this study analyzes the δD and δ18O records of cave water and local precipitation according to 5-year monitoring data obtained from Shennong cave in southeastern China. A comprehensive analysis of inter-annual and seasonal variation of δD and δ18O of drip water and precipitation improves our understanding of the significance of speleothem δ18OC and its influencing factors in southeastern China.
Materials and Methods
Study Cave and Regional Climate
Shennong cave (28°42′N, 117°15′E; 383 m above sea level) is located in the northeast of Jiangxi Province, southeastern China (Figure 1A). EASM plays an important role in hydroclimate change for this mid-subtropical region. The rainy season includes both the spring persistent rain period and the summer monsoon period (Ding, 1992; Tian and Yasunari, 1998; Wan et al., 2008; Zhang et al., 2018; Zhang et al., 2020). Spring persistent rain occurs from March to mid-May in the south of the Yangtze River (Tian and Yasunari, 1998; Wan and Wu, 2007; Wan and Wu, 2009; Zhang et al., 2020). The nearest meteorological station Guixi (28°18′N, 117°14′E, Figure 1B) shows the mean annual precipitation is ∼2,044 mm (2016–2020 CE). Monitoring data from 2011 to 2013 show that the mean temperature in the cave is 19.1°C with a standard deviation of 2.5°C, consistent with the mean annual air temperature outside, and the relative humidity in the interior of the cave reaches 100% during most of the year (Zhang et al., 2018). Previous studies suggested that on inter-annual timescales, the seasonality of precipitation amount (i.e., EASM/NSM ratio) is modulated by El Niño-Southern Oscillation (ENSO) and primarily influences the variability of amount-weighted annual mean precipitation δ18O values in the spring persistent rain region; integrated regional convection and moisture source and transport distance play a subordinate role (Wu and Kirtman, 2007; Feng and Li, 2011; Wu and Mao, 2016; Zhang et al., 2020).
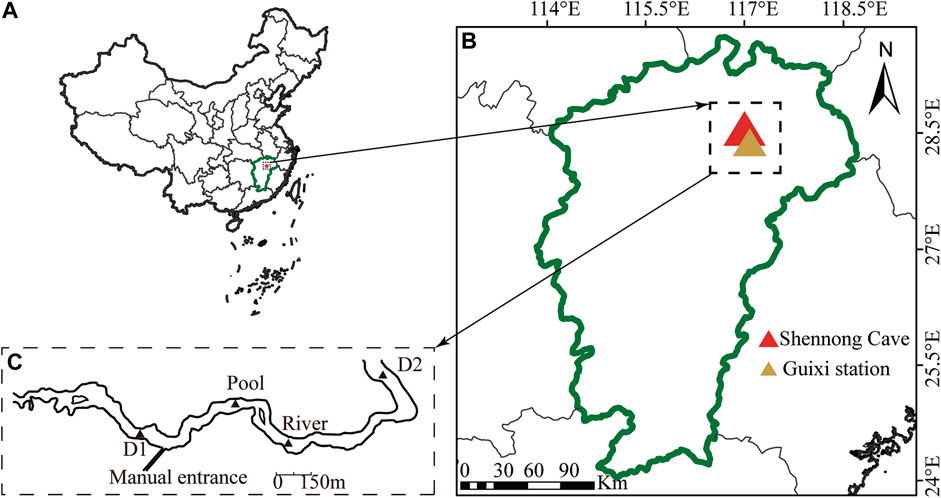
FIGURE 1. (A) Location of Shennong cave (red star) in China. (B) Location of Shennong cave and Guixi station in Jiangxi Province. (C) Schematic picture of Shennong cave and the water collection position.
Sample and Data Collection
The precipitation outside the cave was collected from October 2016 to June 2021; the rainwater from September 2017 to October 2018 was missed because the local assistant was unavailable. The drip water, river water, and pool water inside the cave were collected from October 2017 to June 2021. We chose two drip water sites in the cave; D1 is near the manual tunnel entrance of the cave (∼50 m), and D2 is deep inside, ∼2 km distance from the entrance (Figure 1C). All the cave water was collected twice a month, at the beginning and the middle of each month. D1 takes 4–5 h to fill a 15-ml tube of water, and it needs half an hour for D2. Rainfall water was collected after each precipitation event directly. Pre-washed 0.25 μm nylon membrane filters were used to filter the water samples. All samples were kept in 15 ml polypropylene conical centrifuge tube at 3°C before analysis. In total, 515 samples of precipitation water, river water, pool water, and drip water were collected and measured.
Instrumental data of Guixi station were obtained from China Meteorological Data Service Center (https://data.cma.cn/). The amount-weighted monthly mean precipitation δ18O and δD are calculated following the equations here:
where P represents the rainfall amount of each precipitation event and n represents the time of the precipitation event within a month.
Sample Analysis
Water isotope analyses of precipitation and cave waters were performed with a Picarro L2140-i water isotope analyzer (Picarro Inc., Sunnyvale, CA, United States) in the Isotope laboratory of Xi’an Jiaotong University. Picarro analyzers use time-based, optical absorption spectroscopy of the target gases to determine concentration or isotopic composition. They are based on wavelength-scanned cavity ring-down spectroscopy (WS-CRDS). The measurement accuracy is typically 0.025‰ for δ18O and 0.1‰ for δD, and the results were presented as the relative value to the Vienna Standard Mean Ocean Water (VSMOW) value.
Back-Trajectory and Moisture Source Analysis
The atmospheric moisture flux associated with precipitation was analyzed with the HYbrid Single-Particle Lagrangian Integrated Trajectory model (HYSPLIT) model (http://ready.arl.noaa.gov/HYSPLIT.php, Stein et al., 2015). A standard level of 850 hPa (∼1,500 m) was chosen as the starting height, for it is usually regarded as cloud base or precipitation height and has been used as the main moisture transportation level in EASM regions (Cai et al., 2017; Sun et al., 2018; Zhang et al., 2020). The backward duration was set as 120 h to avoid the increase of uncertainty of trajectories with duration (Krklec et al., 2018).
We firstly find out all dates which have the precipitation records at Guixi meteorological station in May to September (MJJAS) of 2017, 2019, and 2020. The National Center for Environmental Prediction/National Center for Atmospheric Research (NCEP/NCAR) Reanalysis daily data with 2.5° resolution were used to calculate hourly atmospheric pressure, potential and environmental temperature, precipitation, and relative humidity from UTC 00:00 to the past 120 h of each precipitation day. These are used to calculate specific humidity follow the equations in Krklec et al. (2018).
The HYSPLIT analysis assumes the “integrity” of air parcels over several days and neglects the effects of mixing with neighboring parcels (Krklec et al., 2018). The locations taken along the trajectory were identified under two criteria: 1) the positive gradient in specific humidity was above 0.2 g/kg within every 6 h and 2) the initial relative humidity was more than 80% (Sodemann et al., 2008; Cai et al., 2018; Zhang et al., 2020). Moisture uptake locations were identified along each trajectory. The percentage of daily precipitation was weighed considering the amount of precipitation and was divided equally into the number of identified moisture uptake locations along each trajectory.
A grid of 1 × 1° was used for spatial computation of moisture uptake locations. Each cell of the grid integrates the percentage of moisture uptake accumulated during different events and/or moisture uptake locations within the cell. The resulting model provides a map with discrete locations showing the percentage of moisture uptake contributing to Guixi meteorological station precipitation.
Results
δD and δ18O
Instrumental data of Guixi station from July 2016 to June 2021 show that the highest rainfall amount of the year appears in June–July (Figure 2A). The annual precipitation amount in 2018 and 2019 was lower than in other years (Figure 2B). The monsoon rainfall of 2017 and 2020 account for 56% and 70% of the annual rainfall amount, respectively; for the other 3 years, the proportion of monsoon and non-monsoon rainfall amounts are almost equal (Figure 2B).
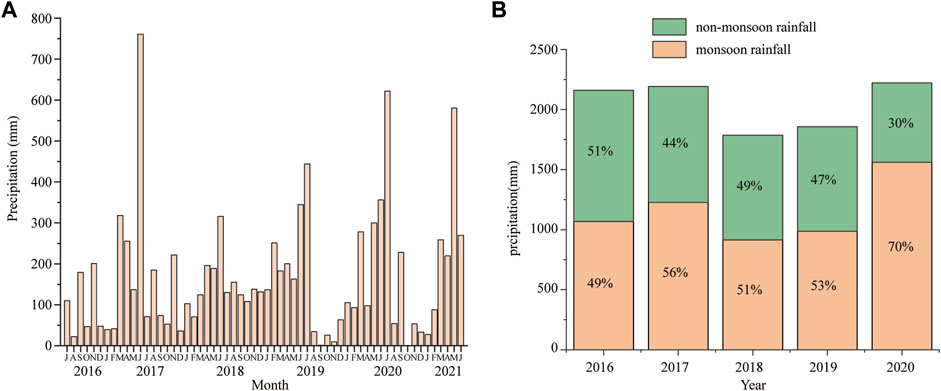
FIGURE 2. (A) Monthly precipitation (yellow column) of Guixi Station from July 2016 to June 2021. (B) Annual precipitation amount of each year from 2016 to 2021 in Guixi station, with the proportion of monsoon rainfall amount (MJJAS, yellow column) and non-monsoon rainfall amount (green column).
From October 2016 to June 2021, amount-weighted monthly mean precipitation δ18O values vary from −13.03‰ to 0.16‰, with a mean value of −5.39‰; the δD value varies from −93.09‰ to 14.50‰, and the mean value is −29.55‰ (Table 1). The amount-weighted annual mean precipitation δ18O values of 2017, 2019, and 2020 are −9.05‰, −4.71‰, and −7.50‰, and the δD values of 2017, 2019, and 2020 are −59.63‰, −28.18‰, and −45.91‰, respectively (Table 2).

TABLE 1. Ranges of δ18O and δD values of different types of water and their average values.

TABLE 2. Annual mean δ18O and δD values of different types of water from 2016 to 2020.
Based on the precipitation δD and δ18O data, a local meteoric water line (LMWL) at the Shennong cave site was established as follows (Figure 3A):
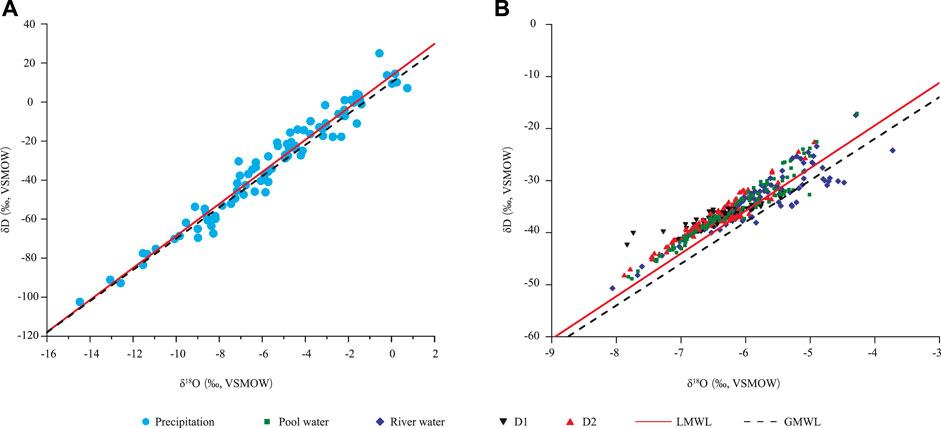
FIGURE 3. (A) Distribution of δ18O and δD of precipitation and the local meteoric water line (LMWL) based on the δ18O and δD values of precipitation collected outside Shennong cave (red line). The global meteoric water line (GMWL, dashed black line, Craig, 1961) is plotted for comparison. (B) Distribution of δ18O and δD of different kinds of cave water and their relationship with LWML and GMWL.
From November 2016 to June 2021, the δD values of drip water from site D1 range from −42.22‰ to −32.26‰ with a mean value of −37.64‰, and its δ18O values vary from −7.83‰ to −5.44‰ with a mean value of −6.48‰ (Table 1). The δD values from site D2 vary from −48.28‰ to −22.71‰, and the average value is −37.53‰; its δ18O values vary from −7.88‰ to −4.94‰ with a mean value of −6.49‰ (Table 1). The δD values of pool water vary between −48.85‰ and −17.11‰, and the average value is −35.81‰. The δ18O values vary between −7.81‰ and −4.28‰ with an average value of −6.22‰. For river water from the cave, the range of δD value is −50.71‰ to −17.47‰ with a mean value of −34.08‰. The range of δ18O value is −8.06‰ to −3.72‰ with an average value of −5.86‰ (Table 1) The δ18O and δD values of drip waters (D1 and D2), river water, and pool water generally distribute along the LMWL (Figure 3B).
The amount-weighted monthly mean δD and δ18O values of precipitation show a rapid decrease from 4.14‰ to −86.43‰ and from −1.63‰ to −11.81‰ during the monsoon season in 2017, respectively (Figures 4A,B). This significant decrease can be also observed in δD and δ18O record of D2 (−32.51‰ to −48.28‰ for δD and −6‰ to −7.88‰ for δ18O), river water (−32.48‰ to −50.71‰ for δD and −5.91‰ to −8.06‰ for δ18O), and pool water (−30.83‰ to −48.49‰ for δD and −5.73‰ to −7.81‰ for δ18O), while D1 shows an insignificant decrease during the same time, from −6.48‰ to −6.69‰ (Figures 4A,B). During the monsoon season of 2020, the amount-weighted monthly mean δD and δ18O values of precipitation also show a significant decrease from −15.11‰ to −66.93‰ and from −3.32‰ to −9.59‰, respectively, consistent with the decrease in D1 (−36.11‰ to −42.22‰ for δD and −6.15‰ to −7.83‰ for δ18O), river water (−26.53‰ to −46.52‰ for δD and −6.04‰ to −7.60‰ for δ18O), and pool water (−31.81‰ to −45.49‰ for δD and −5.26‰ to −7.38‰ for δ18O), while D2 does not record this obvious decrease. The δD and δ18O values of drip water, pool water, and river water in the monsoon season of 2019 show the highest values during the interval of 2016–2021.
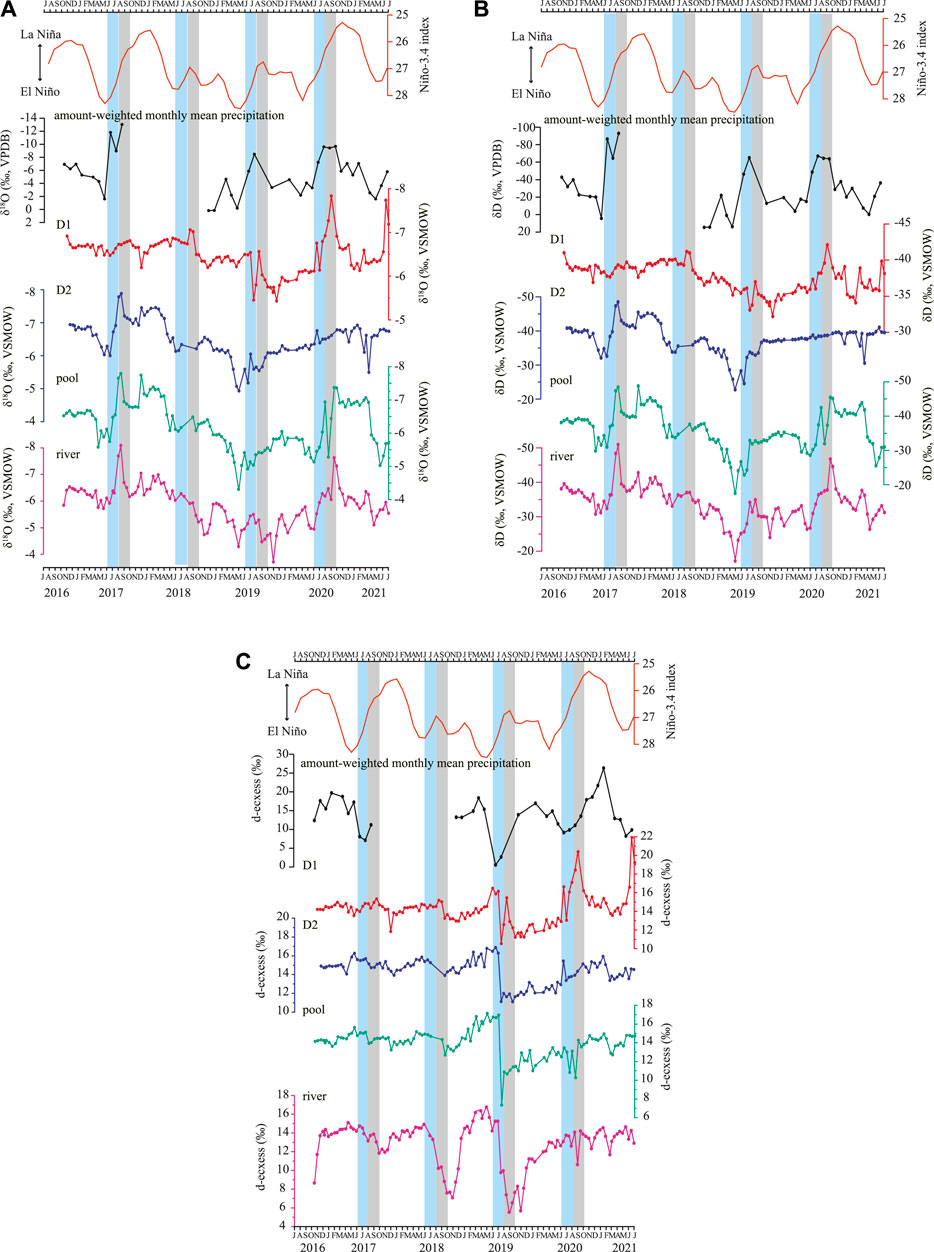
FIGURE 4. (A) δ18O values of amount-weighted annual mean precipitation (black) from October 2016 to June 2021 outside Shennong cave, drip water site D1 (red) and D2 (blue) from November 2016 to June 2021 in Shennong cave, river (green) and pool (pink) from October 2016 to June 2021 in Shennong cave compared with Niño-3.4 Index (orange, Climate Prediction Center of National Oceanic and Atmospheric Administration, https://origin.cpc.ncep.noaa.gov/products/analysis_monitoring/ensostuff/ONI_change.shtml). (B) Same as (A) but for δD. (C) Same as (A) but for d-excess.
d-Excess
The deuterium excess (d-excess, defined as δD − 8 × δ18O; Dansgaard, 1964) profiles of the drip water D1 and D2, river water, and pool water show a similar variation (Figure 4C). Lower d-excess values appear in the late monsoon season and autumn of 2018 and 2019 with the lowest values in the monsoon season of 2019. The highest d-excess values within a year appear from winter to early spring (Figure 4C). Remarkably, an abrupt decrease of d-excess occurs in drip water, river water, and pool water from July to September 2019. Although the significant decrease of river water d-excess values can be also observed in the monsoon season of 2018, there is no obvious change in drip water and pool water. Unfortunately, precipitation data between 2017 autumn and 2018 are unavailable.
Moisture Back-Trajectories
The moisture uptake locations were identified along the trajectories, and their contributions to the annual precipitation amount were also calculated. The results show that the moisture uptake locations and their contributions are similar in the MJJAS of 2017, 2019, and 2020. During the monsoon season, the moisture sources mainly come from southern China, the South China Sea, and the Bay of Bengal. A relatively less amount of the moisture sources is from northern China and the West Pacific (Figures 5A–C). The moisture uptake locations in June–July show the same pattern and contributions of MJJAS (Figures 5D–F), while the moisture back-trajectories of August–September exhibit more moisture from local area and the West Pacific.
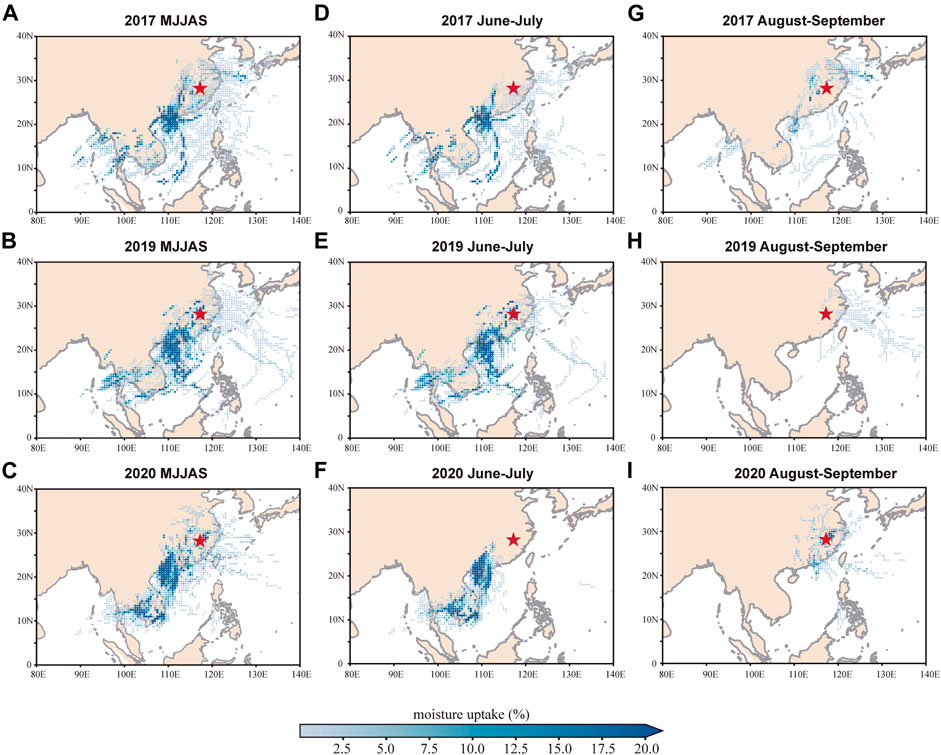
FIGURE 5. Distribution of moisture uptake contributing to precipitation of Guixi. (A), (B), and (C) show the moisture uptake locations and contributions to monsoonal (MJJAS) rainfall of 2017, 2019, and 2020, respectively. (D), (E), and (F) are the same as (A), (B), and (C) but only for the rainfall of June and July of 2017, 2019, and 2020, respectively. (G), (H) and (I) are the same as (A), (B), and (C) but only for the rainfall of August and September of 2017, 2019, and 2020, respectively.
Discussion
Seasonal Variabilities
According to the precipitation record from Guixi station, the spring and summer rainfall takes the most (69–86%) of the annual rainfall amount. The rainy season starts in March and ends in September, which fits the time of spring persistent rain and summer monsoon (Figure 2A). Although some short-time spikes of precipitation δD and δ18O have not been recorded in drip water, such as the fact that D1 did not show significant decrease of δD and δ18O values in August 2017 and D2 did not record the rapid decrease of δD and δ18O values in August 2020, the δD and δ18O records of both precipitation and cave waters show a generally similar variation, indicating the transmission of δD and δ18O signals from rainfall to drip water.
June–July always has the most precipitation of the year, whereas the lowest precipitation δD and δ18O values do not only appear in these 2 months but also in August–September (Figures 4A,B), though the precipitation amount in August–September is much lower than in June–July (Figure 2A). It means that precipitation δ18O is not negatively correlated with precipitation amount, indicating that the “amount effect” does not fit the precipitation δ18O values in southeastern China on seasonal timescales. The lower precipitation δ18O values in August–September might be caused by different moisture sources, which will be further discussed below. Our monitoring data at Shennong cave further show that amounted-weighted monthly mean precipitation δ18O in spring (March–April–May) is higher than that in August–September (Figure 4A), though March–April–May rainfall amount is much higher than in August–September (Figure 2A). Many studies have also observed that the precipitation amount does not correlate to the speleothem δ18OC value in monsoonal China; factors such as moisture source, integrated regional convection, convection in the moisture source region, precipitation seasonality, and winter temperature have been proposed to explain the speleothem δ18OC in southeastern China (Dayem et al., 2010; Tan, 2014; 2016; Baker et al., 2015; Cheng et al., 2016; Cai et al., 2018; Zhang et al., 2020; Zhang et al., 2021).
The HYSPLIT model analysis of precipitation in MJJAS shows that moisture is mainly derived from the Bay of Bangle and the South China Sea, and relatively less moisture is from the West Pacific Ocean and southern China (Figures 5A–C). Our result is broadly consistent with previous studies by using a similar moisture diagnosis method (e.g., Cai et al., 2018; Ruan et al., 2019; Zhang et al., 2020). When atmospheric vapor moves from the ocean to the continent, raindrops would be formed in the cloud by condensation of water vapor, the liquid phase is enriched in 18O, and the continuing preferential removal of 18O via precipitation causes depletion of 18O in the remaining vapor phase. Thereby, the δ18O values of water vapor in the remaining air masses become progressively lower as rain continues to fall from it in further inland regions.
To explain the lower values of precipitation δ18O in August–September, the moisture back trajectory analysis of June–July and August–September are performed, respectively (Figures 5D–I). The results show that the Bay of Bengal and the South China Sea provide the main part of water vapor source in June–July (Figures 5D–F). The precipitation back-trajectories in August–September are mainly from the West Pacific and the land (southeastern China) (Figures 5G–I), indicating that the local moisture provides a large portion of the precipitation in August–September. We also compare strong precipitation events (daily rainfall amount >50 mm) and typhoon records with the precipitation δ18O records in the study area over the past 5 years (Figure 6). It shows that there are no obvious strong precipitation events caused by typhoon in August and September, suggesting that typhoon precipitation is not the reason for significantly lower δ18O values of precipitation in August–September.
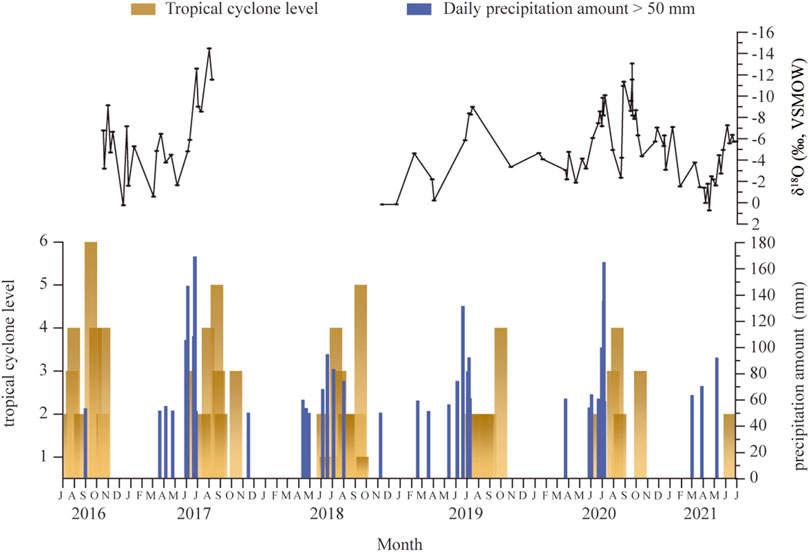
FIGURE 6. Comparison between precipitation δ18O and China tropical cyclone events (yellow columns) (https://www.typhoon.org.cn/) and strong precipitation events (>50 mm/day) in Guixi station (blue columns).
d-Excess can add more information on fractionating processes in convective systems (Gat, 1996). The value of d-excess reflects the extent of the kinetic fractionation; it is mainly dependent on sea surface temperature, normalized relative humidity, and wind speed at the moisture source (Jouzel and Merlivat, 1984; Uemura et al., 2008; Pfahl and Sodemann, 2014). It is generally negatively correlated with the relative humidity of the air masses formed above the ocean (Merlivat and Jouzel, 1979; Gat et al., 1996; Pfahl and Wernli, 2008; Uemura et al., 2008). Relative humidity variations greatly modify the relative influence of diffusive and equilibrium fractionation at the liquid–vapor transitions. Because of the significant differences for the diffusive and equilibrium fractionation associated with δD and δ18O, a change in the proportion of diffusive and equilibrium fractionations results in a change in d-excess (Landais et al., 2010). Higher precipitation d-excess values during winter and spring relate to the low relative humidity of moisture source, while lower d-excess values of summer and autumn precipitation correspond to high relative humidity and the secondary evaporative effects of the falling raindrops through the dry atmosphere (Gat and Carmi, 1970; Gat, 1996). Figure 4C shows that the d-excess values of precipitation in the monsoon season are lower than those in the non-monsoon season, especially in June–July and also in August–September, indicating a high relative humidity of moisture source area and a strong evaporation effect. As shown in Figures 2A and 5G–I, the precipitation amount in August–September is low, and the local areas provide a large portion of the precipitation. According to the lower d-excess values of this period, we suggest that a large amount of precipitation in June–July was preserved in the form of surface water and soil water and experienced secondary evaporation in August–September, which cause more negative δ18O values.
Inter-Annual Variabilities
As we have mentioned above, ENSO significantly influences the precipitation δ18O in southeastern China by modulating changes in the precipitation seasonality and the moisture source (Yang et al., 2016; Wang et al., 2020; Zhang et al., 2020). It can be observed that the monthly Niño-3.4 index shows a generally positive correlation with amount-weighted monthly mean precipitation δ18O in the study area (Figures 4A,B). La Niña phases occurred in August to December 2016, October 2017 to April 2018, and August 2020 to May 2021; δ18O values of precipitation and cave water in La Niña phase are lower than in El Niño phase which happened between September 2018 and June 2019 (Figure 4A). On inter-annual timescales, the amount-weighted annual mean precipitation δD and δ18O values of 2019 are higher than of 2017 and 2020 (Table 2). The annual total precipitation amount in the Guixi station of 2017 (2,192 mm) and 2020 (2,222 mm) is much higher than the annual rainfall amount of 2018 (1,786 mm) and 2019 (1,857 mm) (Figure 2B). The monsoon rainfall in 2017 and 2020 take more proportion of the annual rainfall amount, especially in 2020, when monsoon precipitation takes 70% of the annual rainfall amount. In 2019, monsoon and non-monsoon precipitation amounts are almost equal; not only the amount-weighted annual mean precipitation δD and δ18O but also the cave water annual mean δ18O and δD are higher than in 2017 and 2020 (Table 2). Previous studies have suggested that the difference in amount-weighted annual mean precipitation δ18O between El Niño and La Niña years is primarily influenced by the precipitation seasonality, and changes in the EASM precipitation play a key role in changing the EASM/NSM ratio (Zhang et al., 2020). Indeed, EASM precipitation accounts for a higher percentage of annual precipitation in La Niña years than in El Niño years (Figure 2B). More EASM precipitation and a higher ratio of EASM/NSM in 2017 and 2020 correspond to lower amount-weighted annual mean precipitation δ18O values compared with those in 2019 (Table 2).
The moisture uptake locations of MJJAS precipitation vary little between years no matter the δ18O values are relatively high or low (Figures 5A–C), which is consistent with previous results by Cai et al. (2017) and Zhang et al. (2020). However, the moisture uptake locations of June–July in 2020 show that there was almost no atmospheric vapor from adjacent land areas and the West Pacific compared with 2017 and 2019 (Figure 5F), indicating that the impact of changes in moisture transport on monsoon precipitation δ18O cannot be excluded. The variations in moisture source locations and transport distance might also have contributions to precipitation δ18O (Zhang et al., 2020). Further quantitative studies about changes in moisture uptake location on inter-annual timescales are needed, which will reinforce our understanding of the climatic significance of the speleothem δ18OC. Studies have demonstrated that the EASM intensifies (weakens) during the La Niña (El Niño) years (Sun et al., 2018; Zhang et al., 2018; Wang et al., 2020). Therefore, according to current understanding, we suggest that during El Niño phases, weakened EASM and reduced integrated regional convection might cause less EASM precipitation and lower EASM/NSM ratio thus resulting in higher precipitation δ18O values and vice versa in La Niña phases (Gao et al., 2013; Zwart et al., 2016; Cai et al., 2018; Zhang et al., 2020).
Conclusion
In this paper, we examined the correlations of δ18O and δD between amount-weighted monthly mean precipitation and cave water at Shennong cave in Southeast China over the period from 2016 to 2021. We found the primary connection among cave water δ18O, the monsoon precipitation, and the ENSO phase. Specifically, the following conclusions can be drawn:
1) Complete water isotope records were established at Shennong cave. Obvious seasonal variations of δ18O and δD of precipitation and cave waters are shown; lower δ18O and δD values generally occur during summer and autumn, and higher δ18O and δD values occur during winter and spring. The LMWL is δD = 8.20 × δ18O + 13.34.
2) The water vapor in June–July generally takes a large portion of MJJAS precipitation and leads to low δD and δ18O values, but August–September precipitation also has very low δD and δ18O values though the precipitation amount is limited. Therefore, the “amount effect” might not fit the precipitation δ18O values in southeastern China on seasonal timescales. This might be caused by the strong evaporation effect of surface water and soil water in August–September; the water preserved in the surface and soil are from the precipitation in June–July. On seasonal timescales, precipitation and speleothem δ18O values in the study area might be primarily controlled by the changes in moisture source. Precipitation in June–July is mostly transported from remote moisture sources in the South China Sea and the Bay of Bengal, while the West Pacific and local land areas provide most of the water vapor in August–September to the study area.
3) During El Niño (La Niña) phases, less (more) monsoonal rainfall and more (less) non-monsoonal rainfall led to lower (higher) EASM precipitation amount ratios of the year and result in higher (lower) precipitation δ18O values. The proportion of summer monsoon precipitation in the annual precipitation is an important factor affecting the value of δ18O. When the annual precipitation amount is low or the proportion of summer monsoon precipitation is small, the amount-weighted annual mean value of δ18O is higher. Conversely, when summer monsoon precipitation takes a large portion of annual rainfall, the amount-weighted annual mean δ18O value is lower. Moisture source might have little impact on precipitation δ18O and speleothem δ18OC values on inter-annual scales, but it cannot be completely excluded because almost no nearby moisture was observed in the early summer of La Niña phase (June–July in 2020).
Data Availability Statement
The raw data supporting the conclusion of this article will be made available by the authors, without undue reservation.
Author Contributions
YT interpreted the data and wrote the manuscript. HZ conceived and designed the project. YT, FZ, and HZ carried out the experiments. YT and ZL performed HYSPLIT analysis. HZ, HC, YC, and RZ revised the manuscript. All authors contributed to the article and approved the submitted version.
Funding
This study was supported by grants from the National Science Foundation of China (41888101 and 41972186), the National Key Research and Development Program of China (2017YFA0603401), and China Postdoctoral Science Foundation (2019T120894).
Conflict of Interest
The authors declare that the research was conducted in the absence of any commercial or financial relationships that could be construed as a potential conflict of interest.
Publisher’s Note
All claims expressed in this article are solely those of the authors and do not necessarily represent those of their affiliated organizations or those of the publisher, the editors, and the reviewers. Any product that may be evaluated in this article, or claim that may be made by its manufacturer, is not guaranteed or endorsed by the publisher.
Acknowledgments
We thank the editor Valdir Felipe Novello and two reviewers for their comments and suggestions. We would like to express our sincere gratitude to Yiyang Gao, Yanbo Han, and Guangchuang Zhang from Xi’an Jiaotong University for their generous help in preparing the water samples and polishing the figures of the manuscript.
References
Baker, A. J., Sodemann, H., Baldini, J. U. L., Breitenbach, S. F. M., Johnson, K. R., van Hunen, J., et al. (2015). Seasonality of Westerly Moisture Transport in the East Asian Summer Monsoon and its Implications for Interpreting Precipitation δ18O. J. Geophys. Res. Atmos. 120, 5850–5862. doi:10.1002/2014jd022919
Bradley, C., Baker, A., Jex, C. N., and Leng, M. J. (2010). Hydrological Uncertainties in the Modelling of Cave Drip-Water δ18O and the Implications for Stalagmite Palaeoclimate Reconstructions. Quat. Sci. Rev. 29, 2201–2214. doi:10.1016/j.quascirev.2010.05.017
Cai, Y., Fung, I. Y., Edwards, R. L., An, Z., Cheng, H., Lee, J.-E., et al. (2015). Variability of Stalagmite-Inferred Indian Monsoon Precipitation Over the Past 252,000 y. Proc. Natl. Acad. Sci. USA 112, 2954–2959. doi:10.1073/pnas.1424035112
Cai, Z., Tian, L., and Bowen, G. J. (2017). ENSO Variability Reflected in Precipitation Oxygen Isotopes across the Asian Summer Monsoon Region. Earth Planet. Sci. Lett. 475, 25–33. doi:10.1016/j.epsl.2017.06.035
Cai, Z., Tian, L., and Bowen, G. J. (2018). Spatial-Seasonal Patterns Reveal Large-Scale Atmospheric Controls on Asian Monsoon Precipitation Water Isotope Ratios. Earth Planet. Sci. Lett. 503, 158–169. doi:10.1016/j.epsl.2018.09.028
Cheng, H., Edwards, R. L., Sinha, A., Spötl, C., Yi, L., Chen, S., et al. (2016). The Asian Monsoon over the Past 640,000 Years and Ice Age Terminations. Nature 534, 640–646. doi:10.1038/nature18591
Cheng, H., Springer, G. S., Sinha, A., Hardt, B. F., Yi, L., Li, H., et al. (2019). Eastern North American Climate in Phase with Fall Insolation throughout the Last Three Glacial-Interglacial Cycles. Earth Planet. Sci. Lett. 522, 125–134. doi:10.1016/j.epsl.2019.06.029
Cheng, H., Zhang, H., Cai, Y., Shi, Z., Yi, L., Deng, C., et al. (2021). Orbital-scale Asian Summer Monsoon Variations: Paradox and Exploration. Sci. China Earth Sci. 64, 529–544. doi:10.1007/s11430-020-9720-y
Clemens, S. C., Holbourn, A., Kubota, Y., Lee, K. E., Liu, Z., Chen, G., et al. (2018). Precession-Band Variance Missing from East Asian Monsoon Runoff. Nat. Commun. 9, 1–12. doi:10.1038/s41467-018-05814-0
Clemens, S. C., Prell, W. L., and Sun, Y. (2010). Orbital-Scale Timing and Mechanisms Driving Late Pleistocene Indo-Asian Summer Monsoons: Reinterpreting Cave speleothemδ18O. Paleoceanography 25, a–n. doi:10.1029/2010PA001926
Craig, H. (1961). Standard for Reporting Concentrations of Deuterium and Oxygen-18 in Natural Waters. Science 133 (3467), 1833–1834. doi:10.1126/science.133.3467.1833
Dansgaard, W. (1964). Stable Isotopes in Precipitation. Tellus 16 (4), 436–468. doi:10.3402/tellusa.v16i4.8993
Dayem, K. E., Molnar, P., Battisti, D. S., and Roe, G. H. (2010). Lessons Learned from Oxygen Isotopes in Modern Precipitation Applied to Interpretation of Speleothem Records of Paleoclimate from Eastern Asia. Earth Planet. Sci. Lett. 295, 219–230. doi:10.1016/j.epsl.2010.04.003
Ding, Y. (1992). Summer Monsoon Rainfalls in China. J. Meteorol. Soc. Jpn. 70, 373–396. doi:10.2151/jmsj1965.70.1b_373
Duan, W., Ruan, J., Luo, W., Li, T., Tian, L., Zeng, G., et al. (2016). The Transfer of Seasonal Isotopic Variability between Precipitation and Drip Water at Eight Caves in the Monsoon Regions of China. Geochim. Cosmochim. Acta 183, 250–266. doi:10.1016/j.gca.2016.03.037
Feng, J., and Li, J. (2011). Influence of El Niño Modoki on spring Rainfall over south China. J. Geophys. Res. 116, D13102. doi:10.1029/2010JD015160
Gao, J., Masson-Delmotte, V., Risi, C., He, Y., and Yao, T. (2013). What Controls Precipitation δ18O in the Southern Tibetan Plateau at Seasonal and Intra-Seasonal Scales? A Case Study at Lhasa and Nyalam. Tellus B: Chem. Phys. Meteorol. 65, doi:21043doi:10.3402/tellusb.v65i0.21043
Gat, J. R., and Carmi, I. (1970). Evolution of the Isotopic Composition of Atmospheric Waters in the Mediterranean Sea Area. J. Geophys. Res. 75, 3039–3048. doi:10.1029/JC075i015p03039
Gat, J. R. (1996). Oxygen and Hydrogen Isotopes in the Hydrologic Cycle. Annu. Rev. Earth Planet. Sci. 24, 225–262. doi:10.1146/annurev.earth.24.1.225
Jouzel, J., and Merlivat, L. (1984). Deuterium and Oxygen 18 in Precipitation: Modeling of the Isotopic Effects During Snow Formation. J. Geophys. Res. 89 (D7), 11749–11757. doi:10.1029/jd089id07p11749
Kathayat, G., Cheng, H., Sinha, A., Spötl, C., Edwards, R. L., Zhang, H., et al. (2016). Indian Monsoon Variability on Millennial-Orbital Timescales. Sci. Rep. 6, 1–7. doi:10.1038/srep24374
Krklec, K., Domínguez-Villar, D., and Lojen, S. (2018). The Impact of Moisture Sources on the Oxygen Isotope Composition of Precipitation at a continental Site in central Europe. J. Hydrol. 561, 810–821. doi:10.1016/j.jhydrol.2018.04.045
Landais, A., Risi, C., Bony, S., Vimeux, F., Descroix, L., Falourd, S., et al. (2010). Combined Measurements of 17Oexcess and D-Excess in African Monsoon Precipitation: Implications for Evaluating Convective Parameterizations. Earth Planet. Sci. Lett. 298, 104–112. doi:10.1016/j.epsl.2010.07.033
Merlivat, L., and Jouzel, J. (1979). Global Climatic Interpretation of the Deuterium-Oxygen 18 Relationship for Precipitation. J. Geophys. Res. 84 (C8), 5029. doi:10.1029/jc084ic08p05029
Oster, J. L., Montañez, I. P., and Kelley, N. P. (2012). Response of a Modern Cave System to Large Seasonal Precipitation Variability. Geochim. Cosmochim. Acta 91, 92–108. doi:10.1016/j.gca.2012.05.027
Pfahl, S., and Sodemann, H. (2014). What Controls Deuterium Excess in Global Precipitation? Clim. Past. 10 (2), 771–781. doi:10.5194/cp-10-771-2014
Pfahl, S., and Wernli, H. (2008). Air Parcel Trajectory Analysis of Stable Isotopes in Water Vapor in the Eastern Mediterranean. J. Geophys. Res. 113. D20104, doi:10.1029/2008JD009839
Ruan, J., Zhang, H., Cai, Z., Yang, X., and Yin, J. (2019). Regional Controls on Daily to Interannual Variations of Precipitation Isotope Ratios in Southeast China: Implications for Paleomonsoon Reconstruction. Earth Planet. Sci. Lett. 527, 115794. doi:10.1016/j.epsl.2019.115794
Sodemann, H., Schwierz, C., and Wernli, H. (2008). Interannual Variability of Greenland winter Precipitation Sources: Lagrangian Moisture Diagnostic and North Atlantic Oscillation Influence. J. Geophys. Res. 113. doi:10.1029/2007JD008503
Stein, A., Draxler, R. R., Rolph, G. W. D., Stunder, B. J., Cohen, M., and Ngan, F. (2015). NOAA’s HYSPLIT Atmospheric Transport and Dispersion Modeling System. B. Am. Meteorol. Soc. 96, 2059–2077. doi:10.1175/BAMS-D-14-00110.1
Sun, Z., Yang, Y., Zhao, J., Tian, N., and Feng, X. (2018). Potential ENSO Effects on the Oxygen Isotope Composition of Modern Speleothems: Observations from Jiguan Cave, central China. J. Hydrol. 566, 164–174. doi:10.1016/j.jhydrol.2018.09.015
Tan, L., Cai, Y., Cheng, H., Edwards, L. R., Gao, Y., Xu, H., et al. (2018). Centennial- to Decadal-Scale Monsoon Precipitation Variations in the Upper Hanjiang River Region, china over the Past 6650 Years. Earth Planet. Sci. Lett. 482, 580–590. doi:10.1016/j.epsl.2017.11.044
Tan, L., Cai, Y., Cheng, H., Lawrence Edwards, R., Shen, C.-C., Gao, Y., et al. (2015). Climate Significance of Speleothem δ18O from central China on Decadal Timescale. J. Asian Earth Sci. 106, 150–155. doi:10.1016/j.jseaes.2015.03.008
Tan, M. (2016). Circulation Background of Climate Patterns in the Past Millennium: Uncertainty Analysis and Re-reconstruction of ENSO-like State. Sci. China Earth Sci. 59, 1225–1241. doi:10.1007/s11430-015-5256-6
Tan, M. (2014). Circulation Effect: Response of Precipitation δ18O to the ENSO Cycle in Monsoon Regions of China. Clim. Dyn. 42, 1067–1077. doi:10.1007/s00382-013-1732-x
Tian, S.-F., and Yasunari, T. (1998). Climatological Aspects and Mechanism of Spring Persistent Rains over Central China. J. Meteorol. Soc. Jpn. 76 (1), 57–71. doi:10.2151/jmsj1965.76.1_57
Tooth, A. F., and Fairchild, I. J. (2003). Soil and Karst Aquifer Hydrological Controls on the Geochemical Evolution of Speleothem-Forming Drip Waters, Crag Cave, Southwest Ireland. J. Hydrol. 273 (1–4), 51–68. doi:10.1016/s0022-1694(02)00349-9
Uemura, T., Akai, K., Koga, K., Tanaka, T., Kurisu, H., Yamamoto, S., et al. (2008). Electronic Structure and Thermoelectric Properties of Clathrate Compounds Ba8AlxGe46-x. J. Appl. Phys. 104, 013702. doi:10.1063/1.2947593
Wan, R., Wang, T., and Wu, G. (2008). Temporal Variations of the spring Persistent rains and South China Sea Sub-high and Their Correlations to the Circulation and Precipitation of the East Asian Summer Monsoon. J. Meteorol. Res. 22, 530–537.
Wan, R., and Wu, G. (2007). Mechanism of the spring Persistent rains over southeastern China. Sci. China Ser. D 50, 130–144. doi:10.1007/s11430-007-2069-2
Wan, R., and Wu, G. (2009). Temporal and Spatial Distributions of the spring Persistent rains over Southeastern China. J. Meteorol. Res. 23, 598–608.
Wang, Q., Wang, Y., Zhao, K., Chen, S., Liu, D., Zhang, Z., et al. (2018). The Transfer of Oxygen Isotopic Signals from Precipitation to Drip Water and Modern Calcite on the Seasonal Time Scale in Yongxing Cave, Central China. Environ. Earth Sciearth Sci. 77 (12), 474. doi:10.1007/s12665-018-7607-z
Wang, Y., Cheng, H., Edwards, R. L., Kong, X., Shao, X., Chen, S., et al. (2008). Millennial- and Orbital-Scale Changes in the East Asian Monsoon over the Past 224,000 Years. Nature 451, 1090–1093. doi:10.1038/nature06692
Wang, Y., Hu, C., Ruan, J., and Johnson, K. R. (2020). East Asian Precipitation δ 18 O Relationship with Various Monsoon Indices. J. Geophys. Res. Atmos. 125, e2019JD032282. doi:10.1029/2019JD032282
Wang, Y. J., Cheng, H., Edwards, R. L., An, Z. S., Wu, J. Y., Shen, C.-C., et al. (2001). A High-Resolution Absolute-Dated Late Pleistocene Monsoon Record from Hulu Cave, China. Science 294, 2345–2348. doi:10.1126/science.1064618
Wu, R., and Kirtman, B. P. (2007). Observed Relationship of spring and Summer East Asian Rainfall with winter and spring Eurasian Snow. J. Clim. 20, 1285–1304. doi:10.1175/jcli4068.1
Wu, X., and Mao, J. (2016). Interdecadal Modulation of ENSO-Related Spring Rainfall over South China by the Pacific Decadal Oscillation. Clim. Dyn. 47, 3203–3220. doi:10.1007/s00382-016-3021-y
Wu, X., Zhu, X., Pan, M., and Zhang, M. (2014). Seasonal Variability of Oxygen and Hydrogen Stable Isotopes in Precipitation and Cave Drip Water at Guilin, Southwest China. Environ. Earth Sciearth Sci. 72, 3183–3191. doi:10.1007/s12665-014-3224-7
Yang, H., Johnson, K. R., Griffiths, M. L., and Yoshimura, K. (2016). Interannual Controls on Oxygen Isotope Variability in Asian Monsoon Precipitation and Implications for Paleoclimate Reconstructions. J. Geophys. Res. Atmos. 121, 8410–8428. doi:10.1002/2015JD024683
Zhang, H., Brahim, Y., Li, H., Zhao, J., Kathayat, G., Tian, Y., et al. (2019). The Asian Summer Monsoon: Teleconnections and Forcing Mechanisms-A Review from Chinese Speleothem δ18O Records. Quaternary 2, 26. doi:10.3390/quat2030026
Zhang, H., Cheng, H., Cai, Y., Spötl, C., Kathayat, G., Sinha, A., et al. (2018). Hydroclimatic Variations in southeastern China During the 4.2 Ka Event Reflected by Stalagmite Records. Clim. Past 14, 1805–1817. doi:10.5194/cp-14-1805-2018
Zhang, H., Cheng, H., Cai, Y., Spötl, C., Sinha, A., Kathayat, G., et al. (2020). Effect of Precipitation Seasonality on Annual Oxygen Isotopic Composition in the Area of spring Persistent Rain in southeastern China and its Paleoclimatic Implication. Clim. Past. 16, 211–225. doi:10.5194/cp-16-211-2020
Zhang, H., Zhang, X., Cai, Y., Sinha, A., Spötl, C., Baker, J., et al. (2021). A Data-Model Comparison Pinpoints Holocene Spatiotemporal Pattern of East Asian Summer Monsoon. Quat. Sci. Rev. 261, 106911. doi:10.1016/j.quascirev.2021.106911
Zhang, J., and Li, T.-Y. (2019). Seasonal and Interannual Variations of Hydrochemical Characteristics and Stable Isotopic Compositions of Drip Waters in Furong Cave, Southwest China Based on 12 years' Monitoring. J. Hydrol. 572, 40–50. doi:10.1016/j.jhydrol.2019.02.052
Keywords: drip water, hydrogen and oxygen isotope, East Asian summer monsoon, moisture source, cave monitor
Citation: Tian Y, Zhang H, Zhang R, Zhang F, Liang Z, Cai Y and Cheng H (2021) Seasonal and Inter-Annual Variations of Stable Isotopic Characteristics of Rainfall and Cave Water in Shennong Cave, Southeast China, and Its Paleoclimatic Implication. Front. Earth Sci. 9:794762. doi: 10.3389/feart.2021.794762
Received: 14 October 2021; Accepted: 15 November 2021;
Published: 14 December 2021.
Edited by:
Valdir Felipe Novello, University of São Paulo, BrazilReviewed by:
Angela Ampuero, University of São Paulo, BrazilLi Lo, National Taiwan University, Taiwan
Copyright © 2021 Tian, Zhang, Zhang, Zhang, Liang, Cai and Cheng. This is an open-access article distributed under the terms of the Creative Commons Attribution License (CC BY). The use, distribution or reproduction in other forums is permitted, provided the original author(s) and the copyright owner(s) are credited and that the original publication in this journal is cited, in accordance with accepted academic practice. No use, distribution or reproduction is permitted which does not comply with these terms.
*Correspondence: Haiwei Zhang, emhhbmdoYWl3ZWlAeGp0dS5lZHUuY24=