 Yuetong Yang
 Xiaogang Song
 Wenyu Gong
 Chunyan Qu
- State Key Laboratory of Earthquake Dynamics, Institute of Geology, China Earthquake Administration, Beijing, China
In this article the ascending and descending Sentinel-1A satellite data are used to investigate the coseismic slip model of the 2022 Mw6.7 Menyuan earthquake in Qinghai, China. The optimal slip model indicates that this event ruptured two fault segments. The main rupture concentrated on the western Lenglongling fault (LLLF) with a purely left-lateral striking-slip motion. A small part of the eastern Tuolaishan fault (TLSF) section was also ruptured, and the motion on it is mainly oblique slip at depth, with an obvious thrust component. Combined with the rupture characteristics of historical events, GPS velocity map, and slip rate studies, we suggest that the TLSF–LLLF junction is a demarcation point where the deformation partitioning pattern has changed. Along the whole LLLF segment, the oblique convergence has completely partitioned into slip on the purely strike-slipping LLLF and thrusting faults in the north. The TLSF segment accommodates a fraction of compressional shortening, which compensates for the discrepancy in the left-lateral slip rate between the LLLF and TLSF. Such transformation in the strain partitioning pattern is likely to be determined by the geometric relationship between the fault strike and the direction of regional block movement.
Introduction
On 8 January 2022, an Mw6.7 earthquake struck ∼59 km far away from Menyuan County in the Qinghai Province of northwestern China at the western section of the Qilian–Haiyuan fault (QL-HYF) zone. According to the focal-mechanism solution reported by the United States Geological Survey (USGS) and Global Centroid Moment Tensor (GCMT), the fault movement caused by the main shock was dominated by an NWW left-lateral strike-slip with a thrust component (Table 1; Figure 1).
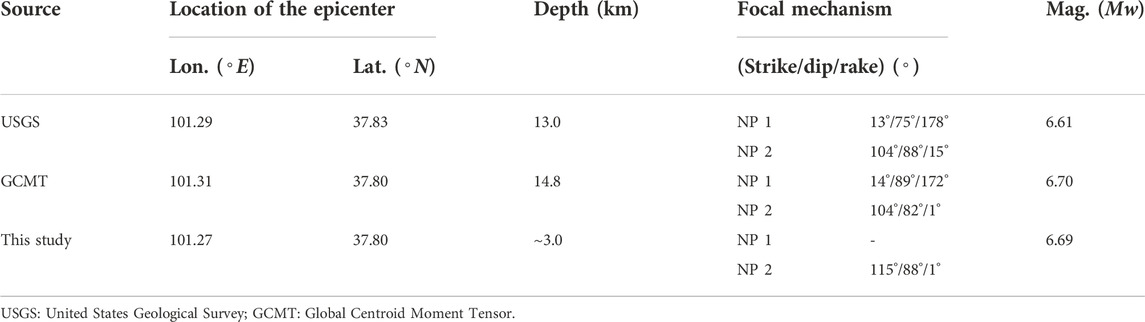
TABLE 1. Focal mechanisms of the 2022 Menyuan earthquake reported by different studies.
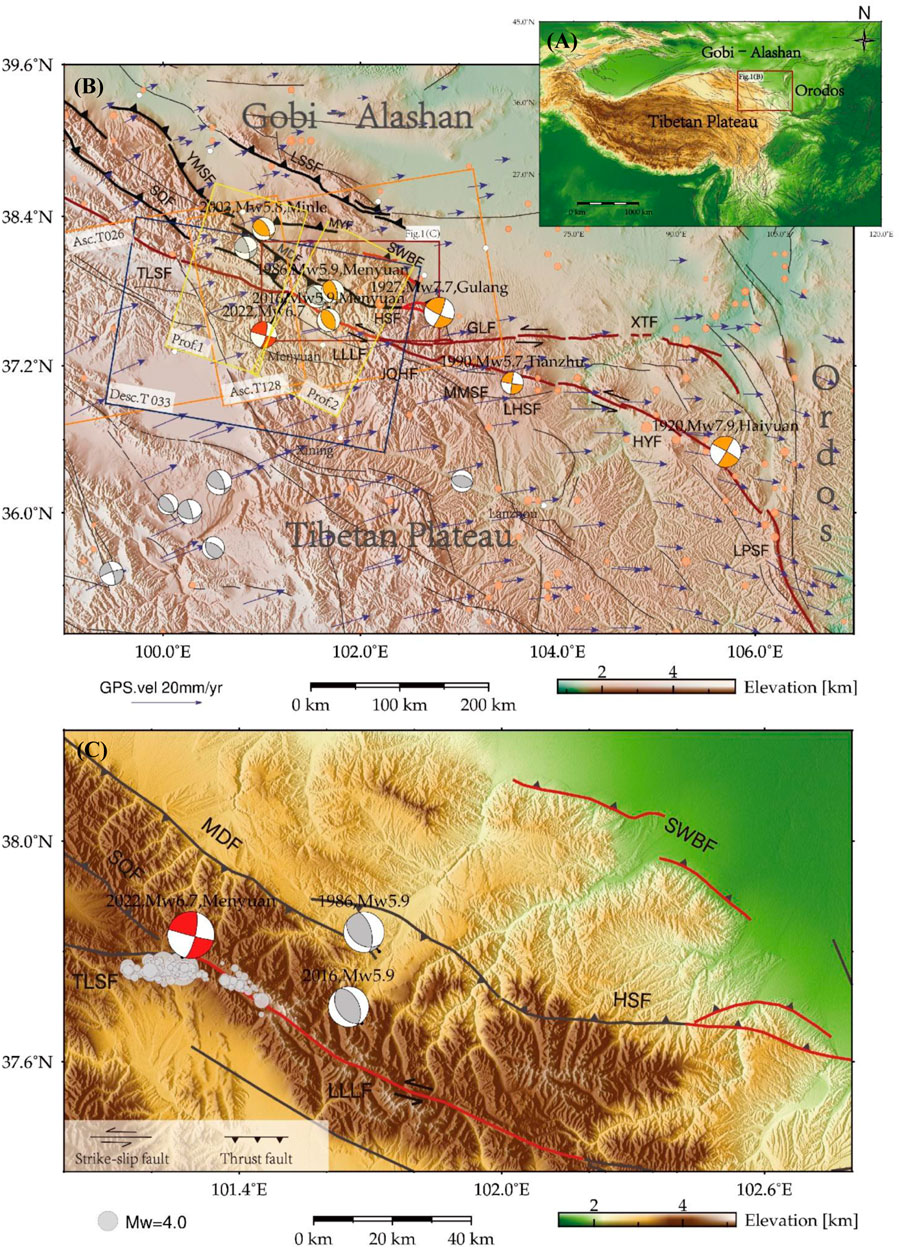
FIGURE 1. Tectonic setting of the 2022 Mw6.7 Menyuan earthquake. (A) Tectonic setting of the Qilian–Haiyuan fault (QL–HYF) zone. (B) Main faults in the NE Tibetan Plateau. Active faults are from Deng et al. (2007) (https://www.activefault-datacenter.cn/map). The Mw 5.7 + historical earthquakes that occurred along the QL–HYF zone since 1920 are marked by the GCMT focal mechanisms. Arrows indicate GPS velocities from Wang and Shen, (2020). The orange and blue rectangles outline the coverage of ascending and descending Sentinal-1 SAR data. Two yellow rectangles outline the coverage of the GPS profiles across the TLSF and LLLF, which are shown in Supplementary Figure S1. TLSF: Tuolaishan fault; LLLF: Lenglongling fault; JQHF: Jinqianghe fault; MMSF: Maomaoshan fault; LHSF: Laohushan fault; HYF: Haiyuan fault; LPSF: Liupanshan fault; GLF: Gulang fault; XTF: Xiangshan–Tianjingshan fault; HSF: Huangcheng–Shuangta fault; SWBF: Southern Wuwei Basin fault; SQF: Sunan–Qilian fault; YMSF: Yumushan fault; MDF: Minle–Damaying fault; MYF: Minle–Yongchang fault; LSSF: Longshoushan fault. (C) Tectonic map in the seismogenic area of the 2022 Mw6.7 Menyuan earthquake. The surface rupture of the 1927 Gulang earthquake in red is modified from Guo et al. (2020). The gray circles present the aftershocks within the first 10 days after the main shock was recorded by the local seismometer array (Fan et al., 2022). Two moderate-thrust earthquakes that occurred in this region in 1986 and 2016 are marked by the GCMT focal mechanisms.
As the leading edge of the northeastern Tibetan Plateau, the QL-HYF zone accommodates about a quarter of the convergence rate driven by the ongoing collision of the India and Eurasia plates, as shown in previous investigations (e.g., Molnar & Tapponnier, 1975; England & Houseman, 1985; Tapponnier et al., 1990; Pichon et al., 1992; England & Molnar, 1997; Tapponnier et al., 2001; Flesch et al., 2001; Yuan et al., 2013; Zuza et al., 2018). The strain distribution of the NE Tibetan Plateau from the recent Global Navigation Satellite System (GNSS) and interferometric synthetic aperture radar (InSAR) observations (Wang and Shen, 2020; Huang et al., 2022; Ou et al., 2022; Figure 1B) shows dominant shearing deformation on the middle of the northeast edge of the Tibetan Plateau and extrusion deformation on the eastern and western areas. The left-lateral shearing deformation largely focuses on the QL–HYF zone. Previous studies have suggested that an ESE trending continuously transferred deformation along fault segments of the QL–HYF zone from west to east (Gaudermer et al., 1995; Lasserre et al., 2002; Yuan et al., 2004; Zheng et al., 2013; Yao et al., 2019). However, recent studies do not seem to support such a tectonic transformation model. Field geological investigations at the middle QL–HYF zone show that the strain on the middle Lenglongling fault (LLLF) tends to be transferred northeast forward to the eastern LLLF, rather than transmitted eastward to the Jinqianghe fault (JQHF) (Guo et al., 2019, 2020; Gao et al., 2021). InSAR observations from Envisat and Sentinel-1 satellites present slip partitioning and segmented movement for the 1,000-km QL–HYF system (Daout et al., 2016; Huang et al., 2022; Ou et al., 2022). As for the western section of the QL–HYF (the TLSF and further west), the fault slip rate and strain partitioning have not been properly investigated. Previous research (IGLIS, 1993; Yuan et al., 2003; Deng et al., 2007; Xu et al., 2016) concentrated on the left-lateral shear movement on the TLSF and suggested a dominant sinistral strike-slip on the TLSF. Huang et al. (2022) suggested that the Qilianshan absorbs ∼4 mm/yr left-lateral shear discrepancy between the TLSF and middle segment of the QL–HYF by shortening, given a low dip-slip rate on the TLSF from the InSAR profile inversion. However, the recent cross-fault GPS and leveling profiles show an obvious shortening and vertical deformation across the TLSF (Li et al., 2022, Supplementary Figure S1). It is controversial how the strain is partitioned along the western section of the QL–HYF and other faults in the north. The present-day slip rates estimated from InSAR cross-fault profiles (Huang et al., 2022; Ou et al., 2022) show an obvious step between the Tuolaishan fault (TLSF) segment and LLLF segment, where the 2022 Menyuan event occurred. It is a good opportunity to investigate the tectonic role of the TLSF and LLLF sections in the deformation transformation model of the northeast edge of the Tibetan Plateau from this earthquake.
In this study, both the ascending and descending interferograms from the Sentinel-1A satellite, whose tropospheric delays were corrected by a method dedicated to the small-to-moderate-magnitude earthquake proposed by Gong et al. (2022), were used to investigate the coseismic displacements of the Menyuan earthquake. Combined with previous geodetic and geological observations, we try to 1) determine the slip kinematics of the 2022 Mw6.7 Menyuan earthquake and discuss its tectonic implications and 2) analyze how the tectonic deformation is transformed from the TLSF to LLLF. Our results will help to improve understanding of the deformation partitioning patterns in the western section of the northeastern edge of the Tibetan Plateau.
Tectonic setting
As a major tectonic structure in the northeastern margin of the Tibetan Plateau, the QL–HYF zone plays an important role in accommodating the northeastward expansion of the Tibetan Plateau into the continental interior (e.g., Lasserre et al., 2002; Duvall and Clark, 2010; Zheng et al., 2013; Guo et al., 2017; Huang et al., 2022). Located at the convergence boundaries between Tibet, Gobi–Alashan block and Ordos block, it presents a geometrical complexity along faults, composed of several segments (Figures 1A,B), i.e., the TLSF, LLLF, JQHF, Maomaoshan fault (MMSF), Laohushan fault (LHSF), Haiyuan fault (HYF), and Liupanshan fault (LPSF) from west to east. Fault kinematics and seismicity on those fault segments have been extensively studied by using both geological and geodetic observations over the last decades. Although a high west-to-east decreasing strike-slip rate (19 ± 5 mm/yr and 12 ± 4 mm/yr) is suggested for the QL–HYF by early geological studies (Zhang et al., 1988; Lasserre et al., 1999; Lasserre et al., 2002), the follow-on research studies give a relatively consistent estimate with an arc-shaped distribution, from 0–2 mm/yr in the western end to 4.5–9 mm/yr in the middle section, and then decreasing to 0–2 mm/yr in the eastern end near the LPSF (e.g., He et al., 2001; Gan et al., 2007; Li et al., 2009; Duvall and Clark, 2010; Loveless and Meade, 2011; Zheng et al., 2013; Jiang et al., 2017; Liu et al., 2018; Shao et al., 2020). InSAR observations (Daout et al., 2016; Song et al., 2019; Huang et al., 2022; Ou et al., 2022) provide a detailed slip rate and slip partitioning map on the QL–HYF and some northerly located faults, such as the Gulang fault (GLF), Xiangshan–Tianjingshan fault (XTF), Huangcheng–Shuangta fault (HSF), Southern Wuwei Basin fault (SWBF), Sunan–Qilian fault (SQF), Yumushan fault (YMSF), Minle–Damaying fault (MDF), Minle–Yongchang fault (MYF), and Longshoushan fault (LSSF) (Figures 1B,C). The QL–HYF zone was seismically active in the past century. More than six Mw5.5+ earthquakes occurred along it, including the 1920 Mw7.9 Haiyuan earthquake, 1927 Mw7.7 Gulang earthquake, 1986 Mw5.9 Menyuan earthquake, 1990 Mw5.7 Tianzhu earthquake, 2003 Mw5.8 Minle earthquake, and 2016 Mw5.9 Menyuan earthquake (Table 2; Figures 1B,C).
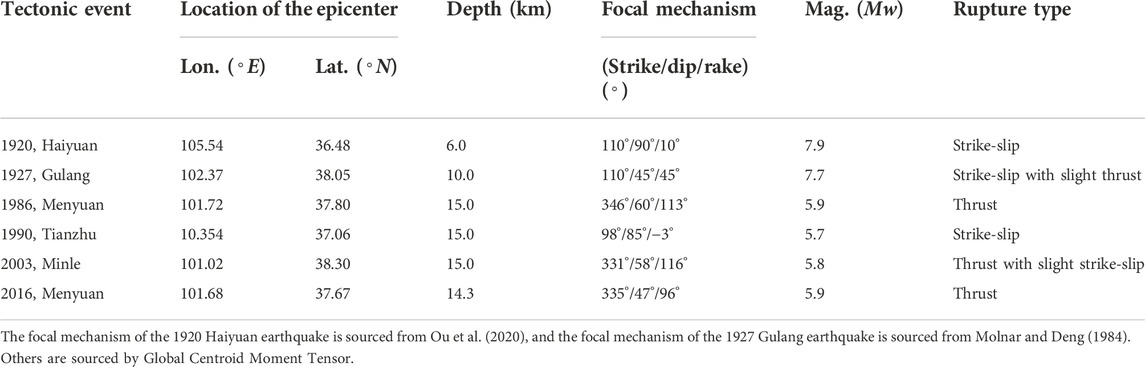
TABLE 2. Focal mechanisms of the historical tectonic events (Mw> 5.7) in the QL–HYF zone.
The seismogenic fault of the 2022 Mw6.7 Menyuan earthquake is the TLSF–LLLF, the western section of the QL–HYF. Tectonically, the LLLF branches into the TLSF and northerly located SQF at its western end, and the TLSF steps left in a ∼3-km left-stepped en echelon pattern (Guo et al., 2019; Pan et al., 2022). The TLSF and further west have not been properly investigated due to inaccessibility and remoteness, and it is suggested to be dominated by a sinistral strike-slip (Deng et al., 2007). The recent InSAR results (Huang et al., 2022) gave a strike-slip rate map along the TLSF, and its along-strike-slip rate gradually increases from 1.8 ± 0.3 mm/yr close to Halahu in the western end, to 2.8 mm/yr in the middle, and 3.5 mm/yr along the easternmost segment. The motion on the LLLF is predominantly left-lateral strike-slip during the late Quaternary (Guo et al., 2020), following a thrusting movement due to the northeastward compression in the early Quaternary (He et al., 2001; Li et al., 2009). Most studies of the geological slip rate of the LLLF focus on the middle section. Among those studies, the two most recent studies from Jiang et al. (2017) and Guo et al. (2017) reported a consistent estimate with a slip rate of 6.6 ± 0.3 mm/yr and 6.4 ± 0.7 mm/yr, respectively, in agreement with InSAR-inverted one (6.4 ± 0.5 mm/yr) by Huang et al. (2022). Gao et al. (2021) gave a slip rate of 6.0 ± 0.8 mm/yr for the eastern section of the LLLF, similar to the estimates in the middle section. In the western section, a slip rate of 4.6 ± 0.2 mm/yr can be seen on the InSAR-inverted results (Huang et al., 2022). No Mw 5+ earthquake was recorded on the LLLF in instrumental record history. Two moderate-magnitude thrust earthquakes occurred on the MDF and northern LLLF in 1986 and 2016, respectively.
Coseismic displacement from InSAR
The C-band TOPS-mode Sentinel-1A images with different observation geometries were used to extract the coseismic displacement maps of the 2022 Menyuan earthquake in the line-of-sight (LOS) direction. The ascending (track 026 and 128) and descending (track 33) interferometric pairs were processed using GAMMA software (Wegmüller et al., 2016). Interferograms were produced with a registration accuracy higher than 0.001 pixel. A 30-m ALOS World 3D DEM was used to remove the topographic phase. The precise orbit data from the European Space Agency (ESA) were employed to reduce the orbital artifacts. After adaptive filtering (Goldstein and Werner., 1998), differential interferograms were unwrapped using the minimum cost flow (MCF) methods (Werner et al., 2002). The coseismic interferometric fringes in Figure 2 show a deforming area of ∼120 × 80 km2. Similar butterfly-shaped fringe patterns on the descending and ascending interferograms with opposite deformation directions (Figure 2) demonstrate a predominant left-lateral strike-slipping movement on the seismogenic fault of this earthquake. Two cross-fault profiles with 80 km length and 2 km width are extracted from the unwrapping results (Figure 3 and Figure 4). The results reveal that the LOS displacements on the ascending track 128 vary from -0.61 to 0.44 m; they vary from -0.68 to 0.45 m for the ascending track 026 and from -0.51–0.64 m for the descending track 033. The maximum displacement is measured to be ∼0.68 m. The range offset maps are extracted from the ascending track 128 and descending track 33 Sentinel-1A data (Figure 5). A clear surface rupture can be identified based on them, which fits well with the field investigation of Pan et al. (2022) (Figure 5A).
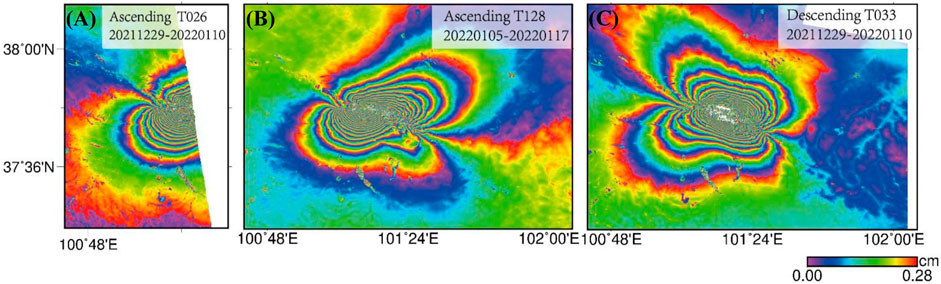
FIGURE 2. Coseismic interferograms of the 2022 Mw6.7 Menyuan earthquake observed by InSAR. (A) Ascending track 026, (B) ascending track 128, and (C) descending track 033 of the Sentinel-1A.
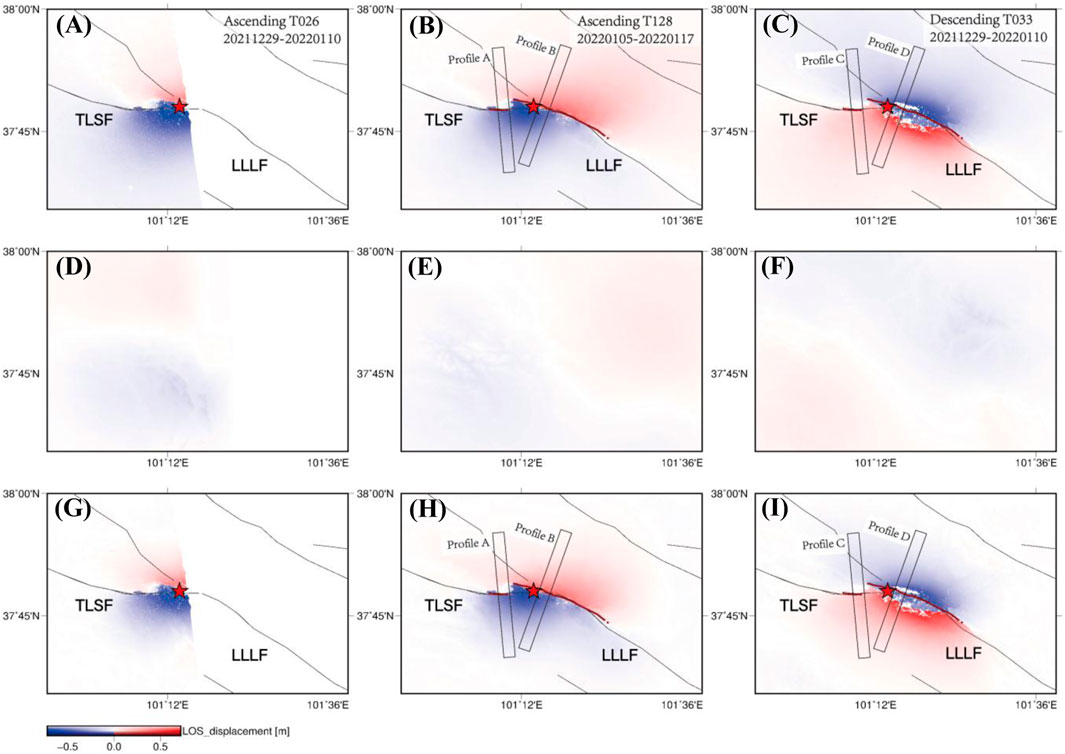
FIGURE 3. Atmospheric correction for the ascending and descending data. (A–C) LOS displacement maps before atmospheric correction. (D–F) Stratified tropospheric delay, estimated using the SSC method. (G–I) After atmospheric correction. The epicenter is indicated by a red star, and the dark-red line indicates the field-investigated surface rupture from Pan et al. (2022).
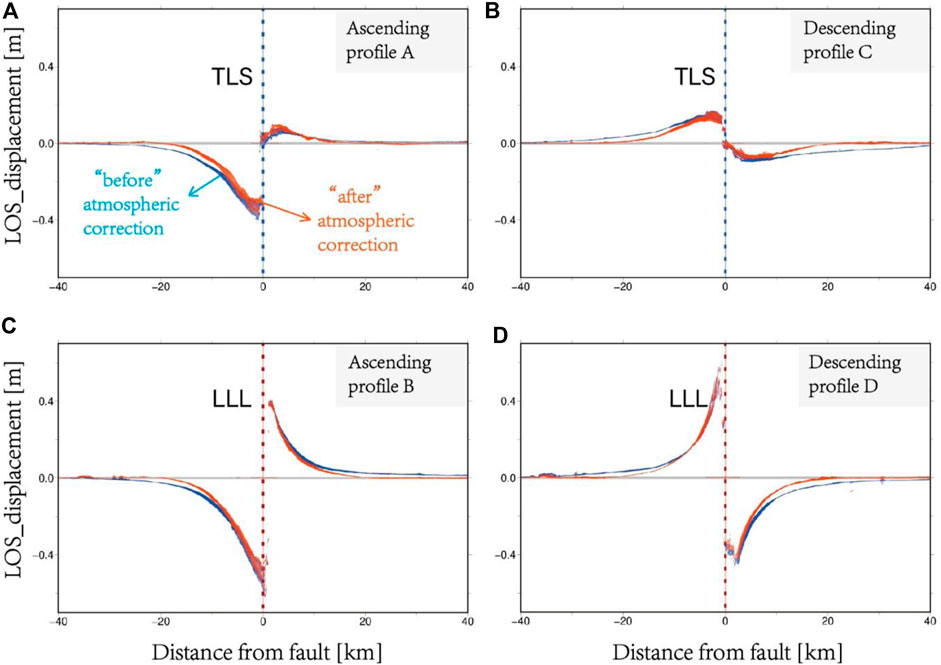
FIGURE 4. LOS displacement profiles, which are indicated in Figure 3. Profiles (A,C) are perpendicular to the TLSF, and profiles (B,D) are perpendicular to the LLLF.
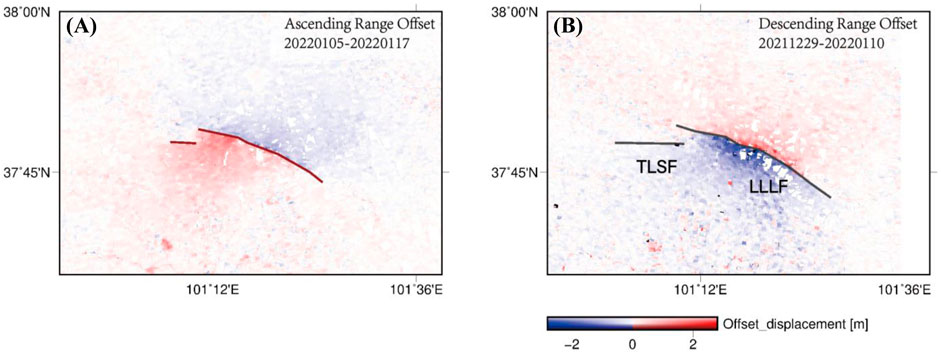
FIGURE 5. Range offsets derived from Sentinel-1A ascending track 128 (A) and descending track 033 (B) by using the offset-tracking technique. The dark-red line marked in (A) indicates the field-investigated surface rupture from Pan et al. (2022), and the gray line marked in (B) indicates the two-segment fault model used in our Slip inversion in Section 4.
The uncertainties in InSAR observations have a significant influence on the inversion accuracy of the fault slip models (Lohman and Simons, 2005; Dawson and Tregoning, 2007), especially for small-to-moderate-magnitude earthquakes, whose coseismic surface displacement is small, it is easy to be contaminated by noises in interferograms, such as atmospheric noise. Simulation from Dawson and Tregoning, (2007) demonstrates coseismic deformation caused by an Mw6.2 earthquake deeper than 10 km, or an Mw 5.5 earthquake deeper than 6 km, is undetectable by the InSAR technique. Therefore, it is necessary to correct the atmospheric signals in interferograms before using them as constraints in slip inversion. Considering a relatively small deforming area generated by small-to-moderate-magnitude earthquakes, the local atmospheric effect on the interferometric phase is mainly from the stratified tropospheric delay. To mitigate the stratified tropospheric effect, a simple-stratification-correction (SSC) approach dedicated to small-to-moderate-magnitude earthquakes was implemented, whose performance has been validated using 23 real earthquakes in Gong et al. (2022). Comparing the ascending and descending results “before” and “after” correction (Figures 3, 4), we can see that the SSC performs well in reducing local stratified contribution in this event. The relative deformation between the hanging wall and footwall is reduced by ∼ 2% (∼2 cm) (Figure 4).
Slip inversion
To examine the coseismic slip model, the InSAR data from three tracks (26, 128, and 33) and offsets from two tracks (128 and 33) were used to invert for the slip distribution. A homogeneous elastic dislocation model was adopted to calculate the Green’s function using the EDGRN program (Wang et al., 2013), and the Poisson ratio was set to 0.25. We manually cut off the near-fault InSAR data to avoid the influence of unwrapping errors due to the low coherence near the rupture. Three LOS displacement maps and two range offset data are down-sampled using the QuadTree algorithm (Jónsson et al., 2002) to reduce the data volume. Based on the surface displacement gradient on the offset results and field investigation from Pan et al. (2022), the fault surface trace is mapped, composed of a ∼22.7-km-long segment on the western section of LLLF and a ∼4.5-km one on the eastern section of the TLSF (Figures 3, 5A). Therefore, we assumed a south dipping two-segment fault model for the inversion (Figure 5B). We fixed the fault trace on the ground for the two segments, and then they are extended down dip and along strike. The fault planes were equally discretized into subfaults with a size of 2 km by 2 km. An efficient FORTRAN program “steepest decent method” (Wang et al., 2013) was applied to resolve the optimal slip model with the weight factors of 1.0 and 0.5 allocated to the InSAR data and offset data, respectively. A grid search method was performed to estimate the fault dips in the range of 50–90° in steps of 2°. Simultaneously, the slip distribution was determined.
To analyze the influence of atmospheric correction on coseismic slip inversion, we conducted inversions twice by using two groups of the InSAR dataset— Group A: the ascending and descending InSAR LOS displacement fields “before” atmospheric correction; Group B: ones “after” atmospheric correction. The InSAR observations, best-fitting models, residuals, and slip distribution from Group B are shown in Figures 6, 7 (see the corresponding results from Group A in Supplementary Figures S2, S3). We found that both models give a good data-model correlation (0.9617 and 0.9535), but the mean slip and moment magnitude is overestimated before atmospheric correction for this event by comparing two inversion results. The mean slips decrease by ∼ 12.5% from 0.24 to 0.21 m for the eastern TLSF rupture and by ∼ 18.3% from 0.82 to 0.67 m for the western LLLF rupture after correction (Table 3). Accordingly, the moment magnitude decreases from Mw6.74 to Mw6.69 after atmospheric correction, closer to the solutions from GCMT and USGS (Table 1). Both models gave a similar slip distribution pattern with two asperities, located on the western LLLF rupture segment and eastern TLSF rupture segment. The main rupture concentrates on the LLLF segment with the predominant slip patches above 10 km, which takes ∼80% of total releasing moment energy. The best-fitting dips for two segments are approximately vertical (88°). In agreement with the focal mechanism solutions, the slip on the LLLF rupture segment is purely left-lateral striking-slip motion with a maximum slip of 2.90 m, which is consistent with the results from Li et al. (2022) and Yu et al. (2022). On the TLSF rupture segment, another asperity with a small slip magnitude is found. In contrast to the left-lateral strike-slip movement on the LLLF segment, the motion on the TLSF segment is mainly oblique slip at depth, with an obvious thrust component.
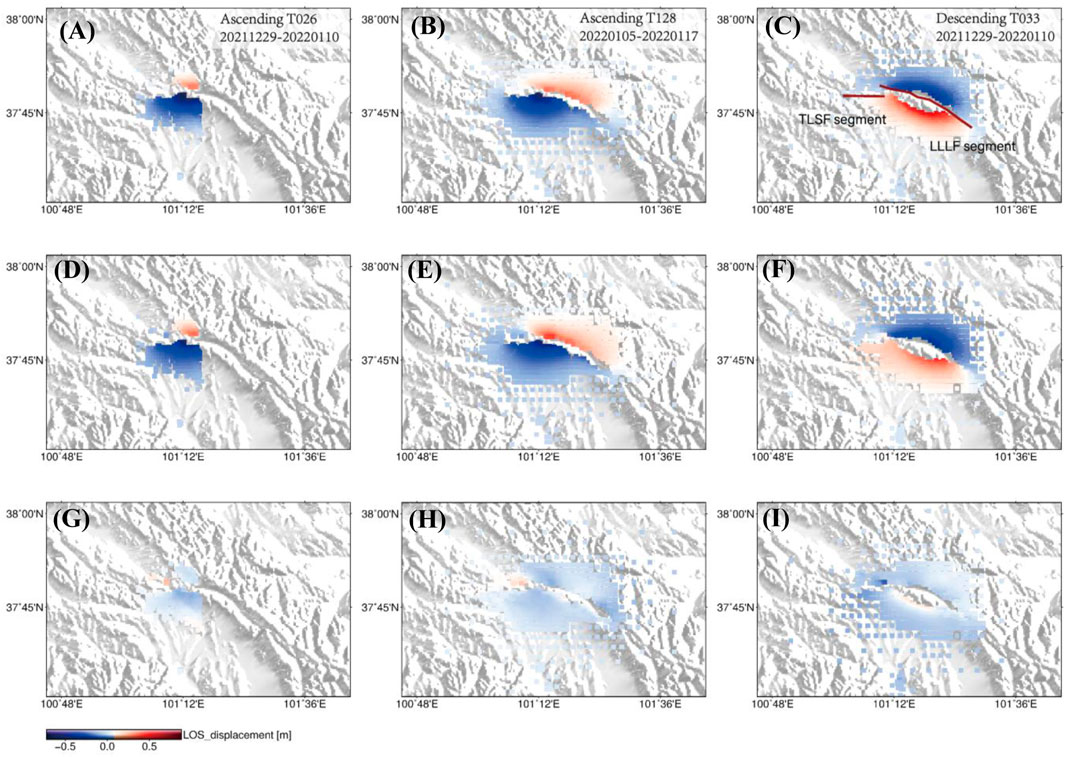
FIGURE 6. InSAR observations after atmospheric correction (A–C), models (D–F), and residuals (G–I) for the three tracks (26, 128, and 33) in inversion. The fault-traces of the TLSF and LLLF segments used for this slip inversion are indicated in red lines.
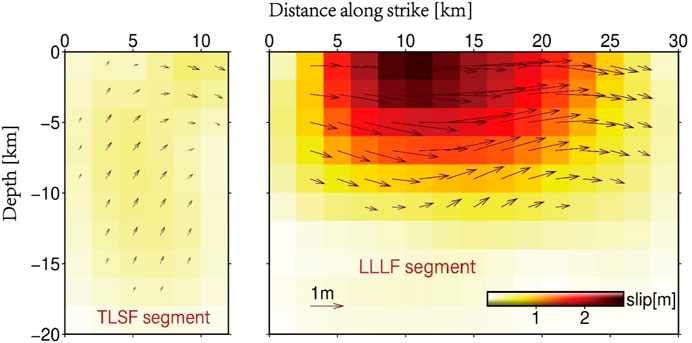
FIGURE 7. Coseismic slip distribution of the 2022 Mw6.7 Menyuan earthquake constrained by the atmospheric-corrected InSAR data.
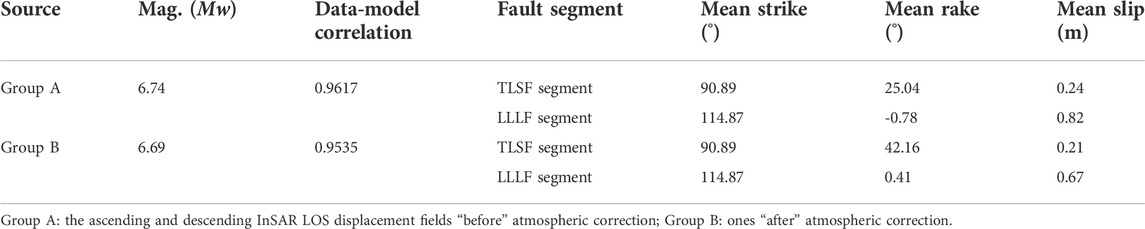
TABLE 3. Inversion results of the 2022 Menyuan earthquake from different data set groups.
Implications for the strain partitioning pattern in the northwestern section of the QL–HYF zone
The modeling results from Bowman et al. (2003) showed that oblique contraction or extension at depth along tectonic boundaries is expected to be accommodated on predominantly strike-slip and dip-slip faults at the surface, which are observed in many large earthquakes on the block boundaries, such as the 2016 Mw7.0 Kumamoto earthquake in Japan: strike-slip plus normal faults (Toda et al., 2016), the 2018 Mw 7.5 Sulawesi earthquake in Indonesia: strike-slip plus normal faults (Song et al., 2019), and the 1927 M8.0 Gulang earthquake in China: strike-slip plus thrust faults (Guo et al., 2020). As block convergence boundaries in the northeast edge of the Tibetan Plateau, the QL–HYF zone is undergoing oblique compression and strain accumulation, accommodating part of the NE expansion of the Tibetan Plateau together with the GLF, XTF, HSF, and SWBF in the northwestern section of the QL–HYF (west of LLLF–JQHF–GLF triple junction), oblique convergence is partitioned into slip on the purely strike-slipping LLLF and thrusting faults in the north, which is verified by recent findings about the surface rupture of the 1927 Gulang large earthquake: a ∼120-km-long strike-slip rupture along the LLLF and a ∼42-km-long thrust rupture along the SWBF and eastern HSF (Guo et al., 2020). There are some questions related to such slip partitioning system that remain unknown: 1) where the oblique compression starts to be completely partitioned into left-lateral strike-slip motion and thrust faulting at the ground surface in the northwestern area of the QL–HYF zone and 2) why the same style of deformation partitioning does not maintain along the middle-east section of the QL–HYF (east of LLLF–JQHF–GLF triple junction).
The optimal slip model achieved in Section 4 shows that this earthquake has ruptured two fault segments: the western LLLF segment with pure strike-slip motion and a small part of the eastern TLSF section with an obvious oblique slip (Figure 8C). Two moderate-magnitude thrust earthquakes, the 1986 and 2016 Mw5.9 Menyuan earthquakes, also occurred in the north of LLLF. Combined with the slip-partitioning rupture in the 1927 Gulang earthquake, it is reasonable to suggest that the oblique slip at depths along the whole LLLF segment has completely partitioned into strike-slip and thrust slip at surface in the transpressional QL–HYF systems. As for the TLSF segment, the interseismic InSAR slip rate map shows an obvious step between the eastern TLSF segment (3.5 mm/yr) and LLLF segment (6.4 mm/yr) (Figure 8B). The discrepancy in the left-lateral strike-slip rate between different segments along the QL–HYF is caused by how the strain is partitioned on the QL–HYF and other faults in the north. Given that the oblique slip occurred on the fault plane on the eastern TLSF segment in this earthquake, the strike-slip rate discrepancy between the eastern TLSF segment and LLLF segment is taken up by dip-slip on the TLSF segment together with the shortening of the Qilianshan in the north. Therefore, we suggest that the TLSF–LLLF junction is a demarcation point where the strain partitioning pattern has changed (Figure 8A). Such transformation is likely to be controlled by the change of fault geometry relative to the direction of regional block movement. Geological investigation shows the TLSF steps left in a ∼3-km en echelon pattern at the western end of LLLF (Guo et al., 2020; Pan et al., 2022). Likewise, in the middle-east section of the QL–HYF zone, the deformation partitioning pattern is determined by the geometric relationship between the fault strike and the region extending direction of the Tibetan Plateau. From the GPS velocity map and fault traces (Figure 1, Figure 8A), the angle between the strike of the JQHF–MMSF–LHSF segment and the direction of block movement is much smaller in comparison to the LLLF segment, especially for the GLF and western section of XTF in the north, the fault strike is almost consistent with the direction of block movement (Figure 1), so the expansion of the Tibetan Plateau is mainly absorbed on these two faults in the form of strike-slip.
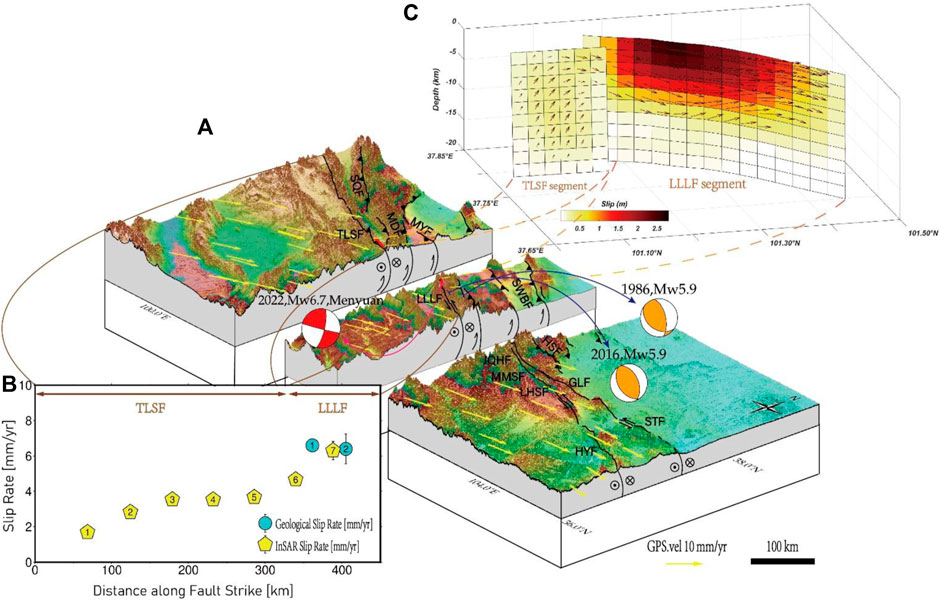
FIGURE 8. (A) Deformation partitioning model in the middle-western section of the northeast edge of the Tibetan Plateau. Yellow arrows show the GPS velocity map from Wang and Shen, (2020). The red lines indicate the rupture on TLSF and LLLF segments for this earthquake. (B) Slip rate distribution along the TLSF and LLLF. Recent geological slip rates from Jiang et al. (2017) and Guo et al. (2017) are indicated in blue circles with No.1 and No.2, respectively; InSAR slip rates from Huang et al. (2022) are shown in yellow pentagon. (C) Three-dimensional fault-slip distribution of the 2022 Menyuan earthquake.
Conclusion
This study carried out interferometric processing with a stratified tropospheric correction dedicated to small-to-moderate-magnitude earthquakes for the ascending and descending interferometric pairs from Sentinel-1A satellite to obtain the coseismic deformation maps for the 2022 Menyuan earthquake. The InSAR-inverted results show that the interferometric deformation maps without atmospheric correction will overestimate the mean slip and moment magnitude for this event. The optimal slip model demonstrates that two segments have been ruptured: a >20-km-long section on the western LLLF with purely left-lateral striking-slip motion and a small part of eastern TLSF with an obvious oblique slip, which implies a change in the deformation partitioning pattern at the surface. Recent slip rate studies and the rupture characteristics of historical events also support the same. The change in the strain partitioning pattern along the northeastern edge of the Tibetan Plateau is likely to be controlled by the change of fault geometry relative to the direction of regional block movement (or the regional principal compressive stress direction). Our study is important for improving understanding of the tectonic transformation style in the NE Tibetan Plateau.
Data availability statement
The original contributions presented in the study are included in the article/Supplementary Material; further inquiries can be directed to the corresponding author.
Author contributions
YYT: InSAR data processing, modeling, drawing figures, and data collection. SXG: writing, idea, and data analysis. GWY: atmospheric correction. QCY: suggestion and communication.
Funding
This study is co-supported by the National Nonprofit Fundamental Research Grant of China, Institute of Geology, China Earthquake Administration (Grant Number IGCEA2206), the National Key Research and Development Program of China (Grant Number 2019YFC1509205), and the National Science Foundation of China (Grant Number 41631073).
Conflict of interest
The authors declare that the research was conducted in the absence of any commercial or financial relationships that could be construed as a potential conflict of interest.
Publisher’s note
All claims expressed in this article are solely those of the authors and do not necessarily represent those of their affiliated organizations, or those of the publisher, the editors and the reviewers. Any product that may be evaluated in this article, or claim that may be made by its manufacturer, is not guaranteed or endorsed by the publisher.
Supplementary material
The Supplementary Material for this article can be found online at: https://www.frontiersin.org/articles/10.3389/feart.2022.1000349/full#supplementary-material
References
Bowman, D., King, G., and Tapponnier, P. (2003). Slip partitioning by elastoplastic propagation of oblique slip at depth. Science 300 (5622), 1121–1123. doi:10.1126/science.1082180
Daout, S., Jolivet, R., Lasserre, C., Doin, M. P., Barbot, S., Tapponnier, P., et al. (2016). Along-strike variations of the partitioning of convergence across the Haiyuan fault system detected by InSAR. Geophys. J. Int. 205 (1), 536–547. doi:10.1093/gji/ggw028
Dawson, J., and Tregoning, P. (2007). Uncertainty analysis of earthquake source parameters determined from InSAR: A simulation study. J. Geophys. Res. 112, B09406. doi:10.1029/2007jb005209
Deng, Q., Ran, Y., Yang, X., Min, W., and Chu, Q. (2007). Active tectonic map of China (in Chinese). Beijing: Seismological Press.
Duvall, A. R., and Clark, M. K. (2010). Dissipation of fast strike-slip faulting within and beyond northeastern Tibet. Geology 38 (3), 223–226. doi:10.1130/g30711.1
England, P., and Houseman, G. (1985). Role of lithospheric strength heterogeneities in the tectonics of Tibet and neighbouring regions. Nature 315 (6017), 297–301. doi:10.1038/315297a0
England, P., and Molnar, P. (1997). Active deformation of Asia: From kinematics to dynamics. Science 278 (5338), 647–650. doi:10.1126/science.278.5338.647
Fan, L. P., Li, B. R., Liao, S. R., Jiang, C., and Fang, L. H. (2022). High-precision relocation of the aftershock sequence of the January 8, 2022, Ms6.9 Menyuan earthquake. Earthq. Sci. 35 (2), 138–145. doi:10.1016/j.eqs.2022.01.021
Flesch, L. M., Haines, A. J., and Holt, W. E. (2001). Dynamics of the India-Eurasia collision zone. J. Geophys. Res. 106 (B8), 16435–16460. Retrieved from 10.1029/2001JB000208. doi:10.1029/2001jb000208
Gan, W., Zhang, P., Shen, Z. K., Niu, Z., Wang, M., Wan, Y., et al. (2007). Present-day crustal motion within the Tibetan Plateau inferred from GPS measurements. J. Geophys. Res. 112 (B8), B08416. doi:10.1029/2005jb004120
Gao, F., Olaf, Zielke., Han, Z. J., Guo, P., Gai, H. L., and Dai, C. L. (2021). Faulted landforms, slip-rate, and tectonic implications of the eastern Lenglongling fault, northeastern Tibetan Plateau. Tectonophysics 823 (2022), 229195. doi:10.1016/j.tecto.2021.229195
Gaudemer, Y., Tapponnier, P., Meyer, B., Peltzer, G., Guo, S., Chen, Z., et al. (1995). Partitioning of crustal slip between linked, active faults in the eastern Qilian Shan, and evidence for a major seismic gap, the ‘Tianzhu gap’, on the Western Haiyuan fault, Gansu (China). Geophys. J. Int. 120 (3), 599–645. doi:10.1111/j.1365-246x.1995.tb01842.x
Goldstein, R. M., and Werner, C. L. (1998). Radar interferogram filtering for geophysical applications. Geophys. Res. Lett. 25, 4035–4038. doi:10.1029/1998gl900033
Gong, W. Y., Zhao, D. Z., Zhu, C. H., Zhang, Y. F., Li, C. L., Zhang, G. F., et al. (2022). A new method for InSAR stratified tropospheric delay correction facilitating refinement of coseismic displacement fields of small-to-moderate earthquakes. Remote Sens. (Basel). 14, 1425. doi:10.3390/rs14061425
Guo, P., Han, Z. J., Dong, S. P., Yuan, R. M., and Xie, Z. D. (2019). Surface rupture and slip distribution along the Lenglongling fault in the NE Tibetan Plateau: Implications for faulting behavior. J. Asian Earth Sci. 172, 190–207. doi:10.1016/j.jseaes.2018.09.008
Guo, P., Han, Z. J., Gao, F., Zhu, C. H., and Gai, H. L. (2020). A new tectonic model for the 1927 M8.0 Gulang earthquake on the NE Tibetan plateau. Tectonics 39. doi:10.1029/2020TC006064
Guo, P., Han, Z. J., Jiang, W. L., and Mao, Z. B. (2017). Holocene left-lateral slip-rate of the Lenglongling fault, northeastern margin of the Tibetan Plateau (in Chinese). Seismol. Geol. 39 (2), 323–341. doi:10.3969/j.issn.0253-4967.2017.02.005
He, W. G., Liu, B. C., Yuan, D. Y., and Yang, M. (2001). Preliminary research on the paleoearthquake along the Lenglongling active fault zone (in Chinese). Res. Act. Fault Ser. 8, 64–74.
Huang, Z. C., Zhou, Y., Qiao, X., Zhang, P. Z., and Cheng, X. (2022). Kinematics of the ∼1000 km Haiyuan fault system in northeastern tibet from high-resolution sentinel-1 InSAR velocities: Fault architecture, slip rates, and partitioning. Earth Planet. Sci. Lett. 583 (2022), 117450. doi:10.1016/j.epsl.2022.117450
Institute of Geology and Lanzhou Institute of Seismology (1993). The qilianshan–hexi corridor active fault system. Beijing: Seismogical Press.
Jiang, W. L., Han, Z. J., Guo, P., Zhang, J. F., Jiao, Q. S., Kang, S., et al. (2017). Slip-rate and recurrence intervals of the east Lenglongling fault constrained by morphotectonics: Tectonic implications for the northeastern Tibetan Plateau. Lithosphere 9 (3), 417–430. doi:10.1130/l597.1
Jónsson, S., Zebker, H., Segall, P., and Amelung, F. (2002). Fault slip distribution of the 1999 Mw 7.1 hector mine, California, earthquake, estimated from satellite radar and GPS measurements. Bull. Seismol. Soc. Am. 92 (4), 1377–1389. doi:10.1785/0120000922
Lasserre, C., Gaudemer, Y., Tapponnier, P., Mériaux, A. S., Van Der Woerd, J., Yuan, D. Y., et al. (2002). Fast late pleistocene slip rate on the LengLong ling segment of the Haiyuan fault, Qinghai, China. J. Geophys. Res. 107 (B11), ETG 4-1–ETG 4-15. ETG 4-1-ETG 4-15. doi:10.1029/2000jb000060
Lasserre, C., Morel, P. H., Gaudemer, Y., Tapponnier, P., Ryerson, F., King, G., et al. (1999). Postglacial left slip rate and past occurrence of M≥8 earthquakes on the Western Haiyuan fault, Gansu, China. J. Geophys. Res. 104 (B8), 17633–17651. doi:10.1029/1998jb900082
Li, C. Y., Zhang, P. Z., Yin, J. H., and Min, W. (2009). Late Quaternary left-lateral slip-rate of the Haiyuan fault, northeastern margin of the Tibetan Plateau. Tectonics 28 (5). doi:10.1029/2008tc002302
Li, Z. H., Han, B. Q., Liu, Z. J., Zhang, M., Yu, C., Chen, B., et al. (2022a). Source parameters and slip distributions of the 2016 and 2022 menyuan, Qinghai earthquakes constrained by InSAR observations[J]. Geomatics Inf. Sci. Wuhan Univ. 47, 887. doi:10.13203/j.whugis20220037
Li, Z. J., Hao, M., Li, Y. H., and Song, S. W. (2022b). Three-dimensional crustal deformation and strain partitioning before the Ms 6.9 Qinghai Menyuan earthquake on January 8, 2022. Chin. J. Geophysics-Chinese Ed.. doi:10.6038/cjg2022Q0046
Liu, J. R., Ren, Z. K., Zhang, H. P., Li, C. Y., Zhang, Z. Q., Zheng, W. J., et al. (2018). Late Quaternary slip-rate of the Laohushan fault within the Haiyuan fault zone and its tectonic implications (in Chinese). Chin. J. Geophys. 61 (4), 1281–1297. doi:10.6038/cjg2018L0364
Lohman, R. B., and Simons, M. (2005). Some thoughts on the use of InSAR data to constrain models of surface deformation: Noise structure and data downsampling. Geochem. Geophys. Geosyst. 6, Q01007. doi:10.1029/2004GC000841
Loveless, J. P., and Meade, B. J. (2011). Partitioning of localized and diffuse deformation in the Tibetan Plateau from joint inversions of geologic and geodetic observations. Earth Planet. Sci. Lett. 303 (1–2), 11–24. doi:10.1016/j.epsl.2010.12.014
Molnar, P., and Denq, Q. (1984). Faulting associated with large earthquakes and the average rate of deformation in central and eastern Asia. J. Geophys. Res. 89, 6203–6227. doi:10.1029/JB089iB07p06203
Molnar, P., and Tapponnier, P. (1975). Cenozoic Tectonics of Asia: Effects of a Continental Collision: Features of recent continental tectonics in Asia can be interpreted as results of the India-Eurasia collision. Science 189 (4201), 419–426. doi:10.1126/science.189.4201.419
Ou, Q., Daout, S., Weiss, J. R., Shen, L., Lazeck´y, M., Wright, T. J., et al. (2022). Large-scale interseismic strain mapping of the NE Tibetan Plateau from sentinel-1 interferometry. J. Geophys. Res. Solid Earth 127, e2022JB024176. doi:10.1029/2022JB024176
Ou, Q., Kulikova, G., Yu, J., Elliott, A., Parsons, B., and Walker, R. (2020). Magnitude of the 1920 haiyuan earthquake reestimated using seismological and geomorphological methods. JGR. Solid Earth 125, 2019JB019244. doi:10.1029/2019JB019244
Pan, J. W., Li, H. B., Chevalier, M-L., Liu, D. L., Li, C., Liu, F. C., et al. (2022). Coseismic surface rupture and seismogenic structure of the 2022 Ms 6.9 Menyuan earthquake, Qinghai Province, China (in Chinese). Acta Geol. Sin. 96 (1), 215–231. doi:10.3389/feart.2022.94866
Pichon, X. L., Fournier, M., and Jolivet, L. (1992). Kinematics, topography, shortening , and extrusion in the India-Eurasia collision. Tectonics 11 (6), 1085–1098. doi:10.1029/92tc01566
Shao, Y., Liu-Zeng, J., Van der Woerd, J., Klinger, Y., Oskin, M. E., Zhang, J., et al. (2020). Late Pleistocene slip rate of the central Haiyuan fault constrained from optically stimulated luminescence, 14C, and cosmogenic isotope dating and high-resolution topography. GSA Bull. 133, 1347. doi:10.1130/b35571.1
Song, X. G., Jiang, Y., Shan, X. J., Gong, W. Y., and Qu, C. Y. (2019). A fine velocity and strain rate field of present-day crustal motion of the northeastern Tibetan plateau inverted jointly by InSAR and GPS. Remote Sens. (Basel). 11, 435. doi:10.3390/rs11040435
Tapponnier, P., Meyer, B., Avouac, J. P., Peltzer, G., Gaudemer, Y., Shunmin, G., et al. (1990). Active thrusting and folding in the Qilian Shan, and decoupling between upper crust and mantle in northeastern Tibet. Earth Planet. Sci. Lett. 97 (3-4), 382–403. doi:10.1016/0012-821x(90)90053-z
Tapponnier, P., Zhiqin, X., Roger, F., Meyer, B., Arnaud, N., Wittlinger, G., et al. (2001). Oblique stepwise rise and growth of the tibet plateau. Science 294 (5547), 1671–1677. doi:10.1126/science.105978
Toda, S., Kaneda, H., Okada, S., Ishimura, D., and Mildon, Z. K. (2016). Slip-partitioned surface ruptures for the Mw 7.0 16 April 2016 Kumamoto, Japan, earthquake. Earth Planets Space 68 (1), 188. doi:10.1186/s40623-016-0560-8
Wang, M., and Shen, Z. K. (2020). Present-day crustal deformation of continental China derived from GPS and its tectonic implications. J. Geophys. Res. Solid Earth 125 (2), e2019JB018774. doi:10.1029/2019jb018774
Wang, R., Diao, F., and Hoechner, A. (2013). “SDM—a geodetic inversion code incorporating with layered crust structure and curved fault geometry,” in EGU General Assembly Conference, Vienna, Austria, 7–12 April 2013. paper presented at the 2013.
Wegmüller, U., Werner, C., Stroozzi, T., Wiesmann, A., Frey, O., and Santoro, M. (2016). Sentinel-1 support in the GAMMA software. Procedia Comput. Sci. 100, 1305–1312. doi:10.1016/j.procs.2016.09.246
Werner, C., Wegmuller, U., Strozzi, T., and Wiesmann, A. (2002). “Processing strategies for phase unwrapping for INSAR applications,” in Proceedings. EUSAR, Cologne, 4-6 June, 2002.
Xu, X., Han, Z., Yang, X., Zhang, S., Yu, G., Zhou, B., et al. (2016). Seismotectonic map in China and its adjacent regions. Beijing: Seismogical Press.
Yao, W., Liu, Z, J., Oskin, M. E., Wang, W., Li, Z., Prush, V., et al. (2019). Re-evaluation of the Late Pleistocene slip rate of the Haiyuan fault near Songshan, Gansu province, China. J. Geophys. Res. Solid Earth 124, 5217–5240. doi:10.1029/2018jb016907
Yu, P. F., Chen, W., Qiao, X. J., Zhao, B., Li, G., Xiong, W., et al. (2022). Slip model of the 2022 menyuan ms 6.9 earthquake constrained by mulit-source SAR data[J]. Geomatics Inf. Sci. Wuhan Univ. 47 (6), 898–906. doi:10.13203/j.whugis20220093
Yuan, D., Liu, X., Zhang, P., and Liu, B. (2003). Characteristic of the modern activity of the Reshui-Riyueshan fault zone in Qinghai province. Seismol. Geol. 25 (1), 155–165. doi:10.3969/j.issn.0253-4967.2003.01.015
Yuan, D. Y., Ge, W. P., Chen, Z. W., Li, C. Y., Wang, Z. C., Zhang, H. P., et al. (2013). The growth of northeastern tibet and its relevance to large-scale continental geodynamics: A review of recent studies. Tectonics 32 (5), 1358–1370. doi:10.1002/tect.20081
Yuan, D. Y., Zhang, P. Z., Liu, B. C., Gan, W. J., Mao, F. Y., Wang, Z. C., et al. (2004). Geometrical imagery and tectonic transformation of late quaternary active tectonics in northeastern margin of qinghai-xizang plateau (in Chinese). Acta Geol. Sin. 78 (2), 270–278. doi:10.3321/j.issn:0001-5717.2004.02.017
Zhang, P. Z., Molnar, P., Burchfiel, B., Royden, L., Wang, Y. P., Deng, Q. D., et al. (1988). Bounds on the Holocene slip rate of the Haiyuan fault, north-central China. Quat. Res. 30 (2), 151–164. doi:10.1016/0033-5894(88)90020-8
Zheng, W., Zhang, P., He, W., Yuan, D., Shao, Y., Zheng, D., et al. (2013). Transformation of displacement between strike-slip and crustal shortening in the northern margin of the Tibetan Plateau: Evidence from decadal GPS measurements and late Quaternary slip rates on faults. Tectonophysics 584, 267–280. doi:10.1016/j.tecto.2012.01.006
Keywords: the Lenglongling fault, the Tuolaishan fault, the 2022 Mw6.7 Menyuan earthquake, Menyuan earthquake, InSAR, deformation partitioning pattern
Citation: Yang Y, Song X, Gong W and Qu C (2023) Fault slip of the 2022 Mw6.7 Menyuan, China earthquake observed by InSAR, and its tectonic implications. Front. Earth Sci. 10:1000349. doi: 10.3389/feart.2022.1000349
Received: 22 July 2022; Accepted: 13 September 2022;
Published: 05 January 2023.
Edited by:
Caijun Xu, Wuhan University, ChinaReviewed by:
Guangcai Feng, Central South University, ChinaYu Zhou, Sun Yat-sen University, China
Lingyun Ji, The Second Monitoring and Application Center, China Earthquake Administration, China
Copyright © 2023 Yang, Song, Gong and Qu. This is an open-access article distributed under the terms of the Creative Commons Attribution License (CC BY). The use, distribution or reproduction in other forums is permitted, provided the original author(s) and the copyright owner(s) are credited and that the original publication in this journal is cited, in accordance with accepted academic practice. No use, distribution or reproduction is permitted which does not comply with these terms.
*Correspondence: Xiaogang Song, c3hnaG9oYWlAaWVzLmFjLmNu