 Sen Zhang1,2,3
 Gongheng Zhang1,2,3Xuping Feng1,2,3Zhengbo Li2,3
 Lei Pan2,3Jiannan Wang2,3Xiaofei Chen1,2,3*
- 1Southern Marine Science and Engineering Guangdong Laboratory (Guangzhou), Guangzhou, China
- 2Department of Earth and Space Sciences, Southern University of Science and Technology, Shenzhen, China
- 3Shenzhen Key Laboratory of Deep Offshore Oil and Gas Exploration Technology, Southern University of Science and Technology, Shenzhen, China
The crustal low-velocity zone (LVZ), an important anomaly found in some regional structures of Iceland, is still absent in the Icelandic average velocity structure due to limitations of tomography methods. Using stations from the HOTSPOT experiment and other supplemental stations throughout Iceland, we apply the frequency-Bessel transform method (F-J method) to extract the first two mode dispersion curves from ambient noise data. We obtain an average S-wave velocity (Vs) model of Iceland down to 120 km depth, where two LVZs at depths of 12–22 km and below 55 km are found. The shallow LVZ, whose rationalities are justified using theoretical dispersion curves of certain models to recover themselves, may improve the understanding of the Icelandic average crust. Furthermore, our model shows better representativeness by comparing travel time residuals of the primary wave between observed and synthetic data predicted using different average velocity models. Based on the variations of the Vs gradient, the Icelandic crust with an average thickness of 32 km is divided into the upper crust (0–10 km), middle crust (10–22 km), and lower crust (22–32 km). The asthenosphere starts from the deeper LVZ at 55 km depth, potentially indicating the relatively concentrated melt in this depth range. In this study, crustal LVZs are revealed both in a volcanic active zone and a non-volcanic zone, which may also suggest the LVZ in the average model has more complex origins than the high-temperature zone beneath the central volcanoes. The prevalent thick-cold crustal model of Iceland, considered to rule out the existence of a broad region of partial melt in the crust, also strengthens the possibility of diverse origins. The variations in petrology may also contribute to the crustal LVZ in the average model.
1 Introduction
The interaction between the spreading Mid-Atlantic rift and Iceland hotspot promotes frequent magmatic events such as eruptions in central volcanoes (blue points in Figure 1) and distinct fissure swarms (blue lines in Figure 1, Johannesson and Saemundsson, 1998) in Iceland. Previous studies based on seismic tomography have revealed a cylindrical low-velocity anomaly in the mantle of Iceland (e.g., Wolfe et al., 1997; Foulger et al., 2001; Allen et al., 2002a; Rickers et al., 2013), which may be a result of the upwelling plume. In addition, some evidence from geochemical anomalies around the ridge also supports the plume hypothesis (e.g., Schilling, 1973; White et al., 1992; Shorttle and Maclennan, 2011).
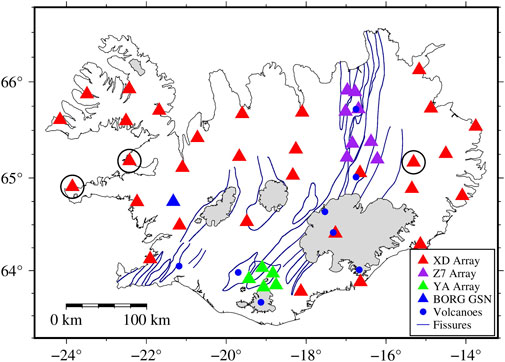
FIGURE 1. Tectonics map of Iceland and seismic stations used in this study. Different seismic networks are identified by triangles with different colors, which include stations from the XD array (red), Z7 array (purple), YA array (green), and BORG (blue). The blue points and lines show major volcanoes and fissure swarms (Johannesson and Saemundsson, 1998), respectively. The glaciers are identified by gray. The stations circled in black are removed finally when we study the average structure in Iceland (see Supplementary Material S1 for further details).
After the first seismic field observation during the 1960s, a great deal of work has been undertaken to study the crust of Iceland which has obtained similar seismic velocities, but the thickness of the Icelandic crust has been a subject of controversial debate for a long time due to different interpretations of such velocities. There are two dominant but different models of the Icelandic crust. The early thin-hot crust model underlain by an unusual low-velocity uppermost mantle has a thickness of approximately 10–20 km (e.g., Tryggvason, 1962; Pálmason, 1971). The downward extrapolation of near-surface temperature gradients obtained from shallow boreholes in Iceland predicts supra-solidus temperatures and partially molten basaltic material at 10–20 km depths (e.g., Flóvenz and Saemundsson, 1993). In addition, a high-conductivity layer at 10–20 km depths over northeast Iceland, interpreted as the base of the crust, has been detected by magnetotelluric measurements (e.g., Beblo and Bjornsson, 1980).
Bjarnason et al. (1993) reported a Moho depth at 20–24 km from wide-angle reflections and a refractor P-wave velocity (Vp) ∼7.7 km/s in southwestern Iceland. Additionally, strong P-wave and S-wave reflections have been observed from depths of up to 40 km (Staples et al., 1997; Darbyshire et al., 1998), which leads to an alternative thick-cold crust model with a high-velocity lower crust. Little seismic attenuation with high values of Q in the lower crust also supports this model, which indicates colder crustal temperature below the solidus of gabbro and rules out a broad region of partial melt above Moho (Menke and Levin, 1994; Menke et al., 1995). It can be inferred that the additional layer, referring to the mantle-derived peridotite layer beneath the typical three-layered oceanic crustal structure, will lead to a thin-hot crust model when it is interpreted as an unusual low-velocity upper mantle. However, a thick-cold crust model can be obtained if the additional layer is regarded as a high-velocity lower crust, which has become more prevalent and favored by recent studies (e.g., Darbyshire et al., 2000b; Allen et al., 2002b; Jenkins et al., 2018).
Due to the existence of the plume, the thickness of the Icelandic crust increases in some areas, and the thickest crust is found near the center of the hotspot (Allen et al., 2002b), toward the east (Bjarnason and Schmeling, 2009) or west (Foulger et al., 2003; Li and Detrick, 2003, 2006) of the hotspot. The maximum thickness of the crust is 40 km (Darbyshire et al., 1998; Li and Detrick, 2006), with an average value of 29 km (Allen et al., 2002b). Though many investigations have been conducted on the Icelandic crust structure, including the body wave and surface wave methods (e.g., Allen et al., 2002b; Li and Detrick, 2006), the sensitivity of the low-velocity zone (LVZ) and vertical resolution have some difficulties to be achieved together. Consequently, the average models imaged by different techniques are still pretty vague about the crustal LVZ that has been reported in some regional areas of Iceland (e.g., Darbyshire et al., 2000a; Du et al., 2002; Bjarnason and Schmeling, 2009). Thus, there is still necessitated high-resolution observation of the comprehensive features of the Icelandic crust.
In contrast to traditional seismic methods, ambient noise tomography conquers the defects in the non-homogeneous distribution of seismic events, significantly improving the spatial resolution of seismic images with numerous ray paths. After pioneering works for theoretical foundations (e.g., Aki, 1957; Weaver and Lobkis, 2001; Campillo and Paul, 2003), some specific applications to image velocity structures (e.g., Shapiro and Campillo, 2004; Shapiro et al., 2005; Yang and Ritzwoller, 2008) have greatly promoted the development of ambient noise surface wave tomography, in which extracting dispersion curves from ambient noise data is an essential step. In the past decades, various methods have been developed for extracting the fundamental mode (Capon, 1969; Dziewonski et al., 1969; Levshin and Ritzwoller, 2001; Yao et al., 2006; Park et al., 2007; Luo et al., 2008). However, it is a long-held view that higher modes play an important role in enhancing constraints and suppressing the non-uniqueness of inversion (e.g., Xia et al., 1999; Xia et al., 2003; Pan et al., 2019).
In this study, we apply the recently developed frequency-Bessel transform method (F-J method) (Wang et al., 2019; Xi et al., 2021; Zhou and Chen, 2021) to extract the first two modes of dispersion curves from the ambient noise data of Iceland. We invert the multimodal dispersion curves to obtain a high-resolution average S-wave velocity (
2 Methods
2.1 The F-J method
Wang et al. (2019) developed the F-J method to extract multimodal dispersion curves from ambient noise cross-correlation functions (NCFs). The method was successfully applied to establish the
Wang et al. (2019) defined the F-J spectrum
where
2.2 Inversion
It has been reported that
We adopt the inversion algorithm proposed by Pan et al. (2019) to invert the
where
The reference model (Supplementary Figure S1) is derived from the average model of Li and Detrick (2006) and the crustal model of Allen et al. (2002b). Due to the decreasing resolution of surface waves with increasing depth, at a depth of 70 km, the thickness of the elemental layer gradually increases from 2 km to adapt to the resolution decrease of deeper penetrating waves. To obtain a robust global optimal solution, 80 dissimilar initial models, randomly selected from a given variation range (
where
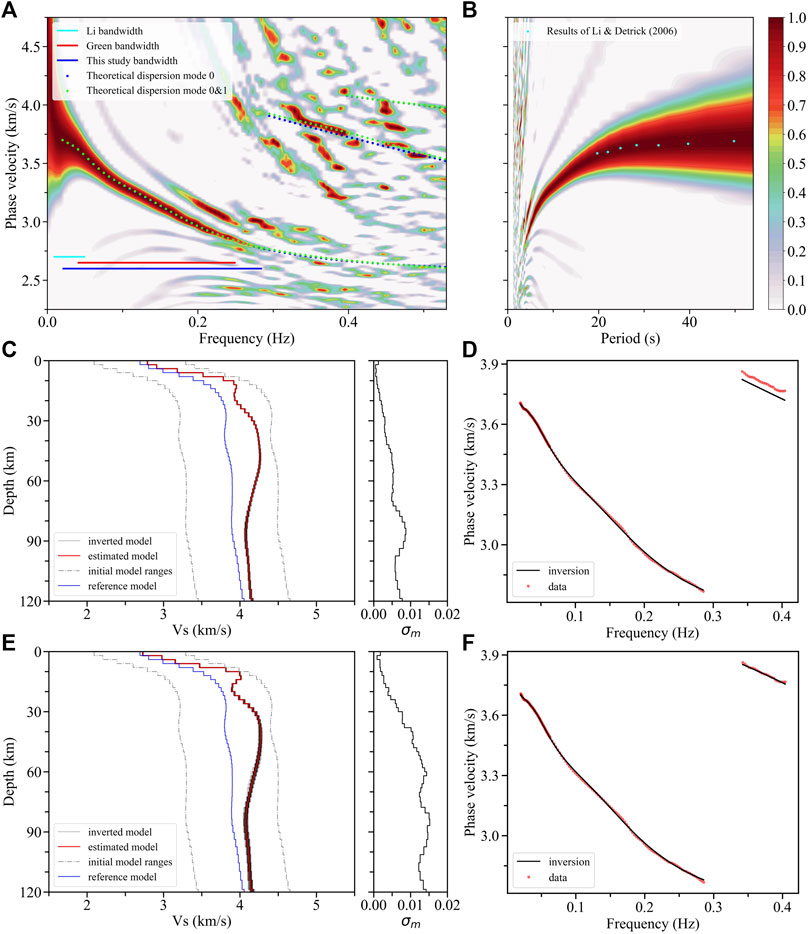
FIGURE 2. F-J spectra and inversion results. (A) Icelandic average F-J spectrum obtained by the F-J method in the frequency domain. The cyan solid line denotes the phase velocity bandwidth (0.008–0.050 Hz) obtained by Li and Detrick (2006), the red solid line (0.040–0.250 Hz) is the group velocity bandwidth (Green et al., 2017), and the blue solid line (0.020–0.285 Hz) is this study’s result. The blue and green dots denote the theoretical dispersion curves computed from the inverted models. (B) Cyan dots extracted from Li and Detrick (2006) are projected to the F-J spectrum in the periodic domain. (C,E) The final models (red line) are weighted average from the best-fitting 40 inverted models (gray solid lines with the darker, the greater the weight) using the fundamental mode and first two mode dispersion curves, respectively. The dotted gray lines are the ranges of initial models, while the blue solid line is the reference model, and the black solid line on the right slide represents the standard deviation (
3 Data processing and results
3.1 Data and the F-J spectra
We apply the vertical component of continuous seismic data recorded by 44 broadband stations across Iceland to analyze the average structure of Iceland. Thirty stations of the XD array (HOTSPOT experiment, red triangles in Figure 1) were operated from July 1996 to July 1998 (e.g., Allen et al., 2002b), along with the global seismic network (GSN) station BORG (blue triangle in Figure 1). Additionally, all data are supplemented by eight stations of the Z7 array (Northern volcanic zone, purple triangles in Figure 1) and five stations of the YA array (Torfajökull 2005, green triangles in Figure 1). To avoid excessive local weights in the average result from two regional NCFs, we select stations from Z7 and YA arrays, mainly concentrated from September 2011 to July 2012 and June to October 2005, respectively. To protect the diffusion hypothesis, we ignore records on days with earthquakes with magnitudes of over M4 in Iceland and offshore.
Cross-correlation processing steps similar to those proposed by Bensen et al. (2007) are applied to seismic noise data. We apply CC-FJpy (Li et al., 2021) to compute NCFs of three different time periods in the frequency domain and obtain symmetrical NCFs in the time domain by inverse Fourier transformation, and the signal-to-noise ratio (SNR) of the latter is also used to conduct quality control (Supplementary Figure S2). The signal window (red lines in Supplementary Figure S2) is built by locating the Rayleigh wave group velocity at 1.7–3.5 km/s, which is translated 45 s outward to obtain the noise window (blue lines in Supplementary Figure S2). The SNR for each NCF is determined using the ratio of the root mean square of the amplitude values in its signal and noise windows, and the SNR is assigned as 4 in this study after a series of tests to both save enough useful information and obtain a clear F-J spectrum. Furthermore, some stations (black circles in Figure 1) that make the average F-J spectrum worse are removed (see Supplementary Material S1).
We apply CC-FJpy (Li et al., 2021) to acquire the F-J spectra (Figures 2A,B) from NCFs, and the fundamental mode dispersion curve could then be extracted from the peak values of the spectra. Figure 2A shows comparisons of the frequency bandwidth of dispersion curve with those of previous studies in this area. Our dispersion range, represented by the blue solid line (0.020–0.285 Hz), has a good balance between high and low frequency ranges. We also extract the dispersion curve of the first higher-mode ranges from 0.343 to 0.403 Hz. Some dispersion points with a period of 20–50 s obtained by Li and Detrick (2006) are projected onto the periodic domain F-J spectrum (Figure 2B), which shows some consistency in the dispersion information obtained from both studies.
3.2 The average S-wave structure
The fundamental dispersion curve is used to invert the average S-wave structure of Iceland (Figures 2C,D), and points with frequencies lower than 0.06 Hz are reserved more densely to provide deeper constraints. We calculate the theoretical dispersion curves of multimodes (blue dots in Figure 2A) of the final model in Figure 2C based on the theory of generalized reflection and transmission coefficients (Chen, 1993), which suggests a good agreement between the fundamental mode dispersion curve and the F-J spectrum energy peak. Since the dispersion curve of the first higher-mode comes close to a portion of the energy peak (Figures 2A,D), we extract the dispersion curve of the first higher-mode and combine it with the fundamental mode dispersion curve to improve the S-wave structure (Figures 2E,F).
To analyze the sensitivity of
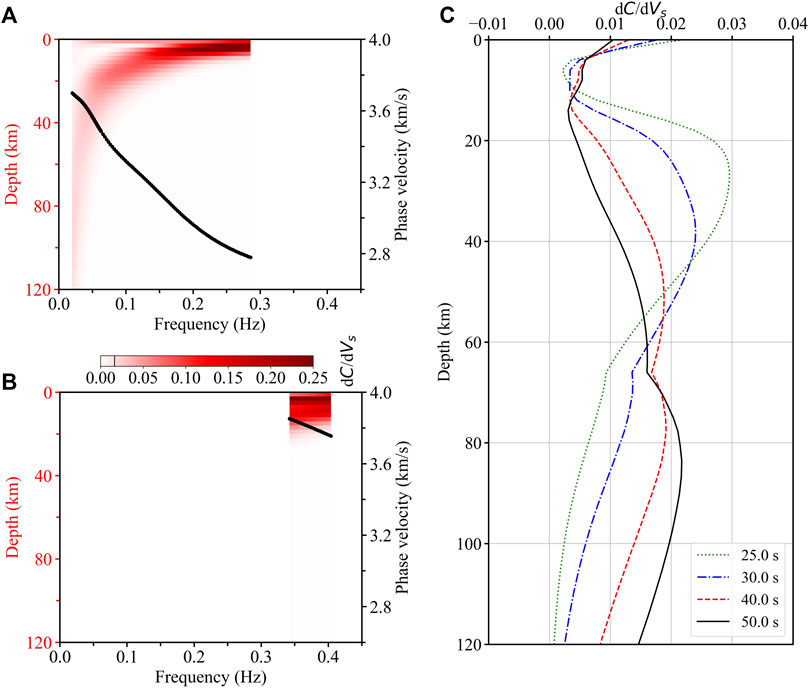
FIGURE 3. Sensitivity analysis: the variations of the partial derivatives of Rayleigh wave first two mode phase velocity relative to Vs with depths and frequencies. The sensitivity of the fundamental mode at the point of 0.02 Hz and 120 km, ∼0.015, is identified by a black line in the color bar. Here, C is the phase velocity. (A) Sensitivity for the fundamental mode dispersion curve (black line). (B) Sensitivity for the first higher-mode dispersion curve (black line). (C) Sensitivity curves for the fundamental mode dispersion curve at 25, 30, 40, and 50 s.
There are some corrections both on the amplitude of the crustal LVZ and the velocity structure above ∼20 km from the constrained model without the first higher-mode (green line in Figure 4A) to the model with the first higher-mode constraint (red line in Figure 4A), which coincide with the sensitivity distribution (Figure 3B). The theoretical dispersion curves computed from the estimated model in Figure 2C correlate well with the fundamental mode energy peak of the F-J spectrum, while there are some differences between the theoretical and observed results for the first higher-mode (blue dots in Figure 2A). This inconsistency may be due to insufficient fundamental mode constraints. Theoretical dispersion curves computed from the estimated model in Figure 2E show a good agreement with the first two modes’ energy peaks of the F-J spectrum (green dots in Figure 2A).
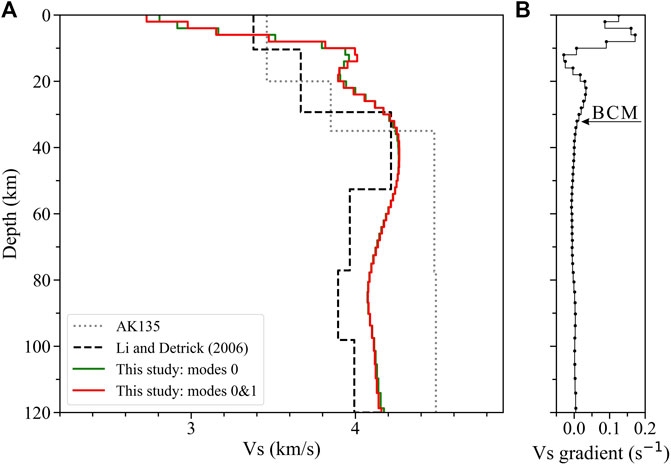
FIGURE 4. (A) Comparisons among average structures constrained by the fundamental mode (green line), first two modes (red line), Icelandic average model (black dashed line) from Li and Detrick (2006), and ak135 model (gray dotted line, Kennett et al., 1995). (B) Velocity gradient of each layer in the average model (red line in Figure 4A) is identified by the dotted solid line, where the boundary between the crust and the mantle (BCM) is marked with an arrow.
Our model has good agreement with the result of Li and Detrick (2006) on the LVZ below ∼55 km (Figure 4A), and this LVZ may suggest partial melt in the Icelandic plume head (Allen et al., 2002a) relatively concentrated in this depth range. Additionally, the structure below the crust is significantly lower than that of the ak135 model (Figure 4A) (Kennett et al., 1995), which may result from the existence of a mantle plume beneath Iceland.
3.3 The S-wave structures of two subregions
To provide more evidence on the distribution and origins of the crustal LVZ found in our average model, we capture the velocity structures of two subregions. One located outside the volcanic zone is covered by eight stations from the XD array and the station BORG (Figure 5A), while another one located in the volcanic zone has nine stations from the XD array and 13 stations from the Z7 array (Figure 5B). Similar to the analysis of the average structure, we use the F-J method to obtain the dispersion spectra from the ambient noise data here. Multimodal dispersion curves are obtained to invert the structures of subregions, and the theoretical dispersion curves of final models are also projected into the spectra.
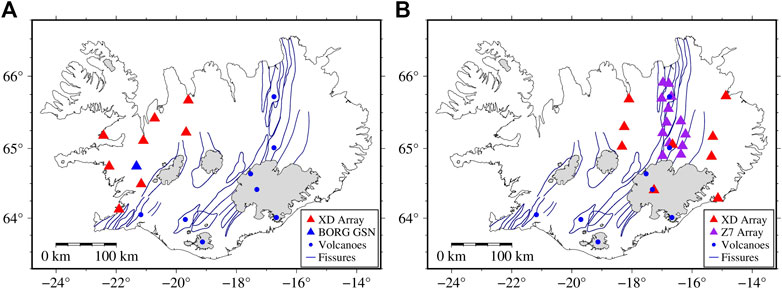
FIGURE 5. Stations coverage of subregions. (A) Subregion outside the volcanic zone is covered by the XD array (red angles) and station BORG (blue angle). (B) Subregion in the volcanic zone is covered by the XD array (red angles) and Z7 array (purple angles).
We have extracted the fundamental mode dispersion curves both from the F-J spectrum outside the volcanic zone (0.045–0.339 Hz, Figure 6A) and in the volcanic zone (0.041–0.255 Hz, Figure 7A), and the first higher-mode dispersion curve (0.372–0.434 Hz, Figure 7A) from the latter. It should be noted that the suddenly decreased phase velocity of the fundamental mode dispersion peak energy above ∼0.27 Hz in the volcanic zone (Figure 7A) may be caused by severe variations in the shallow structure, which cannot be represented by a 1-D model integrating with the deep structure. Taking into account that the sudden change part only occupies a small portion of the total dispersion energy, we eliminate it and integrate the shallow and the deep structures with a 1-D model. The inversion results show that there are crustal LVZs in both subregions. The amplitude of the LVZ with ∼4.6% in the volcanic zone (Figure 7B) is greater than that with ∼1.5% outside the volcanic zones (Figure 6B) (e.g., Bjarnason and Schmeling, 2009). Therefore, these low-velocity anomalies located in different regions may jointly contribute to the crustal LVZ in the average structure, while the volcanic zones are likely to play more important roles.
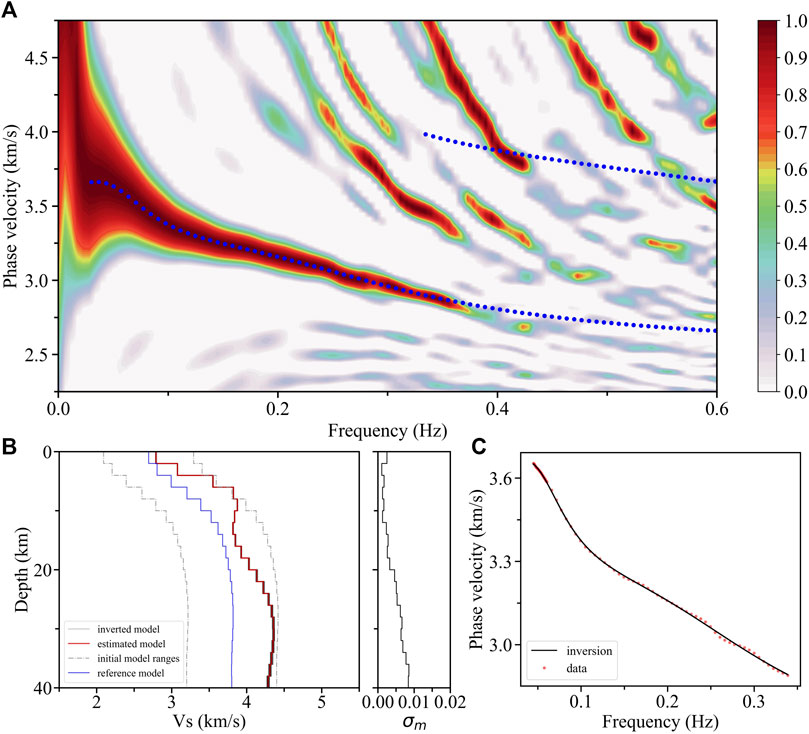
FIGURE 6. F-J spectrum and inversion results from the subregion outside the volcanic zone. (A) F-J spectrum and theoretical dispersion curves (blue dotted lines) calculated from the fundamental mode constraint. (B) Inversion results and standard deviation (
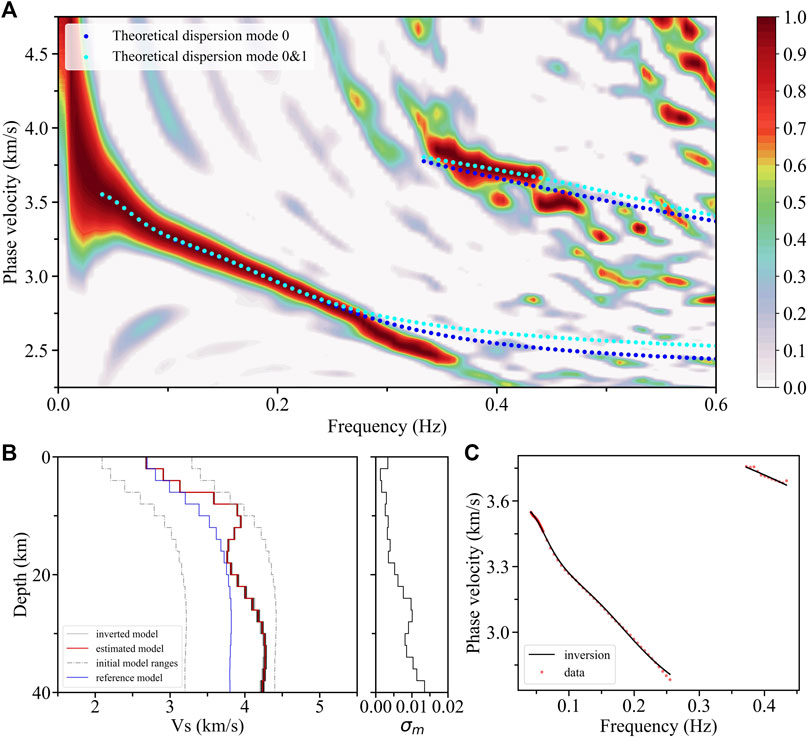
FIGURE 7. F-J spectrum and inversion results from the subregion of the volcanic zone. (A) F-J spectrum and theoretical dispersion curves, including the blue and cyan dotted lines calculated from the fundamental and the first two mode constraints, respectively. (B) Inversion results and standard deviation (
3.4 Travel time comparison
To test the rationality of the Icelandic average model, we select four earthquakes on or offshore Iceland in 1997 (yellow stars in Figure 8A, event parameters are shown in Table 1). Primary waves of these four earthquakes have high SNRs, which ensure the determination of primary wave real onset is reliable. Meanwhile, twenty ray paths of primary waves recorded by selected stations of the XD array show a good coverage for the whole of Iceland (Figure 8A).
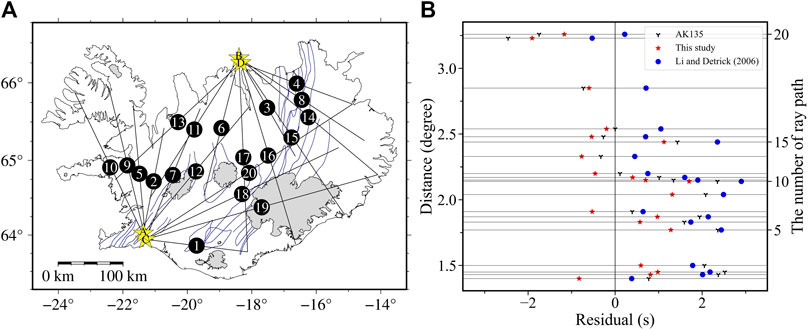
FIGURE 8. Comparison of various travel time calculated from different models and ray paths. (A) Distribution of different ray paths and natural earthquakes in Iceland are indicated as black solid lines and yellow stars, respectively. The increasing number represents the gradual increase of path distances, and the letters marked on the stars are event codes. The path combinations of earthquakes and stations can be seen in the Supplementary Table S1. (B) Travel time residuals compared to the observed primary wave travel time are calculated from the ak135 model (Kennett et al., 1995), the Icelandic average model (Li and Detrick, 2006) and our average model by the TauP tool (Crotwell et al., 1999), which are marked by different symbols and colors explained as the legend. These paths are sorted by ray distances, and the right vertical axis represents the sorted numbers corresponding to the sequence numbers in Figure 8A.

TABLE 1. Event parameters for the four local earthquakes used in this study.
We use the TauP tool (Crotwell et al., 1999) to calculate the primary wave travel time of all event-station pairs based on the ak135 model (Kennett et al., 1995), the previous Icelandic average model (Li and Detrick, 2006), and the average model in this study, which is compared to the observed actual travel time (see Supplementary Table S1 for detailed time data and the combinations of earthquakes and stations). The statistical results of the residuals between the travel time calculated from different models and the observed data are shown in Figure 8B. From a single result such as paths 19 or 20, the travel time residual of Li and Detrick (2006) is smaller than those of the other two models in rift zones, where the crustal velocity is significantly lower than that in other parts of Iceland (e.g., Green et al., 2017). However, in the whole statistics, there are more large positive residuals corresponding to the models from Li and Detrick (2006) and the ak135 model (Kennett et al., 1995) than that of this study, which may indicate that the velocities of these two models are lesser than those of the real structure beneath these paths. The refraction traces of these ray paths calculated by the TauP tool (Crotwell et al., 1999) indicate that most of their deepest refraction positions are less than ∼30 km. The comparisons in Figure 4A also reveal the velocities of the two models in the mid-lower crust are lesser than those of our average model at corresponding depths. The positive and negative residuals calculated from our average model are more evenly distributed, and the smaller root mean square value of the residual can be obtained as ∼0.95 than that of the previous model (Li and Detrick, 2006) as ∼2.78 and the ak135 model (Kennett et al., 1995) as ∼2.67. Based on the comprehensive statistical results, the crust model of the average structure obtained in this study has more possibility to better represent the overall velocity characteristics of the Icelandic crust.
4 Discussion
4.1 Tests for the crustal LVZ
The minimal velocity of the crustal LVZ between 12 and 22 km (red line in Figure 4A) is 3.89 km/s, which is approximately 3% lower than the velocity of 4.01 km/s above the LVZ. We also conduct a series of tests to estimate the reliability of the LVZ. For instance, the anomaly is substituted with an incremental structure to create a model (green line in Figure 9A), whose theoretical dispersion curves are shown in Figure 9B (green dots) and deviate from the energy peak at 0.04–0.14 Hz. However, the theoretical dispersion curves of the original model fit well with the energy peak (blue dots in Figure 9B); thus, the existence of the LVZ in this average
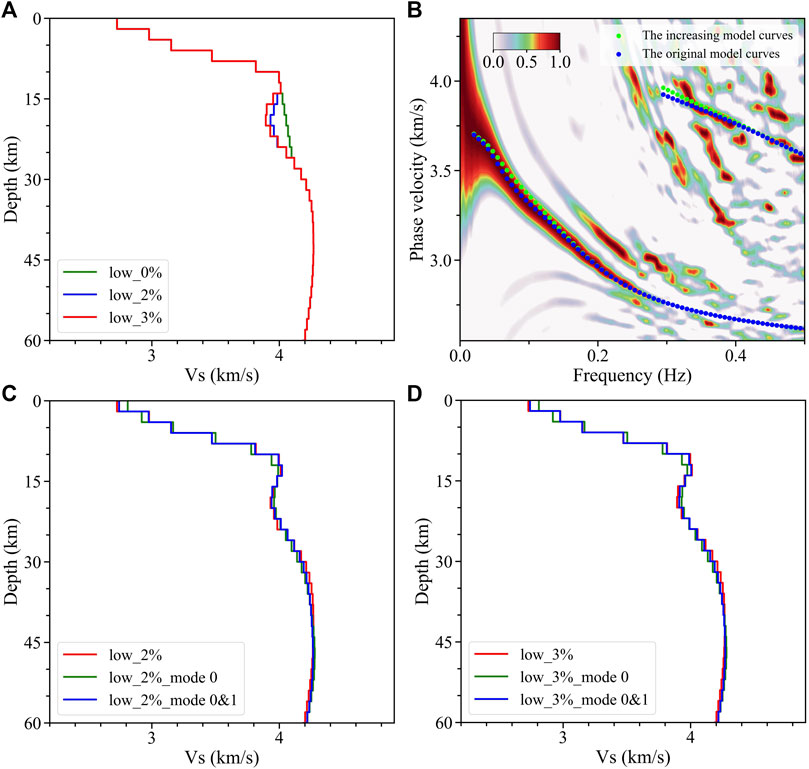
FIGURE 9. Crustal LVZ and model recovery tests of the Icelandic average Vs model. (A) Original model with an LVZ at 3% (red line), a new model with an LVZ at 2% (blue line), and an increasing model (green line). (B) Theoretical dispersion curves computed from the original (blue dots) and increasing models (green dots) are projected on the average F-J spectrum. (C) Comparisons among the new model with an LVZ at 2% (red line) and the models inverted by its theoretical dispersion curves of the fundamental mode (green line) and first two modes (blue line). (D) It is the same as Figure 9C; however, the model has an LVZ at 3%.
4.2 Icelandic average crust and low-velocity anomalies
Foulger et al. (2003) reported that although there are some differences among modern seismic studies of the Icelandic crust, a consensus is that the upper crust of Iceland is characterized by a high-velocity gradient, while the velocity gradient in the lower crust decreases by an order of magnitude. These crustal velocity gradients vary in a wide range, such as the western Iceland with steep velocity gradients of up to ∼0.45
The upper crust exhibits high-velocity gradients of up to ∼0.17
Abundant receiver function works in Iceland (e.g., Darbyshire et al., 2000a; Du et al., 2002) have revealed significant crustal LVZs, whose thickness and amplitudes also exhibit great variations. By extracting surface wave dispersion information from regional earthquakes, Bjarnason and Schmeling (2009) also observed the presence of LVZs in the depth range of 8–18 km in northern Iceland. Although crustal LVZs in some regional areas of Iceland have been found, this important information is still absent in the pre-existing average structure representing the overall characteristics of Iceland (e.g., Li and Detrick, 2006), which may be ameliorated by our work.
Darbyshire et al. (2000a) reported a prominent LVZ at depths of 10–15 km beneath the central volcano Krafla in northwest Iceland, and Du and Foulger (2001) revealed a substantial LVZ beneath the middle volcanic zone in the lower crust and a similar crustal LVZ is also observed beneath the northern volcanic zone (Figure 7B). These crustal LVZs, observed in volcanic active regions, are generally formed due to anomalously high temperatures and the presence of partial melt at corresponding depths. However, the crustal LVZs outside the volcanic zones observed in this work (Figure 6B) and previous studies (e.g., Bjarnason and Schmeling, 2009), as well as the crustal LVZs existing in the average structure, indicate that the origin of the anomalies may not be so simple, i.e., LVZs are less possible to be mainly confined to below central volcanoes. The thick-cold crust model in Iceland suggests that there is less possibility of a large portion of partial melt above Moho (e.g., Menke and Levin, 1994; Menke et al., 1995), while LVZs may also be caused by compositional changes, anisotropy, or fluids in high pore pressure.
Jenkins et al. (2018) reported the crystallization path of both depleted and enriched mantle melts through a petrological model simplifying the magmatic evolution and crustal accretion. The mineralogical, compositional, and thermodynamic properties also change with depth to affect the crystallization path. The earliest crystallization from bimodal mantle melts is olivine, the first phase on the liquidus curve, forming ultrabasic cumulates at the base of the crust. After further cooling, clinopyroxene and plagioclase mix with olivine to crystallize, and after that, gabbro is the main crystallizing solid rock. The ultrabasic cumulates formed by crystallization have similar seismic velocities to mantle rocks whose velocities are higher than that of gabbroic material (e.g., Maclennan et al., 2001). The Icelandic acidic intrusive bodies mapped by Johannesson and Saemundsson (1989) may further contribute to low-velocity anomalies. Darbyshire et al. (2000a) reported the amplitudes of central and northern crustal LVZs, away from central volcanoes, were similar to the seismic velocity difference between acidic rocks and gabbro. In addition, the anomaly of high-velocity layers containing scoriaceous material in the upper crust (Flóvenz and Gunnarsson, 1991) may promote the velocity contrast with the middle crust. Consequently, the crustal LVZ that we observe in the average structure is likely to be the result of the combined effects of partial melt beneath the central volcanoes and the variations in the petrology of the crust.
5 Conclusion
Based on ambient noise analysis, we use the F-J method to successfully extract Rayleigh phase velocity dispersion curves of the fundamental mode (0.020–0.285 Hz) and first higher-mode (0.343–0.403 Hz) from the continuous broadband ambient noise data recorded at the XD array and some supplement stations in Iceland. Following this, we obtain the average
Using the changes of the Vs gradient, we also divide the average structure into three parts: upper crust above 10 km depth; middle crust down to 22 km depth, including an LVZ; and the lower crust in the depth range of 22–32 km. The LVZ at 55 km depth below the lithosphere can be regarded as the beginning of the asthenosphere. In addition, we conduct systematic tests to verify the reliability of the crustal LVZ in our average model, which further reveals that the minimum
Data availability statement
Datasets for this research are provided by the Incorporated Research Institutions for Seismology (IRIS) from the XD Array (HOTSPOT experiment) (https://doi.org/10.7914/SN/XD_1996, Nolet, 1996), Z7 Array (Northern Volcanic Zone) (https://doi.org/10.7914/SN/Z7_2010, White, 2010), BORG GSN (https://doi.org/10.7914/SN/II, Scripps Institution of Oceanography, 1986), and YA Array (Torfajökull 2005) (http://www.fdsn.org/networks/detail/YA_2005/, Nordic Volcanological Institute, 2005). The earthquake parameters used in this study are supported by IRIS (http://ds.iris.edu/wilber3/find_event). The packages for the F-J method, inversion, and seismic travel time calculation are available in the following references: Li et al. (2021) (https://doi.org/10.1785/0220210042), Pan et al. (2019) (https://doi.org/10.1093/gji/ggy479), and Crotwell et al. (1999) (https://doi.org/10.1785/gssrl.70.2.154).
Author contributions
The specific contributions of each author can be described as follows. Conceptualization: SZ, GZ, XF, and XC; methodology: ZL, LP, JW, and XC; formal analysis: SZ, GZ, XF, and XC; investigation: SZ, GZ, XF, and XC; resources: XC; data curation: SZ and GZ; writing—original draft preparation: SZ; writing—review and editing: XF, ZL, and XC; visualization: SZ, XF, LP, and JW; supervision: XC; project administration: XC; funding acquisition: XC. All authors read and approved the final manuscript.
Funding
This research was supported by National Natural Science Foundation of China (Grant Nos. 41790465 and 92155307), Key Special Project for Introduced Talents Team of Southern Marine Science and Engineering Guangdong Laboratory (Guangzhou) (GML2019ZD0203), Shenzhen Science and Technology Program (Grant No. KQTD20170810111725321), and Shenzhen Key Laboratory of Deep Offshore Oil and Gas Exploration Technology (Grant No. ZDSYS20190902093007855).
Conflict of interest
The authors declare that the research was conducted in the absence of any commercial or financial relationships that could be construed as a potential conflict of interest.
Publisher’s note
All claims expressed in this article are solely those of the authors and do not necessarily represent those of their affiliated organizations, or those of the publisher, the editors, and the reviewers. Any product that may be evaluated in this article, or claim that may be made by its manufacturer, is not guaranteed or endorsed by the publisher.
Supplementary material
The Supplementary Material for this article can be found online at: https://www.frontiersin.org/articles/10.3389/feart.2022.1008354/full#supplementary-material
References
Aki, K. (1957). Space and time spectra of stationary stochastic waves, with special reference to microtremors. Bull. Earthq. Res. Inst. 35, 415–456.
Aki, K., and Richards, P. G. (2002). “Surface waves in a vertically heterogeneous medium,” in Quantitative seismology. Editor J. Ellis (Mill Valley, California: University Science Books), 249–330.
Allen, R. M., Nolet, G., Morgan, W. J., Vogfjörd, K., Bergsson, B. H., Erlendsson, P., et al. (2002a). Imaging the mantle beneath Iceland using integrated seismological techniques. J. Geophys. Res. Solid Earth 107 (B12), ESE 3-1–ESE 3-16. doi:10.1029/2001JB000595
Allen, R. M., Nolet, G., Morgan, W. J., Vogfjörd, K., Nettles, M., Ekström, G., et al. (2002b). Plume-driven plumbing and crustal formation in Iceland. J. Geophys. Res. Solid Earth 107 (B8), ESE 4-1–ESE 4-19. doi:10.1029/2001JB000584
Beblo, M., and Bjornsson, A. (1980). A model of electrical resistivity beneath NE-Iceland, correlation with temperature. J. Geophys. 47 (1), 184–190.
Bensen, G. D., Ritzwoller, M. H., Barmin, M. P., Levshin, A. L., Lin, F., Moschetti, M. P., et al. (2007). Processing seismic ambient noise data to obtain reliable broad-band surface wave dispersion measurements. Geophys. J. Int. 169 (3), 1239–1260. doi:10.1111/j.1365-246X.2007.03374.x
Bjarnason, I. T., Menke, W., Flóvenz, Ó. G., and Caress, D. (1993). Tomographic image of the mid-Atlantic plate boundary in southwestern Iceland. J. Geophys. Res. Solid Earth 98 (B4), 6607–6622. doi:10.1029/92JB02412
Bjarnason, I. T., and Schmeling, H. (2009). The lithosphere and asthenosphere of the Iceland hotspot from surface waves. Geophys. J. Int. 178 (1), 394–418. doi:10.1111/j.1365-246X.2009.04155.x
Brocher, T. M. (2005). Empirical relations between elastic wavespeeds and density in the Earth's crust. Bull. Seismol. Soc. Am. 95 (6), 2081–2092. doi:10.1785/0120050077
Campillo, M., and Paul, A. (2003). Long-range correlations in the diffuse seismic coda. Science 299 (5606), 547–549. doi:10.1126/science.1078551
Capon, J. (1969). High-resolution frequency-wavenumber spectrum analysis. Proc. IEEE 57 (8), 1408–1418. doi:10.1109/PROC.1969.7278
Chen, X. (1993). A systematic and efficient method of computing normal modes for multilayered half-space. Geophys. J. Int. 115 (2), 391–409. doi:10.1111/j.1365-246X.1993.tb01194.x
Crotwell, H. P., Owens, T. J., and Ritsema, J. (1999). The TauP Toolkit: Flexible seismic travel-time and ray-path utilities. Seismol. Res. Lett. 70, 154–160. doi:10.1785/gssrl.70.2.154
Darbyshire, F. A., Bjarnason, I. T., White, R. S., and Flóvenz, Ó. G. (1998). Crustal structure above the Iceland mantle plume imaged by the ICEMELT refraction profile. Geophys. J. Int. 135 (3), 1131–1149. doi:10.1046/j.1365-246X.1998.00701.x
Darbyshire, F. A., Priestley, K. F., White, R. S., Stefánsson, R., Gudmundsson, G. B., and Jakobsdóttir, S. S. (2000a). Crustal structure of central and northern Iceland from analysis of teleseismic receiver functions. Geophys. J. Int. 143 (1), 163–184. doi:10.1046/j.1365-246x.2000.00224.x
Darbyshire, F. A., White, R. S., and Priestley, K. F. (2000b). Structure of the crust and uppermost mantle of Iceland from a combined seismic and gravity study. Earth Planet. Sci. Lett. 181 (3), 409–428. doi:10.1016/S0012-821X(00)00206-5
Du, Z., Foulger, G. R., Julian, B. R., Allen, R. M., Nolet, G., Morgan, W. J., et al. (2002). Crustal structure beneath western and eastern Iceland from surface waves and receiver functions. Geophys. J. Int. 149 (2), 349–363. doi:10.1046/j.1365-246X.2002.01642.x
Du, Z., and Foulger, G. R. (2001). Variation in the crustal structure across central Iceland. Geophys. J. Int. 145 (1), 246–264. doi:10.1111/j.1365-246X.2001.00377.x
Dziewonski, A., Bloch, S., and Landisman, M. (1969). A technique for the analysis of transient seismic signals. Bull. Seismol. Soc. Am. 59 (1), 427–444. doi:10.1785/bssa0590010427
Flóvenz, Ó. G., and Gunnarsson, K. (1991). Seismic crustal structure in Iceland and surrounding area. Tectonophysics 189 (1), 1–17. doi:10.1016/0040-1951(91)90483-9
Flóvenz, Ó. G., and Saemundsson, K. (1993). Heat flow and geothermal processes in Iceland. Tectonophysics 225 (1), 123–138. doi:10.1016/0040-1951(93)90253-G
Foulger, G. R., Du, Z., and Julian, B. R. (2003). Icelandic-type crust. Geophys. J. Int. 155 (2), 567–590. doi:10.1046/j.1365-246X.2003.02056.x
Foulger, G. R., Pritchard, M. J., Julian, B. R., Evans, J. R., Allen, R. M., Nolet, G., et al. (2001). Seismic tomography shows that upwelling beneath Iceland is confined to the upper mantle. Geophys. J. Int. 146 (2), 504–530. doi:10.1046/j.0956-540x.2001.01470.x
Green, R. G., Priestley, K. F., and White, R. S. (2017). Ambient noise tomography reveals upper crustal structure of Icelandic rifts. Earth Planet. Sci. Lett. 466, 20–31. doi:10.1016/j.epsl.2017.02.039
Hansen, P. C. (2001). “The L-curve and its use in the numerical treatment of inverse problems,” in Computational inverse problems in electrocardiology. Editor P. Johnston (Southampton: WIT Press), 119–142.
Jenkins, J., Maclennan, J., Green, R. G., Cottaar, S., Deuss, A. F., and White, R. S. (2018). Crustal formation on a spreading ridge above a mantle plume: Receiver function imaging of the Icelandic crust. J. Geophys. Res. Solid Earth 123 (6), 5190–5208. doi:10.1029/2017JB015121
Johannesson, H., and Saemundsson, K. (1989). Geological map of Iceland, 1:500,000, Bedrock geology. Reykjavik: Icelandic Museum of Natural History and Iceland Geodetic Survey.
Johannesson, H., and Saemundsson, K. (1998). Geological map of Iceland, 1:500,000, Tectonics. Reykjavik: Icelandic Institute of Natural History.
Kennett, B. L. N., Engdahl, E. R., and Buland, R. (1995). Constraints on seismic velocities in the Earth from traveltimes. Geophys. J. Int. 122 (1), 108–124. doi:10.1111/j.1365-246X.1995.tb03540.x
Levshin, A. L., and Ritzwoller, M. H. (2001). Automated detection, extraction, and measurement of regional surface waves. Pure Appl. Geophys. 158 (8), 1531–1545. doi:10.1007/PL00001233
Li, A., and Detrick, R. S. (2003). Azimuthal anisotropy and phase velocity beneath Iceland: Implication for plume–ridge interaction. Earth Planet. Sci. Lett. 214 (1), 153–165. doi:10.1016/S0012-821X(03)00382-0
Li, A., and Detrick, R. S. (2006). Seismic structure of Iceland from Rayleigh wave inversions and geodynamic implications. Earth Planet. Sci. Lett. 241 (3), 901–912. doi:10.1016/j.epsl.2005.10.031
Li, Z., Shi, C., Ren, H., and Chen, X. (2022). Multiple leaking mode dispersion observations and applications from ambient noise cross-correlation in Oklahoma. Geophys. Res. Lett. 49 (1), e2021GL096032. doi:10.1029/2021GL096032
Li, Z., Zhou, J., Wu, G., Wang, J., Zhang, G., Dong, S., et al. (2021). CC-FJpy: A python package for extracting overtone surface-wave dispersion from seismic ambient-noise cross correlation. Seismol. Res. Lett. 92 (5), 3179–3186. doi:10.1785/0220210042
Luo, Y., Xia, J., Miller, R. D., Xu, Y., Liu, J., and Liu, Q. (2008). Rayleigh-wave dispersive energy imaging using a high-resolution linear Radon transform. Pure Appl. Geophys. 165 (5), 903–922. doi:10.1007/s00024-008-0338-4
Ma, Q., Pan, L., Wang, J., Yang, Z., and Chen, X. (2022). Crustal S-wave velocity structure beneath the northwestern Bohemian Massif, central Europe, revealed by the inversion of multimodal ambient noise dispersion curves. Front. Earth Sci. 10. doi:10.3389/feart.2022.838751
Maclennan, J., Mkenzie, D., Gronvöld, K., and Slater, L. (2001). Crustal accretion under northern Iceland. Earth Planet. Sci. Lett. 191 (3), 295–310. doi:10.1016/S0012-821X(01)00420-4
Menke, W., and Levin, V. (1994). Cold crust in a hot spot. Geophys. Res. Lett. 21 (18), 1967–1970. doi:10.1029/94GL01896
Menke, W., Levin, V., and Sethi, R. (1995). Seismic attenuation in the crust at the mid-Atlantic plate boundary in south-west Iceland. Geophys. J. Int. 122 (1), 175–182. doi:10.1111/j.1365-246X.1995.tb03545.x
Nolet, G. (1996). Data from: Seismic study of the Iceland hotspot. International Federation of Digital Seismograph Networks. doi:10.7914/SN/XD_1996
Nordic Volcanological Institute (2005). Data from: Torfajokull 2005. International Federation of Digital Seismograph Networks. http://www.fdsn.org/networks/detail/YA_2005/.
Pálmason, G. (1971). Crustal structure of Iceland from explosion seismology. Reykjavik: Prentsmiðjan Leiftur.
Pan, L., Chen, X., Wang, J., Yang, Z., and Zhang, D. (2019). Sensitivity analysis of dispersion curves of Rayleigh waves with fundamental and higher modes. Geophys. J. Int. 216 (2), 1276–1303. doi:10.1093/gji/ggy479
Park, C. B., Miller, R. D., Xia, J., and Ivanov, J. (2007). Multichannel analysis of surface waves (MASW)—Active and passive methods. Lead. Edge 26 (1), 60–64. doi:10.1190/1.2431832
Rickers, F., Fichtner, A., and Trampert, J. (2013). The Iceland–Jan Mayen plume system and its impact on mantle dynamics in the north Atlantic region: Evidence from full-waveform inversion. Earth Planet. Sci. Lett. 367, 39–51. doi:10.1016/j.epsl.2013.02.022
Schilling, J. G. (1973). Iceland mantle plume: Geochemical study of Reykjanes ridge. Nature 242 (5400), 565–571. doi:10.1038/242565a0
Scripps Institution of Oceanography (1986). Data from: Global seismograph network - IRIS/IDA. International Federation of Digital Seismograph Networks. doi:10.7914/SN/II
Shapiro, N. M., and Campillo, M. (2004). Emergence of broadband Rayleigh waves from correlations of the ambient seismic noise. Geophys. Res. Lett. 31 (7). doi:10.1029/2004GL019491
Shapiro, N. M., Campillo, M., Stehly, L., and Ritzwoller, M. H. (2005). High-resolution surface-wave tomography from ambient seismic noise. Science 307 (5715), 1615–1618. doi:10.1126/science.1108339
Shorttle, O., and Maclennan, J. (2011). Compositional trends of Icelandic basalts: Implications for short–length scale lithological heterogeneity in mantle plumes. Geochem. Geophys. Geosyst. 12 (11). doi:10.1029/2011GC003748
Staples, R. K., White, R. S., Brandsdottir, B., Menke, W., Maguire, P. K. H., and McBride, J. H. (1997). Färoe-Iceland ridge experiment: 1. Crustal structure of northeastern Iceland. J. Geophys. Res. Solid Earth 102 (B4), 7849–7866. doi:10.1029/96JB03911
Tryggvason, E. (1962). Crustal structure of the Iceland region from dispersion of surface waves. Bull. Seismol. Soc. Am. 52 (2), 359–388. doi:10.1785/bssa0520020359
Wang, J., Wu, G., and Chen, X. (2019). Frequency-Bessel transform method for effective imaging of higher-mode Rayleigh dispersion curves from ambient seismic noise data. J. Geophys. Res. Solid Earth 124 (4), 3708–3723. doi:10.1029/2018JB016595
Weaver, R. L., and Lobkis, O. I. (2001). Ultrasonics without a source: Thermal fluctuation correlations at MHz frequencies. Phys. Rev. Lett. 87 (13), 134301. doi:10.1103/PhysRevLett.87.134301
White, R. (2010). Data from: Northern volcanic zone. International Federation of Digital Seismograph Networks. doi:10.7914/SN/Z7_2010
White, R. S., McKenzie, D., and O'Nions, R. K. (1992). Oceanic crustal thickness from seismic measurements and rare Earth element inversions. J. Geophys. Res. Solid Earth 97 (B13), 19683–19715. doi:10.1029/92JB01749
Wolfe, C. J., Bjarnason, I. T., VanDecar, J. C., and Solomon, S. C. (1997). Seismic structure of the Iceland mantle plume. Nature 385, 245–247. doi:10.1038/385245a0
Wu, G., Pan, L., Wang, J., and Chen, X. (2020). Shear velocity inversion using multimodal dispersion curves from ambient seismic noise data of USArray transportable array. J. Geophys. Res. Solid Earth 125 (1), e2019JB018213. doi:10.1029/2019JB018213
Xi, C., Xia, J., Mi, B., Dai, T., Liu, Y., and Ning, L. (2021). Modified frequency–Bessel transform method for dispersion imaging of Rayleigh waves from ambient seismic noise. Geophys. J. Int. 225 (2), 1271–1280. doi:10.1093/gji/ggab008
Xia, J., Miller, R. D., and Park, C. B. (1999). Estimation of near-surface shear-wave velocity by inversion of Rayleigh waves. Geophysics 64 (3), 691–700. doi:10.1190/1.1444578
Xia, J., Miller, R. D., Park, C. B., and Tian, G. (2003). Inversion of high frequency surface waves with fundamental and higher modes. J. Appl. Geophy. 52 (1), 45–57. doi:10.1016/S0926-9851(02)00239-2
Yang, Y., and Ritzwoller, M. H. (2008). Characteristics of ambient seismic noise as a source for surface wave tomography. Geochem. Geophys. Geosyst. 9 (2). doi:10.1029/2007GC001814
Yao, H., van Der Hilst, R. D., and de Hoop, M. V. (2006). Surface-wave array tomography in SE tibet from ambient seismic noise and two-station analysis — I. Phase velocity maps. Geophys. J. Int. 166 (2), 732–744. doi:10.1111/j.1365-246X.2006.03028.x
Zhan, W., Pan, L., and Chen, X. (2020). A widespread mid-crustal low-velocity layer beneath northeast China revealed by the multimodal inversion of Rayleigh waves from ambient seismic noise. J. Asian Earth Sci. 196, 104372. doi:10.1016/j.jseaes.2020.104372
Keywords: Iceland, crust, S-wave low-velocity zone, ambient noise tomography, frequency-Bessel transform method
Citation: Zhang S, Zhang G, Feng X, Li Z, Pan L, Wang J and Chen X (2022) A crustal LVZ in Iceland revealed by ambient noise multimodal surface wave tomography. Front. Earth Sci. 10:1008354. doi: 10.3389/feart.2022.1008354
Received: 31 July 2022; Accepted: 16 August 2022;
Published: 28 September 2022.
Edited by:
Weijia Sun, Institute of Geology and Geophysics (CAS), ChinaReviewed by:
Xiaoming Xu, China Earthquake Administration, ChinaShaolin Liu, Ministry of Emergency Management, China
Copyright © 2022 Zhang, Zhang, Feng, Li, Pan, Wang and Chen. This is an open-access article distributed under the terms of the Creative Commons Attribution License (CC BY). The use, distribution or reproduction in other forums is permitted, provided the original author(s) and the copyright owner(s) are credited and that the original publication in this journal is cited, in accordance with accepted academic practice. No use, distribution or reproduction is permitted which does not comply with these terms.
*Correspondence: Xiaofei Chen, Y2hlbnhmQHN1c3RlY2guZWR1LmNu