 Xiaoqiang Yang
 Shuang Wu1
- 1School of Earth Sciences and Engineering/Guangdong Provincial Key Laboratory of Geodynamics and Geohazards/Southern Marine Science and Engineering Guangdong Laboratory (Zhuhai), Sun Yat-Sen University, Zhuhai, China
- 2Key Laboratory of Oil and Gas Resources, CAS Institute of Geology and Geophysics, Chinese Academy of Sciences, Beijing, China
Climate change and human activity can both exert a role in the river discharge and sediment load in river deltas when the sea level remains relatively stable. The Pearl River Delta constitutes the metropolitan region of the Guangdong–Hong Kong–Macau Greater Bay Area, and its evolution in the past and future impacts the sustainable development of this region. In this manuscript, a core situated in the northern South China Sea, adjacent to Qiao Island of Zhuhai city in the Pearl River Delta, was selected to investigate the hydrodynamic variation influenced by tropical processes and the sediment flux imposed by human activities. Using paleosecular variations (PSVs) in geomagnetic field correlations constrained by seven radiocarbon ages, an ∼2.5 kyr chronology was provided for core sediments ∼2.8 m in length. The magnetic fabric results suggest that deposition was influenced by the two types of hydrodynamic-weak energy modulated by El Niño–Southern Oscillation (ENSO) activity and higher energy regulated by high-frequency tropical storms. The cyclic variations in the degree of anisotropy of magnetic susceptibility (P) indicate two periodic changes at approximately 300 and 100 years, which were forced by ENSO activity, while the ratio of lineation with foliation (q value) implies a higher energy flow period of 1.3–1.9 kyr, arising from strong tropical storms. Moreover, the high saturation remanence (SIRM) introduces more sediment flux, which is impacted by growing human activity during the period of 1.0–1.6 kyr.
Introduction
River deltas occupy the most economically dynamic land area in the world and contain more than 322 million people (Macklin and Lewin, 2015). The formation and evolution of deltas have been dominantly controlled by natural processes, such as climate change, sea-level fluctuations and tectonic activities, on a geological time scale (Goodbred and Kuehl, 2000; Zong et al., 2009). However, the terrigenous debris flux accompanied by river discharge may exert a crucial impact on the morphology of the delta when the sea level and tectonic activity remain relatively stable (McManus, 2002). The enhanced river flow is linked to the patterns and processes of sediment erosion and accumulation that modulate delta progradation and distributary channel extension laterally (Shaw et al., 2016). Sediment retention, which is influenced by natural processes or human activities, may cause delta degradation, while marine processes intensify in the context of global warming (Wu et al., 2016; Hoitink et al., 2017; Ranasinghe et al., 2019; Xie et al., 2022). Especially in the Anthropocene, the double impacts of human activity and climate change on river discharge and sediment inputs are responsible for the rapid transition of the delta shape (Hassan, 1997; Macklin & Lewin, 2015; Hoitink et al., 2017; Liu et al., 2019; Zhou et al., 2019). Enhanced weathering processes, intensified precipitation and developing agricultural industrialization can cause delta progradation and channel migration, while the embankment of channels and the construction of dams may result in delta retrogradation (Hassan, 1977; Macklin and Lewin, 2015; Nian et al., 2022).
The Pearl River Delta, a metropolitan region of the Guangdong-Hong Kong-Macau Greater Bay Area, is one of the most densely urbanized regions in the world, with a population of more than 67 million (Yang et al., 2019). Heavy rainfall arising from tropical storms and ENSO activity enhances river discharge and causes a large amount of sediments to enter the lower reaches of the delta region (Liu et al., 2017; Deng et al., 2018; Chen et al., 2020; Yan et al., 2022). In contrast, urbanization prevents the production of terrigenous debris and channel reformation (Zhou et al., 2019; He et al., 2022). This delta is a typical zone in which to research the evolution of river discharge and sediment input under the interaction of natural processes and human activity. In this manuscript, we select a sediment core to investigate the hydrodynamic variability and terrigenous flux since approximately 2.5 kyr BP, which would be beneficial for understanding the morphological evolution of the delta during the period of strong human activity. Radiocarbon dating and paleomagnetic secular variations are employed to determine the sediment chronology, and the anisotropy of magnetic susceptibility and the fraction of fine sand are used to analyze the hydrodynamic conditions. The saturation remanence (SIRM) and high coercivity remanence (HIRM) are employed as proxies for terrigenous debris inputs.
Geographical context and methods
The Pearl River Delta covers a region of ∼5.5 *104 km2, which is formed by three major rivers (West River, North River and East River) flowing into the northern South China Sea (Figure 1). Lingdingyang is one of the largest estuary bays that formed after the deglaciation period (Zong et al., 2009). The drainage system of the three rivers extends to the southeastern margin of Tibet across Guangdong, Guangxi and Guizhou Provinces, constituting diverse geomorphic conditions, such as karst landforms, hills, basins in the upper and middle streams and the highly urbanized delta plain downstream (Wei et al., 2020). The area of soil erosion, which provides abundant terrigenous debris for river loading, is approximately 58,900 km2 and remained almost unchanged from 1995 to 2004 (Zhou et al., 2019; Wei et al., 2020). The annual water discharge varied around a mean value of ∼2.8 *1010 m3, while the sediment load exhibited a decreasing trend at a rate of -2.24*104 t/year between 1955 and 2018 (Wei et al., 2020). The average annual precipitation (1954–2018) varied from 1120 to 1981 mm, with a mean value of 1559 mm. ENSO activity and tropical storms exert a crucial impact on the precipitation in this region. Large precipitation variations (>5%) and most of the years with low precipitation are associated with ENSO events (El Niño years) (Wei et al., 2020).
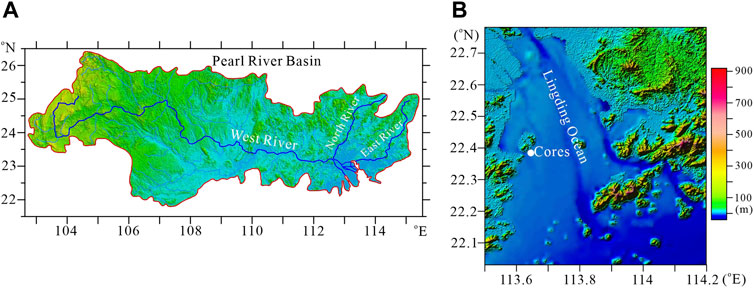
FIGURE 1. The Pearl River drainage basin (redrawn from Wei et al., 2020) (A) and core locations (B).
Two piston cores, ZH06 (2.81 m in length) and ZH05 (1.82 m in length) (22.39°N, 113.64°E), in the Lingdingyang Sea area adjacent to Qiao Island of Zhuhai city were selected in 2008 (Figure 1). The sediments in the two cores were homogenous silt and clay and were gray in color. Two cores were split, and one-half was continuously sampled by pushing ceramic boxes (1*1*1 cm) into the core sections. A total of 278 and 179 samples were collected in cores ZH06 and ZH05, respectively, for paleomagnetic measurements. Moreover, the paired powder samples were selected for grain size analysis. The volume magnetic susceptibility of the sediments from the two cores displays a similar pattern (Supplementary Figure S1), exhibiting the same stratigraphy and consistent deposition processes. Here, the experimental works were mainly focused on the ZH06 core samples.
All box samples were measured for natural remanent magnetization (NRM) and then stepwise demagnetized with a fully automated 2G-Rapid system using peak fields of 0–80 mT (total of 10 steps) after the volume magnetic susceptibility and magnetic fabric (MF) were initially measured using a Bartington MS2 system and an MFK1 Kappabridge, respectively. The parameters of MF, such as the degree of anisotropy susceptibility (p), foliation (F), lineation (L), shape factors (q and T) and imbrication angle (β), were calculated from the statistical methods of Constable & Tauxe (1990) and (Taira, 1989). Anhysteretic remanence (ARM) was then imparted with a 0.05 mT steady field and an 80 mT alternating field, and saturation isothermal remanence (SIRM) was imposed using a DC field of 1 T. IRM-300 mT was then measured, giving a reverse 300 mT field. High coercivity remanence HIRM and S300 ratios were determined by (SIRM-IRM-300)/2 and IRM-300/SIRM, respectively. Both ARM and SIRM were also demagnetized and measured at 20, 40, 60 and 80 mT fields. The magnetic susceptibility variations independent of temperature (κ-T) were measured in argon conditions within a cycle from room temperature to ∼700°C for four freeze-dried powder samples in an MFK1 Kappabridge. The hysteresis properties of the samples were determined using a Princeton Measurements Corporation vibrating sample magnetometer (MicroMag 3900) with a maximum applied field of 1 T. The saturation magnetization (Ms) (at 1.0 T), saturation remanence (Mrs), and coercivity (Bc) were obtained after correcting for the paramagnetic contribution identified from the slope of the high field sections of the curve. Subsequently, the coercivity of the remanence (Bcr) was determined using the demagnetized curve of Mrs. FORC diagram measurements were performed on for four samples following the methods of Harrison and Feinberg (2008). The maximum saturation field was 1.0 T, and the regular grid comprised 150 hysteresis loop curves with a 500 ms averaging time. The FORC data were processed using FORCinel software with a VARIFORC smoothing algorithm (Egli, 2013).
The samples for grain size analysis were pretreated with HCl (10%) hydrogen peroxide (H2O2) (30%) to remove the carbonate and organic matter, and then (NaPO3)6 was added to prohibit the fine particles from aggregating. Experiments were performed with a MasterSizer 2000 laser particle analyzer, achieving a distribution from 0.2 to 1000 μm. These magnetic and grain size experiments were performed at the Institute of Geology and Geophysics, Chinese Academy of Sciences (CAS) and Sun Yat-Sen University, respectively.
Intact shells, conches and terrigenous plant debris were selected for radiocarbon dating. Five samples were prepared into graphite at the Guangzhou Institute of Geochemistry, Chinese Academy of Sciences and then determined at the Key Laboratory of Heavy Ion Physics, Beijing University, and two samples were measured at the Beta Laboratory.
Results
Magnetic mineral assemblage
The hysteresis loops of four representative samples displayed a narrow shape and reached saturation magnetization below a 300 mT field. The coercivity of remanence (Bcr) varied from 20 to 35 mT. The Day-plot projection describes the PSD state of magnetic mineral grains (Dunlop, 2002) (Figure 2). The κ-T profiles have the most magnetic susceptibility loss at approximately 580°C, although a prominent increase at approximately 260°C existed. One sample at a depth of ∼227.9 cm displayed a “waist-shaped” loop with relatively high Bcr (∼118 mT) and Bc (∼32.9 mT) values. The susceptibility of the heating curve showed two stages, rising at temperatures of approximately 320°C and 500°C (Figure 2), which may arise from the contributions of pyrrhotite and pyrite (Yang et al., 2008). The S300 ratio value preserved a relatively stable mean value of approximately 0.93 except in the interval of 2.26–2.38 m (decreased to 0.43). The remanence ratio of ARM and SIRM from 0 to 60 mT with their primary values are generally greater than 0.8 (ARM(0–60)mT/ARM and SIRM(0–60)mT/SIRM), and the SIRM/κ ratio does not show very high values. The magnetic hysteresis data of Mrs/Mr were less than <0.5, and Bcr/Bc exceeded 2, indicating little influence of iron sulfides (Roberts et al., 2011). These results demonstrate that the magnetic minerals of sediments were mainly dominated by soft magnetite, while the contribution of a few iron sulfides to the remanence is minor (Deng et al., 2001; Roberts et al., 2011). The high-coercivity minerals are preserved only in the sediments within 2.26–2.38 m.
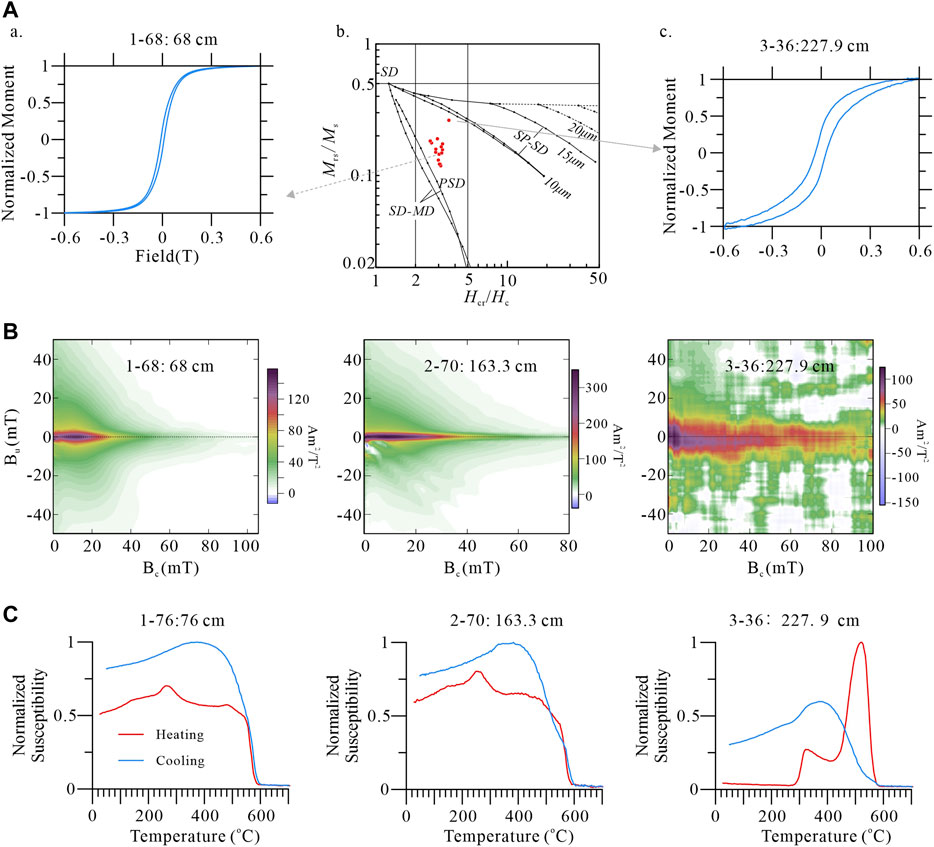
FIGURE 2. Hysteresis loops and Day-plot project following Dunlop (2002) for the representative samples (A); FORC diagram processed using FORCinel software (Egli, 2013) and temperature dependence of magnetic susceptibility variation are displayed in (B) and (C), respectively. In (A), SD = single domain; PSD = pseudosingle domain and MD = multidomain. (C) FORC diagrams of several typical samples.
Generally, the ratios of ARM/SIRM can serve as a proxy of the magnetic grain size variations when the remanence of sediments is mainly dominated by magnetite. To remove the influence of a few iron sulfides on the remanence, we employ the remanence difference ratios in the 0–60 mT demagnetization field (ARM(0–60)mT/SIRM(0–60)mT) to estimate the relative variations in the magnetic grain size. The variations in the volume magnetic susceptibility (κ), SIRM and ARM display a clear two-stage pattern (Figure 3). Below ∼140 cm, low values associated with a weak increasing trend denote low concentrations of magnetic minerals, while high values above 140 cm represent high concentrations. Low and high concentration values are linked to fine and coarse magnetic mineral granularity, respectively (ARM/SIRM). This stage shift should arise from the magnetic mineral inputs while the mineral assemblages are consistent (the relatively stable S300 ratio). The HIRM values also increased following the SIRM and ARM, exhibiting that the high-coercivity components in the sediments, such as hematite (Roberts et al., 2021; Jiang et al., 2022), which formed during pedogenic processes in the catchment areas, were transported to the Pearl River Delta region.
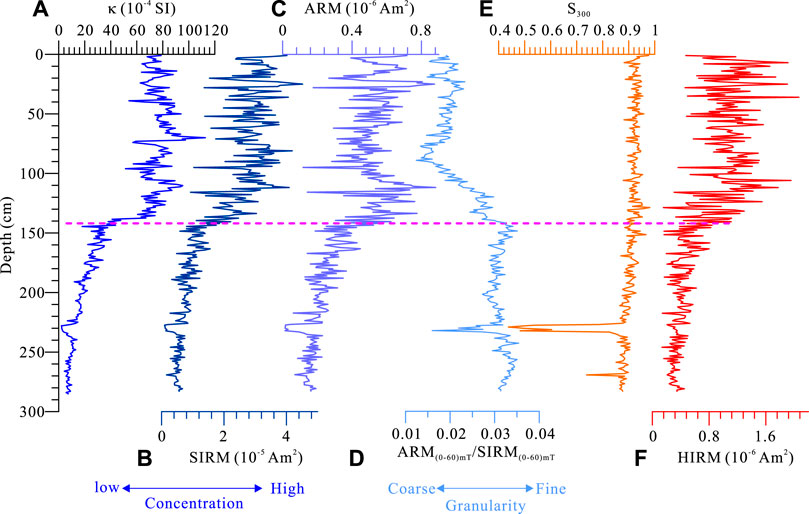
FIGURE 3. Downcore variations in environmental magnetism proxies of volume magnetic susceptibility (κ) (A), saturation isothermal remanence (SIRM) (B), anhysteretic remanence (ARM) (C) and the ratio of ARM(0–60)mT/SIRM(0–60)mT (D), S300 (E) and HIRM (F).
Magnetic fabric and particle size variations
The stereographic projection of the anisotropy principal axes displays a normal depositional fabric (Supplementary Figure S2A). The maximum axes are scattered around the horizontal plane, and the minimum axes cluster tightly around the vertical plane. The principal directions of the long axes are aligned along the northeast direction after correction based on the natural remanence declination of the uppermost sediments (Supplementary Figure S2B). The T-P projection of magnetic fabric indicates that most specimens had oblate shapes, whereas a few prolate samples had small p values (<1.04) (Tarling & Hrouda, 1993) (Figure 4). The q-P plot shows that the deposition was dominated by normal currents, slope gravity and viscous suspension (Taira, A., 1989; Bradák-Hayashia et al., 2017). However, some large q values (>0.6) present increasing tangential stress and higher energy. A weak negative correlation between p and q suggests that increasing q is accompanied by decreasing anisotropy, possibly due to rearrangement and the relatively chaotic behavior of grains in higher-energy dynamics conditions.
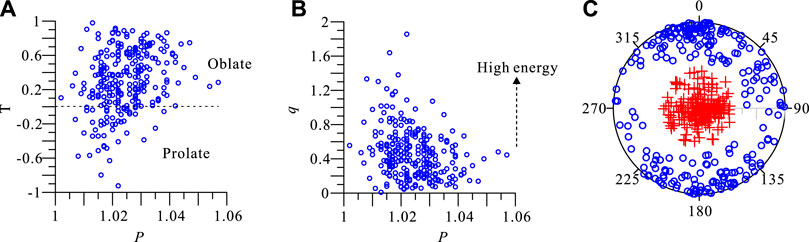
FIGURE 4. Projection of the magnetic fabric parameters of the shape factor (T)-degree of anisotropy (P) (A) and shape factor (q)-P (B).
The higher anisotropy (larger p-value) with low L in the foliation plane may correspond to the relatively lower-energy currents and the strengthening of the gravitational force during grain transport (Figure 5). The foliation (F) and the degree of anisotropy (p) varied in cycles. Increasing p indicates relatively enhanced hydroenergy at the boundary of the water and sediment surfaces. However, the terrigenous particle size did not mimic the cyclic variations in the magnetic fabric parameters. The fine silt and clay fraction (<7.5 μm) appeared high in the middle part and low in the upper and lower parts. The coarse size fraction exhibited high frequency fluctuation below ∼140 cm and a relatively high value above 100 cm. The different changing patterns of p and particle size present two types of hydrodynamic conditions. The magnetic fabric is related to the bottom hydroconditions, while the coarse particle size is responsible for higher-energy currents.
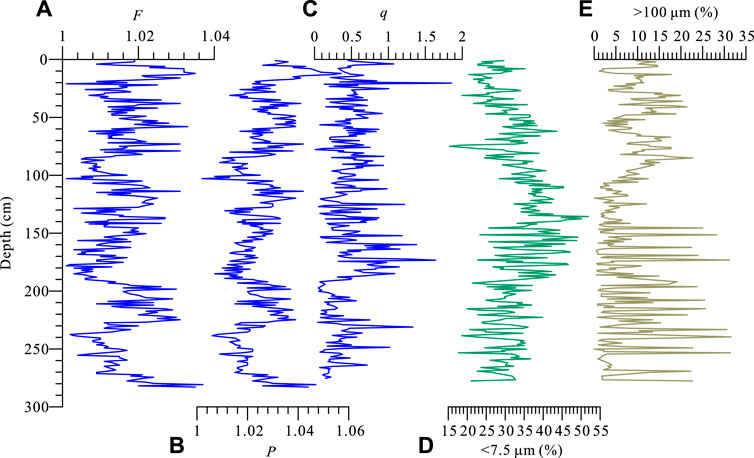
FIGURE 5. Variations in foliation (F) (A), degree of anisotropy (P) (B), and shape factor (q) (C) coeval with the particle size fractions of <7.5 (D) and >100 μm (E).
Natural remanence (NRM)
The NRM of all samples can be demagnetized using alternative fields (AFs) of 0–80 mT. A weak second NRM component can be removed in a few samples at AFs of 10–20 mT (Figure 6). The characteristic remanent magnetization (ChRM) and maximum angle deviation (MAD) can be evaluated between 20 and 80 mT. The remanence of only 47 samples displayed a relatively scattered distribution, and these samples were rejected when analyzing the directional changes in core sediments. Downcore variations in ChRM inclinations and declinations are shown in Figure 7 (the declination represents only the relative change). The MAD values are generally <5°, confirming that the magnetization components are well defined. The directions of both inclination and declination are characterized by several prominent lows and peaks, which represent the paleosecular variations in the geomagnetic field. The large variability in the directions in the upper layer (from 100 to 10 cm) exceeds the results of the archaeomagnetic and CALS 10 K.2 models (Brown et al., 2015; Cai et al., 2017), which may result in debate about the reliability of the paleomagnetic directions. However, we do not have enough reason to reject these results because the well-preserved natural remanence, the minimal sediment disturbance, and the relatively low p values (<1.06) associated with fine sediments (the fraction of the grain size <60 μm varied around 80%) are conducive to record the geomagnetic field.
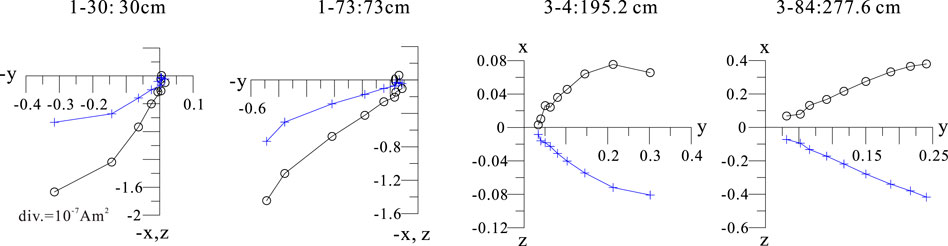
FIGURE 6. Principal component plots (top) (Kirschvink, 1980) of representative specimens. Open circles (cross) display projections onto the vertical (horizontal) plane.
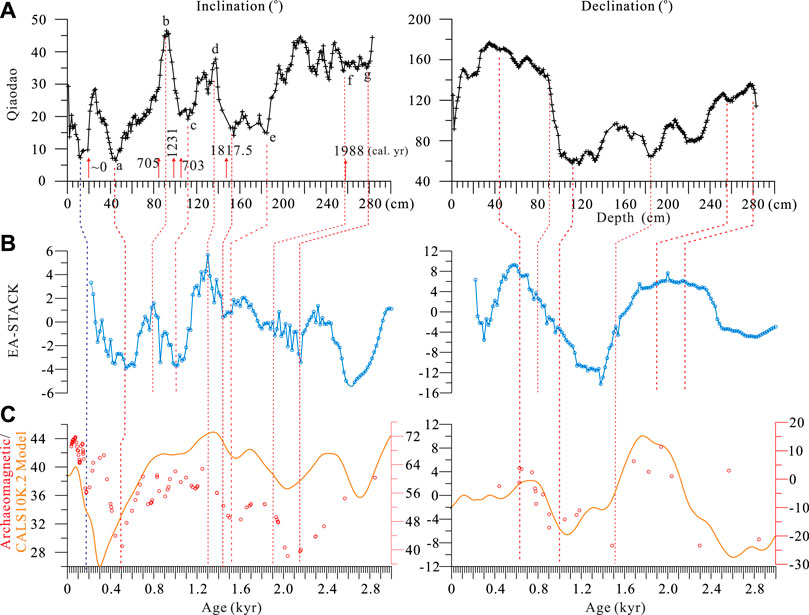
FIGURE 7. Correlation of the ChRM directions of core ZH06 (A) with eastern Asian stack curves (EA-STACK) (Zheng J et al., 2014) (B) and archaeomagnetic/CALS10k.2 model results of eastern China (Brown et al., 2015) (C). The radiocarbon ages are displayed in (A). The dotted lines show the favorite tied points between the different curves.
Radiocarbon dating results
The radiocarbon ages are given in Table 1a. The ages from the different labs may have a little discrepancy for the same layer sediments, which can arise from the dating materials and lab error. The calibrated ages suggest that the core sediments are younger than 2.5 kyr despite the nonlinear distribution of seven ages. Although the dating materials are intact shells, conches and terrigenous debris, the complex deposition process and possible reworking under delta conditions may prevent the construction of a reliable chronology of sediments. Almost the same age at the different depths of 85 cm and 106 cm may originate from the downward activity of benthic shells or conches. The reverse age at a depth of 99.5 cm with the adjacent layers may reflect old plant debris pollution from the drainage system.
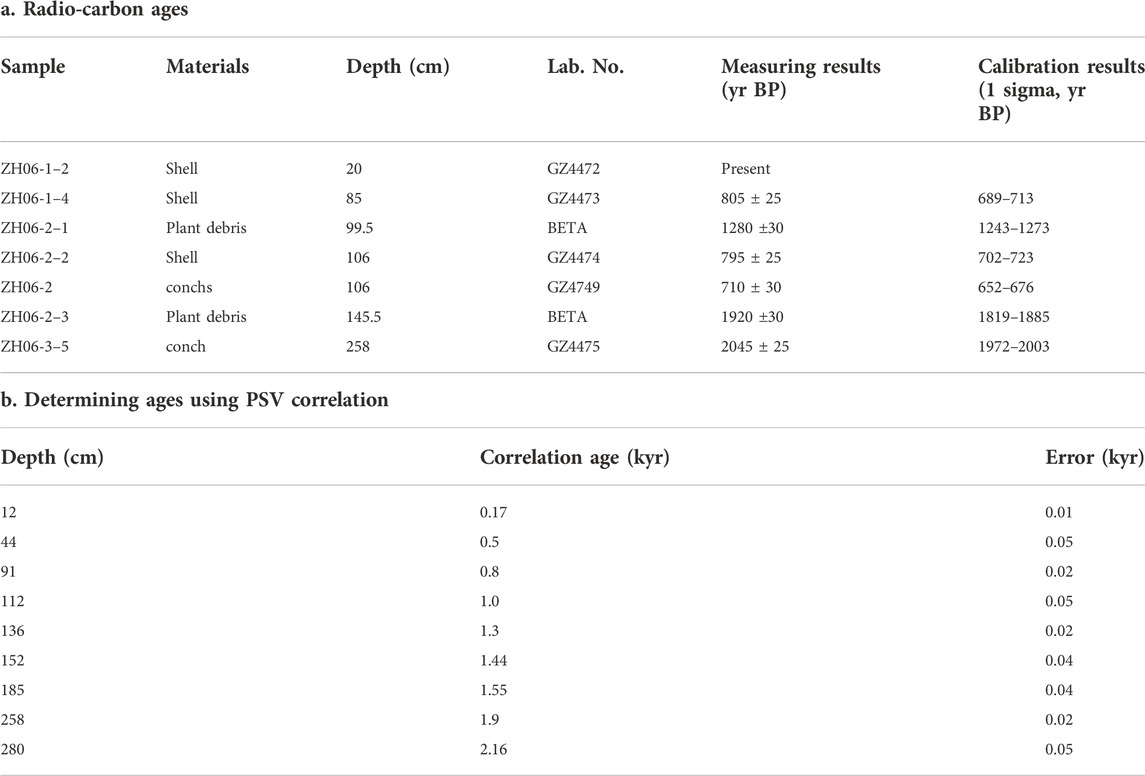
TABLE 1. The age-depth relation of Core Zh06.
Discussion
Constructing the chronology based on the PSV correlation
The paleomagnetic field variations (PSVs) were determined as the long-term temporal changes in the Earth’s magnetic field longer than several hundreds of years, which resulted from the effect of magnetic diffusion in the core-mantle boundary zone (Korte & Holme, 2010; Korte et al., 2011; Laj & Channell, 2015). A series of studies have suggested that the PSV can serve as an effective dating tool within a region of thousands of kilometers (Yang et al., 2009; Shanahan et al., 2013). In eastern China, the nondipole field has a common influence on the geomagnetic field, and the PSV has had a similar pattern since the Holocene (Korte & Holme, 2010). This feature meets the criteria of PSV dating of the sediments. Zheng Y et al. (2014) reconstructed a PSV stack of East Asia (EA-Stack) by synthesizing sedimentary and archeological results, which provides an important reference curve for a large region.
During the river delta deposition process, ocean currents and bottom fauna often disturb the materials; however, the reworked sediments mostly occur near the water–sediment interface. The magnetic minerals are realigned along the Earth’s magnetic field after these disturbances. The natural remanence preserved in such sediments can record the features of the Earth’s magnetic field. We link our inclination and declination records to the EA-Stack constrained by the radiocarbon ages, and six tied points can be recognized in the inclination correlation (Figure 7). For the upper 20 cm sediments, we correlate them to the archaeomagnetic records of East Asia and the CALS10k.2 model results (Brown et al., 2015; Cai et al., 2017) to achieve a tied point at ∼12 cm. Hence, a correlation depth-age model can be reconstructed based on these tied points (Table 1b). A possible error may occur within 180–280 cm. Our inclination displayed a relatively stable plateau with some fluctuations, while the EA-Stack exhibited a decreasing trend. However, the radiocarbon ages of 1852 and 1988 at depths of 145.5 cm and 258 cm provide two constrained points. The chronology of core sediments can be established by the deposition rate and correlation age. The results attest that the core sediments approximately 283 cm in length document a deposition of approximately 2.1 kyr.
Hydrodynamic change and tropical precipitation
Anisotropic magnetic susceptibility reflects the fabric acquired by the sediments during deposition (Wassmer et al., 2015), which is often used to determine the paleocurrent direction, tsunami events and deposition process (Schneider et al., 2014; Bradak-Hayashi et al., 2017). The different flow stresses in the bottom layer can induce the varying p and the orientation of the long axis (Kmax). When the currents have weak or laminar flow, Kmax is parallel to the flow direction (Tarling & Hrouda, 1993). The p values of our core were less than 1.04 for most sediments, which are mainly dominated by foliation (F). Low and high p values indicate weak and increased flow stress during the deposition period, respectively. The flow strength at the core site may be a mixture of river currents with waves and tides; however, the latter two should have a relatively mean stable strength with daily and monthly fluctuations. The change in the flow stress should mainly arise from the river discharge influence, which is heavily controlled by precipitation. Comparing the variations in p with the detrended HIRM values, a consistent pattern appeared (Figure 8). A high HIRM represents a greater flux of terrigenous debris under the intensification of pedogenic processes in subtropical regions with warm and wet climate conditions (producing more high-coercivity minerals) (Long et al., 2011; Jiang et al., 2018; Jiang et al., 2022). Enhanced rainfall strengthens the river discharge and sediment load (Liu et al., 2017), which increases p values. Hence, cyclic p and HIRM indicate the periodicity of tropical precipitation. Performing the spectral analysis for p values (Li et al., 2019), two periods of approximately 300 years and 100 years are significant (Supplementary Figure S3). High p values remain consistent with the sea surface temperature of the western tropics (Stott et al., 2004), which would induce an ENSO boom (Moy et al., 2002; Conroy et al., 2008; Karamperidou et al., 2015; Barr et al., 2019). Simulation studies and modern observation records also confirm that in contrast to the monsoon change recorded in stalagmites, ENSO activities and tropical storms play an important role in tropical precipitation, although an ambiguous relationship exists at interannual time scales (Liu et al., 2017; Deng et al., 2018; Yan et al., 2022). Strong ENSO activities (La Niña years) induce more rainfall in river basins (Barr et al., 2019), which influences land and ocean areas. The δ18OG. Ruber of core 17,940 selected from the northern South China Sea (Wang et al., 1999) agrees well with the p and HIRM curves, suggesting a common forcing process arising from precipitation.
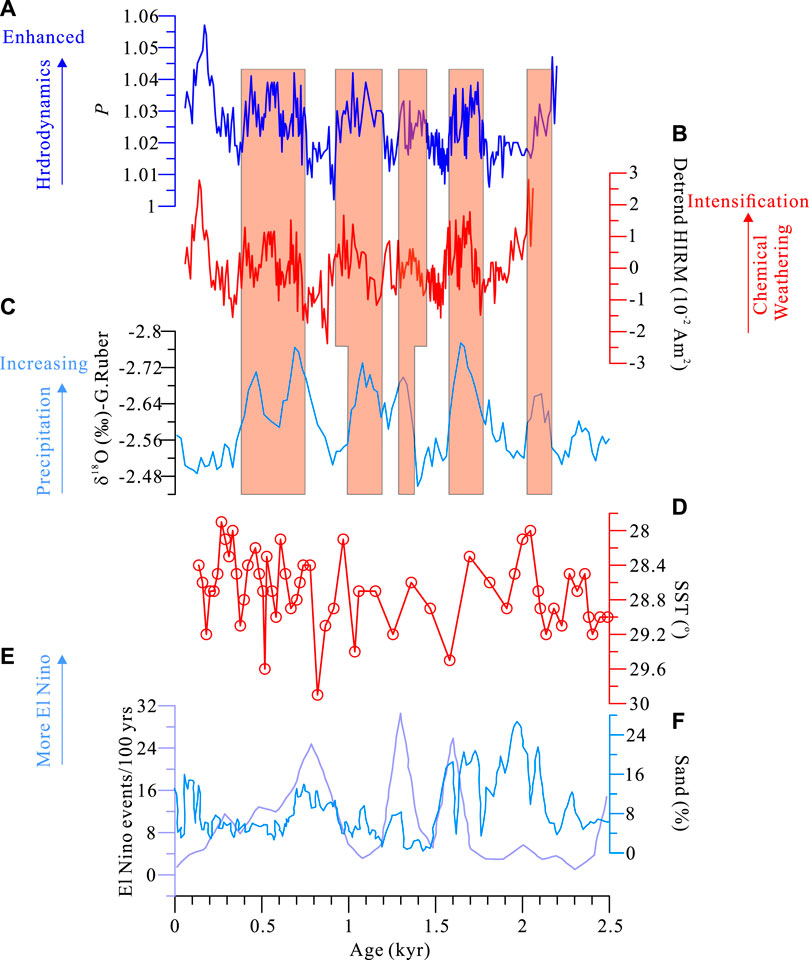
FIGURE 8. Comparison of p (A), HIRM (B) with δ18O of core 17,940 (C) (Wang et al., 1999), the sea surface temperature (SST) of the western Pacific (E) (Stott et al., 2004) and ENSO proxies (F,G) (Moy et al., 2002; Conroy et al., 2008)
Strong tropical storms, especially typhoons, can induce heavy rainfall in a short time (Yan et al., 2022). This process causes higher energy transport, high-density water and grain-to-grain interactions, and the sediments in the bottom layer are “slurry-like”. The q values of the magnetic fabric increase with low p values and coarse particle sizes. That is, the large q values can hint at floods and a high-energy flow. During the period of 1.4–1.9 kyr BP (Figure 9), coarse particle grains fluctuate with high frequency and amplitude, and the q values have a corresponding pattern. They present high-frequency tropical storms, agreeing well with the flood events that occurred in the Yangtze River Delta (Zheng J et al., 2014; Nian et al., 2022) and central China, which were reconstructed from the historical reference and IRM flux in the stalagmite (Zhu Y. N et al., 2017), respectively. The high-frequency typhoon events correspond to the low temperature in eastern China (Ge et al., 2003). When the temperature increased, the typhoon frequency decreased. The consistent high-frequency tropical storms forced flood events, which affected not only the eastern coastal area of China but also the central part of China.
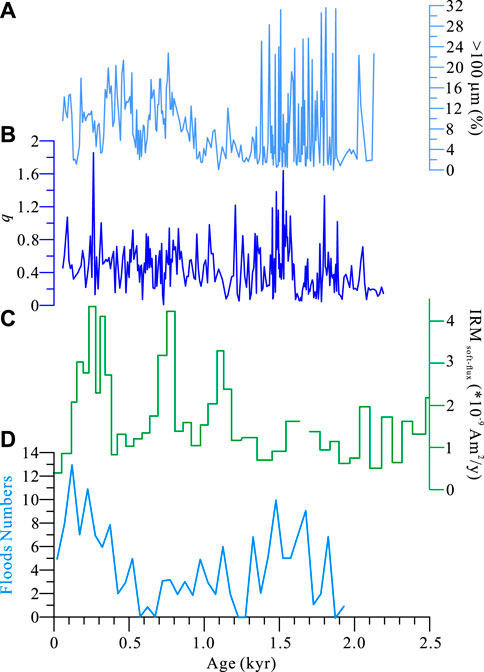
FIGURE 9. Comparison of the particle size fraction >100 µm (A) and q values with flood proxies reconstructed from a stalagmite from Shennongjia (Zhu Z. M et al., 2017) (C) and historical records of the Yangtz River delta (D) (Nian et al., 2022).
Human activity-induced sediment flux
The remanence of sediments was mainly dominated by soft magnetite, and SIRM variations arose from the concentration of magnetite, which depends on terrigenous inputs. The sediment load increase should have responded to an increasing SIRM trend from approximately 1.6–1.0 kyr BP (Figure 10). Neither high-energy tropical storms nor relatively weak ENSO activity display this long-term trend (Conroy et al., 2008; Nan et al., 2014) (Figures 8, 9), and the increase in the sediment load may arise from other factors. Some investigations show that the sediment supply from the Pearl River over the last ∼150 years was dominated by human activities (Ranasinghe et al., 2019). The population of Guangdong Province grew from 240,000 to 2,920,000, and most of them lived in the Pearl River Basin (Zhu et al., 1988). Increasing cultivation activities destroyed vegetation and produced a large amount of debris, which was transported to the lower reaches of the delta. Since approximately 500 years ago, the population has also increased rapidly, but the central region has migrated to the lower reaches of the delta region, and dam construction and reclamation have limited the debris into the river system. Therefore, the relationship between population growth and sediment flux at approximately 2.5 kyr BP indicates that different human activities have an important impact on sediment inputs. In an agricultural society, planting activities in river basins increase sediment inputs, but modern human activities in the lower reaches of the delta may reduce the inflow of debris despite natural processes.
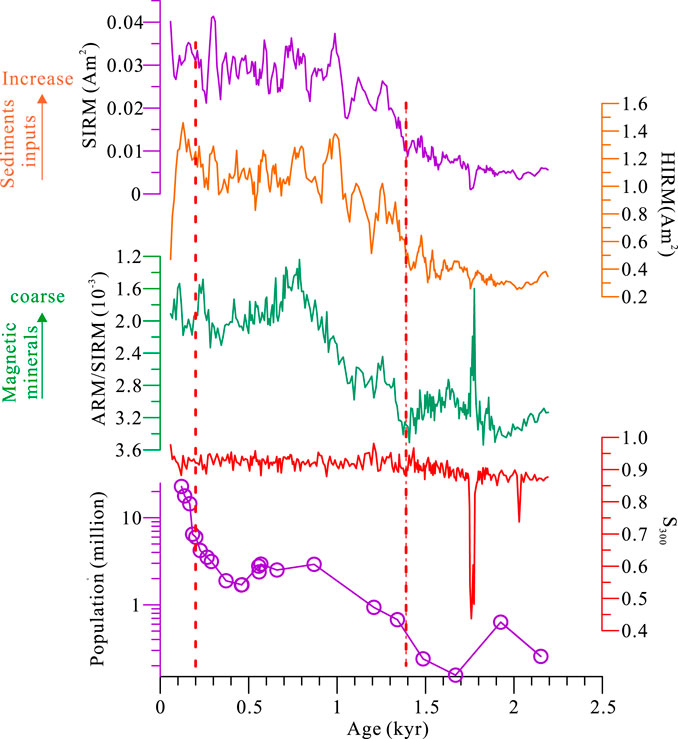
FIGURE 10. The relation of sediment inputs expressed by magnetic proxies with population growth in Guangdong Province (Zhu et al., 1988).
Conclusion
The sediments of core ZH06, which is from the Pearl River subaqueous delta and is ∼2.8 m in length, provide the hydrodynamic evolution process and sediment input history impacted by human activity. The paleomagnetism and magnetic fabric analysis provide the chronology of sediments and the proxies indicating the water energy and sediment flux. Based on the environmental and magnetism investigations, we can infer some insights about the deposition process in the Pearl River Delta region.
1) The deposition may be disturbed by various factors, and the radiocarbon ages have difficulty constraining the age of sediments. The paleosecular variations, which rely on geomagnetic field variations over hundreds to thousands of years, have provided a reliable chronology since approximately 2.5 kyr.
2) Cyclic variations in the degree of anisotropy of magnetic susceptibility (P) at 100 and 300 years imply relatively weak energy arising from ENSO activities, which dominate the precipitation in this region.
3) The large shape factor (q) values coeval with the coarser particle size fraction denote the higher-energy current, which can induce the “slurry-like” transport of sediments during the period of 1.3–1.9 kyr, in which the strong tropical storms occurred at high frequencies and intensities.
4) The increasing trend of the SIRM from 1.3 to 10 kyr BP indicates increasing human activity after the Sui Dynasty. The agricultural planting in the river basin destroyed the vegetation and produced large amounts of debris, which flowed into the river and were transported to the lower reaches of the delta.
Data availability statement
The raw data supporting the conclusions of this article will be made available by the authors, without undue reservation.
Author contributions
XQ, Responsable for the article SW, ST, and YC, Sampling and Experiments.
Funding
This study was supported by the Guangdong Province Introduced Innovative R&D Team of Geological Processes and Natural Disasters around the South China Sea (Grant No. 2016ZT06N331) and the National Natural Science Foundation of China (Grant No. 41872217). All new raw data collected in this manuscript are accessible through the corresponding author.
Acknowledgments
We wish to thank Yonggang Yan for assistance with sample processing.
Conflict of interest
The authors declare that the research was conducted in the absence of any commercial or financial relationships that could be construed as a potential conflict of interest.
Publisher’s note
All claims expressed in this article are solely those of the authors and do not necessarily represent those of their affiliated organizations, or those of the publisher, the editors and the reviewers. Any product that may be evaluated in this article, or claim that may be made by its manufacturer, is not guaranteed or endorsed by the publisher.
Supplementary material
The Supplementary Material for this article can be found online at: https://www.frontiersin.org/articles/10.3389/feart.2022.1015697/full#supplementary-material
References
Barr, C., Tibby, J., Leng, M. J., Tyler, J. J., Henderson, A. C. G., Overpeck, J. T., et al. (2019). Holocene El niño–southern oscillation variability reflected in subtropical Australian precipitation. Sci. Rep. 9, 1627. doi:10.1038/s41598-019-38626-3
Bradák-Hayashia, B., Tanigawa, K., Hyodo, M., and Seto, Y. (2017). Magnetic fabric evidence for rapid, characteristic changes in the dynamics of the 2011 Tohoku-oki tsunami. Mar. Geol. 387, 85–96. doi:10.1016/j.margeo.2017.04.003
Brown, M. C., Donadini, F., Nilsson, A., Panovska, S., Frank, U., Korhonen, K., et al. (2015). GEOMAGIA50.v3: 2. A new paleomagnetic database for lake and marine sediments. Earth Planets Space 67, 70. doi:10.1186/s40623-015-0233-z
Cai, S. H., Jin, G. Y., Tauxe, L., Deng, C. L., Qin, H. F., Pan, Y. X., et al. (2017). Archaeointensity results spanning the past 6 kiloyears from eastern China and implications for extreme behaviors of the geomagnetic field. Proc. Natl. Acad. Sci. U. S. A. 114 (1), 39–44. doi:10.1073/pnas.1616976114
Chen, J. L., Wang, Z. Q., Tam, C. Y., Lau, N. C., Dickson, L. D. S., and Mok, H. Y. (2020). Impacts of climate change on tropical cyclones and induced storm surges in the Pearl River Delta region using pseudo-global-warming method. Sci. Rep. 10, 1965. doi:10.1038/s41598-020-58824-8
Conroy, J. L., Overpeck, J. T., Cole, J. E., Shanahan, T. M., and Steinitz-Kannan, M. (2008). Holocene changes in eastern tropical Pacific climate inferred from a Galápagos lake sediment record. Quat. Sci. Rev. 27, 1166–1180. doi:10.1016/j.quascirev.2008.02.015
Constable, C., and Tauxe, L. (1990). The Bootstrap for magnetic susceptibility tensors. J. Geophys. Res. 95 (B6), 8383–8395. doi:10.1029/JB095iB06p08383
Deng, C. L., Zhu, R. X., Jackson, M. J., Verosubc, K. L., and Singer, M. J. (2001). Variability of the temperature-dependent susceptibility of the Holocene eolian deposits in the Chinese loess plateau: A pedogenesis indicator. Phys. Chem. Earth, Part A Solid Earth Geodesy 26 (11-12), 873–878. doi:10.1016/S1464-1895(01)00135-1
Deng, S. L., Chen, T., Yang, N., Qu, L., Li, M. H., and Chen, D. (2018). Spatial and temporal distribution of rainfall and drought characteristics across the Pearl River basin. Sci. Total Environ. 619-620, 28–41. doi:10.1016/j.scitotenv.2017.10.339
Egli, R. (2013). Variforc: An optimized protocol for calculating non-regular first-order reversal curve (FORC) diagrams. Glob. Planet. Change 110, 302–320. doi:10.1016/j.gloplacha.2013.08.003
Ge, Q. S., Zheng, J. Y., Fang, X. Q., Man, Z. M., Zhang, X. Q., Zhang, P. Y., et al. (2003). Winter half-year temperature reconstruction for the middle and lower reaches of the Yellow River and Yangtze River, China, during the past 2000 years. Holocene 13 (6), 933–940. doi:10.1191/0959683603hl680rr
Goodbred, S. L., and Kuehl, S. A. (2000). The significance of large sediment supply, active tectonism, and eustasy on margin sequence development: Late Quaternary stratigraphy and evolution of the Ganges-Brahmaputra delta. Sediment. Geol. 133 (3-4), 227–248. doi:10.1016/S0037-0738(00)00041-5
Harrison, R. J., and Feinberg, J. M. (2008). FORCinel: An improved algorithm for calculating first-order reversal curve distributions using locally weighted regression smoothing. Geochem. Geophys. Geosyst. 9, Q05016. doi:10.1029/2008GC001987
Hassan, F. A. (1997). The dynamics of a riverine civilization: A geoarchaeological perspective on the nile valley, Egypt. World Archaeol. 29, 51–74. doi:10.1080/00438243.1997.9980363
He, Y., Liu, X. J., Duan, Z. H., Liu, C., Hou, P., Lu, C., et al. (2022). Long-term morphodynamic evolution in the modaomen estuary of the Pearl River Delta, South China. Geomorphology 398, 108057. doi:10.1016/j.geomorph.2021.108057
Hoitink, A. J. F., Wang, Z. B., Vermeulen, B., Huismans, Y., and Kastner, K. (2017). Tidal controls on river delta morphology. Nat. Geosci. 10, 637–645. doi:10.1038/ngeo3000
Jiang, Z. X., Liu, Q. S., Roberts, A. P., Barrón, V., Torrent, J., and Zhang, Q. (2018). A new model for transformation of ferrihydrite to hematite in soils and sediments. Geology 46 (11), 987–990. doi:10.1130/G45386.1
Jiang, Z. X., Liu, Q. S., Roberts, A. P., Dekkers, M. J., Barron, V., Torrent, J., et al. (2022). The magnetic and color reflectance properties of hematite: From Earth to mars. Rev. Geophys. 60 (1), e2020RG00698. doi:10.1029/2020RG000698
Karamperidou, C., Nezio, P. N. D., Timmermann, A., Jin, F.-F., and Cobb, K. M. (2015). The response of ENSO flavors to mid-Holocene climate: Implications for proxy interpretation. Paleoceanography 30, 527–547. doi:10.1002/2014PA002742
Korte, M., Constable, C., Donadini, F., and Holme, R. (2011). On the persistence of geomagnetic flux lobes in global Holocene field models. Phys. Earth Planet. Interiors 312 (3-4), 179–186. doi:10.1016/j.pepi.2010.08.006
Korte, M., and Holme, R. (2010). On the persistence of geomagnetic flux lobes in global Holocene field models. Phys. Earth Planet. Interiors 182, 179–186. doi:10.1016/j.pepi.2010.08.006
Laj, C., and Channell, J. E. T. (2015). Geomagnetic excursions” in treatise on Geophysics. 2nd Edition. Netherlands: Elsevier B.V., 5343–5363. Editor- in-Chief Schubert G.
Li, M. S., Hinnov, L., and Kump, L. (2019). Acycle: Time-series analysis software for paleoclimate research and education. Comput. Geosci. 127, 12–22. doi:10.1016/j.cageo.2019.02.011
Liu, F., Chen, H., Cai, H. Y., Luo, X. X., Ou, S. Y., and Yang, Q. S. (2017). Impacts of ENSO on multi-scale variations in sediment discharge from the Pearl River to the South China sea. Geomorphology 293, 24–36. doi:10.1016/j.geomorph.2017.05.007
Liu, F., Xie, R. Y., Luo, X. L., Yang, L. Z., Cai, H. Y., and Yang, Q. S. (2019). Stepwise adjustment of deltaic channels in response to human interventions and its hydrological implications for sustainable water managements in the Pearl River Delta, China. J. Hydrology 573, 194–206. doi:10.1016/j.jhydrol.2019.03.063
Long, X., Ji, J., and Balsam, W. (2011). Rainfall-dependent transformations of iron oxides in a tropical saprolitetransect of Hainan Island, South China: Spectral and magnetic measurements. J. Geophys. Res. 116, F03015. doi:10.1029/2010JF001712
Macklin, M. G., and Lewin, J. (2015). The rivers of civilization. Quat. Sci. Rev. 114, 228–244. doi:10.1016/j.quascirev.2015.02.004
McManus, J. (2002). Deltaic responses to changes in river regimes. Mar. Chem. 79, 155–170. doi:10.1016/S0304-4203(02)00061-0
Moy, C. M., Seltzer, G. O., Rodbell, D. T., and Anderson, D. M. (2002). Variability of El nino/southern oscillation activity at millennial timescales during the Holocene epoch. Nature 420, 162–165. doi:10.1038/nature01194
Nan, Q. Y., Li, T. G., Chen, J. X., Nigma, R., Yu, X. K., Xu, Z. K., et al. (2014). Late Holocene (∼2 ka) East asian monsoon variations inferred from river discharge and climate interrelationships in the Pearl River estuary. Quat. Res. 81, 240–250. doi:10.1016/j.yqres.2013.12.004
Nian, X. M., Zhang, W. G., Wang, X. T., Hutchinson, S. M., Zhao, X. Q., and Liu, K.-B. (2022). Multi-centennial variability of Yangtze delta growth over the last 2000 Years: Interplay of climate and people. Earth's. Future 10 (8), e2021EF002461. doi:10.1029/2021EF00246110.1029/2021EF002461
Ranasinghe, R., Wu, C. S., Conallin, J., Duong, T. M., and Anthony, E. J. (2019). Disentangling the relative impacts of climate change and human activities on fluvial sediment supply to the coast by the world’s large rivers: Pearl River Basin, China. Sci. Rep. 9, 9236. doi:10.1038/s41598-019-45442-2
Roberts, A. P., Chang, L., Rowan, C. J., Horng, C.-S., and Florindo, F. (2011). Magnetic properties of sedimentary greigite (Fe3S4): An update. Rev. Geophys. 49, RG1002. doi:10.1029/2010RG000336
Roberts, A. P., Zhao, X., Hu, P., Abrajevitch, A., Chen, Y.-H., Harrison, R. J., et al. (2021). Magnetic domain state and anisotropy in hematite (α-Fe2O3) from first-order reversal curve diagrams. JGR. Solid Earth 126, e2021JB023027. doi:10.1029/2021jb023027
Schneider, J.-L., Catherine, C.-G., Jean-Luc, B., James, G., Daisuke, S., Kazuhisa, G., et al. (2014). Using magnetic fabric to reconstruct the dynamics of tsunami deposition on the Sendai Plain, Japan - the 2011 Tohoku-oki tsunami. Mar. Geol. 358, 89–106. doi:10.1016/j.margeo.2014.06.010
Shanahan, T. M., Peck, J. A., McKay, N., Heil, C. W., King, J., Forman, S., et al. (2013). Age models for long lacustrine sediment records using multiple dating approaches-An example from Lake Bosumtwi, Ghana. Quat. Geochronol. 15, 47–60. doi:10.1016/j.quageo.2012.12.001
Shaw, J. B., David, M., and Wayne and, W. R. (2016). Flow patterns and morphology of a prograding river delta. J. Geophys. Res. Earth Surf. 121 (2), 372–391. doi:10.1002/2015JF003570
Stott, L., Cannariato, K., Thunell, R., Huag, G. H., Koutavas, A., and Lund, S. (2004). Decline of surface temperature and salinity in the Western tropical Pacific Ocean in the Holocene epoch. Nature 431, 56–59. doi:10.1038/nature02903
Taira, A. (1989). “Magnetic fabrics and depositional processes,” in Sedimentary facies in the active plate margin. Editors A. Taira, and F. Masuda (Tokyo: Terra Scientific Publishing Company), 43–77.
Wang, L. J., Sarnthein, M., Erlenkeuser, H., Grootes, P. M., Grimalt, J. O., Pelejero, C., et al. (1999). Holocene variations in asian monsoon moisture: A bidecadal sediment record from the South China sea. Geophys. Res. Lett. 26 (18), 2889–2892. doi:10.1029/1999GL900443
Wassmer, P. C., Gomez, C. A., Iskandasyah, T. Y. W. M., Lavigne, F., and Sartohadi, J. (2015). Contribution of anisotropy of magneticsusceptibility (AMS) to reconstruct flooding characteristics of a 4220 BP tsunami from a thick unconsolidated structureless deposit (Banda Aceh, Sumatra). Front. Earth Sci. (Lausanne). 3, 40. doi:10.3389/feart.2015.00040
Wei, X., Cai, S. Q., Ni, P. T., and Zhan, W. K. (2020). Impacts of climate change and human activities on the water discharge and sediment load of the Pearl River, southern China. Sci. Rep. 10, 16743. doi:10.1038/s41598-020-73939-8
Wu, Z. Y., Saito, Y., Zhao, D. N., Zhou, J. Q., Cao, Z. Y., Li, S. J., et al. (2016). Impact of human activities on subaqueous topographic change in Lingding Bay of the Pearl River estuary, China, during 1955–2013. Sci. Rep. 6, 37742. doi:10.1038/srep37742
Xie, C. J., Cui, B. S., Ning, Z. H., Yu, S. L., and Xie, T. (2022). Longitudinal dynamics of hydrological connectivity in the yellow River Delta, China. Front. Mar. Sci. 9, 899671. doi:10.3389/fmars.2022.899671
Yan, Y., Wang, G. H., Wu, H., Gu, G. J., and Nanding, N. (2022). Characteristics of precipitation and floods during typhoons in Guangdong Province. Remote Sens. 14, 1945. doi:10.3390/rs14081945
Yang, C., Li, Q. Q., Zhao, T. H., Liu, H. Z., Gao, W. X., Shi, T. Z., et al. (2019). Detecting spatiotemporal features and rationalities of urban expansions within the Guangdong–Hong Kong–Macau greater bay area of China from 1987 to 2017 using time-series landsat images and socioeconomic data. Remote Sens. 11, 2215. doi:10.3390/rs11192215
Yang, X. Q., Graphes, R., Zhou, H. Y., and Yang, J. (2008). Magnetic properties of sediments from the Pearl River Delta, South China: Paleoenvironmental implications. Sci. China Ser. D-Earth. Sci. 51 (1), 56–66. doi:10.1007/s11430-007-0151-4
Yang, X. Q., Heller, F., Yang, J., and Su, Z. H. (2009). Paleosecular variations since ∼9000 yr BP as recorded by sediments from maar lake Shuangchiling, Hainan, South China. Earth Planet. Sci. Lett. 288 (1-2), 1–9. doi:10.1016/j.epsl.2009.07.023
Zheng, J., Hao, Z., Fang, X., and Ge, Q. (2014). Changing characteristics of extreme climate events during past 2000 years in China. (In Chinese). Prog. Geogr. 33, 3–12. doi:10.11820/dlkxjz.2014.01.001
Zheng, Y., Zheng, H. B., Deng, C. L., and Liu, Q. S. (2014). Holocene paleomagnetic secular variation from East China sea and a PSV stack of East Asia. Phys. Earth Planet. Interiors 236, 69–78. doi:10.1016/j.pepi.2014.07.001
Zhou, H. Y., Wang, Z. L., Wu, X. S., Chen, Y. H., Zhong, Y. X., Li, Z. Y., et al. (2019). Spatiotemporal variation of annual runoff and sediment load in the Pearl River during 1953–2017. Sustainability 11, 5007. doi:10.3390/su11185007
Zhu, Y. C., Chen, H. G., and Lu, D. T. (1988). Population of China (Guangdong branch). Beijing: China Financial & Economic Publishing House, 40–57. In Chinese7-5005-0022-X/F.0022.
Zhu, Y. N., Liu, Z. H., Zhao, Y., Li, H. H., He, F., Zhao, J. Q., et al. (2017). Flood simulations and uncertainty analysis for the Pearl River Basin using the coupled land surface and hydrological model system. Water 9 (6), 391. doi:10.3390/w9060391
Zhu, Z. M., Feinberg, J. M., Xie, S. C., Bourne, M. D., Huang, C. J., Hu, C. Y., et al. (2017). Holocene ENSO-related cyclic storms recorded by magnetic minerals in speleothems of central China. Proc. Natl. Acad. Sci. U. S. A. 114 (5), 852–857. doi:10.1073/pnas.1610930114
Keywords: pearl river delta, magnetic fabric, ENSO activity, tropical storm, human activity
Citation: Yang X, Wu S, Shang S and Chen Y (2023) Hydrodynamic variations and human activities have influenced sediment fluxes in the pearl river delta since the late holocene. Front. Earth Sci. 10:1015697. doi: 10.3389/feart.2022.1015697
Received: 10 August 2022; Accepted: 14 November 2022;
Published: 12 January 2023.
Edited by:
Weiwei Ding, Ministry of Natural Resources, ChinaReviewed by:
Nosir Shukurov, Institute of Geology and Geophysics, UzbekistanXinggong Kong, Nanjing Normal University, China
Copyright © 2023 Yang, Wu, Shang and Chen. This is an open-access article distributed under the terms of the Creative Commons Attribution License (CC BY). The use, distribution or reproduction in other forums is permitted, provided the original author(s) and the copyright owner(s) are credited and that the original publication in this journal is cited, in accordance with accepted academic practice. No use, distribution or reproduction is permitted which does not comply with these terms.
*Correspondence: Xiaoqiang Yang, ZWVzeXhxQG1haWwuc3lzdS5lZHUuY24=