 Zheng Fu1
 Shuangfang Lu
 Huijun Wang
- 1School of Geosciences, China University of Petroleum (East China), Qingdao, China
- 2Sanya Offshore Oil & Gas Research Institute, Northeast Petroleum University, Sanya, China
- 3Key Laboratory of Continental Shale Hydrocarbon Accumulation and Efficient Development, Ministry of Education, Northeast Petroleum University, Daqing, China
Oil and gas exploration professionals have begun to focus more on unconventional oil and gas reserves in recent years as a result of their increased efforts. Fractures have a significant impact on the permeability and connectivity of reservoirs as a crucial component of rock mechanics and hydraulics, which directly affects the production of oil and gas. The identification of fracture development zones or micro faults, as well as how to adequately define the fracturing model, have thus become crucial and pressing issues in the forecast of oil and gas reservoirs. In this study, we decompose the three-dimensional seismic data volume in a site in order to obtain the single frequency data volume that can be calculated using the ant tracking technique. We do this by taking advantage of the synchronous extrusion improvement of short time Fourier transform in time-frequency focusing. Coupled with the advanced DFN model, the extracted data are calibrated in various rock attributes to restore the morphology and characteristics of fractures. The findings demonstrate that this method is capable of providing not only a precise outline of micro fractures but also a reflection of the characteristics of fractures at various scales, including structure and associated properties. The precision and applicability of this method are confirmed in this paper, which is significant as a reference for the oil and gas exploration industry.
Introduction
Oil and gas exploration professionals are favoring unconventional and deep oil and gas reservoirs more and more as the amount of oil and gas exploration increases worldwide. Fractures play a crucial role as they affect the permeability and connectivity of the reservoir and directly determine the production of oil and gas. The complex fracture network is frequently generated in the underground rock due to rock mechanics and fracturing, combined with the development and interaction after the formation. According to the available research, the complexity of fracture systems frequently displays the traditional traits of a complex system with a power-law scale relationship (L Barabási and Albert, 1999) and is well acknowledged and accepted in geological study (Bonnet et al., 2001; Bour et al., 2002; Davy et al., 2010). Seismic treatment is very helpful for geological interpretation. In addition to the method in this paper, many researchers mentioned the practicability of edge detection filters in the potential field method of interpreting structural trends in structural research, which has similar purposes with the method in this paper, and is also worthy of relevant work.
Since Bahorich and Farmer (Bahorich and Farmer, 1995) proposed the seismic coherence data method in 1995, there have been many years of development and research into fracture and fault detection techniques. Amoco company applied the seismic coherence technology to the fault system detection of seismic data and saw positive results. Marfurt et al. (1998) (Marfurt et al., 1999; Satinder and Marfurt, 2008) introduced the second generation coherent volume algorithm in 1998, which can represent faults better than the first generation coherent algorithm, based on the similarity algorithm; To achieve the correlation between multi-channel seismic data, Gersztenkorn and Marfurt, 1999 introduced the third generation coherence algorithm based on the intrinsic structure and covariance matrix in 1999; The third generation coherent algorithm expands the technique to three-dimensional seismic data volume without horizon limits and enhances the vertical and horizontal resolution of seismic data compared to the first and second generations of coherent algorithms. It is unable to adequately describe the numerous small faults and secondary fractures, though. Wang et al. (2002) integrated the wavelet transforms and a coherent method. Although this method has a higher resolution than a conventional coherent algorithm, the way it depicts small fractures is still not perfect. Dorigo et al. (1996) introduced an ant tracking system based on the ant colony algorithm in 1999. This system mimics the pheromones generated by ants foraging barriers to track faults and fractures. Ant tracking technology is currently acknowledged as a technology that can accurately show faults and fractures. However, in practical uses, the ant tracking system still has drawbacks, such as the accuracy with which micro fractures caused by large faults are carved.
In order to reflect the geological information that cannot be highlighted in full band seismic data, Partyka et al. (1999) proposed the spectrum decomposition technology in 1999. This technique decomposed the full band seismic data volume into a single frequency data volume. Utilizing spectrum decomposition technology, Zeng et al. (2009) acquired seismic data volumes at various frequencies in 2009. The findings indicate that single frequency seismic data volumes are more detailed and can more clearly portray the spatial extent of subterranean aberrant bodies than full band data volumes. All of the aforementioned academics have significantly influenced how data are interpreted in the frequency domain.
Daubechies et al. (2011) squeezed and rearranged the spectrum values after wavelet transform in the time-frequency domain, and proposed a synchronous squeezing algorithm to improve the time-frequency focusing ability. In order to get a result with a greater resolution than that of the short-time Fourier transform, Yu et al. (2017) extended the window function of the short-time Fourier transform in 2017. However, the precision of time-frequency analysis will still be severely constrained by the Heisenberg principle’s restriction and the cross-terms’ interference.
Therefore, according to the principle of the synchronous extrusion algorithm, the synchronous extrusion improvement of short-time Fourier transform is developed through the time-frequency spectrum extrusion rearrangement after the improved short-time Fourier transform. The theoretical signal shows that this method has higher time-frequency resolution than the traditional time-frequency analysis method.
Combined with the research results of previous scholars (L Barabási and Albert, 1999; Bonnet et al., 2001; Bour et al., 2002; Davy et al., 2010; Bahorich and Farmer, 1995; Satinder and Marfurt, 2008; Marfurt et al., 1999; Marfurt et al., 1998; Gersztenkorn and Marfurt, 1999; Wang et al., 2002; Dorigo et al., 1996; Partyka et al., 1999; Zeng et al., 2009; Daubechies et al., 2011; Yu et al., 2017), this paper uses the advantage of synchronous extrusion improvement of short-time Fourier transform in time-frequency focusing to perform spectral decomposition on the three-dimensional seismic data volume of a site to obtain the single frequency data volume; Then the ant tracking technique is applied to calculate the single frequency data volume. At the same time, an advanced DFN model is established based on the obtained data volume. The results show that this method can give a fine outline of micro fractures, and can better reflect the characteristics of fractures in different scales, including structure and related properties. The results proved its accuracy and feasibility in practical application.
Method and principle of fourier transform
Fourier transform can be regarded as the originator of time-frequency analysis, but it cannot describe non-stationary signals well; In reality, signals are almost non-stationary signals, especially seismic signals. Fourier transform has long been unable to meet people’s requirements for accuracy. The short-time Fourier transform truncates the non-stationary signal by adding a window function, and divides the whole non-stationary signal into several small segments. At this time, each segment of the signal in the window function can be regarded as a stationary signal, and then Fourier transform each small segment of signal to obtain a two-dimensional time-frequency spectrum.
Assuming the signal
Where:
Discretize Eq. 2 to obtain the expression of discrete Fourier transform
Improved short-time fourier transform
Because the time window of short-time Fourier transform cannot be changed, this method is limited to improve the time-frequency focusing. In order to overcome this defect, we must improve the time window function. From Eq. 2, the complex conjugate of signal and window function can be obtained:
Where:
Let
Where:
If we put the window function
The expression for the original
Improved short time fourier transform by synchronous extrusion
According to the improved formula for the short time Fourier transform, first of all, calculating the derivative of
Then the instantaneous frequency expression of the signal can be obtained:
According to the instantaneous frequency obtained from Eq. 9, the improved short-time Fourier transform for synchronous extrusion can be obtained. The
Where:
The improved short time Fourier transform is to extrude and rearrange the time and frequency spectrum of the improved short time Fourier transform in the time and frequency domain, so as to improve the time and frequency focusing of the signal.
Model validation
In this section, the model test of the synthetic narrowband signal is carried out. The original signal
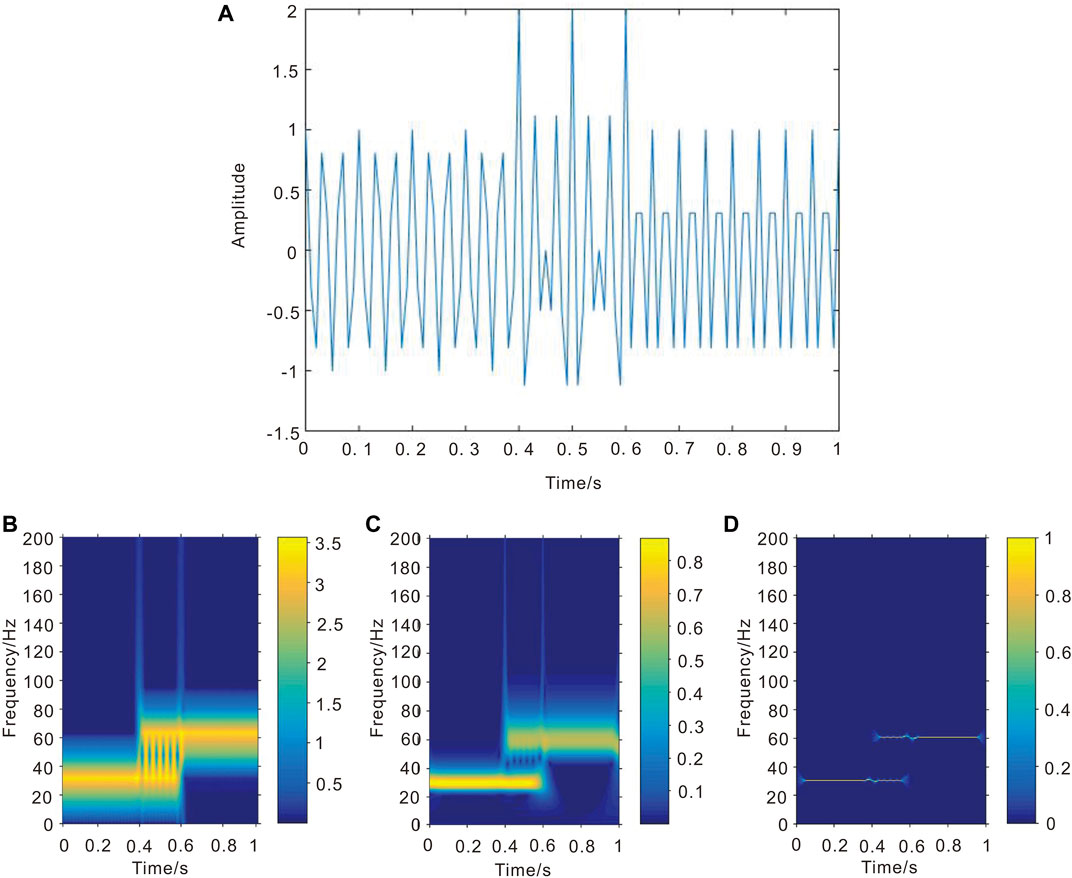
FIGURE 1. Results of time-frequency analysis of non-noisy narrowband signals (A) The original signal
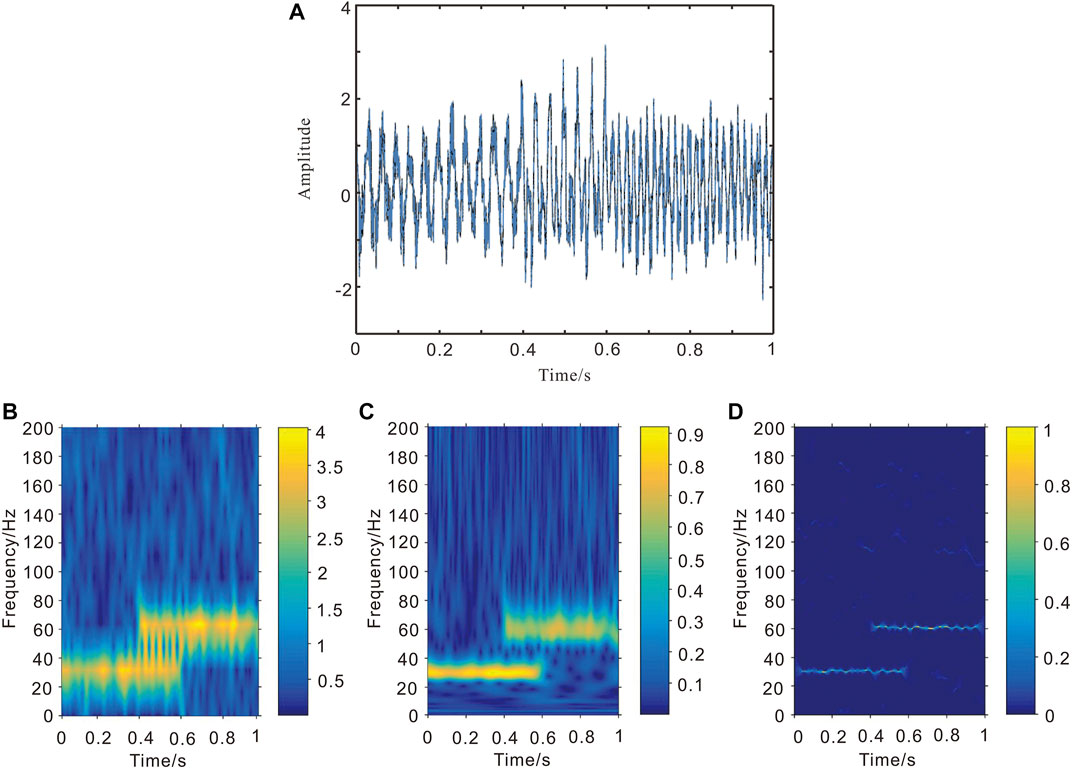
FIGURE 2. Results of time-frequency analysis of noisy narrowband signal (A) Noised signal (B) STFT (C) GSTFT (D) SSTFT.
The time-frequency spectrum as shown in Figures 1B–D is obtained by performing the short-time Fourier transform (STFT), the improved Short-time Fourier transform (GSTFT) and the improved synchronous extrusion Short-time Fourier transform (SSTFT) on the simulation signal
Noise resistance
According to the principle of SSTFT, we can know that SSTFT algorithm has certain anti-noise performance. Random white Gaussian noise with a mean of 0 and a variance of 0.5 (Figure 2A) is added to the simulation signal
Figure 2B shows the time spectrum of the noisy signal after STFT, and Figure 2C is a time spectrogram after GSTFT. By comparing STFT and GSTFT, it can be seen that STFT is very sensitive to noise, and the time spectrum of the signal is greatly affected by noise and is relatively fuzzy. Compared with STFT, the time-frequency tuning of GSTFT is almost unaffected, but it is still unable to completely eliminate the influence of noise on the time spectrum of signal; GSTFT has a certain immunity to noise, but due to the limitation of Heisenberg uncertainty principle and the influence of cross terms, the time-frequency resolution of GSTFT is low, while the time-frequency resolution of SSTFT is significantly higher than STFT and GSTFT, and SSTFT can effectively suppress noise interference, as shown in Figure 2D. Therefore, SSTFT has a certain degree of noise control.
Ant tracking technology
Ant tracking technology is developed on the basis of ant colony algorithm. It simulates the pheromone released by ant foraging to guide other ants to track. It has a very strong ability to identify fracture information. However, for many associated folds and secondary fractures, ant tracking based on original data cannot effectively describe them. In order to avoid damaging the vertical and horizontal resolution of the actual seismic data, the actual seismic data processing requires high time-frequency resolution. The traditional time-frequency analysis methods, such as short-time Fourier transform, S-transform, WVD, etc., are restricted by their own window function, so the time-frequency resolution cannot reach the best, and even produce a lot of false information; In particular, WVD method will produce unexpected cross terms in calculation, resulting in great errors in the results. The synchronous extrusion algorithm makes use of the advantages of suppressing Heisenberg uncertainty and the influence of cross terms to make the results have high resolution, which has been well verified in practical applications.
Based on this, this research employs distinct frequency information to carve the fault system of the seismic data by combining ant tracking technology with the synchronous extrusion improvement of short time Fourier transform in time-frequency analysis. The following are the primary operational steps (Figure 3):
1) The synchronous extrusion improvement of short time Fourier transform is used to decompose the frequency spectrum of three-dimensional seismic data, yielding data at low, medium, and high frequencies, respectively.
2) Execute edge detection and edge enhancement for single frequency data volumes, including extracting variance, chaos, coherence, and curvature attributes; These attribute volumes are smoothed and enhanced to highlight the data volumes’ discontinuities.
3) The aforesaid attribute body is then subjected to the ant tracking technology to produce a single frequency ant attribute body.
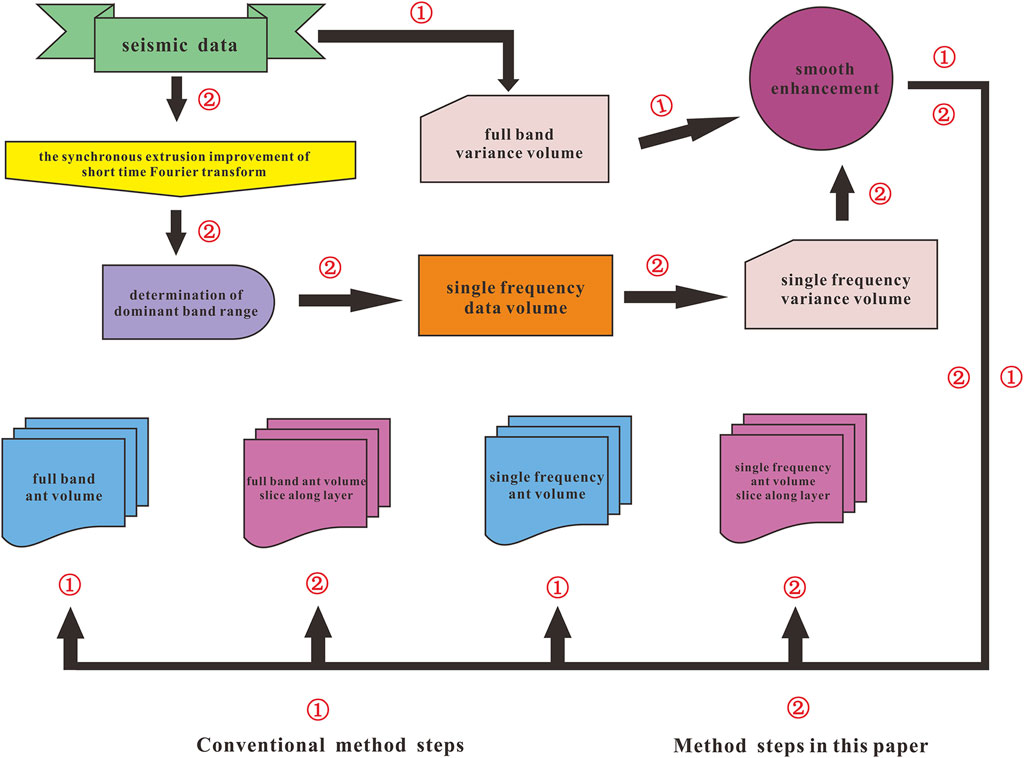
FIGURE 3. Improved ant tracing process framework of short-time Fourier transform based on synchronous extrusion. ① Conventional method steps. ② Method steps in this paper.
Advanced DFN model
In industrial production, such as the deep storage of nuclear waste, the exploitation of unconventional oil and gas, the development of geothermal resources, and so forth, the study of fractured systems is extensively applied. Research on fractures is frequently crucial to the in-depth study of these domains, as fractures are one of the major variables influencing both the mechanical characteristics of rocks and the properties of how fluids flow through them. In subsurface rocks, complex fracture networks frequently occur as a result of the evolution of fractures and their interaction after they form. As was already indicated, substantial study has demonstrated that complex fracture networks in subsurface rocks frequently exhibit the traditional traits of a complex system with a power-law scale relationship.
The DFN model can define the fracture density according to the variable fracture size and direction, and form a statistical model. In the modeling process, different data can be extracted from different scales, geometric characteristics and dimensions (1D and 2D). The problem of data extraction in the modeling process can be solved by merging these available data. Based on the DFN scaling model, the fracture characteristics from wellbore scale (centimeters) to reservoir scale (kilometers) are defined through stereological rules and assumptions. Furthermore, an improved DFN model is established by considering the mechanical characteristics of the interaction between fractures. The improved DFN model can be calibrated with several simple parameters according to various rock attributes, and can better restore the shape and characteristics of fractures.
At present, it is generally believed that the fault system is often defined according to the statistical law, especially the observation and research of local interpolation within the site scale. The accurate study of these statistical distribution laws is the key to establish the discrete fracture network model.
DFN model characterization parameters
The discrete fracture network model reveals the relevant statistical laws of the size, direction and spatial distribution of fractures in a certain range. The core of DFN model is its density distribution law
Although the three-dimensional fracture network model composed of two-dimensional structure can be established, in terms of dimension and size, especially dimension, such as two-dimensional surface of field outcrop and tunnel, one-dimensional line of borehole, data acquisition is often limited, involving stereology and scale problems. Stereology rules are often determined by the established model, while the scale function is usually determined by
Among them, the density function is
Davy et al. (2013) showed that when the DFN model is a two power-law model with
From Eq. 13,
Under such conditions, if the mass density of the model is defined as the total fracture surface per unit volume, the mass density of the model can be written as the following expression:
In the above formula, considering all fracture length scales, the DFN model density
Generally, fracture sampling can be carried out through core observation, surface mapping, tunnel wall mapping and other methods. Building stereological relationship can better change and transform DFN model.
Stereology for cores
In (Davy et al., 2006), the sampling of fractures larger than the core in the wellbore is described in detail. Considering the fractures intersecting with the core, the three-dimensional relationship between DFN model and core related data is established. Based on the classical Terzaghi correction in the power-law model (Terzaghi, 1965), the three-dimensional relationship established further explains the finite size effect. If the length of the core sample is
The last two terms
Application examples
Based on the above contents, in the 3D seismic fault interpretation, this paper combines the ant tracking technology with the advantages of synchronous extrusion improvement of short-time Fourier transform in time-frequency analysis, and uses different frequency information to carve the fault system of seismic data, as shown in the Figure 4.
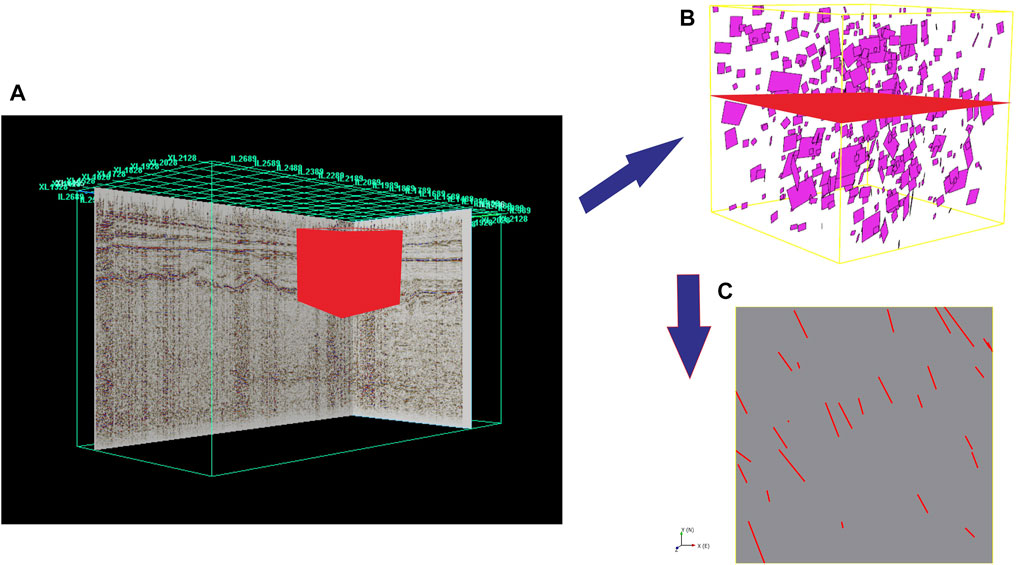
FIGURE 4. Ant fracture identification based on synchronous extrusion improvement of short-time Fourier transform (A) 3D seismic data volume of a site (B) Visualized extracted ant volume (C) Visual interception of a fracture plane.
The data used in this paper belongs to the 3D seismic data volume of a site. Spectrum decomposition technology first needs to determine the size of the frequency value, which directly determines whether the effective information in the single frequency profile can be accurately depicted; Therefore, the selection of frequency value occupies a very important position in the whole process. In this paper, the actual seismic data are processed by time-frequency transform. By determining the dominant frequency band range of the seismic data, the size of the frequency value can be selected to highlight the required effective information of the seismic data.
In this paper, 30 and 60 Hz are selected as the frequency values of the single frequency data volume within the dominant frequency band of the site, and then the edge of the single frequency data volume is enhanced to calculate the single frequency of the ant. The specific steps have been described in Chapter 1.5 above.
In the dominant frequency band range, as shown in Figure 5, after the above steps, the geological information in the coherent attribute profile obtained by method of this paper will be different from that obtained by conventional methods, which can be obviously obtained in the calibration area of Figure 5. In the coherent attribute profile obtained by traditional methods, larger scale faults can be identified, as shown in Figure 5A; In the profile of this method, not only the overall distribution characteristics of faults, but also micro fractures and fracture development areas can be seen, as shown in Figure 5B.
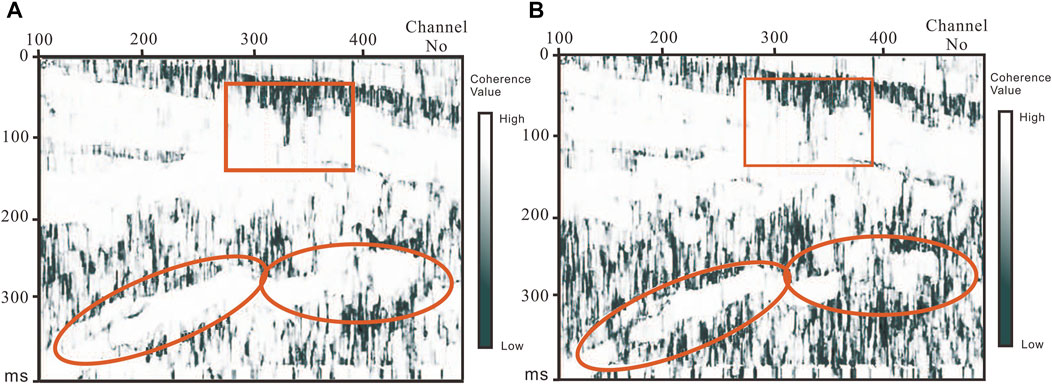
FIGURE 5. Slice of single frequency coherent attributes along layers (A) Results from conventional methods (B) Results obtained by this paper.
The slice along the layer is extracted from the single frequency coherent data volume, and the result is shown in Figure 6. Figure 6A is a coherent slice obtained by conventional methods, which is more sensitive to the information of large fractures, as shown in the calibration area; As shown in Figure 6B, the method in this paper can not only highlight micro fractures, but also identify associated fracture development areas, reflecting more abundant information.
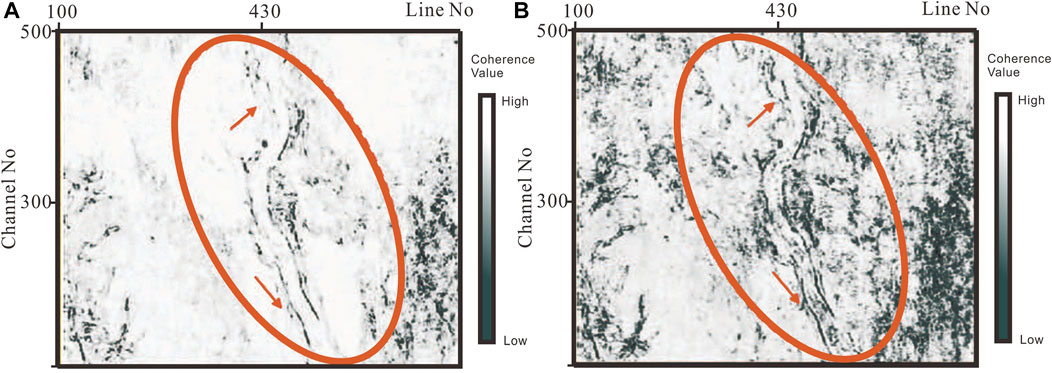
FIGURE 6. Single frequency coherent attribute profile (A) Results from conventional methods (B) Results obtained by this paper.
Figure 7A shows the original amplitude slice along the layer, Figure 7B shows the full band ant slice along the layer, Figure 7C,D respectively show the 30 and 60 Hz single frequency ant slice along the layer. In the single frequency ant, micro fracture information is well carved. Both the 30 Hz single frequency ant and the full band ant describe the large fracture information in detail, while relatively high frequency 60 Hz ant clearly depicts micro fracture information. Full band ant can clearly depict large faults; In the single frequency ant, with the increase of frequency, some subtle fracture information in the profile is highlighted; However, with the increase of frequency, the noise information will also be amplified. Therefore, some interference information such as collected footprints will appear in the high-frequency profile; However, the single frequency ant technique can identify the small fractures that cannot be characterized by the full frequency band ant, and has high practical value. In combination with the above, the medium and high frequency ant obtained based on the synchronous extrusion short-time Fourier transform have a strong ability to depict the micro fracture information, and the low-frequency ant bodies can engrave the large faults in detail.
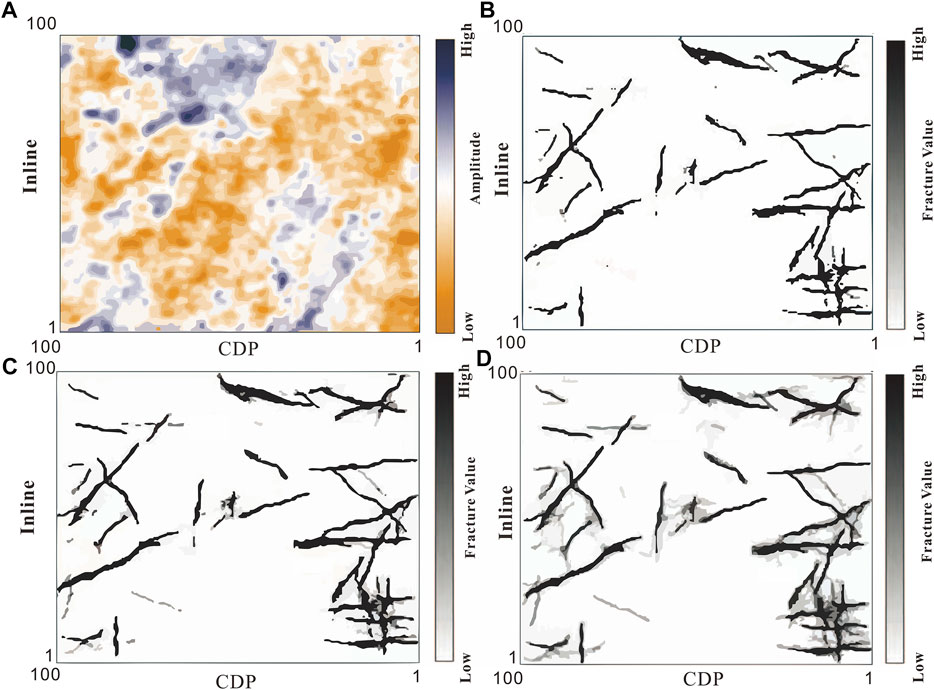
FIGURE 7. Ant slice along the layer (A) Amplitude slice along the layer (B) Full-band ant slice along the layer. (C) 30 Hz ant slice along the layer. (D) 60 Hz ant slice along the layer.
Combined with the advanced DFN model, the extracted data are calibrated in the model to restore the fracture morphology and characteristics. The results show that the complexity of fracture system often presents the classical characteristics of complex system with power-law scale relationship, as shown in the Figure 8. The blue trace line in the figure represents the information with smaller scale such as fractures, while the red trace line represents the features with larger scale such as faults. At the same time, it is normalized according to the advanced DFN model, and the overall fractal dimension of the model in the figure is obtained, which is represented by a black trace line. The results prove the accuracy and practicability of the method in practical application.
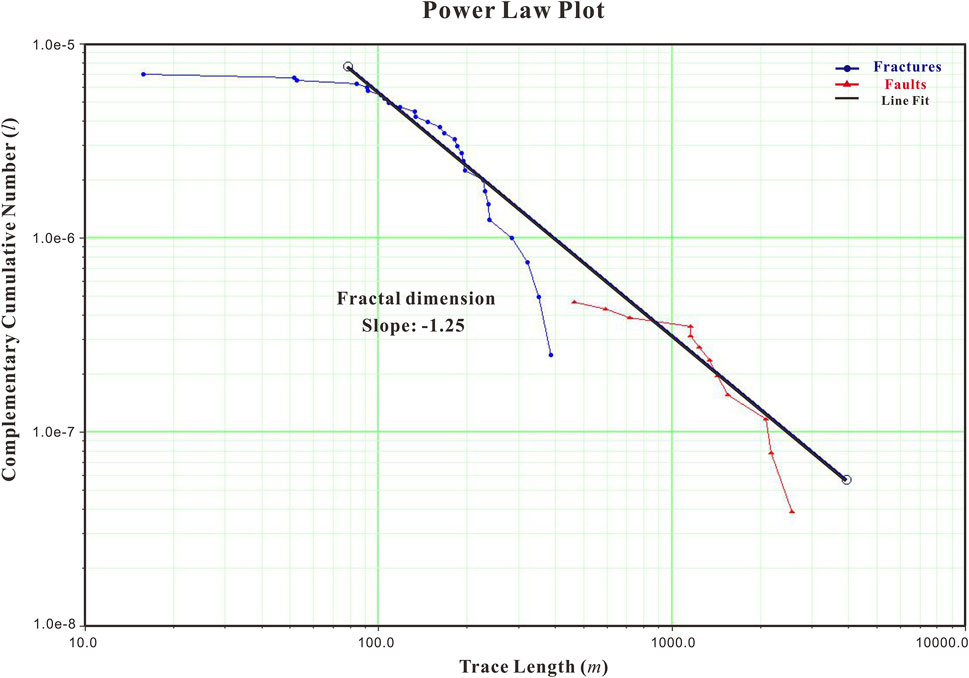
FIGURE 8. Distribution law of fracture system with different scales based on model.
The method in this paper is related to the geological research of relevant work sites. As shown in Figure 9, the base map is the contour map of gas content in the work site, and the arrow direction is the growth trend of micro fracture development areas obtained by this paper. It can be clearly and intuitively concluded from Figure 9 that the more microfractures are developed, the higher the gas content is. The correlation between the two is significant, which is of great significance for oil and gas prediction and exploration. The result also shows the feasibility and importance of the method in this paper.
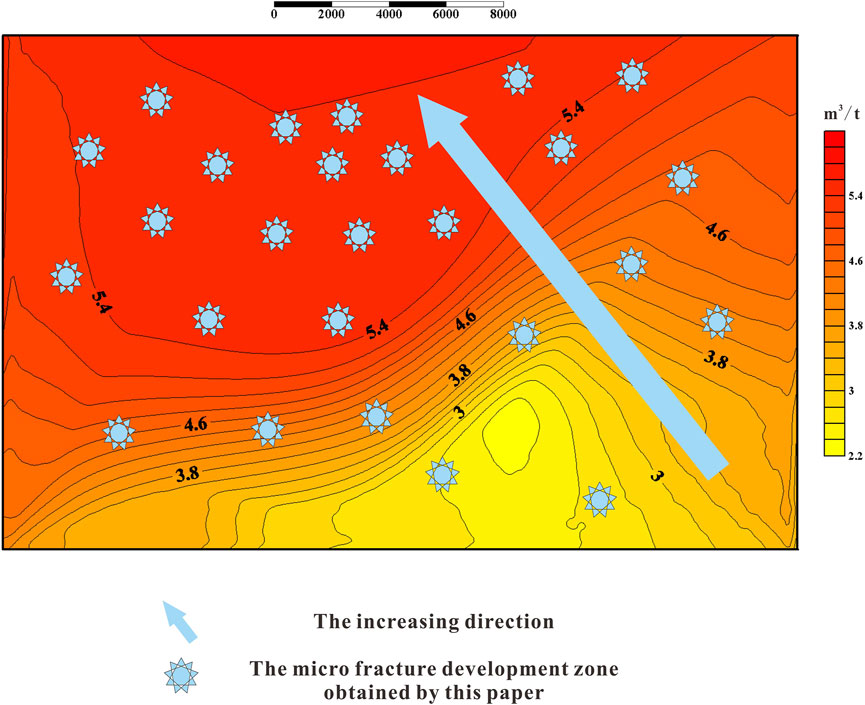
FIGURE 9. Microfracture development area and its growth trend. And gas content contour map.
Conclusion
In this paper, the frequency spectrum of seismic data is decomposed by using the synchronous extrusion improvement of short time Fourier transform, which can effectively suppress the influence of noise, and provide a data volume with high signal-to-noise ratio for the subsequent ant calculation; Moreover, the high frequency ant data volume can depict the micro faults and associated folds that the full band ant cannot depict; Especially in the fracture development zone, this method can accurately carve its distribution area and characteristics. Combined with the advanced DFN model, the extracted data are calibrated in various rock attributes, and the power function analysis is carried out by using the fracture trace map data of different scales, and the normalization processing is carried out to determine the fracture size distribution parameters, which is the key to reflect the characteristics of fractures under different scales, including the structure and its related properties, in the process of geological and engineering modeling. In this paper, the information obtained by this method provides a practical basis for subsequent reservoir production prediction and well location determination.
Data availability statement
The raw data supporting the conclusion of this article will be made available by the authors, without undue reservation.
Author contributions
ZF: Investigation, conceptualization, methodology, data curation, writing—original draft preparation, visualization, writing. SL: Conceptualization, methodology, supervision, writing—reviewing and editing HW: Methodology, writing—reviewing and editing.
Conflict of interest
The authors declare that the research was conducted in the absence of any commercial or financial relationships that could be construed as a potential conflict of interest.
Publisher’s note
All claims expressed in this article are solely those of the authors and do not necessarily represent those of their affiliated organizations, or those of the publisher, the editors and the reviewers. Any product that may be evaluated in this article, or claim that may be made by its manufacturer, is not guaranteed or endorsed by the publisher.
References
Bahorich, M., and Farmer, S. (1995). 3D seismic discontinuity for faults and stratigraphic features: The coherence cube. Lead. Edge 14, 1053–1058. doi:10.1190/1.1437077
Bonnet, E., Bour, O., Odling, N., Davy, P., Main, I., Cowie, P., et al. (2001). Scaling of fracture systems in geological media. Rev. Geophys. 39, 347–383. doi:10.1029/1999rg000074
Bour, O., Davy, P., Darcel, C., and Odling, N. (2002). A statistical scaling model for fracture network geometry, with validation on a multi-scale mapping of a joint network (Hornelen Basin Norway). J. Geophys. Res. 107, 2113. doi:10.1029/2001jb000176
Daubechies, I., Lu, J., and Wu, H. T. (2011). Synchro squeezed wavelet transforms: An empirical mode decomposition-like tool. Appl. Comput. Harmon. Anal. 30 (2), 243–261. doi:10.1016/j.acha.2010.08.002
Davy, P., Darcel, C., Bour, O., Munier, R., and De Dreuzy, J-R. (2006). A note on the angular correction applied to fracture intensity profiles along drill core. J. Geophys. Res. 111, B11408. doi:10.1029/2005jb004121
Davy, P., Le Goc, R., and Darcel, C. (2013). A model of fracture nucleation, growth and arrest, and consequences for fracture density and scaling. JGR. Solid Earth 118, 1393–1407. doi:10.1002/jgrb.50120
Davy, P., Le Goc, R., Darcel, C., Bour, O., de Dreuzy, J-R., and Munier, R. (2010). A likely-universal model of fracture scaling and its consequence for crustal hydro-mechanics. J. Geophys. Res. 115, B10411. doi:10.1029/2009jb007043
Dorigo, M., Maniezzo, V., and Colorni, A. (1996). Ant system: Optimization by a colony of cooperating agents. IEEE Trans. Syst. Man. Cybern. B 26 (1), 29–41. doi:10.1109/3477.484436
Gersztenkorn, A., and Marfurt, K. J. (1999). Eigenstructure-based coherence computations as an aid to 3-D structural and stratigraphic mapping. Geophysics 64 (5), 1468–1479. doi:10.1190/1.1444651
L Barabási, A., and Albert, R. (1999). Emergence of scaling in random networks. Science 286, 509–512. doi:10.1126/science.286.5439.509
Marfurt, K. J., Scheet, R. M., Sharp, J. A., and Harper, M. G. (1998). Suppression of the acquisition footprint for seismic sequence attribute mapping. Geophysics 63 (3), 1024–1035. doi:10.1190/1.1444380
Marfurt, K. J., Sudhakar, V., Gersztenkorn, A., Crawford, K. D., and Nissen, S. E. (1999). Coherency calculations in the presence of structural dip. Geophysics 64 (1), 104–111. doi:10.1190/1.1444508
Partyka, G., Gridley, J., and Lopez, J. (1999). Interpretational applications of spectral decomposition in reservoir characterization. Tulsa, OK: Leading Edge.
Satinder, C., and Marfurt, K. J. (2008). Seismic attributes for prospect identification and reservoir characterization. Tulsa, OK: SeEG Geophysical Developments Series No 11.
Terzaghi, R. D. (1965). Sources of error in joint surveys. Geotechnique 15, 287–304. doi:10.1680/geot.1965.15.3.287
Wang, X. W., Yang, K. Q., Liu, Q. X., et al. (2002). Application of seismic coherence algorithm based on wavelet transform. Oil Geophys. Prospect. 37 (4), 328. doi:10.3321/j.issn:1000-7210.2002.04.005
Yu, G., Yu, M., and Xu, C. (2017). Synchro extracting, transform. IEEE Trans. Ind. Electron. 64 (10), 8042–8054. doi:10.1109/tie.2017.2696503
Keywords: micro fractures, SSTFT, advanced DFN, fracture identification and characterization, oil and gas exploration
Citation: Fu Z, Lu S and Wang H (2023) A new method for identifying micro fractures and characterizing fractures of different scales. Front. Earth Sci. 10:1018106. doi: 10.3389/feart.2022.1018106
Received: 12 August 2022; Accepted: 31 October 2022;
Published: 16 January 2023.
Edited by:
Saulo Oliveira, Federal University of Paraná, BrazilReviewed by:
Sadegh Karimpouli, University of Zanjan, IranMelouah Oualid, University of Ouargla, Algeria
Copyright © 2023 Fu, Lu and Wang. This is an open-access article distributed under the terms of the Creative Commons Attribution License (CC BY). The use, distribution or reproduction in other forums is permitted, provided the original author(s) and the copyright owner(s) are credited and that the original publication in this journal is cited, in accordance with accepted academic practice. No use, distribution or reproduction is permitted which does not comply with these terms.
*Correspondence: Shuangfang Lu, bHVzaHVhbmdmYW5nQHVwYy5lZHUuY24mI3gwMjAwYTs=