 Hikaru Iwamori
 Masaki Yoshida
 Hitomi Nakamura
- 1Earthquake Research Institute, The University of Tokyo, Bunkyo-ku, Tokyo, Japan
- 2Volcanoes and Earth’s Interior Research Center, Research Institute for Marine Geodynamics, Japan Agency for Marine-Earth Science and Technology (JAMSTEC), Yokosuka, Japan
- 3Geological Survey of Japan, National Institute of Advanced Industrial Science and Technology (AIST), Tsukuba, Japan
Geochemical and geophysical observations for large-scale structures in the Earth’s interior, particularly horizontal variations of long wavelengths such as degree-1 and degree-2 structures, are reviewed with special attention to the cause of hemispherical mantle structure. Seismic velocity, electrical conductivity, and basalt geochemistry are used for mapping the large-scale structures to discuss thermal and compositional heterogeneities and their relations to dynamics of the Earth’s interior. Seismic velocity structure is the major source of information on the Earth’s interior and provides the best spatial resolution, while electrical conductivity is sensitive to water/hydrogen contents. The composition of young basalts reflects the mantle composition, and the formation age of large-scale structures can be inferred based on the radiogenic isotopes. Thus, these different research disciplines and methods complement each other and can be combined to more concretely constrain the structures and their origins. This paper aims to integrate observations from these different approaches to obtain a better understanding of geodynamics. Together with numerical modeling results of convection in the mantle and the core, “top-down hemispherical dynamics” model of the crust-mantle-core system is examined. The results suggest that a top-down link between the supercontinents, mantle geochemical hemisphere, and inner core seismic velocity hemisphere played an essential role in formation of the large-scale structures and dynamics of the Earth’s interior.
1 Introduction
Among the rocky planets of the solar system, the Earth is an active planet characterized by surface liquid water, continental crust containing granite, a strong self-excited magnetic field, and life, associated with active earthquakes, volcanism, plate motions, and continental drift. Because of mantle convection, including plate divergence, convergence, and subduction, the Earth undergoes intense material-energy circulation between the surface and the interior, bringing a variety of materials into the mantle, including volatile components such as near-surface water, organic materials, and crustal materials. As a result of such circulation, material and thermal heterogeneities are created in the mantle. These heterogeneities reflect the flow pattern and mode of mantle convection. At the same time, the heterogeneities with density variations drive mantle convection, causing non-linear interactions between the heterogeneities and convection.
Therefore, capturing heterogeneities with respect to the material and thermal structure is essential for understanding the dynamics of the Earth’s interior. However, even the large-scale structure of the mantle and the corresponding dynamics behind it are poorly constrained at present, and they need to revealed by combining knowledge from different research disciplines, including geology, geophysics, geochemistry, materials science, and computer science (e.g., Hofmann, 1997; Tackley, 2000; Schubert et al., 2001; Nakagawa et al., 2010; Coltice et al., 2017). For example, in the vertical direction, two-layer mantle convection divided into an upper and lower mantle with different compositions (e.g., Jacobsen and Wasserburg, 1979; OʼNions et al., 1979), and whole-mantle convection with stratified or zoned mantle model (Hofmann and White, 1982; Tackley, 2008; Albarède, 2009), such as material piles of different compositions deep in the mantle (Christensen and Hofmann, 1994; Kellogg et al., 1999), or their hybrid models involving temporal evolution through the Earth’s history (e.g., Allègre, 1997) have been proposed based on different observations and theories.
For the large-scale horizontal structures, seismic studies have revealed that large low (shear wave) velocity provinces (LLSVPs or LLVPs) near the lowest part of the mantle beneath the Pacific Ocean and South Africa (e.g., Lay and Garnero, 2007; Takeuchi, 2007; Ritsema et al., 2011; Garnero et al., 2016) exhibits a degree-2 spatial pattern, while the presence of degree-1 hemispheric structures has been reported in the inner core (Tanaka and Hamaguchi, 1997; Creager, 1999; Sumita and Bergman, 2015, and the references therein). In addition, geochemical studies on basalts erupted at the surface provide direct compositional information on the Earth’s interior, which indicate presence of large-scale structures such as “Dupal Anomaly” (Dupré and Allègre, 1983; Hart, 1984) and the east-west hemispheric structure in terms of basalt isotopic compositions (Iwamori and Nakamura, 2012; Iwamori and Nakamura, 2015), while chaotic well-stirred depictions have been proposed (Zindler et al., 1984).
In this paper, we review and compare spatial structures of long wavelengths in the Earth’s interior as captured by different approaches in geophysics, geochemistry, petrology, and geology, and discuss their interrelationships based on mantle convection simulations. It is necessary to integrate information from different and complementary approaches to more rigorously constrain the structures and their origin. For example, constraints from seismic observations and geochemical-petrological observations are independent and complementary in the following respects: Seismic tomography provides high-resolution spatial variation of seismic wave velocities to infer three-dimensional structures. However, it does not provide direct information on the material composition and formation mechanism of the structures. On the other hand, composition of magma, especially young basalts, erupted on the surface directly reflects the material composition of the mantle, and may work as “geochemical probe.” Based on the isotope ratios of radiogenic decay sources and abundance ratios of parent-daughter elements in the magma, it is possible to estimate how the mantle source has experienced material differentiation, including the time elapsed since the differentiation. However, the spatial resolution of such geochemical probe is not as high as seismic tomography, particularly for the depth resolution. Therefore, “seismic tomography” and “geochemical probe” approaches are complementary, and it is expected that the combination of the two as well as other approaches will provide a more reliable picture of the material cycling and dynamics of the Earth’s interior.
In the following sections, we first review observations on large-scale structures in terms of seismic velocity, electrical conductivity, and basalt geochemistry. Then we present a synthesis of these observations and numerical simulations to discuss the dynamics of the crust-mantle-core system.
2 Large-scale structures
2.1 Seismic structure of the mantle
Seismic velocity structure is the major source of information on the structure of the Earth’s interior. Although the spatial coverage of seismic tomography is constrained by the distribution of seismic stations and epicenters and therefore spatially biased in resolution, global models have been proposed by combining various seismic waves. For example, Ritsema et al. (2011) developed a shear-wave velocity model S40RTS in Earth’s mantle using Rayleigh wave phase velocity, teleseismic body-wave traveltime and normal-mode splitting function measurements, which provide complementary constraints on the shear-velocity structure of the mantle. Figure 1 shows the model S40RTS of shear-velocity variation in Earth’s mantle, in which the velocity perturbations were parametrized by spherical harmonics up to degree 40 and by 21 vertical spline functions.
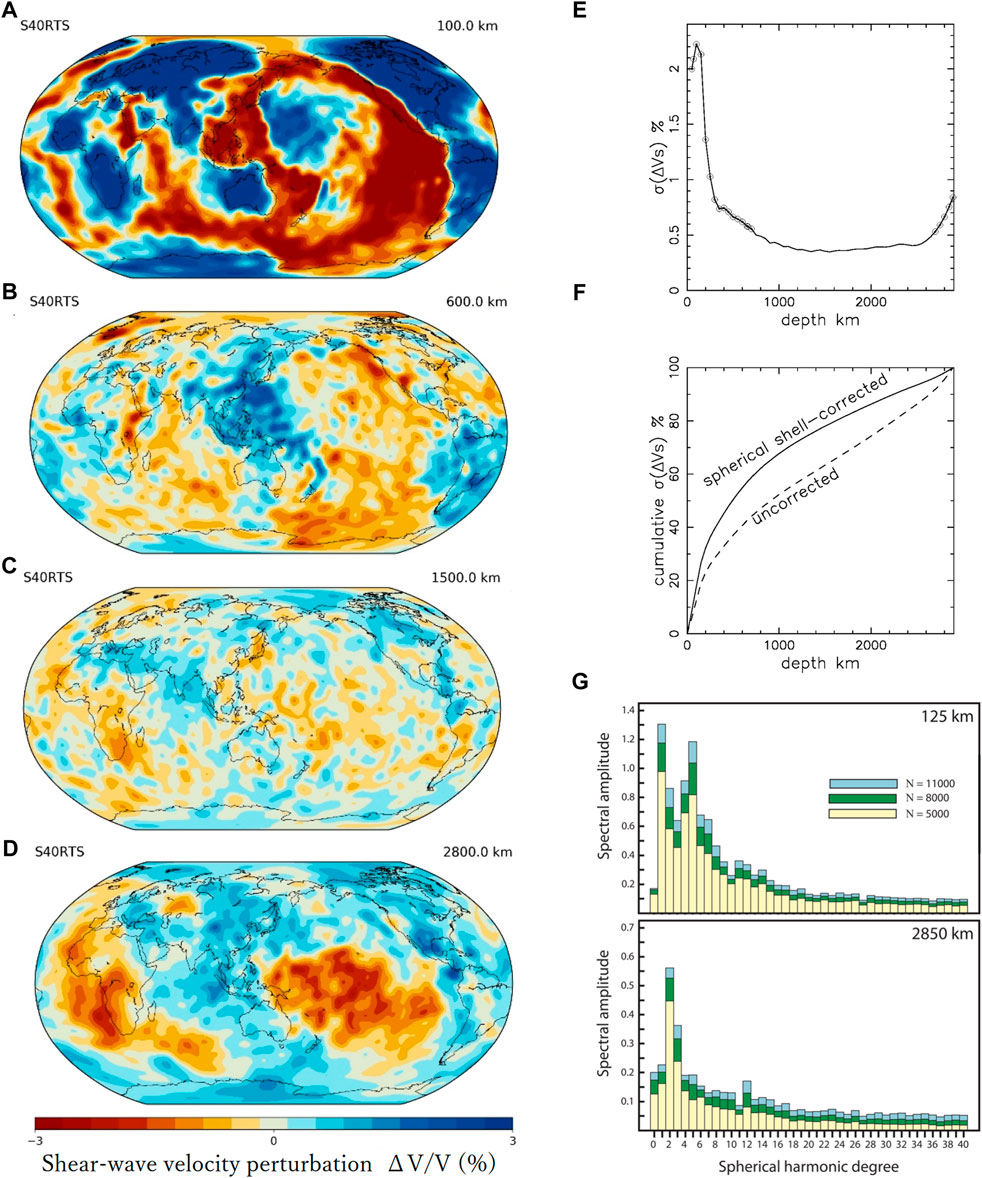
FIGURE 1. Seismic velocity structure of the Earth’s mantle, after the model S40RTS (Ritsema et al., 2011). (A)–(D) Maps of shear-wave velocity perturbation (ΔV/V in percent) with the same scale from -3 to +3% at (A) 100 km, (B) 600km, (C) 1,500 km, and (D) 2,800 km depth. (E) depth-profile of the shear-wave velocity variation as expressed by the standard deviation in ΔV/V, where circles indicate the standard deviation greater than 0.5%. (F) cumulative standard deviation integrated from the surface to CMB, where the dashed line is simply integrated with depth, and the solid line is multiplied by the spherical area at each depth to reflect differences in spherical shell volume. (G) Spectral amplitude at 125 km and 2,850 km depth (after Figure 7 of Ritsema et al., 2011) for the effective number of unknowns N from 5,000 to 11,000. A smaller N indicates a greater damping.
Based on the model S40RTS, we plot the perturbations for several different depths with the same scale of dVs/Vs. (−3 to 3 percent) so that the amplitude variations with depths can be readily recognized. Figure 1A shows that the velocity variability is large for the near-surface region (e.g., −6.7 ∼ +6.1% at 100 km depth), small for the mid mantle (−1.2 ∼ +1.3% at 1,500 km, Figure 1C), and intermediate for the region near the core-mantle boundary (CMB) (−3.1 ∼ +2.7% at CMB, Figure 1D).
In addition to the above-mentioned values of minimum and maximum, the lateral variation of the seismic velocity can be expressed by the standard deviation. Figure 1E shows that the standard deviation in ΔV/V exceeds 2% in the shallow part of the mantle (≦200 km depth), 0.4% on average in the mid mantle (700–2,700 km depth), and 0.8% at CMB. In Figure 1E, the depth points where the standard deviation exceed 0.5% are circled. Such relatively high-contrast regions are 1) <700 km depth in the shallow mantle (0.5–2.2%) and 2) >2,700 km in the bottom of the mantle (0.5–0.8%). Figure 1F shows the standard deviation integrated from the surface to CMB. The dashed line is simply integrated with depth, and the solid line is multiplied by the spherical area at each depth to reflect differences in spherical shell volume. From the surface to 700 km depth in the shallow mantle, about 60% of the total contrast of in the mantle occurs. On the other hand, only about 4% occurs in the lowest part of the mantle at > 2,700 km depth near CMB. These horizontal velocity variations reflect temperature and density variations, and are important in discussing the driving forces and dynamics of mantle convection.
The spatial distribution of these velocity variations can be represented by the power spectra (Figure 1G). The two regions in the shallow part and the bottom of the mantle with high velocity contrasts exhibit different spectra, with a degree-1 dominant spectrum of a large amplitude near the surface and a degree-2 dominant spectrum of a smaller amplitude near CMB. The degree-2 prominence near CMB can be largely attributed to the presence of LLSVP under the Pacific Ocean and southern Africa to the southern Atlantic (Ritsema et al., 2011).
These large-scale structures have been repeatedly confirmed by different models of seismic tomography (e.g., S362ANI, Kustowski et al., 2008; SAW642AN, Panning and Romanowicz, 2006; SH18CE and SH18CEX, Takeuchi, 2007 and Takeuchi, 2012; HMSL-S, Houser et al., 2008; TX 2008, Simmons et al., 2009; GAP_P4, Obayashi et al., 2013; DETOX, Hosseini et al., 2020). Hosseini et al. (2020) include a very large data set of Pdiff wave (core-diffracted wave), up to the highest possible frequencies, together with teleseismic P and PP waves, and provide a high-resolution image particularly for the depth range >2,400 km. Hosseini et al. (2020) suggested a rather continuous low velocity zone in the lowermost mantle, yet the degree-2 is the most dominant, as well as the dominant degree-1 pattern at relatively shallow mantle (Figure 12 of Hosseini et al., 2020). These long-term extensive efforts on the seismic tomography confirm the large-scale structures in the mantle as described above and as in Figure 1.
2.2 Seismic structure of the core
The most remarkable degree-1 structure in the Earth’s interior is observed for the inner core (Figures 2A, 2B). An east–west hemispherical structure in the inner core has been repeatedly reported in terms of the seismic wave velocity, anisotropy and attenuation, based on several different methods and data sets, including body-wave and normal-mode observations (Tanaka and Hamaguchi, 1997; Creager, 1999; Garcia and Souriau, 2000; Niu and Wen, 2001; Garcia, 2002; Wen and Niu, 2002; Cao and Romanowicz, 2004; Souriau, 2007; Sun and Song, 2008; Deuss et al., 2010; Irving and Deuss, 2011; Waszek and Deuss, 2011; Waszek et al., 2011; Tanaka, 2012; Lythgoe et al., 2014; Iritani et al., 2019). Although the depth extent of the hemispherical structure is not well resolved, it has been well documented that an isotropic eastern hemisphere with fast seismic velocities contrasts with a slower, anisotropic western hemisphere (e.g., Tanaka and Hamaguchi, 1997; Wen and Niu, 2002; Cao and Romanowicz, 2004; Deuss et al., 2010), and these differences have been argued to be present from the near-surface of the inner core to depths of at least several hundreds of kilometers (e.g., Oreshin and Vinnik, 2004; Tanaka, 2012; Lythgoe et al., 2014).
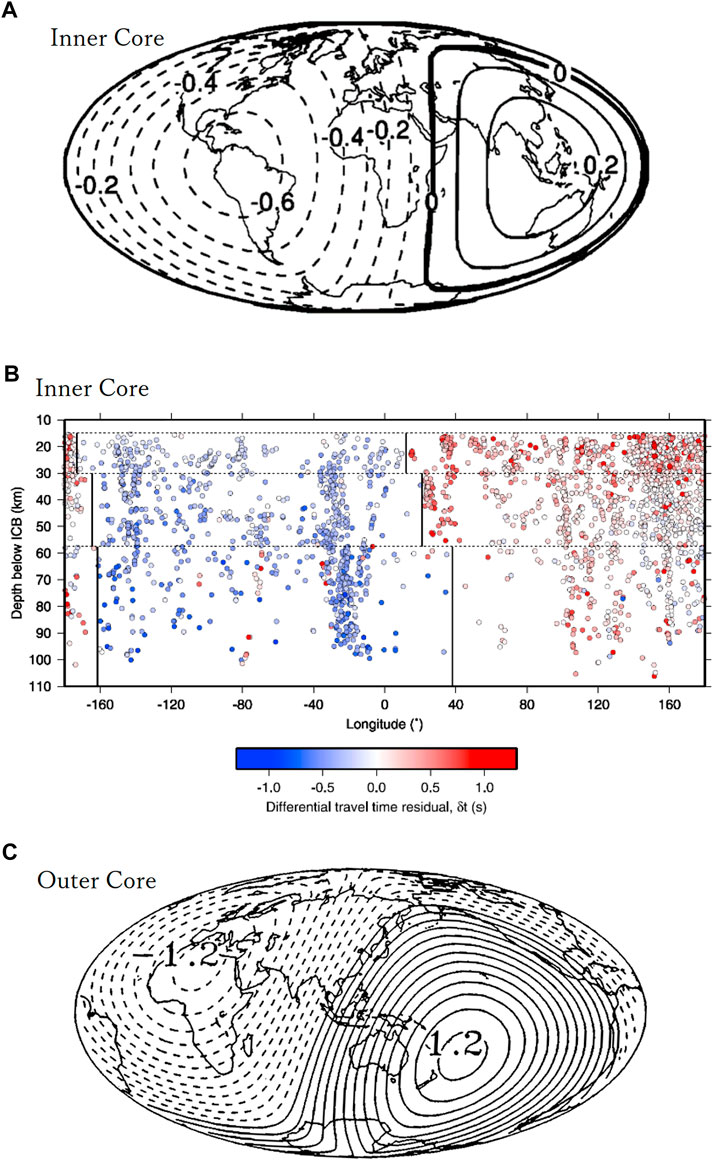
FIGURE 2. (A) Map of the velocity perturbation in the outermost 500 km of the inner core (Tanaka and Hamaguchi, 1997). Solid and dashed lines represent positive and negative values, respectively. The contour interval is 0.1%. (B) PKIKP-PKiKP differential travel time residuals as a function of PKIKP turning point longitude and depth below the inner core boundary (Waszek and Deuss, 2011). (C) The geographical distribution of degree-1 residual (in second) of differential travel times of SKKS-SKS and SKKKS-SKKS for the uppermost outer core (Tanaka and Hamaguchi, 1993).
The study on the PKIKP–PKiKP differential travel time data set with a high spatial resolution (Waszek and Deuss, 2011) highlights the sharp transition from the eastern hemisphere showing a higher velocity to the western hemisphere showing a lower velocity with the differential travel time residuals of approximately 0.5 s on average (Waszek and Deuss, 2011; Waszek et al., 2011). The sharp transition occurs at 10 to 40°E and 180 to 160°W, depending on the three different depth ranges (<30, 30–57.5, 57.5–110 km, Figure 2B). Iritani et al. (2019) employed a waveform inversion approach based on simulated annealing to measure the traveltime and the attenuation parameter of the core phases. An arc-like shape boundary that connects points (0°N, 159°W) on the equator and (79°N, 110°E) in far north with a transition width of ∼600 km best explains the observed differential traveltimes rather than a sharp boundary. Although the exact position and the nature of boundary remain a subject of debate, in any models above, the high velocity eastern hemisphere of the inner core has been confirmed, and is narrower than the low velocity western hemisphere, not exactly a hemispherical structure of 50% each.
The structure of outermost core called the E’ region is important for understanding both the core-mantle interaction and the core dynamics including geodynamo (e.g., Busse, 1975; Fearn and Loper, 1981; Lay, 1989; Tanaka and Hamaguchi, 1993; Helffrich and Kaneshima, 2010; Brodholt and Badro, 2017; Kaneshima, 2018; Olson et al., 2018). Tanaka and Hamaguchi (1993) analyzed the residuals of differential travel times of SKKS-SKS and SKKKS-SKKS, and found the power of degree-1 component of the residual was ∼1.5 times as much as that of degree-2: the average residuals were +0.6 s beneath the Pacific hemisphere and −0.6 s in the other hemisphere (Figure 2C).
2.3 Electrical conductivity of the mantle
Although the spatial resolution is less than some of the seismological observations, electrical conductivity of the Earth’s interior is sensitive to the water/hydrogen content and may provide important constraints on the distribution of water in the Earth’s interior (e.g., Karato, 2011; Iwamori et al., 2021). For a plausible range in water content in Earth’s mantle (10 ppm–1 wt%) at a certain fixed pressure and temperature, the influence of water on electrical conductivity is large, producing a change by a factor of 100–300 for this range of water content. By contrast, the influence of plausible variations in temperature, major element chemistry and other factors on electrical conductivity is much smaller than that of water (hydrogen) content, whereas the influence of water on seismic wave velocity is small and less than that of plausible variations in the major element chemistry and in temperature (Karato, 2011). As will be discussed later in Presence of liquid.
By using a global data set, a three-dimensional distribution of electrical conductivity is becoming available down to an upper part of the lower mantle (Kelbert et al., 2009; Semenov and Kuvshinov, 2012; Sun et al., 2015; Li et al., 2020). The comparison of these results has been made by Li et al. (2020), and Figure 3 includes also the result of Kuvshinov et al. (2021) in addition to the materials from Figure 10 of Li et al. (2020). It is noted that the result of Kuvshinov et al. (2021) is expressed as deviation in logarithmic scale from the 1D background conductivity at each depth range and can be compared with the other figures of three models in terms of the relative pattern. The comparison shows that at a glance the resultant spatial structures and patterns such as distribution of high conductivity regions and their conductivity values differ among the individual models.
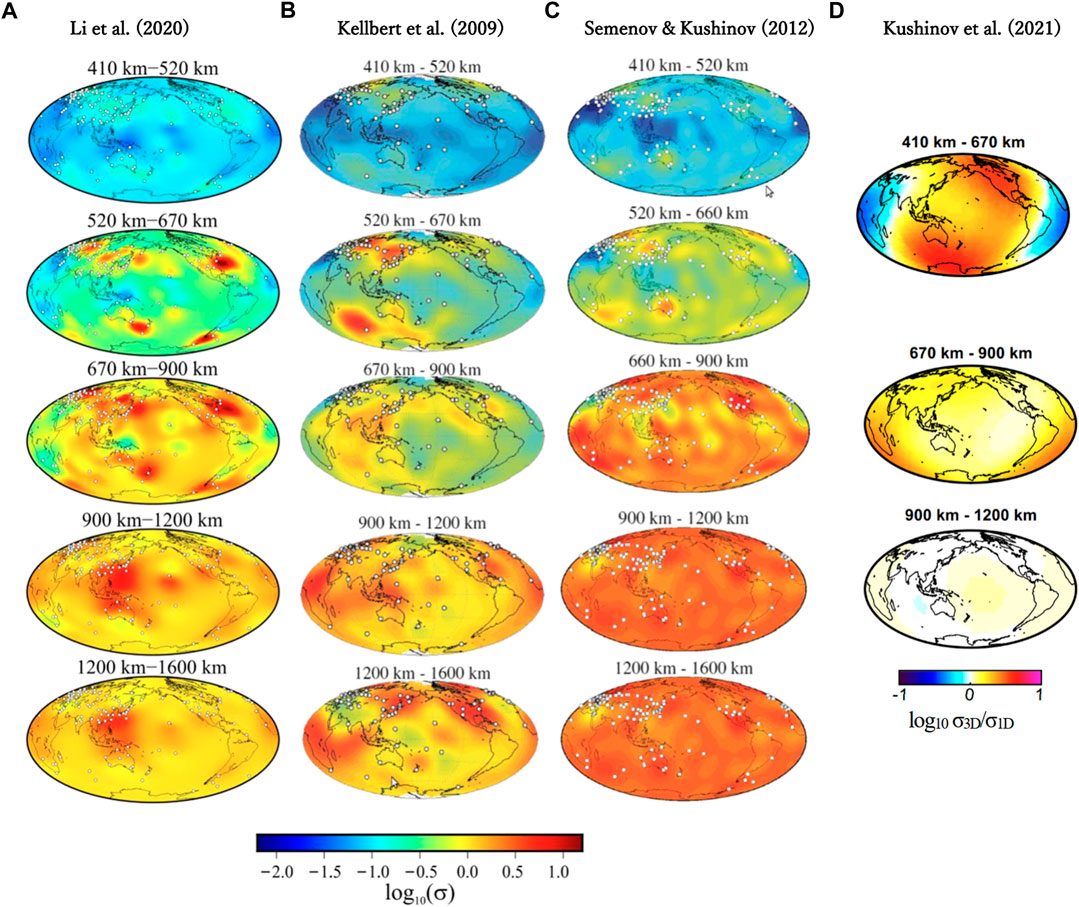
FIGURE 3. Global electrical conductivity models. (A) Li et al. (2020), (B) Kelbert et al. (2009), (C) Semenov and Kuvshinov (2012), and (D) Kuvshinov et al. (2021). The result of Kuvshinov et al. (2021) is expressed as deviation in logarithmic scale from the 1D background conductivity at each depth range.
Kuvshinov et al. (2021) pointed out that the differences are mostly due to the inherent strong non-uniqueness of the inverse problem arising from spatial sparsity, particularly in the oceanic region, and irregularity of data distribution, limited period range, and inconsistency of the assumed external field model, which is based on simple assumptions concerning the geometry of the magnetospheric ring current. Kuvshinov et al. (2021) implemented the matrix Q-responses concept to constrain the three-dimensional electrical conductivity structure of the mantle using satellite and observatory magnetic data (Figure 3D).
Although the overall variability in the electrical conductivity models, the model results share some feature at several depth ranges corresponding to those in and just below the mantle transition zone, where the resolution is relatively good (Kelbert et al., 2009): e.g., a high conductivity region beneath Australia and south Indian Ocean region at 520-660 or 670 km depth range, as well as beneath the eastern Eurasian continent and/or the north American region. Also, at 660 or 670–900 km depth range, a lower conductivity beneath the Pacific region compared to the sub-continental region is recognized in Figure 3.
These regions correlate well with the distribution of cold, and seismically fast, subducted slabs detected by seismic tomography (Fukao et al., 2001) and maps of transition-zone thickness and depth to the 410 km discontinuity (Lawrence and Shearer, 2008) as pointed out by Kelbert et al. (2009). These correlations may suggest that the high conductivities in and just below the mantle transition zone depths are linked to subducted oceanic plate and the water brought down with it. The cold subducted material should show relatively low conductivity, if temperature alone is considered. Water, carried into the transition zone with the subducting slabs, provides a plausible explanation for the elevated conductivities in these subduction-affected regions (Kelbert et al., 2009; Sun et al., 2015). Li et al. (2020) investigated the high conductivity region beneath Bermuda, North America, and argued the presence of hot dump upwelling originally from the subducted Farallon slab and its dehydration in the lower mantle. If this is the case, the high conductivity region beneath Bermuda can be also regarded as a part of the high conductivity regions related to subduction along the circum-Pacific region.
In summary, although there are appreciable differences among the global electrical conductivity models of the mantle at present, high conductivity regions in and just below the mantle transition zones are suggested to be related to subducted plates and water brought down with them. Since the seismic velocity structure is much less sensitive to water/hydrogen content than the electrical conductivity, a better coverage of stations, particularly in the oceanic area, as well as better models and constraints for the inversion are critical to improve the accuracy and resolution of the electrical conductivity structure in the mantle (Kuvshinov et al., 2021).
2.4 Geochemistry
Young basalts in the oceanic region (mid-ocean ridge basalts [MORBs] and ocean island basalts [OIBs]) are less influenced by continental crustal materials and have been studied as geochemical probes that directly reflect the present-day mantle composition. In particular, the isotopic studies of basalts have developed the concepts of mantle geochemical reservoir and mantle geochemical end-member (e.g., White, 1985; Zindler and Hart, 1986; Hofmann, 1997). Mantle geochemical end-members are hypothetical and convenient to describe the heterogeneity of the Earth’s mantle, each having a characteristic compositional range. They are defined in the compositional space of the observed mantle-derived basalts and peridotites, especially in the isotopic compositional space, and are given individual names as end-members for specific compositional ranges (e.g., DMM [Depleted MORB Mantle], EM-I [Enriched Mantle 1], EM-II [Enriched Mantle 2]). One of the reasons that mantle geochemical end-members have been defined and used is that those with extreme compositions are readily characterized and may provide keys to their formation. As a result, the end-members are discussed separately and material recycling in the mantle-crust system is discussed as a mixing and/or interaction of these components (e.g., Hofmann, 1997; Hofmann, 2003).
On the other hand, statistical analyses have been applied to reveal the structure and origin of the variability, including the mantle geochemical end-members, by capturing the entire compositional space at once (Allègre et al., 1987; Hart et al., 1992; Allègre and Lewin, 1995; Kellogg et al., 2002; Rudge et al., 2005; Rudge, 2006; Kellogg et al., 2007; Iwamori and Albarède, 2008; Iwamori et al., 2010; Iwamori and Nakamura, 2012; Iwamori and Nakamura, 2015). The observed basalt isotopic compositions have been investigated by several different methods of multivariate statistical analyses. Of the standard multivariate analyses, principal component analysis (PCA) is the most popular method (e.g., Allègre et al., 1987) to find the principal components (PCs) that accounts for the sample variance most effectively.
Hart et al. (1992) analyzed an isotopic compositional space of oceanic basalts and proposed a tetrahedron with four mantle geochemical end-members (DMM, EM-I, EM-II, and HIMU [High-μ (=238U/204Pb ratio)]) plus “FOZO” [Focus Zone] within the tetrahedron. At the same time, they demonstrated that the mantle isotopic space exhibits a planar structure based on PCA. Such a planar structure of has been repeatedly confirmed by Zindler et al. (1982) with 72 basalt data, Hart et al. (1992) with ∼570 data, and Iwamori and Nakamura (2015) with 6,854 data including Quaternary (and a few Tertiary) basalts from arcs and continents in addition to oceans. Iwamori and Nakamura (2015) pointed out that the plane which accounts for 95.0% of the sample variance is spanned by the two independent base vectors, rather than by mixing of numerous geochemical end-members, and that independent component analysis (ICA) instead of PCA must be used to identify the independent compositional vectors. In PCA, the extracted PCs are uncorrelated with each other (in other words, orthogonal) but are not necessarily independent. When the data constitute a (joint) non-Gaussian distribution, PCA always fails to extract the independent features in the data (Hyvärinen et al., 2001). Instead, independent component analysis (ICA) must be used to extract independent components (ICs) for data showing non-Gaussian distribution.
As a result of ICA (Iwamori et al., 2010; Iwamori and Nakamura, 2012; Iwamori and Nakamura, 2015), the two ICs (IC1 and IC2) were identified: IC1 discriminates OIB from MORB and reflects elemental fractionation associated with melting and the subsequent radiogenic ingrowth with an average recycling time of 0.8–2.4, whereas IC2 shows global geographical discrimination, irrespective of the type of basalts, indicating the presence of east–west geochemical hemispheres in the mantle (Figure 4A). IC2 is related to aqueous fluid–rock interaction and the subsequent radiogenic ingrowth with an average recycling time of 0.3–0.9 Ga, and suggests that the mantle of the eastern hemisphere is richer in hydrophile components compared to the western hemisphere mantle. Since this feature is independent of the basalt types (i.e., MORB, OIB, arc and continental basalts), the whole depth range from the near-surface to CMB would exhibit the hemispherical division (Iwamori and Nakamura, 2015).
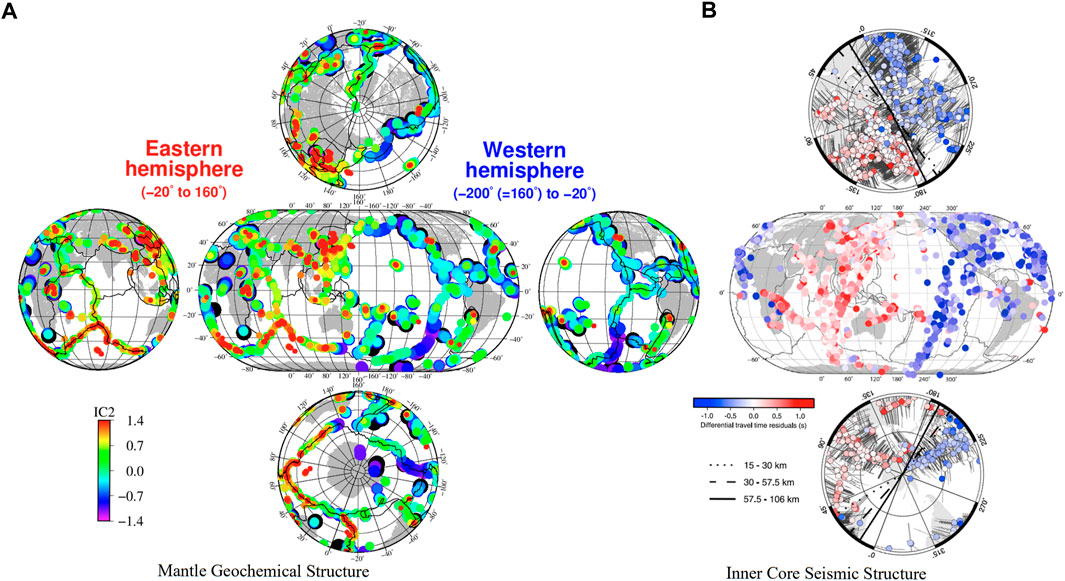
FIGURE 4. Geographical distribution of (A) a hydrophile component (IC2) extracted by independent component analysis (ICA), and (B) the relative seismic velocity near the surface of the inner core (after Waszek et al., 2011). In (A), the variability is shown by the size of the color-coded symbols (smaller for the higher IC2 value, corresponding to a greater amount of hydrophile component). In (B), the color coding represents differential travel time residuals, ranging from −1.3 s (dark blue) to +1.3 s (dark red). The central longitude of this map is 160°E. As in Figure 2B, the longitude of the sharp hemisphere boundary varies with increasing depth below the inner core boundary (ICB). In the two maps of polar regions, the solid line represents the boundary at 57.5–106 km below ICB, the broken line at 30–57.5 km below ICB, and the dotted line at 15–30 km below ICB (Figure 5 of Waszek and Deuss, 2011).
The trace element systematics of basalts support this hemispherical structure based on the isotopic signatures of basalts (Iwamori et al., 2019). For example, Pb is enriched in the basalts of positive IC2 which characterizes the eastern hemisphere, compared to the basalts of negative IC2 dominant in the western hemisphere. Since Pb is mobile with aqueous fluids, e.g., slab-derived fluids in subduction zones (Pearce et al., 2005; Nakamura and Iwamori, 2009; Nakamura and Iwamori, 2013), Iwamori et al. (2019) argued that the enrichment in Pb as well as other incompatible element variations (Rb, Sr, Nd, Sm, U, Th) reflects more hydrated nature and that the eastern hemisphere mantle consists of more fluid-fluxed materials compared to the western hemisphere mantle.
Figure 4B shows the seismic structure near the surface of the inner core in terms of the differential travel time residuals (Waszek et al., 2011), as was described in Section 2.2. Iwamori and Nakamura (2015) found a striking similarity in geographical distribution between the mantle geochemical hemisphere and the inner core hemisphere. Both hemispheres are broadly bounded by the international date line and the western Africa-Atlantic line. The eastern hemisphere involves the positive IC2 area of the mantle and the faster seismic velocity area of the inner core, and starts from the eastern Eurasia, including a part of Kamchatka, Kuril, Japan, Australia, to the western Africa-Atlantic. The western hemisphere involves the rest of area, including the western half of the Antarctica, and covers appreciably wider area than the eastern hemisphere, as partly represented by the negative IC2 signature in the western Africa (Figure 4A). This indicates that the hemispherical structures of the Earth’s interior (both mantle and inner core) are not exactly half and half.
3 Discussion: Large-scale structure and dynamics of the Earth’s interior
3.1 Previous models of large-scale structure and dynamics
One of the key aspects for interpreting the large-scale structures described in Section 2 and discussing the dynamics inferred from them is how thermal and compositional heterogeneity was created in the Earth’s interior by mantle convection associated with plate subduction and plume upwelling. In particular, various models have been proposed to explain how primordial materials were mixed or unmixed in terms of spatial scale and distribution with a variety of enriched and depleted materials formed mainly by near-surface processes, such as crustal materials and upper mantle materials (e.g., Hofmann, 1997; Tackley, 2000; Tackley, 2008; Ballmer et al., 2017). Those include a classical two-layered mantle model with uniformly distinct upper and lower mantle reservoirs (e.g., Jacobsen and Wasserburg, 1979; OʼNions et al., 1979), 2) stratified/zoned mantle model (Hofmann and White, 1982; Kellogg et al., 1999; Tackley, 2008; Albarède, 2009), 3) plum-pudding mantle model (Morris and Hart, 1983; Zindler et al., 1984), 4) marble-cake mantle model (Allègre and Turcotte, 1986), 5) filtering model at mantle transition zone (Bercovici and Karato, 2003), 6) temporal evolution model from layered to leaky convection (Allègre, 1997). Broadly speaking, these various models overall discussed whether convection extends from the surface to CMB, or whether the mantle is compositionally and dynamically layered, in other words, the vertical structure and the dynamics behind it. On the other hand, the large-scale horizontal structures have not been extensively discussed in the above-mentioned models where ubiquitous heterogeneity or a cyclic dynamical structure in the horizontal direction were implicitly assumed.
In terms of seismic structures (Figure 1), the degree 2 pattern near the bottom of the mantle, which is associated with LLVP, is one of the prominent horizontal structures. Ballmer et al. (2017) proposed that bridgmanite-enriched mantle domains of a high viscosity may explain various geophysical and geochemical observations including LLVP, based on the horizontally cyclic convective pattern of 2-dimensional numerical simulation. Another prominent seismic horizontal structure is the lithospheric root of the continents, which is related to the degree 1 spectrum at the shallow mantle (Figure 1G). Three-dimensional numerical models with (super)continents have been proposed to reconcile the degree 1 structure at the shallow mantle and the degree 2 structure at the deep mantle, and will be described in detail in Section 3.3.
Geochemical evidences also provided information on the horizontal compositional structure of the mantle. In particular, basalt compositions have been utilized to probe the mantle composition. With increasing the spatial density of basalt data, Dupal anomaly in the Indian Ocean and the southern Pacific Ocean (Dupré and Allègre, 1983; Hart, 1984) has been turned out to be a part of a hemispherical structure as in Figure 4 that utilized almost all young basalt data available. While Figure 4 provides the current best horizontal resolution for the geochemical mapping, the vertical resolution is limited compared to the geophysical observations. In Figure 4, the hemispherical discrimination appears regardless of basalt types of mid-ocean ridge basalt (MORB), ocean island basalt (OIB), arc basalt (AB), and intra-continental basalt (CB), which may indicate that the hemispherical compositional differences of the mantle consistently extend from the shallow mantle, represented by MORB, to the deep mantle, represented by OIB (Iwamori and Nakamura, 2015). To examine such a large-scale structure, the seismic tomography may provide information on the mantle structure complementary to the geochemically detected structure. However, integration of the geochemical and seismic structures would not be straightforward, and models and interpretation that account for the observed heterogeneity and structure are necessary. In the following sections, such models and interpretation are provided to discuss the nature and origin of large-scale structures, including the potential connection between the observations from different disciplines.
3.2 Geochemical model for formation of large-scale structure
Of the different methods for global structures described in Section 2, the geochemical approach provides the time scale for formation of the large-scale structure, based on the radiogenic isotopes. The independent component IC2 represents a compositional vector, which can be back-projected into the original variable space consisting of five isotopic ratios of Sr, Nd, and Pb. Based on the slopes and the ranges in the compositional space of five isotopic ratios, elemental fractionation (e.g., represented by simultaneous increases (or decreases) in Pb/U, Pb/Th, Rb/Sr and Nd/Sm) associated with hydration-dehydration reactions is attributed to creating the IC2 vector, and the length of vector provides an estimate on the radiogenic ingrowth of 0.3–0.9 giga year after hydration-dehydration reactions, such as mantle hydration by slab-derived fluids (Iwamori and Albarède, 2008; Iwamori et al., 2010). Based on these observations and analysis, the hemispherical hydration event has been argued associated with the focused subduction of plates towards the supercontinents (Pangea, Gondwana, and Rodinia) during 0.3–0.9 Ga (Iwamori and Nakamura, 2012). Recent studies on full-plate global reconstruction during the last ∼1 giga year (e.g., Merdith et al., 2017; Li et al., 2019; Merdith et al., 2021) are consistent with such a long-term focused subduction, showing a geographically biased distribution of the continents until the supercontinent Pangea started to break up.
Between 330 and 175 Ma, the supercontinent Pangea consisted of all the present-day continents (Scotese, 2004; Scotese, 2021), and was surrounded by subduction zones (Figure 5). Focused subduction towards the supercontinent with a subduction velocity 0.1 m/year for ∼100 million years can distribute recycled materials beneath the supercontinent of a radius of ∼107 m (Iwamori and Nakamura, 2012). The subducted slabs may stagnate at 660 km or penetrate to the bottom of the mantle sporadically in time and space (Fukao et al., 2001; Grand, 2002), which may hydrate both the upper and lower mantle (Nakagawa et al., 2018). Then a high-IC2 domain may be developed by radiogenic ingrowth over the subsequent ∼300 million year to account for the time-evolved isotopic ratios, during which the supercontinent has dispersed towards the present-day configuration. Although the two main subduction zones have migrated apart, expanding the continental area, the planform area of the geochemical domain remains without moving completely with the dispersing continents (Figure 5). Accordingly, the geochemical domain has seemingly been anchored to the asthenosphere.
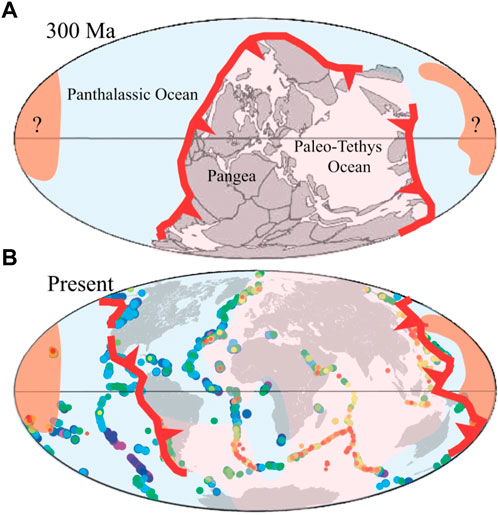
FIGURE 5. Evolution of the supercontinent Pangea and the underlying geochemical hemispheres (Iwamori and Nakamura, 2012). (A) The possible configuration at 300 Ma, where the pinkish area represents the hydrophile component-rich mantle developed beneath Pangea, whereas the reddish area represents hypothetical “older domain” developed beneath Rodinia. The bluish area represents the hydrophile component-poor domain developed beneath the Panthalassic Ocean. (B) The present-day configuration with the observed distribution of IC2 value, based on which the high-IC2 domain (pinkish area with dominantly IC2 > 0) and low-IC2 domain (bluish area with dominantly IC2 < 0) are illustrated.
The range in radiogenic ingrowth from 0.3 to 0.9 Ga, which was quantified based on the IC2 variation, is originated from the uncertainties in partition coefficient and degree of dehydration event (degree of parent-daughter fractionation), as well as duration of such a dehydration-fractionation event (Iwamori et al., 2010). In this context, the range of “0.3 to 0.9 Ga” may indicate a relatively long duration of focused subduction that began before Pangea. At the same time, Iwamori and Nakamura (2012) pointed out that a domain with extremely high IC2 values would exist beneath the Pacific, which suggests an even older subduction event before the formation of Rodinia (dark pinkish region labeled “?” in Figure 5A). To resolve the past subduction events and the corresponding fingerprints in the present-day Earth, further studies, including the estimates of formation age of the domains and the geochemical characterization, will be needed.
Distribution of the negative IC2 domain (i.e., hydrophile component-poor domain, blue portion in Figure 5) beneath the western hemisphere, including the American Plates that had been a part of the supercontinent, suggests that dispersion of the continents has occurred asymmetrically more to the west in terms of the geochemical domain. This asymmetricity implies eastward migration of low-IC2 asthenosphere (once beneath the Panthalassic Ocean) relative to the overlying lithosphere or westward lithospheric rotation against the asthenosphere, which is suggested for the preset-day Earth (Ricard et al., 1991). Although the history of rotation is uncertain, if we apply the current rate of 2 cm/year (Ricard et al., 1991) for the last 300 Ma, the resultant westward migration over 6,000 km roughly explains that the low-IC2 domain now exists beneath the American Plates (Figure 5B).
IC1, which is statistically independent of IC2, is not geographically biased and clearly distinguishes basalt types, particularly MORB and OIB: MORB has a negative IC1 and OIB has a positive IC1. Parent-daughter elemental fractionation associated with melting and subsequent radiogenic ingrowth may explain IC1, and the OIB source is rich in melt component (positive IC1) and the MORB source is poor in melt component (negative IC1); Hofmann and White (1982) and numerical simulations based on them (Christensen and Hofmann, 1994) have proposed that deep recycling of melt component-rich materials such as subducted oceanic crustal basalts produces OIB, while melting of the upper mantle, which is relatively poor in recycled materials, produces MORB. On the other hand, it has been pointed out that oceanic crustal basalts (i.e., MORBs) are the product of relatively high degrees of partial melting of mantle (∼10%, McKenzie and O'Nions, 1991), and cannot fractionate parent and daughter elements such as Rb/Sr, Sm/Nd, U/Pb, and Th/Pb to account for IC1 (Iwamori and Nakamura, 2015). Instead recycling of OIB or arc basalts and its residual mantle may contribute to the mantle isotopic heterogeneity, owing to the relatively small degree of partial melting (McKenzie et al., 2004; Iwamori and Albarède, 2008). In any case, IC1 is related to variability concerning “melt component” inherited in the mantle.
Since the melt component-rich lithology (e.g., eclogite) is likely to be denser than the surrounding peridotitic portion in the mantle, it may accumulate near the base of the mantle convection system (Figure 6). Due to the long recycling time (0.8–2.4 giga years) and relatively high temperatures near CMB, such components would have become less viscous and distributed themselves along CMB globally beyond the hemisphere. At the same time, it contains more radiogenic elements (as U, Th and K are partitioned preferentially into melts) and produce heat to cause upwelling plumes to be the OIB source (e.g., Christensen and Hofmann, 1994; Nakagawa et al., 2010). Consequently, OIBs exhibit positive IC1 signatures. On the other hand, a relatively shallow part of the mantle is depleted in such ‘melt component’, resulting in negative IC1 signatures for MORBs. Interestingly, the two “typical” plumes of Hawaii and Iceland are also depleted in IC1 component exceptionally among OIBs, and could be the thermal plume heated from the core (Iwamori and Nakamura, 2015).
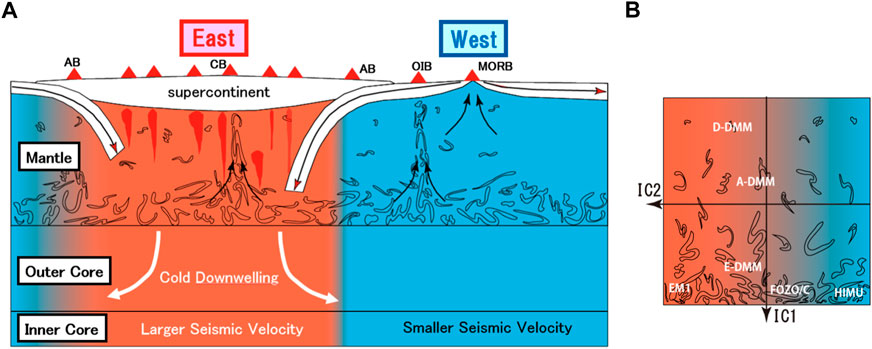
FIGURE 6. Model of top-down hemispherical dynamics and material recycling with two overlapping differentiation processes and focused subduction beneath the supercontinent (Iwamori and Nakamura, 2015). (A): Irregular streaks represent recycling ‘melt component’, which are accumulated near CMB, resulting in IC1 variations mostly in the vertical direction. These streaks then ascend due to thermal instability to form OIB. Two large plumes may constitute a degree-2 structure at the deep mantle. At the same time a hemispherical degree-1 structure can coexist: The horizontally divided red and blue regions represent a hemisphere enriched in ‘hydrophile component’ (positive IC2) beneath the supercontinent and another depleted hemisphere (negative IC2) beneath the ocean, respectively. The former is colder than the latter, due to focused subduction (see the main text for more details). Rising plumes (shown as dark red plumes) beneath the supercontinent represent fluid component-assisted plumes. AB=arc basalt, CB=continental basalt. (B): the conventional mantle geochemical end-members (DMMs, EM1, EM2, HIMU, FOZO/C; see the main text for explanation) are expressed by the combination of IC1 and IC2.
Figure 6 also illustrates formation of the high IC2 region by the focused subduction towards the supercontinent, creating the mantle eastern hemisphere enriched in “anciently subducted” fluid components (Iwamori and Nakamura, 2012; Iwamori and Nakamura, 2015). Most of water initially contained in the subducting plates is released at depths shallower than 200 km, associated with breakdown of major hydrous minerals such as chlorite and serpentine (e.g., Iwamori, 1998; Schmidt and Poli, 1998). However, even after the major dehydration reactions, a hydrous boundary layer that consists of nominally anhydrous minerals, as well as fluids along the grain boundaries and in the inclusions, of 20–40 km thickness is formed just above the subducting slab and may carry several thousand ppm H2O to the deeper mantle (Iwamori and Nakakuki, 2013). This hydrous layer is brought down into the deep mantle, including the transition zone and the lower mantle (Nakagawa et al., 2018), and may redistribute itself to create a global-scale fluid component-rich domain in several hundred million years, as suggested by the IC2 recycling timescale shorter than IC1. The fluid component is redistributed by both convective stirring and fluid migration associated with dehydration–rehydration reactions, as well as by hydrous plumes segregated from the hydrous layer of subducted slab due lower density and viscosity (Richard and Iwamori, 2010). The focused subduction may affect also the global thermal structure of the mantle and the core (Figure 6), which will be discussed in the following section.
3.3 Numerical modeling of convection and thermal structure
Mantle convection with amalgamation-dispersal of the continents has been examined by numerical models, which may provide insights for the formation of large-scale mantle structure and the dynamics behind (e.g., Phillips and Bunge, 2005; Phillips and Bunge, 2007; Zhong et al., 2007; Yoshida, 2010; Zhang et al., 2010; Yoshida, 2013). These studies show that heating mode such as a ratio of basal heating and internal heating, viscosity structure such as a viscosity jump at 660 km, as well as distribution and size of the continents, greatly affect the mantle convective pattern. Based on the model results, although the individual model setups and numerical schemes including semi-dynamic and fully dynamic ones differ, some common behaviors and structures are seen; if a supercontinent exists, particularly with internal heating, a degree-1 structure is dominant in the mantle, whereas a structure with degree-2 (and higher degrees) becomes dominant when the continent pieces are dispersed. Recent studies on supercontinent cycle (Mitchell et al., 2021; Wang et al., 2021) also support the relationship between degree-1 and degree-2 structures by reconciling the past distribution of the continents, the present-day mantle structure, and the numerical modeling.
Zhang et al. (2010) discussed such transition and temporal evolution of large-scale mantle structure, using a semi-dynamic thermochemical convection model that considers a plate motion history for the last 450 Ma including the assembly and breakup processes of Pangea. Yoshida (2013) developed fully dynamic models of 3-D spherical-shell geometry, incorporating drifting deformable continents with mechanically weak margins and self-consistent plate tectonics, to evaluate the subcontinental mantle temperature during a supercontinent cycle. Figure 7 shows the model results that reproduces the dispersal and re-assembly of the supercontinent. The initial supercontinent consists of four continental pieces being individually surrounded by a weak margin. The four pieces migrate together in the first ∼200 million years (Myr) and subsequently start to disperse until ∼500 Myr. Then amalgamation of the four pieces occurs to form a re-assembled supercontinent from ∼500 to 1,000 Myr, which again starts to break up at ∼1,000 Myr (Figure 7).
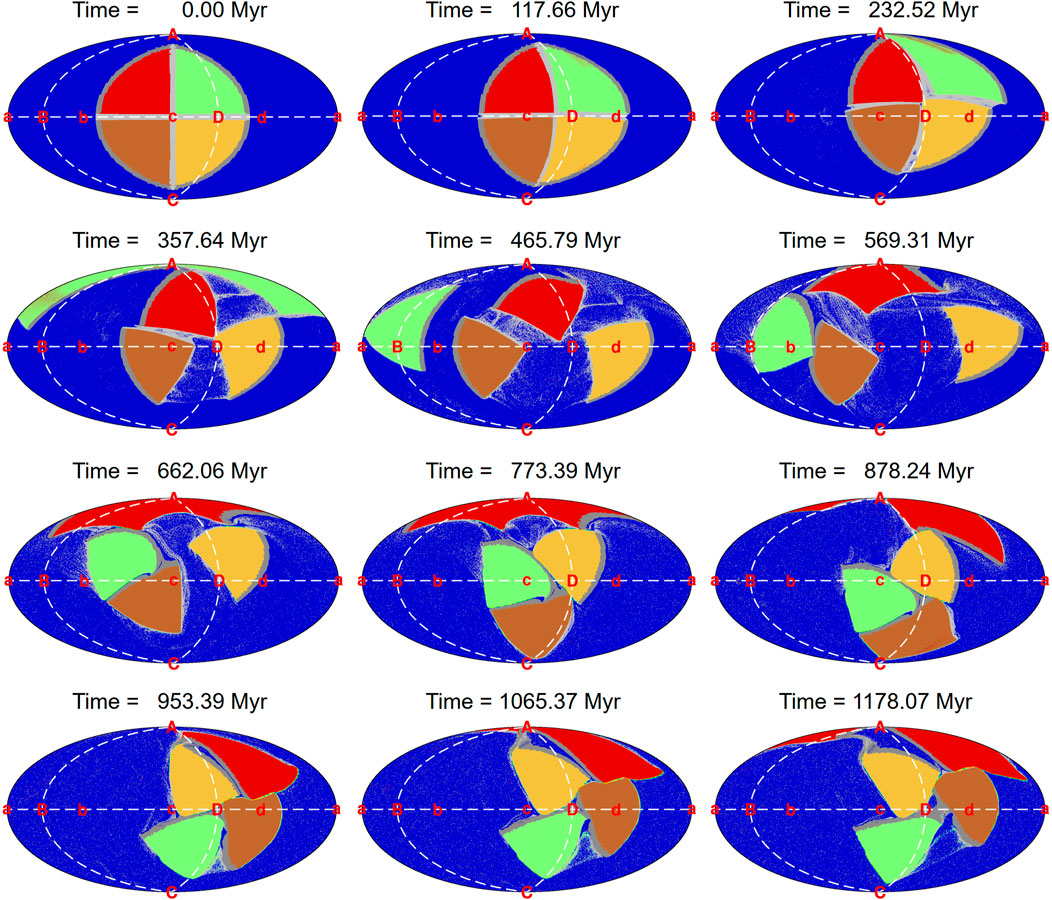
FIGURE 7. Time sequence of the drifting continents from the initial supercontinent, dispersal of the continental pieces, to amalgamation and reassembly of the next supercontinent over ∼1,200 million years after Model Y200_20a0 by Yoshida (2013). The color coding indicates the ocean area (blue), and the four continent pieces (red, pale green, brown, yellow). The alphabet labels indicate a set of geographically fixed points along the longitudinal and equatorial sections for describing the global positions of continent pieces and the convective geometry in the main text; “A” to “D” for the longitudinal section (“A”–“B”–“C”–“D”–“A”) and “a” to “d” for the equatorial section (“a”–“b”–“c”–“d”–“a”).
Figure 8 shows the temperature variations of sub-oceanic and sub-continental regions with time and depth, based on the same model results as in Figure 7. The upper mantle temperature (<410 km depth) is higher for the sub-oceanic area corresponding to the thinner lithosphere reproduced in this model with self-consistent plate tectonics. For the sub-continental area, the cold upper mantle is underlain by a hot depth range mainly between 500 and 1,000 km due to the thermal blanketing effect (Yoshida, 2013). Below this depth range, a large portion of the lower mantle beneath the continents is colder by ∼20°C compared to sub-oceanic lower mantle through most of the history shown in Figure 8. The cold nature of the sub-continental deep mantle is particularly prevailing after ∼500 Myr when the amalgamation of continents started, and becomes the most significant at all depths when the amalgamation completed to form the re-assembled supercontinent at 900–1,000 Myr (Figures 7, 8).
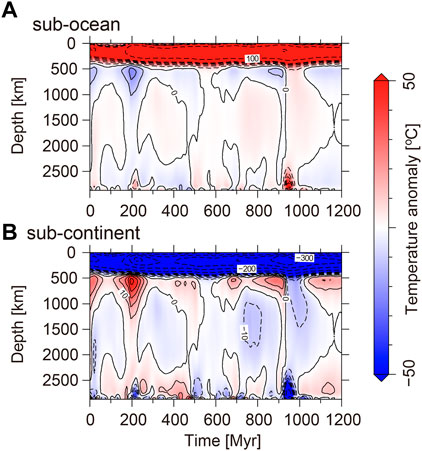
FIGURE 8. Time sequence of the depth profile of δT(d) at each elapsed time in (A) sub-oceanic region and (B) sub-continental region, where δT(d) is the lateral average of the integrated temperature anomaly over the entire surface at each depth (d). For the mathematical definition of δT(d), see Eq. 4 in Yoshida (2013). The elapsed times correspond to those in Figure 7. The intervals of the solid line contour are 10°C for δT(d) ≥ 0°C, and the intervals of the dashed line contour are 10°C for −50°C ≤ δT(d) ≤ 0°C, and 100°C for δT(d) ≤ −100°C.
Figure 9 shows the longitudinal and equatorial sections for temperature distribution in the mantle during this amalgamation period. At the beginning of amalgamation stage (587 Myr, top left), subduction zones and hot plumes are globally distributed in several locations, which may correspond to a degree-2 thermal structure or higher degrees, as was pointed out by the previous studies for the continent dispersed stage. As the amalgamation proceeds, the subduction zones become biasedly distributed; e.g., at 694 Myr, the subduction zones are concentrated where the continents were amalgamated along the equatorial line “b”-“c”-“d” and the longitudinal line “A”-“D”-“C”, creating a continent hemispherical domain of a lower temperature compared to the ocean hemispherical domain (labeled “a”). Such uneven distribution of subduction zones continues (809, 871 Myr), until the amalgamation completes (953 Myr, Figure 9), since subduction must occur for the continents to get closer and amalgamated, and results in formation of cold hemispherical domain beneath the supercontinent.
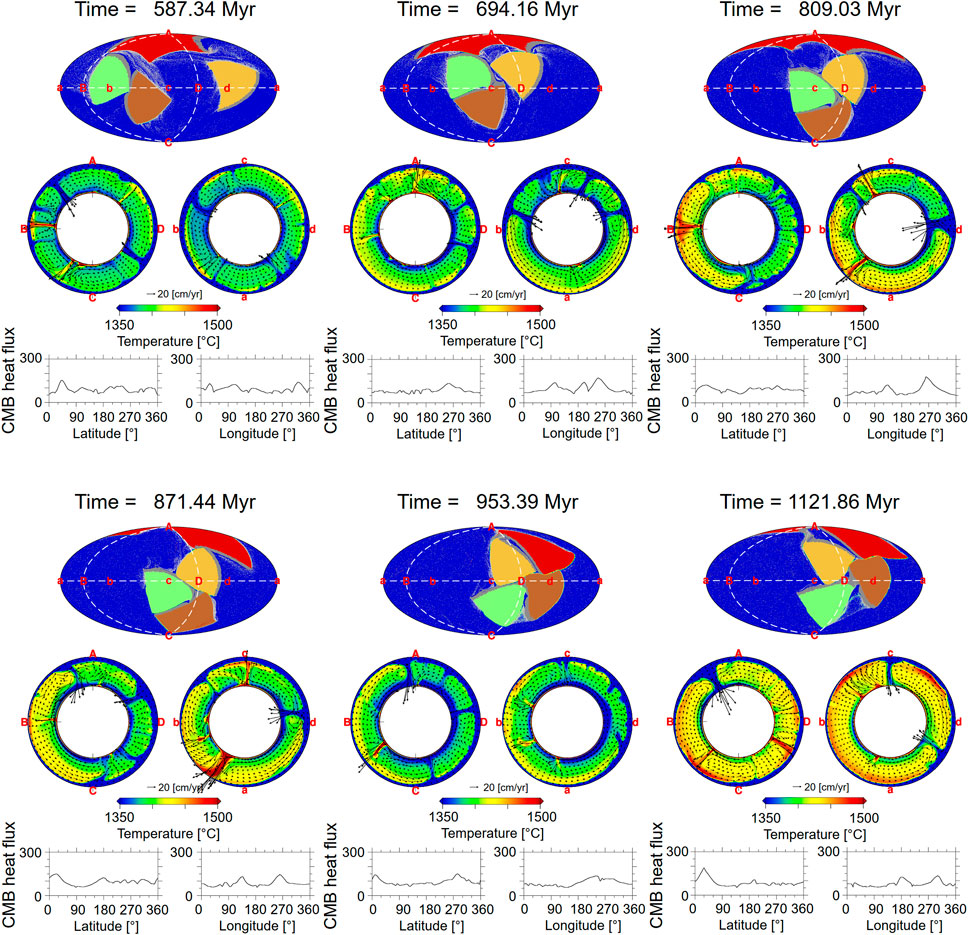
FIGURE 9. Snapshots of drifting continents (top of the individual “Time” stages), the longitudinal and equatorial sections for temperature distribution in the mantle (middle panels) and the heat flow at CMB in the unit of mW/m2 (bottom panels: left along a longitude through “A”(0°)–“B”(90°)–“C”(180°)–“D”(270°)–“A”(360°), right along the equator through “a”(0°)–“b”(90°)–“c”(180°)–“d”(270°)–“a”(360°)) during the amalgamation period of numerical model shown in Figures 7, 8 (after Yoshida, 2013).
The heat flux through CMB also reflects this hemispherical structure. The CMB heat flux at 587 Myr, the beginning of amalgamation, is dominated by relatively short wavelength variations, while at 694 Myr, where amalgamation is more advanced, there appears some long wavelength structures with a series of peaks of high heat flux, especially at the equatorial section. This is due to the concentration of multiple subduction zones on the margins and in the interior of the forming supercontinent, bringing a cold material into the mantle. This situation continues until the completion of amalgamation. At 953 Myr, there is a high heat flow centered at “d” in the equatorial section (around 270° in the bottom right of the 953 Myr figure), where colder material covers CMB and takes more heat away from the core than in the remaining hemispheric part. Furthermore, this trend remains even after the continental pieces start dispersing again (1,121 Myr). This is because, although the continents have begun to disperse, they are still sandwiched between large subduction zones as a whole, and the effects of these subduction zones continue.
This structure is somewhat similar to the present-day Earth (Figure 5B). Although the separation of the continents has progressed with the formation of the Indian and Atlantic Oceans from about 175 Myr, the two major subduction zones, which have been located to the west and east of Panthalassa (present-day Pacific Ocean), sandwich the supercontinent in the past and most of the present continents (Figure 5). Accordingly, the hydrophile component-rich regions (shown in pink in Figure 5), which were formed mainly by focused subduction toward the past supercontinents, have not been significantly modified, and their distribution is expected to remain in the mantle today. Therefore, the temperature structure of the mantle and the heat flow at CMB may still be influenced as in Figure 9, and the remaining mantle in the eastern hemisphere may be systematically colder than the oceanic region (western hemisphere), mainly beneath the Pacific Ocean.
3.4 Synthesis with observations
Would such temperature differences be constrained by any observations? The remarkable difference between sub-continental and sub-oceanic regions in the upper mantle (<410 km) in the numerical simulation (Figure 8) is consistent with the predominance of the degree-1 structure in shallow regions of the seismic tomography (Figure 1G). In addition, the average temperature difference between the sub-continental and the sub-oceanic regions in the lower mantle of about 20° (Figure 8) corresponds to a seismic wave velocity variation of 0.14% (Karato, 2011). Although such a small variation is not readily detected, absence of a large contrast and the small velocity variation in seismic tomography (Figure 1) are consistent with the model result of numerical simulation (Figure 8).
In addition to the seismic observations, compositions of basalts may reflect mantle potential temperature (e.g., McKenzie and Bickle, 1988). Figure 10 shows the compositions of relatively undifferentiated mid-ocean ridge basalts in the Pacific, Atlantic, and Indian Oceans as a function of longitude. The mean value of SiO2 increases and MgO decreases in the order of Pacific, Atlantic, and Indian Oceans: the respective means (and the standard deviations) are SiO2 wt%=47.8 (±2.1), 48.6 (±0.9), 49.7 (±1.0), MgO wt%=10.7 (±1.5), 10.3 (±1.1), and 9.4 (±1.1). The geographical locations of several Atlantic basalts are close to the Icelandic and Azores plumes, but the Atlantic data away from the plumes show no significant difference. Based on peridotite melting experiments and thermodynamic modeling (e.g., Jaques and Green, 1979; Takahashi and Kushiro, 1983; Hirose and Kushiro, 1993; Baker and Stolper, 1994; Ghiorso, 1994; Holland and Powell, 1998; Connolly, 2005; Ueki and Iwamori, 2013; Ueki and Iwamori, 2014), SiO2 of a primary basalt is a function of both temperature (melting degree) and pressure, while MgO varies mostly with temperature. Although the absolute values are subject to large errors, the difference in MgO suggests a difference of about 20–50°C based on comparison with the melting experiments and thermodynamic analysis (Hirose and Kushiro, 1993; Ueki and Iwamori, 2014), which is consistent with the variation range in SiO2 assuming a constant melting pressure. These observations and analysis suggest that the mantle beneath the Pacific Ocean is hotter on average than that beneath the Atlantic and Indian Oceans. The Indian Ocean was created with the breakup of the supercontinent, and there may still be remnants of lower temperatures under the past supercontinent. The thermal history of mantle beneath the Atlantic Ocean would be similar to that beneath the Indian Ocean, but may have been slightly warmed by the African (and other) plumes. The Pacific, on the other hand, has been an oceanic region since Panthalassa and is considered warmer.
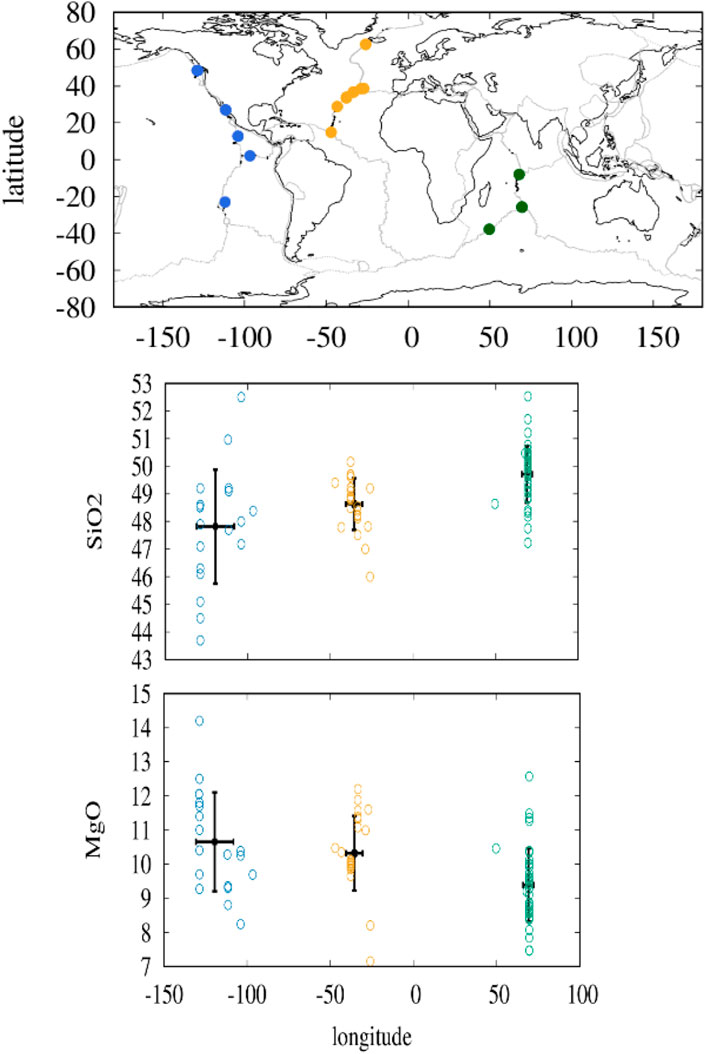
FIGURE 10. Distribution and compositions of relatively undifferentiated mid-ocean ridge basalts in the Pacific, Atlantic, and Indian Oceans. The basalt data are selected from the open database PetDB [https://www.earthchem.org/, Lehnert et al., 2000] data for FeO*/MgO ratio less than unity, where FeO* indicates total iron as FeO. The SiO2 and MgO wt% are plotted as a function of longitude.
The geochemical observations described in 2.4 suggest that the mantle beneath the Indian Ocean is hydrophile component-rich, in addition to its colder signature as in Figure 10. Regarding geophysical observations, the seismic velocity is not very sensitive to a plausible variation in mantle water content (10 ppm–1 wt%), although it provides information with the best spatial resolution and coverage (Karato, 2011). On the other hand, electrical conductivity is sensitive to the plausible variation in the mantle water content, and suggests that regions of relatively high conductivity in and just below the mantle transition zone beneath continental regions surrounding the Pacific (Figure 3 and Section 2.3) may indicate the presence of water brought into the mantle by subducted slabs. As was described in the end of Section 3.2, several thousand ppm H2O released from the subducting slab accounts for observed high IC2 values. This water is carried deeper to the mantle transition zone and the lower mantle, and may roughly explain the observed high electrical conductivity of ∼1 S/m (c.f., Figure 3 of Karato, 2011) in and just below the mantle transition zone behind the subduction zones. It is noted that the subduction of H2O is limited to relatively small amounts (several thousand ppm) by a series of dehydration reactions along the subducting slab at <200 km depth (Section 3.2), and subsequent redistribution within the transition zone and lower mantle, occurs mostly by solid phase flow with minor fluid migration just locally along the 660 km discontinuity (Iwamori and Nakakuki, 2013; Nakagawa et al., 2018). The global H2O circulation has been examined by numerical simulation that considers the hydrous phase diagram (Nakagawa et al., 2018), which is broadly consistent with petrological and geophysical estimates on the global H2O distribution (Hirschmann, 2006; Iwamori 2007; Karato, 2011). However, further improvement of the global electrical conductivity model is needed to constrain the H2O distribution in terms of accuracy, resolution, and spatial coverage, including the deep lower mantle and the CMB region.
At the beginning of amalgamation stage at 587 Myr in the numerical simulation (Figure 9), subduction zones and hot plumes are globally distributed in several locations, and no appreciable temperature difference between sub-oceanic and sub-continental regions. As amalgamation of the continents progresses, the thermal hemispherical structure appears and continues through the supercontinent stage to early dispersal stage (Figure 9). In all these stages, the continent hemispherical domain is associated with two major subduction zones that bound the ocean and continent domains, as well as hot plume(s) in the ocean hemisphere. Within the continent hemispherical domain, particularly after the supercontinent stage (e.g., between point “D” and “C” in 1,121 Myr, Figure 9), a hot plume was formed beneath the continental area. The plume formation was facilitated by the cold material subducted to the bottom of mantle to enhance thermal instability near CMB. The source of the plume is rich in “anciently subducted melt component” (high IC1, Figure 6), so it could also have been aided by self-radiogenic heating. In this series of simulation, the hemispherical temperature structure, in particular in the upper mantle, may constitute a degree-1 structure as in Figure 8, whereas the plumes in sub-oceanic and sub-continental regions, particularly near CMB, may be detected as degree-2 structures. Such a combination of degree-1 and degree-2 structures, which is schematically illustrated in Figure 6, may explain the observed features in the present-day mantle (Figure 1).
Using a semi-dynamic thermochemical convection model that considers a plate motion history, Zhang et al. (2010) argued that while the mantle in the African hemisphere before the assembly of Pangea is predominated by the cold downwelling structure resulting from plate convergence between Gondwana and Laurussia, it is unlikely that the bulk of the African superplume structure can be formed before ∼230 Ma (i.e., ∼100 Myr after the assembly of Pangea). Particularly, the last 120 Myr plate motion plays an important role in generating the African superplume. Such evolution is similar to that in Figure 9 with respect to the spatial-temporal distribution of subduction zones and plumes, suggesting that thermal hemispherical structure may remain in the present-day mantle.
The numerical models above suggest that the timing, location, and rate of subduction is important to control the plume generation (age, location, and size) as well as formation of the cold and hydrophile component-rich hemisphere detected by the geochemical approach. In this sense, subduction plays a primary role on the whole mantle dynamics, in other words, top-down dynamics operates, rather than bottom-up dynamics in which hot rising plumes have a primary control on the mantle dynamics.
The horizontal variations in seismic velocity in Figure 1 (0.5–2.2% in standard deviation at the shallow (<700 km) mantle, and 0.5–0.8% at the deep (> 2,700 km) mantle) correspond to differences in temperature, material composition, and density, and indirectly reflect the source of driving force of mantle convection. The seismic velocity variation corresponds to a horizontal temperature variation from 140 to 630 K at the depth range of <700 km and 140–230 K at >2,700 km, provided that the velocity variation is caused solely by the temperature variation (a temperature variation of 100 K will cause the velocity variation of ∼0.7%, Karato, 2008). Large horizontal temperature variations above 600 K in the shallow range are consistent with temperature differences between the subducting cold plate and the surrounding mantle (e.g., Iwamori, 1998; Syracuse et al., 2010; Horiuchi and Iwamori, 2016; Nakao et al., 2016) and, when converted to density differences via thermal expansion, corresponds to a large negative buoyancy. On the other hand, in the lowermost part of the mantle >2,700 km depth, the thermal expansivity is appreciably smaller than in the shallow part by more than factor three (Stacey and Davis, 2008; Katsura et al., 2010). Together with the small temperature variation, the deep part is a much smaller buoyancy source than the near-surface part to drive mantle convection. Considering the effect of spherical shell volume in Figure 1F (i.e., about 60% of the total velocity contrast in the mantle occurs at the shallow range of <700 km, and only about 4% near the CMB >2,700 km), the amplitude of the convection driving force near CMB is estimated to be less than a 10th of the driving force generated near the surface represented by subducting plates.
The effect of chemical composition on the seismic velocity has been also suggested for explaining the velocity variation in the near-CMB region, particularly LLVPs, on the basis of normal mode seismology (Ishii and Tromp 1999), mineral physics (Karato and Karki, 2001), solid Earth tide measurements (Lau et al., 2017). Based on joint inversion of shear wave velocity and attenuation, Deschamps et al. (2019) infer a ∼4% iron excess from the basement CMB to 2,600 km depth in the western part of the Pacific LLVP, where a lower seismic velocity does not necessary indicate more buoyant. This compositional effect would further reduce the importance of the near-CMB region for generating driving force of mantle convection.
Within this context, the schematic model “top-down hemispherical dynamics” shown in Figure 6 is consistent with geophysical and geochemical observations, as well as numerical simulation discussed so far. While a hot plume in the Pacific could persist through the last 450 Myr (Zhang et al., 2010), the amalgamation of continents, Gondwana and Laurussia, was completed to form Pangea by ∼330 Ma (Hoffman, 1991; Scotese, 2004; Scotese, 2021). During this period, subduction zones surrounding the continent area and those between the continental pieces brought plate materials into the mantle beneath the continent domain (e.g., Figure 9) and created effectively the cold and hydrous hemisphere (Figures 5, 6).
The breakup of Pangea started at ∼175 Ma, but the cold and hydrous hemisphere could have remained as is demonstrated by the oceanic basalt composition (Figure 10) and the numerical simulation with the long-term influence to the heat flux through CMB (Figure 9). Yoshida and Hamano (2016) and Yoshida et al. (2017) performed a series of numerical simulations for a two-layer convection model with large viscosity contrasts: the outer cylindrical shell of a high Rayleigh number and the infinite Prandtl number and the inner shell with less viscous by up to 10–3. Although the viscosity contrast is less than that between the Earth’s mantle and the outer core, inspection of the simulation results concerning the convective patterns and the heat transfer between the two layers suggest that convection in the highly viscous mantle of the Earth controls that of the extremely low-viscosity outer core in a top-down manner under the thermal coupling mode, which may support the mantle-core connection of the model shown in Figure 6.
Gubbins et al. (2011) demonstrated that the thermal structure of the mantle controls the heat flux at the inner core surface, in which the Earth’s magnetic field is generated by a dynamo in the liquid iron core that convects in response to cooling of the overlying rocky mantle. Mantle convection extracts heat from the core according to the thermal lateral variations at and Gubbins et al. (2011) used geodynamo simulations to show that these variations are transferred to the inner-core boundary and can be large enough to cause heat flux variations at the inner core surface. Therefore, the hemispherical differences in the mantle temperature and heat flux at CMB as in Figure 9, which may be reflected partly as the horizontal variation in seismic velocity of the outermost outer core (Figure 2C, Tanaka and Hamaguchi, 1993), can cause hemispherical structures in the inner core through the thermal control.
Various mechanisms have been proposed as responsible for inducing the hemispherical seismic structure of the inner core (see Sumita and Bergman, 2015, for a comprehensive review). Of these, it has been suggested that the thermochemical coupling of the inner core with CMB and more heat extraction from the core in the eastern hemisphere create an increase in inner core growth rate that causes solidification texturing with a larger velocity (Aubert et al., 2008), although several studies propose that the differences may be a consequence of melting in the eastern hemisphere and freezing in the west (Alboussiere et al., 2010; Monnereau et al., 2010). Whatever the mechanism by which the hemispheric structure of the inner core was created, the striking similarity in spatial patterns that emerge in mantle geochemistry and inner core seismology (Figure 4) indicates that the mantle and the inner core may have been strongly coupled through global thermal structure.
4 Summary and conclusion
Large-scale structures in the Earth’s interior have been compared with respect to seismic velocity, electrical conductivity, and basalt composition. The most remarkable feature of the seismic velocity structure is the large horizontal variation in the shallow mantle (<700 km depth), which accounts for about 60% of the total amplitude of horizontal variation in the mantle, while only about 4% occurs in the deep mantle (>2,700 km depth) near CMB. These horizontal velocity variations are important in evaluating the driving force of mantle convection and indicate that the shallow mantle may outperform the deep mantle as a source field of driving force, represented by subduction force of plates. The horizontal velocity variation at the shallow mantle is characterized by a degree-1 structure with a larger amplitude, whereas the deep mantle is characterized by a degree-2 structure of a smaller amplitude. The former is attributed mostly to the ocean and continent hemispheres of the present-day Earth as a remnant of supercontinent-ocean system, whereas the latter is attributed to the two LLVPs. In addition, a degree-1 structure with clear east-west hemispheres exists in the inner core.
Since the seismic velocity structure is not sensitive to water/hydrogen contents within the plausible range in the mantle, the electrical conductivity structure provides important and complementary information. Although the global models of mantle electrical conductivity vary widely, high conductivity regions in and just below the mantle transition zones suggest an association with subducted plates and water. The water circulation is also captured by the young basalt geochemistry and its multivariate statistical analysis, independent component analysis (ICA). One of the independent components (IC2) has been found to represent a hydrophile component brought into the mantle 0.3 to 0.9 giga year ago and shows the presence of east–west geochemical hemispheres in the mantle, which strikingly resembles the inner core hemispheres in its geographical distribution.
To account for the observed large-scale geochemical structure, a hemispherical hydration event has been argued associated with the focused subduction towards the supercontinents (Pangea, Gondwana, and Rodinia). Numerical simulation of mantle convection with amalgamation-dispersal of the continents suggests that a cold hemispherical domain may develop under the continents during amalgamation and the supercontinent. Subduction zones must occur for the continents to get closer and amalgamated, where cold and hydrous materials are effectively brought into the mantle to result in formation of cold and hydrophile component-rich hemispherical domain beneath the supercontinent. Numerical simulations also suggest that once a cold hemispherical domain is created, even after the supercontinent begins to break up, it remains cooler than another hemispherical domain and has a larger heat flux through the CMB.
Based on these observations and numerical simulations, especially the geographical similarity between the mantle geochemical and the inner core hemispheres, a top-down hemispherical dynamics for the entire Earth was proposed (Figure 6): focused subduction towards the supercontinent, including the amalgamation stage of continents, has created a cold mantle domain rich in a hydrophile component, while the mantle in the remaining half of the globe (the remaining ocean region) has been relatively warm. Accordingly, the upper inner core has inherited its seismic heterogeneity through this mantle-induced lateral variations and thermochemical convective coupling via the outer core. The supercontinent then started to disperse into the present configuration, and the two main subduction zones have migrated apart, expanding the continental area. However, the planform area of the geochemical domain remains roughly constant, without moving with the dispersing continents, and therefore it has seemingly been anchored to the asthenosphere. This suggests that a strong asthenospheric flow such as superplume from the deep mantle may not be responsible for breakup and dispersal of the supercontinent, but near-surface forces associated with plate subduction might have driven the dispersal, which is consistent with the top-down hemispherical dynamics.
Author contributions
HI designed the outline of this work. HI, MY, HN discussed the contents and wrote the manuscript together, including figures, while being mainly responsible for the geochemical (HI, HN), geophysical (MY, HI), and synthesis (HI, MY, HN) parts of the project, respectively.
Funding
This work was supported by JSPS KAKENHI Grant Numbers JP26247091, JP18H03747 for HI, and JP23340132, JP22K03787 for MY.
Acknowledgments
The authors would like to thank Satoru Tanaka, Masayuki Obayashi, Daisuke Suetsugu for their discussion and supports. Figure 1A was illustrated through the SubMachine web portal (http://submachine.earth.ox.ac.uk/).
Conflict of interest
The authors declare that the research was conducted in the absence of any commercial or financial relationships that could be construed as a potential conflict of interest.
Publisher’s note
All claims expressed in this article are solely those of the authors and do not necessarily represent those of their affiliated organizations, or those of the publisher, the editors and the reviewers. Any product that may be evaluated in this article, or claim that may be made by its manufacturer, is not guaranteed or endorsed by the publisher.
References
Alboussiere, T., Deguen, R., and Melzani, M. (2010). Melting-induced stratification above the Earth's inner core due to convective translation. Nature 466, 744–747. doi:10.1038/nature09257
Allègre, C. J., Hamelin, B., Provost, A., and Dupré, B. (1987). Topology in isotopic multispace and origin of mantle chemical heterogeneities. Earth Planet. Sci. Lett. 81, 319–337. doi:10.1016/0012-821x(87)90120-8
Allègre, C. J., and Lewin, E. (1995). Scaling laws and geochemical distributions. Earth Planet. Sci. Lett. 132, 1–13. doi:10.1016/0012-821x(95)00049-i
Allègre, C. J. (1997). Limitation on the mass exchange between the upper and lower mantle : The evolving convection regime of the earth. Earth Planet. Sci. Lett. 150, 1–6. doi:10.1016/s0012-821x(97)00072-1
Allègre, C. J., and Turcotte, D. L. (1986). Implications of a two-component marble-cake mantle. Nature 323, 123–127. doi:10.1038/323123a0
Aubert, J., Amit, H., Hulot, G., and Olson, P. (2008). Thermochemical flows couple the Earth's inner core growth to mantle heterogeneity. Nature 454, 758–761. doi:10.1038/nature07109
Baker, M. B., and Stolper, E. M. (1994). Determining the composition of high-pressure mantle melts using diamond aggregates. Geochim. Cosmochim. Acta 58, 2811–2827. doi:10.1016/0016-7037(94)90116-3
Ballmer, M. D., Houser, C., Hernlund, J. W., Wentzcovitch, R. M., and Hirose, K. (2017). Persistence of strong silica-enriched domains in the Earth’s lower mantle. Nat. Geosci. 10, 236–240. doi:10.1038/ngeo2898
Bercovici, D., and Karato, S. (2003). Whole-mantle convection and the transition-zone water filter. Nature 425, 39–44. doi:10.1038/nature01918
Brodholt, J., and Badro, J. (2017). Composition of the low seismic velocity E’ layer at the top of Earth’s core. Geophys. Res. Lett. 44, 8303–8310. doi:10.1002/2017GL074261
Busse, F. H. (1975). A model of the geodynamo. Geophys. J. R. Astronomical Soc. 42, 437–459. doi:10.1111/j.1365-246x.1975.tb05871.x
Cao, A., and Romanowicz, B. (2004). Hemispherical transition of seismic attenuation at the top of the Earth’s inner core. Earth Planet. Sci. Lett. 228, 243–253. doi:10.1016/j.epsl.2004.09.032
Christensen, U. R., and Hofmann, A. W. (1994). Segregation of subducted oceanic crust in the convecting mantle. J. Geophys. Res. 99, 19867–19884. doi:10.1029/93jb03403
Coltice, N., Gérault, M., and Ulvrová, M. (2017). A mantle convection perspective on global tectonics. Earth. Sci. Rev. 165, 120–150. doi:10.1016/j.earscirev.2016.11.006
Connolly, J. A. D. (2005). Computation of phase equilibria by linear programming : A tool for geodynamic modeling and its application to subduction zone decarbonation. Earth Planet. Sci. Lett. 236, 524–541. doi:10.1016/j.epsl.2005.04.033
Creager, K. C. (1999). Large-scale variations in inner core anisotropy. J. Geophys. Res. 104 (10), 23127–23139. doi:10.1029/1999jb900162
Deschamps, F., Konishi, K., Fuji, N., and Cobden, L. (2019). Radial thermo-chemical structure beneath Western and Northern Pacific from seismic waveform inversion. Earth Planet. Sci. Lett. 520, 153–163. doi:10.1016/j.epsl.2019.05.040
Deuss, A., Irving, J., and Woodhouse, J. (2010). Regional variation of inner core anisotropy from seismic normal mode observations. Science 328, 1018–1020. doi:10.1126/science.1188596
Dupré, B., and Allègre, C. J. (1983). Pb–Sr isotope variation in Indian Ocean basalts and mixing phenomena. Nature 303, 142–146. doi:10.1038/303142a0
Fearn, D. R., and Loper, D. E. (1981). Compositional convection and stratification of Earth's core. Nature 289, 393–394. doi:10.1038/289393a0
Fukao, Y., Widiyantoro, S., and Obayashi, M. (2001). Stagnant slabs in the upper and lower mantle transition region. Rev. Geophys. 39, 291–323. doi:10.1029/1999rg000068
Garcia, R. (2002). Constraints on upper inner-core structure from waveform inversion of core phases. Geophys. J. Int. 150 (3), 651–664. doi:10.1046/j.1365-246x.2002.01717.x
Garcia, R., and Souriau, A. (2000). Inner core anisotropy and heterogeneity level. Geophys. Res. Lett. 27 (19), 3121–3124. doi:10.1029/2000gl008520
Garnero, E. J., McNamara, A. K., and Shim, S.-H. (2016). Continent-sized anomalous zones with low seismic velocity at the base of Earth’s mantle. Nat. Geosci. 9, 481–489. doi:10.1038/NGEO2733
Ghiorso, M. S. (1994). Algorithms for the estimation of phase stability in heterogeneous thermodynamic systems. Geochim. Cosmochim. Acta 58, 5489–5501. doi:10.1016/0016-7037(94)90245-3
Grand, S. P. (2002). Mantle shear-wave tomography and the fate of subducted slabs. Philosophical Trans. R. Soc. Lond. Ser. A Math. Phys. Eng. Sci. 360, 2475–2491. doi:10.1098/rsta.2002.1077
Gubbins, D., Sreenivasan, B., Mound, J., and Rost, S. (2011). Melting of the Earth’s inner core. Nature 473, 361–363. doi:10.1038/nature10068
Hart, S. R. (1984). A large-scale isotope anomaly in the Southern Hemisphere mantle. Nature 309, 753–757. doi:10.1038/309753a0
Hart, S. R., Hauri, E. H., Oschmann, L. A., and Whitehead, J. A. (1992). Mantle plumes and entrainment: Isotopic evidence. Science 256, 517–520. doi:10.1126/science.256.5056.517
Helffrich, G., and Kaneshima, S. (2010). Outer-core compositional stratification from observed core wave speed profiles. Nature 468, 807–810. doi:10.1038/nature09636
Hirose, K., and Kushiro, I. (1993). Partial melting of dry peridotites at high pressures: Determination of compositions of melts segregated from peridotite using aggregates of diamond. Earth Planet. Sci. Lett. 114, 477–489. doi:10.1016/0012-821x(93)90077-m
Hirschmann, M. M. (2006). Water, melting, and the deep Earth H2O cycle. Annu. Rev. Earth Planet. Sci. 34, 629–653. doi:10.1146/annurev.earth.34.031405.125211
Hoffman, P. F. (1991). Did the breakout of laurentia turn gondwanaland inside-out? Science 252, 1409–1412. doi:10.1126/science.252.5011.1409
Hofmann, A. W. (1997). Mantle geochemistry: The message from oceanic volcanism. Nature 385, 219–229. doi:10.1038/385219a0
Hofmann, A. W. (2003). “Sampling mantle heterogeneity through oceanic basalts: Isotopes and trace elements,” in The mantle and core, treatise on geochemistry 2. Editor R. W. Carlson (Amsterdam: Elsevier), 61–101.
Hofmann, A. W., and White, B. (1982). Mantle plumes from ancient oceanic crust. Earth Planet. Sci. Lett. 57, 421–436. doi:10.1016/0012-821x(82)90161-3
Holland, T. J. B., and Powell, R. (1998). An internally consistent thermodynamic data set for phases of petrological interest. J. Metamorph. Geol. 16, 309–343. doi:10.1111/j.1525-1314.1998.00140.x
Horiuchi, S., and Iwamori, H. (2016). A consistent model for fluid distribution, viscosity distribution, and flow-thermal structure in subduction zone. J. Geophys. Res. Solid Earth 121, 3238–3260. doi:10.1002/2015JB012384
Hosseini, K., Sigloch, K., Tsekhmistrenko, M., Zaheri, A., Nissen-Meyer, T., and Igel, H. (2020). Global mantle structure from multifrequency tomography using P, PP and P-diffracted waves. Geophys. J. Int. 220 (1), 96–141. doi:10.1093/gji/ggz394
Houser, C., Masters, G., Shearer, P., and Laske, G. (2008). Shear and compressional velocity models of the mantle from cluster analysis of long-period waveforms. Geophys. J. Int. 174, 195–212. doi:10.1111/j.1365-246x.2008.03763.x
Hyvärinen, A., Karhunen, J., and Oja, E. (2001). Independent component analysis. New York: John Wiley & Sons.
Iritani, R., Kawakatsu, H., and Takeuchi, N. (2019). Sharpness of the hemispherical boundary in the inner core beneath the northern Pacific. Earth Planet. Sci. Lett. 527, 115796. doi:10.1016/j.epsl.2019.115796
Irving, J. C. E., and Deuss, A. (2011). Hemispherical structure in inner core velocity anisotropy. J. Geophys. Res. 116 (4), B04307. doi:10.1029/2010jb007942
Ishii, M., and Tromp, J. (1999). Normal-mode and free-air gravity constraints on lateral variations in velocity and density of Earth's mantle. Science 285, 1231–1236. doi:10.1126/science.285.5431.1231
Iwamori, H., and Albarède, F. (2008). Decoupled isotopic record of ridge and subduction zone processes in oceanic basalts by independent component analysis. Geochem. Geophys. Geosyst. 9. doi:10.1029/2007GC001753
Iwamori, H., Albarède, F., and Nakamura, H. (2010). Global structure of mantle isotopic heterogeneity and its implications for mantle differentiation and convection. Earth Planet. Sci. Lett. 299, 339–351. doi:10.1016/j.epsl.2010.09.014
Iwamori, H., and Nakakuki, T. (2013). “Fluid processes in subduction zones and water transport to the deep mantle,” in Physics and chemistry of the deep Earth. Editor S. Karato (New York: John Wiley & Sons), 372–391. doi:10.1002/9781118529492.ch13
Iwamori, H., and Nakamura, H. (2012). East-west mantle geochemical hemispheres constrained from Independent Component Analysis of basalt isotopic compositions. Geochem. J. 46, e39–e46. doi:10.2343/geochemj.2.0224
Iwamori, H., and Nakamura, H. (2015). Isotopic heterogeneity of oceanic, arc and continental basalts and its implications for mantle dynamics. Gondwana Res. 27, 1131–1152. doi:10.1016/j.gr.2014.09.003
Iwamori, H., Nakamura, H., Yoshida, M., Nakagawa, T., Ueki, K., Nakao, A., et al. (2019). Trace-element characteristics of east–west mantle geochemical hemispheres. Comptes Rendus Geosci. 351, 209–220. doi:10.1016/j.crte.2018.09.007
Iwamori, H. (1998). Transportation of H2O and melting in subduction zones. Earth Planet. Sci. Lett. 160, 65–80. doi:10.1016/S0012-821X(98)00080-6
Iwamori, H. (2007). Transportation of H2O beneath the Japan arcs and its implications for global water circulation. Chem. Geol. 239, 182–198
Iwamori, H., Ueki, K., Hoshide, T., Sakuma, H., Ichiki, M., Watanabe, T., et al. (2021). Simultaneous analysis of seismic velocity and electrical conductivity in the crust and the uppermost mantle: A forward model and inversion test based on grid search. JGR. Solid Earth 126, e2021JB022307. doi:10.1029/2021JB022307
Jacobsen, S. B., and Wasserburg, G. J. (1979). The mean age of mantle and crustal reservoirs. J. Geophys. Res. 84, 7411–7427. doi:10.1029/JB084iB13p07411
Jaques, A. L., and Green, D. H. (1979). Determination of liquid compositions in high-pressure melting of peridotite. J. Pet. 64, 1312–1321.
Kaneshima, S. (2018). Array analyses of SmKS waves and the stratification of Earth's outermost core. Phys. Earth Planet. Interiors 276, 234–246. doi:10.1016/j.pepi.2017.03.006
Karato, S. (2008). Deformation of Earth materials: Introduction to the rheology of the solid Earth. Cambridge: Cambridge University Press, 463.
Karato, S., and Karki, B. B. (2001). Origin of lateral variation of seismic wave velocities and density in the deep mantle. J. Geophys. Res. 106 (B10), 21771–21783. doi:10.1029/2001jb000214
Karato, S. (2011). Water distribution across the mantle transition zone and its implications for global material circulation. Earth Planet. Sci. Lett. 301, 413–423. doi:10.1016/j.epsl.2010.11.038
Katsura, T., Yoneda, A., Yamazaki, D., Yoshino, T., and Ito, E. (2010). Adiabatic temperature profile in the mantle. Phys. Earth Planet. Interiors 183, 212–218. doi:10.1016/j.pepi.2010.07.001
Kelbert, A., Schultz, A., and Egbert, G. (2009). Global electromagnetic induction constraints on transition-zone water content variations. Nature 460, 1003–1006. doi:10.1038/nature08257
Kellogg, J. B., Jacobsen, S. B., and O'Connell, J. (2007). Modeling lead isotopic heterogeneity in mid-ocean ridge basalts. Earth Planet. Sci. Lett. 262, 328–342. doi:10.1016/j.epsl.2007.06.018
Kellogg, J. B., Jacobsen, S. B., and O'Connell, R. J. (2002). Modeling the distribution of isotopic ratios in geochemical reservoirs. Earth Planet. Sci. Lett. 204, 183–202. doi:10.1016/s0012-821x(02)00981-0
Kellogg, L. H., Hager, B. H., and van der Hilst, R. D. (1999). Compositional stratification in the deep mantle. Science 283, 1881–1884. doi:10.1126/science.283.5409.1881
Kustowski, B., Ekstrom, G., and Dziewonski, A. M. (2008). The anisotropic shear-wave velocity structure of the Earth’s mantle. J. geophys. Res., 1390. doi:10.1029/2007JB005169
Kuvshinov, A., Grayver, A., Tøffner-Clausen, L., and Olsen, N. (2021). Probing 3-D electrical conductivity of the mantle using 6 years of Swarm, CryoSat-2 and observatory magnetic data and exploiting matrix Q-responses approach. Earth Planets Space 73, 67. doi:10.1186/s40623-020-01341-9
Lau, H. C., Mitrovica, J. X., Davis, J. L., Tromp, J., Yang, H. Y., and Al-Attar, D. (2017). Tidal tomography constrains Earth’s deep-mantle buoyancy. Nature 551, 321–326. doi:10.1038/nature24452
Lawrence, J. F., and Shearer, P. M. (2008). Imaging mantle transition zone thickness with SdS-SS finite-frequency sensitivity kernels. Geophys. J. Int. 174, 143–158. doi:10.1111/j.1365-246x.2007.03673.x
Lay, T., and Garnero, E. J. (2007). “Reconciling the post-perovskite phase with seismological observations of lowermost mantle structure,” in Post-perovskite : The last mantle phase transition. Editors K. Hilrose, J. Brodholt, T. Lay, and D. Yuen (Washington, D.C: Am. Geophys. Union), 120–153. Geophys. Monogr. 174. doi:10.1029/174GM11
Lay, T. (1989). Structure of the core-mantle transition zone: A chemical and thermal boundary layer. Eos Trans. AGU. 70, 49–59. doi:10.1029/89eo00024
Lehnert, K., Su, Y., Langmuir, C., Sarbas, B., and Nohl, U. (2000). A global geochemical database structure for rocks. Geochem. Geophys. Geosyst. 1. doi:10.1029/1999GC000026
Li, S., Weng, A., Zhang, Y., Schultz, A., Li, Y., Tang, Y., et al. (2020). Desloratadine ameliorates olfactory disorder and suppresses AMPA receptor GluA1 expression in allergic rhinitis rat. Arch. Immunol. Ther. Exp. 21, 6. doi:10.1007/s00005-020-00569-3
Li, Z. X., Mitchell, R. N., Spencer, C. J., Ernst, R., Pisarevsky, S., Kirscher, U., et al. (2019). Decoding Earth’s rhythms: Modulation of supercontinent cycles by longer superocean episodes. Precambrian Res. 323, 1–5. doi:10.1016/j.precamres.2019.01.009
Lythgoe, K. H., Deuss, A., Rudge, J. F., and Neufeld, J. A. (2014). Earth’s inner core: Innermost inner core or hemispherical variations? Earth Planet. Sci. Lett. 385, 181–189. doi:10.1016/j.epsl.2013.10.049
McKenzie, D., and Bickle, M. J. (1988). The volume and composition of melt generated by extension of the lithosphere. J. Petrology 29, 625–679. doi:10.1093/petrology/29.3.625
McKenzie, D., and O'Nions, R. K. (1991). Partial melt distributions from inversion of rare Earth element concentrations. J. Petrology 32, 1021–1091. doi:10.1093/petrology/32.5.1021
McKenzie, D., Stracke, A., Blichert-Toft, J., Albarède, F., Grönvold, K., and O'Nions, K. (2004). Source enrichment processes responsible for isotopic anomalies in oceanic island basalts. Geochim. Cosmochim. Acta 68, 2699–2724. doi:10.1016/j.gca.2003.10.029
Merdith, A. S., Collins, A. S., Williams, S. E., Pisarevsky, S., Foden, J. D., Archibald, D. B., et al. (2017). A full-plate global reconstruction of the Neoproterozoic. Gondwana Res. 50, 84–134. doi:10.1016/j.gr.2017.04.001
Merdith, A. S., Williams, S. E., Collins, A. S., Tetley, M. G., Mulder, J. A., Blades, M. L., et al. (2021). Extending full-plate tectonic models into deep time: Linking the Neoproterozoic and the Phanerozoic. Earth. Sci. Rev. 214, 103477. doi:10.1016/j.earscirev.2020.103477
Mitchell, R. N., Zhang, N., Salminen, J., Liu, Y., Spencer, C. J., Steinberger, B., et al. (2021). The supercontinent cycle. Nat. Rev. Earth Environ. 2, 358–374. doi:10.1038/s43017-021-00160-0
Monnereau, M., Calvet, M., Margerin, L., and Souriau, A. (2010). Lopsided growth of Earth's inner core. Science 328, 1014–1017. doi:10.1126/science.1186212
Morris, J. D., and Hart, S. R. (1983). Isotopic and incompatible element constraints on the Genesis of island arc volcanics from Cold Bay and Amak Island, Aleutians, and implications for mantle structure. Geochim. Cosmochim. Acta 47, 2015–2030. doi:10.1016/0016-7037(83)90217-X
Nakagawa, T., Iwamori, H., Yanagi, R., and Nakao, A. (2018). On the evolution of the water ocean in the plate-mantle system. Prog. Earth Planet. Sci. 5, 51. doi:10.1186/s40645-018-0209-2
Nakagawa, T., Tackley, P. J., Deschamps, F., and Connolly, J. A. (2010). The influence of MORB and harzburgite composition on thermo-chemical mantle convection in a 3-D spherical shell with self-consistently calculated mineral physics. Earth Planet. Sci. Lett. 296 (3–4), 403–412. doi:10.1016/j.epsl.2010.05.026
Nakamura, H., and Iwamori, H. (2009). Contribution of slab-fluid in arc magmas beneath the Japan arcs. Gondwana Res. 16, 431–445. doi:10.1016/j.gr.2009.05.004
Nakamura, H., and Iwamori, H. (2013). Generation of adakites in a cold subduction zone due to double subducting plates. Contrib. Mineral. Pet. 165, 1107–1134. doi:10.1007/s00410-013-0850-0
Nakao, A., Iwamori, H., and Nakakuki, T. (2016). Effects of water transportation on subduction dynamics: Roles of viscosity and density reduction. Earth Planet. Sci. Lett. 454, 178–191. doi:10.1016/j.epsl.2016.08.016
Niu, F. L., and Wen, L. X. (2001). Hemispherical variations in seismic velocity at the top of the Earth’s inner core. Nature 410, 1081–1084. doi:10.1038/35074073
Obayashi, M., Yoshimitsu, J., Nolet, G., Fukao, Y., Shiobara, H., Sugioka, H., et al. (2013). Finite frequency whole mantle P wave tomography: Improvement of subducted slab images. Geophys. Res. Lett. 40 (21), 5652–5657. doi:10.1002/2013gl057401
Olson, P., Landeau, M., and Reynolds, E. (2018). Outer core stratification from the high latitude structure of the geomagnetic field. Front. Earth Sci. 6, 140. doi:10.3389/feart.2018.00140
OʼNions, R. K., Evensen, N. M., and Hamilton, P. J. (1979). Geochemical modeling of mantle differentiation and crustal growth. J. Geophys. Res. 84, 6091–6101. doi:10.1029/JB084iB11p06091
Oreshin, S. I., and Vinnik, L. P. (2004). Heterogeneity and anisotropy of seismic attenuation in the inner core. Geophys. Res. Lett. 31. doi:10.1029/2003GL018591
Panning, M., and Romanowicz, B. (2006). A three dimensional radially anisotropic model of shear velocity in the whole mantle. Geophys. J. Int. 167, 361–379. doi:10.1111/j.1365-246X.2006.03100.x
Pearce, J. A., Stern, R. J., Bloomer, S. H., and Fryer, P. (2005). Geochemical mapping of the mariana arc-basin system: Implications for the nature and distribution of subduction components. Geochem. Geophys. Geosyst. 6, Q07006. doi:10.1029/2004GC000895
Phillips, B. R., and Bunge, H.-P. (2005). Heterogeneity and time dependence in 3D spherical mantle convection models with continental drift. Earth Planet. Sci. Lett. 233 (1–2), 121–135. doi:10.1016/j.epsl.2005.01.041
Phillips, B. R., and Bunge, H.-P. (2007). Supercontinent cycles disrupted by strong mantle plumes. Geol. 35 (9), 847–850. doi:10.1130/G23686A.1
Ricard, Y., Doglioni, C., and Sabadini, R. (1991). Differential rotation between lithosphere and mantle : A consequence of lateral mantle viscosity variations. J. Geophys. Res. 96, 8407–8415. doi:10.1029/91jb00204
Richard, G. C., and Iwamori, H. (2010). Stagnant slab, wet plumes and Cenozoic volcanism in East Asia. Phys. Earth Planet. Interiors 183, 280–287. doi:10.1016/j.pepi.2010.02.009
Ritsema, J., Deuss, A., van Heijst, H. J., and Woodhouse, J. H. (2011). S40RTS: A degree-40 shear-velocity model for the mantle from new Rayleigh wave dispersion, teleseismic traveltime and normal-mode splitting function measurements. Geophys. J. Int. 184, 1223–1236. doi:10.1111/j.1365-246X.2010.04884.x
Rudge, J. F. (2006). Mantle pseudo-isochrons revisited. Earth Planet. Sci. Lett. 249, 494–513. doi:10.1016/j.epsl.2006.06.046
Rudge, J. F., McKenzie, D., and Haynes, P. H. (2005). A theoretical approach to understanding the isotopic heterogeneity of mid-ocean ridge basalt. Geochim. Cosmochim. Acta 69, 3873–3887. doi:10.1016/j.gca.2005.03.004
Schmidt, M. W., and Poli, S. (1998). Experimentally based water budgets for dehydrating slabs and consequences for arc magma generation. Earth Planet. Sci. Lett. 163, 361–379. doi:10.1016/s0012-821x(98)00142-3
Schubert, G., Turcotte, D. L., and Olson, P. (2001). Mantle convection in the Earth and planets. Cambridge: Cambridge University Press.
Scotese, C. R. (2021). An atlas of Phanerozoic paleogeographic maps: The seas come in and the seas go out. Annu. Rev. Earth Planet. Sci. 49, 679–728. doi:10.1146/annurev-earth-081320-064052
Semenov, A., and Kuvshinov, A. (2012). Global 3-D imaging of mantle electrical conductivity based on inversion of observatory C-responses - II. Data analysis and results. Geophys. J. Int. 191, 965–992.
Simmons, N. A., Forte, A. M., and Grand, S. P. (2009). Joint seismic, geodynamic and mineral physical constraints on three-dimensional mantle heterogeneity: Implications for the relative importance of thermal versus compositional heterogeneity. Geophys. J. Int. 177, 1284–1304. doi:10.1111/j.1365-246x.2009.04133.x
Souriau, A. (2007). “Deep Earth structure -the Earth’s cores,” in Seismology and the Structure of the Earth, Treatise on geophysics 1. Editor G. Schubert (Amsterdam: Elsevier), 655–693. Chap.19.
Stacey, F. D., and Davis, P. M. (2008). Physics of the Earth. fourth ed. Cambridge: Cambridge University Press.
Sumita, I., and Bergman, M. (2015). “Inner core dynamics,” in Core dynamics, Treatise in geophysics 8. Editors P. Olson, and G. Schubert (Amsterdam: Elsevier), 297–316. Chap.12.
Sun, J., Kelbert, A., and Egbert, G. D. (2015). Ionospheric current source modeling and global geomagnetic induction using ground geomagnetic observatory data. JGR. Solid Earth 120, 6771–6796. doi:10.1002/2015JB012063
Sun, X. L., and Song, X. D. (2008). Tomographic inversion for three-dimensional anisotropy of Earth’s inner core. Phys. Earth Planet. Interiors 167, 53–70. doi:10.1016/j.pepi.2008.02.011
Syracuse, E. M., van Keken, P. E., and Abers, G. A. (2010). The global range of subduction zone thermal models. Phys. Earth Planet. Interiors 183, 73–90. doi:10.1016/j.pepi.2010.02.004
Tackley, P. J. (2000). Mantle convection and plate tectonics: Toward an integrated physical and chemical theory. Science 288, 2002–2007. doi:10.1126/science.288.5473.2002
Tackley, P. J. (2008). Modelling compressible mantle convection with large viscosity contrasts in a three-dimensional spherical shell using the yin–yang grid. Phys. Earth Planet. Interiors 171, 7–18. doi:10.1016/j.pepi.2008.08.005
Takahashi, E., and Kushiro, I. (1983). Melting of a dry peridotite at high pressures and basalt magma Genesis. Am. Mineral. 68, 859–879.
Takeuchi, N. (2012). Detection of ridge-like structures in the pacific large low-shear-velocity province. Earth Planet. Sci. Lett. 319-320, 55–64. doi:10.1016/j.epsl.2011.12.024
Takeuchi, N. (2007). Whole mantle SH velocity model constrained by waveform inversion based on three-dimensional Born kernels. Geophys. J. Int. 169, 1153–1163. doi:10.1111/j.1365-246x.2007.03405.x
Tanaka, S. (2012). Depth extent of hemispherical inner core from PKP(DF) and PKP(Cdiff) for equatorial paths. Phys. Earth Planet. Interiors 210–211, 50–62. doi:10.1016/j.pepi.2012.08.001
Tanaka, S., and Hamaguchi, H. (1997). Degree one heterogeneity and hemispherical variation of anisotropy in the inner core from PKP(BC)–PKP(DF) times. J. Geophys. Res. 102, 2925–2938. doi:10.1029/96jb03187
Tanaka, S., and Hamaguchi, H. (1993). Degree one heterogeneity at the top of the Earth's core, revealed by SINKS travel times. Geophys. Monogr. Ser. 72, 127–134. AGU, Washington, D.C. doi:10.1029/GM072p0127
Ueki, K., and Iwamori, H. (2014). Thermodynamic calculations of the polybaric melting phase relations of spinel lherzolite. Geochem. Geophys. Geosyst. 15, 5015–5033. doi:10.1002/2014GC005546
Ueki, K., and Iwamori, H. (2013). Thermodynamic model for partial melting of peridotite by system energy minimization. Geochem. Geophys. Geosyst. 14, 342–366. doi:10.1029/2012GC004143
Wang, C., Mitchell, R. N., Murphy, J. B., Peng, P., and Spencer, C. J. (2021). The role of megacontinents in the supercontinent cycle. Geology 49, 402–406. doi:10.1130/G47988.1
Waszek, L., and Deuss, A. (2011). Distinct layering in the hemispherical seismic velocity structure of Earth’s upper inner core. J. Geophys. Res. 116 (12), B12313. doi:10.1029/2011jb008650
Waszek, L., Irving, J., and Deuss, A. (2011). Reconciling the hemispherical structure of Earth’s inner core with its super-rotation. Nat. Geosci. 4, 264–267. doi:10.1038/ngeo1083
Wen, L., and Niu, F. (2002). Seismic velocity and attenuation structures in the top of the Earth’s inner core. J. Geophys. Res. 107 (B11), ESE 2-1–ESE 2-13. doi:10.1029/2001jb000170
White, W. M. (1985). Sources of oceanic basalts: Radiogenic isotopic evidence. Geol. 13, 115–118. doi:10.1130/0091-7613(1985)13<115:soobri>2.0.co;2
Yoshida, M., and Hamano, Y. (2016). Numerical studies on the dynamics of two-layer Rayleigh-Bénard convection with an infinite Prandtl number and large viscosity contrasts. Phys. Fluids 28 (11), 116601. doi:10.1063/1.4966685
Yoshida, M., Iwamori, H., Hamano, Y., and Suetsugu, D. (2017). Heat transport and coupling modes in Rayleigh–Bénard convection occurring between two layers with largely different viscosities. Phys. Fluids 29 (9), 096602. doi:10.1063/1.4989592
Yoshida, M. (2013). Mantle temperature under drifting deformable continents during the supercontinent cycle. Geophys. Res. Lett. 40, 681–686. doi:10.1002/GRL.50151
Yoshida, M. (2010). Temporal evolution of the stress state in a supercontinent during mantle reorganization. Geophys. J. Int. 180 (1), 1–22. doi:10.1111/j.1365-246X.2009.04399.x
Zhang, N., Zhong, S., Leng, W., and Li, Z.-X. (2010). A model for the evolution of the Earth's mantle structure since the Early Paleozoic. J. Geophys. Res. 115, B06401. doi:10.1029/2009JB006896
Zhong, S., Zhang, N., Li, Z. X., and Roberts, J. H. (2007). Supercontinent cycles, true polar wander, and very long-wavelength mantle convection. Earth Planet. Sci. Lett. 261, 551–564. doi:10.1016/j.epsl.2007.07.049
Zindler, A., and Hart, S. R. (1986). Chemical geodynamics. Annu. Rev. Earth Planet. Sci. 14, 493–571. doi:10.1146/annurev.ea.14.050186.002425
Zindler, A., Jagoutz, E., and Goldstein, S. (1982). Nd, Sr and Pb isotopic systematics in a three-component mantle: A new perspective. Nature 298, 519–523. doi:10.1038/298519a0
Keywords: supercontinent, mantle, core, hemisphere, geochemistry, fluid, seismic velocity, electrical conductivity
Citation: Iwamori H, Yoshida M and Nakamura H (2022) Large-scale structures in the Earth’s interior: Top-down hemispherical dynamics constrained by geochemical and geophysical approaches. Front. Earth Sci. 10:1033378. doi: 10.3389/feart.2022.1033378
Received: 31 August 2022; Accepted: 25 November 2022;
Published: 09 December 2022.
Edited by:
Nobuaki Fuji, UMR7154 Institut de Physique du Globe de Paris (IPGP), FranceReviewed by:
Jie Deng, Princeton University, United StatesKenneth T. Koga, Université d'Orléans, France
Copyright © 2022 Iwamori, Yoshida and Nakamura. This is an open-access article distributed under the terms of the Creative Commons Attribution License (CC BY). The use, distribution or reproduction in other forums is permitted, provided the original author(s) and the copyright owner(s) are credited and that the original publication in this journal is cited, in accordance with accepted academic practice. No use, distribution or reproduction is permitted which does not comply with these terms.
*Correspondence: Hikaru Iwamori, aGl3YW1vcmlAZXJpLnUtdG9reW8uYWMuanA=