 Orlando Álvarez
 Mario Gimenez
 Andrés Folguera
- 1Instituto Geofísico y Sismológico Ing. F.S. Volponi, FCEFyN, Universidad Nacional de San Juan, San Juan, Argentina
- 2Consejo Nacional de Investigaciones Científicas y Técnicas, Buenos Aires, Argentina
- 3IDEAN—Instituto de Estudios Andinos “Don Pablo Groeber”, Departamento de Cs. Geológicas, FCEN, Universidad de Buenos Aires, Buenos Aires, Argentina
Over the past decade, the three largest and most destructive earthquakes in recent history with associated tsunamis occurred: the Mw = 9.2 Sumatra-Andamam in 2004, then the Mw = 8.8 Maule in 2010, and finally the Mw = 9.1 Tohoku- Oki in 2011. Due to the technological and scientific developments achieved in recent decades, it has been possible to study and model these phenomena with unprecedented resolution and precision. In addition to the coseismic slip models, for which joint inversions of data from various sources are carried out (e.g., teleseismic data, GNSS, INSAR, and Tsunami, among others), depicting the space-time evolution of the rupture, we have high-resolution models of the degree of interseismic coupling (based on GNSS) and also maps of seismic b-value changes. Among these advances, new Earth gravity field models allow mapping densities distribution homogeneously and with a resolution (in wavelengths) of approximately the large rupture areas of great megathrust earthquakes. In this regard, the maximum resolution of GOCE-derived static models is in the order of λ/2≈66 km, while GRACE monthly solutions are in the order of λ/2≈300 km. From the study of the static and dynamic gravitational field, it has been possible to infer mass displacements associated with these events, which have been modeled and compared to the deformation inferred using other methods, yielding very good results. In this work we study the kinematic behavior of the rupture process for one of these largest events, the Mw = 9.1 Tohoku-Oki 2011 earthquake, employing the vertical gradient of gravity derived from the GOCE satellite, finding that the maximum slip occurred close to a lobe of minimum Tzz, as was observed for other case-studies in other subduction-related settings studied in previous works (e.g., the Maule earthquake and the Sumatra-Andaman earthquake, among others). In addition, from the rupture propagation using kinematic models, it can be observed that the rupture is arrested when it approaches high-density structures and, it is enhanced when connecting with lobes of low vertical gravity gradient. We also mapped a block expressed as a low Tzz lobe, developed along the marine forearc, which is controlled by a parallel-to-the-trench normal fault that accommodates subsidence during the interseismic period, as it is coupled with the subducted slab. Then, after rupturing the plate interface, this block is decoupled promoting tectonic inversion and uplift. In this way, the hypothesis that the density structure along the forearc is the ultimate first-order factor that governs the rupture process is reinforced.
Introduction
From the pioneer works of Song and Simons (2003) and Wells et al. (2003), who related trench parallel gravity lows to rupture areas of great megathrust earthquakes, and with the advent of improved satellite gravity missions (e.g., Gravity Recovery and Climatic Experiment-GRACE, Gravity field and steady-state Ocean Circulation Explorer-GOCE and now GRACE-FO), the study of large earthquakes got a new impulse with data completely independent of terrestrial acquired data (e.g., seismological, Global Navigation Satellite Systems-GNSS, etc.). This has the advantage of counting with a homogeneous spatial coverage, where other data are scarce or non-existent, and also overcoming the “shoreline” problem. From these missions, it has been possible to detect crustal mass changes and mass redistributions within the Earth throughout the complete seismic cycle. As previously explained by Han et al. (2011), the Earth’s interior deformation (including changes in intrinsic density or volume, and vertical deformation of the discontinuities related to density stratification of the interior) can be addressed better through gravimetric observations (Okubo, 1992; Pollitz, 1997) than by other geodetic techniques that account more sharply the surface displacement (e.g., GNSS and Interferometric Synthetic Aperture Radar-InSAR).
Coseismic gravity changes were detected for the last three major great megathrust earthquakes: the Mw=9.0–9.3, 2004 Sumatra- Andaman earthquake (e.g., Han et al., 2006; Panet et al., 2007; Panet et al., 2010; Wang et al., 2012c), the Mw = 8.8 2010 Central Chile (Maule) earthquake (e.g., Han et al., 2010; Heki and Matsuo, 2010; Han et al., 2011; Matsuo and Heki, 2011; Wang et al., 2012a; Zhou et al., 2012; Zhou et al., 2014) and for the Mw=9.1 2011 Tohoku-Oki earthquake (e.g., Han et al., 2011; Han et al., 2014; Matsuo and Heki 2011; Wang et al., 2012b; Cambiotti and Sabadini, 2012; Cambiotti and Sabadini, 2013; Fuchs et al., 2013; Fuchs et al., 2015; Fuchs et al., 2016). These findings depicted positive gravity changes over the main coseismic slip and negative changes in the Earth’s gravitational field at the back-arc side of the rupture area.
Moreover, some authors detected permanent gravity changes associated not only with coseismic slip but with postseismic deformation or after-slip (e.g., Han et al., 2006 for Sumatra-Andaman; Han et al., 2010 Maule-Chile earthquake; Wang et al. (2012b) and Han et al., 2011 for Tohoku-Oki earthquake), results that are in good agreement with postseismic slip models inverted from GPS data. In particular, Ogawa and Heki (2007) found postseismic recovery of gravity decreased with a time constant of ∼0.6 years after the 2004 Sumatra- Andaman earthquake.
The Tohoku-Oki earthquake (38.10°N, 142.86°E, and 24 km depth), stroke offshore the NE part of the Honsu Island (Japan) on 11 March 2011, and ruptured a fault segment of about 500 × 200 km (Ammon et al., 2011; Matsuo and Heki 2011; Ozawa et al., 2011; Ozawa et al., 2012). This earthquake is one of the most studied so far. Different Slip models for this event that take account of the deformation along the fault plane, were greatly improved by sea-bottom geodetic measurements whose data allowed mapping the shallower slip patches near the sea floor stations. These models reported a large slip in the trench area (e.g., Koketsu et al., 2011; Wei et al., 2012; Bletery et al., 2014, among others) which was responsible for the high amplitude tsunami that stroke the coast. Different kinematic rupture models, depicting the evolution of the displacement in the subduction interface through time, were also obtained with unprecedented quality and detail (e.g., Lee et al., 2011; Shao et al., 2011). The rupture first propagated down-dip in bilateral directions along the subduction interface for 45 s and then broke an 80 by 250 km patch near the trench asperity in the up-dip direction and produced up to 60 m of slip (Shao et al., 2011) and an extraordinarily large tsunami. Most joint inversion models agree on this maximum slip centered on a patch located W-NW of the epicenter in the up-dip direction (Wei et al., 2012 and references therein).
The main focus of this study is to describe the seismogenic behavior of the Tohoku earthquake from the density structure of the forearc. For this purpose, we first performed a spectral cross correlation between the Tzz and the slip distribution to quantify the relationship between higher displacements and low gravity gradient signals. Then, we analyzed the space-time rupture behavior from two kinematic models (Lee et al., 2011; Shao et al., 2011), the resulting vertical deformation from Wei et al. (2012) and the b-value from Tormann et al. (2015) about the density distribution and faulting in the offshore forearc region utilizing gravity field derivatives, leading to relevant conclusions about the relationship between the distribution of the density structure and the seismogenic behaviour. Finally, we took into account different tectonic constraints (e.g. Baba and Yoshida, 2020) and geological structures (Bletery et al., 2014) leading to a block model proposal fitting all these observations.
Studying the seismic structure behavior from the gravity field
The variable mass distribution related to the seismic cycle is quantifiable based on gravity field models. An example of this are the results by Panet et al. (2018) who found an initially silent deformation migrating from depth to the surface across the entire subduction system before the Tohoku-Oki earthquake rupture, represented by large-scale gravity changes throughout three tectonic plates. Similar results were inferred by Álvarez et al. (2018) before the Pisagua 2014 earthquake from GOCE-derived geoid changes (although satellite GOCE was not developed for measuring gravity changes). Although GRACE and GRACE-FO are better designed to detect changes in gravity field, the spatial resolution required to observe deformations at this scale is not enough. The last authors proposed subsidence of the area where intense foreshocks and a slow slip event preceded the 2014 Iquique Mw = 8.1 earthquake (e.g., Ruiz et al., 2014), and where the maximum slip occurred (e.g., Hayes et al., 2014). Results are also in agreement with the fore-slip model from Socquet et al. (2017).
Fuchs et al. (2013) reported that the coseismic gravity change of the Japan Tohoku-Oki earthquake left a statistically significant signal in the GOCE measured gravity gradients of about ± 60 micro-Gal and between tenths and hundredths of Eötvös. Whereas those coseismic gravity changes, modeled from the satellite GRACE data solutions, are in the order of up to ten of micro-Gal (7 μGal Matsuo and Heki 2011; 8.75 ± 1.6 μGal by Wang et al., 2012a the gD component) at a spatial resolution of 500 km or spherical harmonic degree up to N = 40 (e.g., Han et al., 2011 or Dai et al., 2014 who reported 17.6 ± 1.1 μGal for gN change and the corresponding gravity gradient change of Txz at 1.25 ± 0.09 mEötvös at 333 km or longer, in agreement with seismic/GPS model predictions). In particular, the last authors showed that the estimated slip orientation and centroid location are different from GPS/seismic solutions, potentially due to the additional offshore constraint from GRACE data, similar to the results from Wang et al. (2012c) for the 2004 Sumatra-Andaman earthquake, which improved constraints of seismic data (e.g., fault seismic moment, fault width, for rake angle and centroid location) from satellite solutions.
Although the aforementioned authors have quantified the pre-, co- and post-seismic deformation, they did not address in detail aspects such as the locations where great earthquakes are nucleated, preferential direction in which the seismic energy is released (if there is a significant directivity effect), or regions in which slip increases or it is arrested. A distinct and complementary approach to the study of the megathrust behavior comes from the analysis of the vertical gravity gradient (Tzz) from GOCE static models and its relation to earthquake nucleation, rupture propagation direction (directivity), slip enhancement at asperities, and location of seismic barriers and attenuators. From the study of co-seismic slip models for more than ten of the last greatest “megathrust” earthquakes (Mw > 8) and the areas of historical ruptures that occurred in their vicinity, Alvarez et al. (2014), Alvarez et al. (2019), Alvarez et al. (2021) inferred a qualitative and quantitative relationship between the highest slip (in meters) and the density structure of the offshore forearc region determined by direct modeling of the vertical gradient (Tzz in Eötvös = 10−4mGal/m). In these events, the negative lobes of Tzz are not only related to the increase in the slip but to the regions where the rupture propagated (seismic directivity). In-depth analysis showed that ruptures can be better explained and correlated using degrees/orders of development at spherical harmonics of about N = 200 (corresponding to an anomalous mass depth of z ≈ 30 km, Alvarez et al., 2017b). At this depth, the Tzz lobes could be reflecting the expression of regions with a homogeneous roughness distribution related to a smoother and strongly coupled plate interface, typical of domain B (Lay et al., 1982; Lay et al., 2012). This domain is characterized by large and relatively uniform regions with unstable sliding friction properties (roughness) and large co-seismic sliding (at depths extending from 15 to 30 km), where most megathrust events occur.
In addition, the along-strike seismic segmentation (perpendicular to the trench) along the marine forearc (identified as barriers to the propagation of seismic energy), inferred from recent and historical rupture patterns, could be characterized using a relatively higher Tzz signal, even positive in some regions. These barriers, which inhibited the lateral propagation of large seismic ruptures (Graindorge et al., 2008; Henstock et al., 2016), coincide with a lower coupling degree in periods higher than one hundred or two hundred years (Chlieh et al., 2008; Chlieh et al., 2011; Ruiz et al., 2014; Metois et al., 2016). These lateral variations in the Tzz signal could be reflecting mass heterogeneities or structural complexities that contributed to the along-strike variations in seismic behavior. The transverse seismic barriers could be identified in those portions of the margin, where the Tzz contours are narrowed or with a relatively higher Tzz (these barriers should favor regularity and similarity of the earthquakes; i.e., recurrence and cyclicity).
Our latest work extends these principles, initially analyzed in South American subduction-related cases (e.g. Maule 2010; Mw = 8.8) to large earthquakes that occurred along the Sunda subduction zone (e.g., the Sumatra-Andaman 2001 earthquake, Mw = 9.1). The delimitation of various heterogeneities throughout the seismogenic structure inferred using satellite gravity is reinforced by the mapping of seismic wave velocities (Hicks et al., 2014), by a direct relationship with the degree of inter-seismic coupling (inferred via GPS) and the thermal structure in depth (e.g., (Grevemeyer and Tiwari, 2006; Kopp, 2013). Additionally, faults cutting across the forearc can be tracked utilizing satellite-derived gravity (Alvarez et al., 2019 and references therein).
Methodology
The topography corrected vertical gravity gradient up to N = 200
Direct full tensor measurements of the Earth gravity field from GOCE-SGG (Satellite Gravity Gradiometer) that are further combined with GOCE-SST (Satellite-to-Satellite Tracking) lead to an excellent performance from medium to long wavelengths (Bruinsma et al., 2010; Pail et al., 2011) in newly Global Gravitational Models (GGM). Models are also improved on their spectral content and accuracy by including data from other missions such as GRACE and LAGEOS (Laser GEOdynamics Satellite). In this work, we derived the vertical gravity gradient (Tzz) from the spherical harmonic coefficients of the satellite GOCE static model GO_CONS_GCF_2_DIR_R6 (Bruinsma et al., 2014 developed up to N = 300), a full combination of the above-mentioned data, up to degree/order N = 200 on a regular grid of 0.05° grid cell size (Janak and Sprlak, 2006). The vertical gravity gradient component is the most suitable/sensitive to mapping earthquake deformations when compared to horizontal components.
The Tzz, expressed in Eötvös
After calculating the vertical gradient from the disturbing potential derived from the aforementioned GOCE model, the effect of the topographic masses it reduced taking into account the WGS-84 ellipsoid as a reference surface, which is necessary to highlight anomalous geological structures and density contrasts within the upper crust. For calculation of the topographic contribution over the Tzz, we discretized the digital elevation model ETOPO1 (Amante and Eakins, 2009) utilizing spherical prisms with constant standard densities of 2,670 kg/m3 for masses above sea level and 1,030 kg/cm3 for seawater. The selected calculation height (Hc=3,200 m), when calculating the effect generated by the topographic masses on the vertical gravity gradient, is enough to ensure that all values are above the topography. The calculation was performed using the Tesseroids Phyton package from Uieda et al. (2010), Uieda et al. (2016) which uses spherical coordinates to take into account the Earth’s curvature to avoid considerable errors over the large study region (https://www.fatiando.org/ https://doi.org/10.5281/zenodo.4685960).
Correlation between Tzz and co-seismic slip using spectral analysis
In previous works (e.g., Alvarez et al., 2014, Alvarez et al., 2019, and Alvarez et al., 2021 and references therein) we highlighted the inverse relationship between Tzz and co-seismic slip (i.e., high slip [m] over negative Tzz [mGal/m]) both in qualitative and quantitative ways. By sampling over a regular grid the Tzz field versus different co-seismic slip distribution models along the South American margin, we found that this anti-correlation improved as event magnitude and consequently rupture area increased (e.g., the correlation coefficient for the Maule 2010 earthquake was of approx. -0.70). In this work, we now computed the spectral coherence between the topography corrected vertical gravity gradient (Tzz), derived from GOCE satellite up to N = 200, and three co-seismic slip distributions (Shao et al., 2011; Wei et al., 2012; Lee et al., 2011) for the Thohoku-Oki earthquake.
The cross-spectral estimation was computed in the frequency domain assuming that the Tzz is the input and the slip is the output data (see Generic Mapping Tools software GMT, Wessel et al., 2019). First, we selected a rectangular area (dashed lines in Supplementary Figures A1–A3 in Supplementary Appendix SA) comprising the region of maximum slip. Geographical grids (in degrees) were scaled to meters via a “Flat Earth” approximation using the WGS-84 ellipsoid parameters. Then, both fields were de-trended (by removing the best-fitting linear trend) and tapered (data were extended and tapered to zero) before the computation of the 2-D forward Fast Fourier Transform (Supplementary Figures A1–A3 in Supplementary Appendix SA). Finally, we performed FFT and then calculated the power spectrum in the radial direction of both signals and the spectral coherence (plus standard deviation error estimate) between both fields (Figure 2). Discussion of coherency at low wavelengths, i.e., for a spatial resolution up to 100 km, is irrelevant as GOCE resolution is about 80–90 km at equator. For wavelengths around λ = 200 the coherency between the two signals improves substantially up to 90%.
Results and discussion
Rupture behavior from Tzz
The three highly positive values from Tzz (>+10 Eötvös), along the coastal line (East of Hachinohe, Sendai, and Ibaraki Prefecture, see Figure 2), are consistent with the residual gravity anomaly obtained by Bassett et al. (2016) albeit at very different wavelengths. In that model, these authors also found high gravity values over the forearc close to the Japan trench axis, up to approximately 15 km depth, with an interspersed gravity low (along the slab/Moho intersection) between these two across-strike gravity highs (Figure 1 of Bassett et al., 2016). The Tohoku-Oki Mw = 9.0 2011 earthquake nucleated close to a positive Tzz maxima lobe (located to the East of Sendai) with the main rupture pattern migrating (trenchwards) to the closer negative minima in Tzz (with less than -20 Eötvös), where it reached its maximum amplitude (e.g., Shao et al., 2011 in Figure 4, Wei el al. 2012 in Figure 5, and Lee et al., 2011 in Figure 6). Earthquake nucleation close to a local positive high gradient zone towards the coastline had been previously observed for other great earthquakes (e.g., Valdivia 1960; Arequipa 2007; Maule 2010; Illapel 2015; Musine 2015; Sumatra-Andaman 2004; see Alvarez et al., 2019 and Alvarez et al., 2021). This had been initially noted by Tassara (2010), who showed that ruptures along the Andean margin generally nucleated at the edge of geological heterogeneities in the forearc, and Hicks et al. (2014) who reported that the Maule earthquake nucleated in a region of high Vp and positive gravity anomaly.
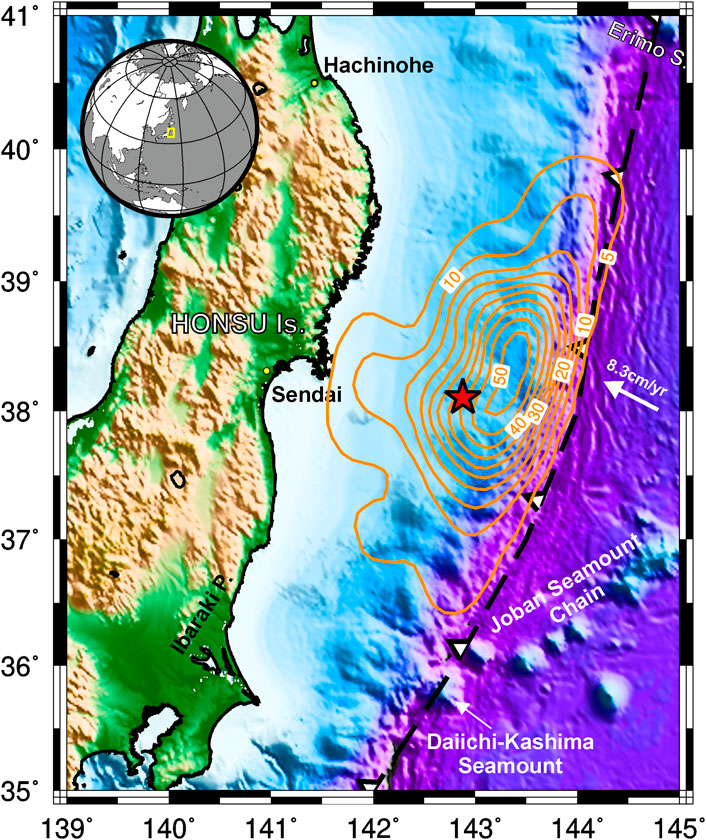
FIGURE 1. The Mw=9.1 2011 Tohoku-Oki earthquake in NE Japan ruptured bilaterally reaching higher amplitudes to the trench generating a destructive tsunami. The slip model (orange solid lines are Iso-lines in meters) is from Lee et al. (2011), and the Pacific plate motion relative to the North American plate is from DeMets et al. (1994).
The vertical gravity gradient off-shore northern Honshu is divided by a trench-parallel strong gradient with positive values towards the coastline (more than +10 Eötvös) and negative values (less than −20 Eötvös) to the trench (Figure 2). This across strike abrupt change in the gradient signal is almost centered over the slab/Moho intersection (obtained from Bassett et al., 2016). Wei et al. (2012) explained that there was little expectation that future interplate earthquakes along the eastern coast of Honshu would be different from the max. Mw = 8.5 earthquakes documented historically (Avouac 2011). Future earthquakes were expected to occur along the plate interface patch that had remained locked during the interseismic period (but determined from the modeling of geodetic strain, measured on-shore by Hashimoto et al., 2009; Loveless and Meade, 2010; Suwa et al., 2006). No major rupture areas were documented in the region between 1896 and 2011 (e.g., Bassett et al., 2016), beyond several earthquakes with over Mw/J > 7.0. The largest previous earthquake reported in this region was the Sanriku earthquake of 1896 (Kanamori, 1972) with a moment magnitude about 8 times lower than the Tohoku-Oki earthquake. When looking at historical earthquakes along this portion of the eastern Honsu Island margin, it is observed that only earthquakes that ruptured mostly or entirely between this line (slab/Moho intersection) and the trench line, reached magnitudes greater than M8 (specifically the 1896 M8.5 and the Mw = 9.1 Tohoku-Oki earthquake). We can make an analogous observation for the Mentawi region, where many intermediate magnitude earthquakes occurred along this trench parallel higher Tzz closer to the coast (e.g., Chlieh et al., 2008) while great megathrust earthquakes and historical great ruptures are restricted to the region with lower Tzz (see Alvarez et al., 2021).
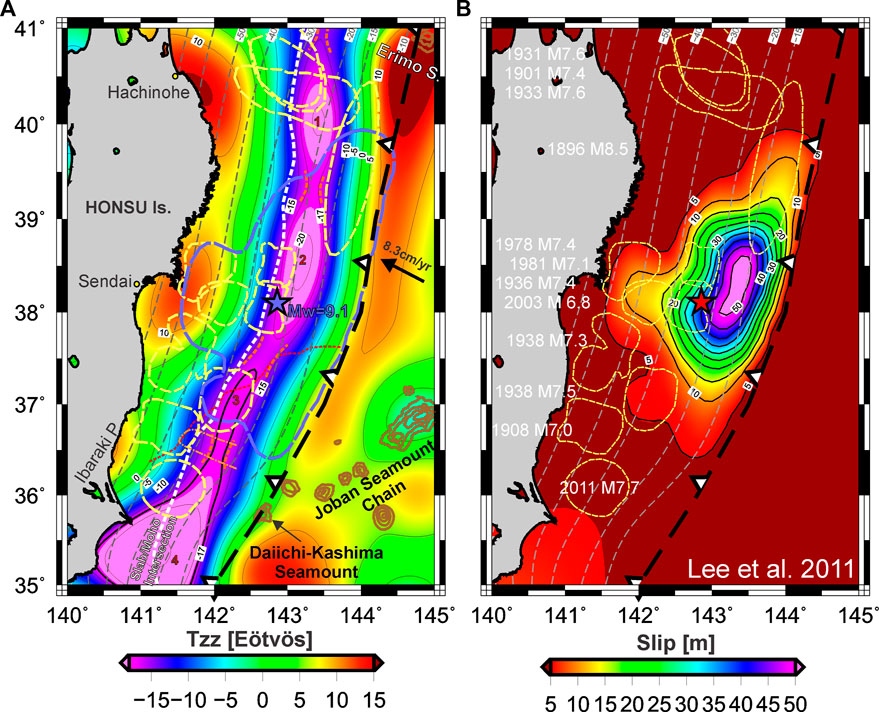
FIGURE 2. (A) Vertical gravity gradient from GOCE DIR-R6 (Bruinsma et al. 2014) model up to N = 200, corrected by the topographic effect. The white dashed line depicts the slab/Moho intersection (Bassett et al. 2016), the yellow dashed lines are historical rupture areas (Bassett et al. 2016), and the blue dashed line represents the 5 m contour of the Lee et al. (2011) slip model for the 2011 Tohoku-Oki earthquake, which is depicted to the (B). A clear qualitative relationship is observable between maximum slip and a minimum Tzz lobe as seen in previous works, including the other two last major megathrust earthquakes: Mw 8.6 2010 Maule (Alvarez et al. 2019) and Mw 9.2 Sumatra-Andaman (Alvarez et al. 2021). A subducted seamount chain (Mochizuki et al. 2008) is related to the narrowing of the Tzz signal at 36.5°N. Orange dashed lines indicate the location of seismic barriers (based on Tzz and historic and recent rupture areas). Interposed low Tzz lobes are indicated as 1, 2, 3, and 4.
Along the South American margin, a trend of low-density values was observed off-shore along the entire marine forearc (i.e., from the trench to the coast), being the −5 Eötvös contour indicated as the down-dip limit of the seismogenic zone, roughly coincident with the 30 km iso-depth plate contour (e.g., for the Maule 2010 earthquake and the Ecuador-Musine 2017 earthquake; see Alvarez et al., 2019 and Alvarez et al., 2017a). Along the central to southern Chilean margin, the Tzz has a positive signal just along the coastal line, which has been related to dense, ultramafic material due to under-plating (e.g., Alvarez et al., 2014; Bassett and Watts 2015; Alvarez et al., 2021). These parallel trench differences in the gradient signal could be explained as a result of a higher dipping angle in the Mentawi-Sumatra and Eastern Honsu margin regions (10°) when compared to the South American margin (5°). In other words, the main seismogenic zone, where type B asperities are located (Lay et al., 2012) can be mapped using a low gravity gradient signal, regardless of what type of margin we are analyzing.
When superimposing the different slip models to the Tzz (Figures 4–6), a slight lateral shift is observed between both quantities. This shift was also observed for other earthquakes (e.g., Sumatra-Andaman) and is interpreted as the positive effect of the subducting plate over the gradient signal, masking the low Tzz trend observed along the marine forearc. The forebulge presents a highly positive signal, which rapidly decreases (contours from > +10 Eötvos to <−10 Eötvos) as we move away from the trench in the landward direction, masking any lower densities signals near the trench, at least at these wavelengths.
There are three well-defined Tzz minima lobes along the central minima gradient: a < −25 Eötvös anomaly located to the south of Ibaraki Peninsula (named 4 in Figure 2), a central minima lobe to the east of Sendai, where the maximum slip was achieved (N° 2), and another with < −20 Eötvös to the north (N°1). The section between the southern minima Tzz lobe (4) and the central minima lobe (2) presents a smooth pattern, as a transitional zone, with about −17 Eötvös (named 3 in Figures 2–7). In this region, Bassett et al. (2016) reported higher densities and a high Residual gravity anomaly (mGal). These authors reported this prominent structural boundary along strike off-shore south-central Honsu, and proposed it as a possible extension of the Median Tectonic Line-MTL that separates two contrasting geological terrains along the forearc (red dashed line in Figure 2): a ∼20 km thick granitic upper-crust (north side on-shore) (Isozaki et al., 2010) and a crust entirely composed of variably metamorphosed Late Mesozoic to Cenozoic accretionary complexes (south side off-shore). The location of the MTL is coincident with a latitudinal segmentation of the Tzz signal, probably indicating the existence of an along-strike seismic barrier or attenuator (see Alvarez et al., 2014). The former authors proposed that stress heterogeneities, on either side of the MTL, may explain both the small slip area and the large slip amplitude of the Tohoku-Oki earthquake rupture, being the extent of co-seismic slip limited by the inability to rupture into the low-stress or velocity-strengthening fault segment south of the MTL. On the other hand, the highly stressed or strongly velocity-weakening area with high rates of tectonic loading north of the MTL resulted in a large slip amplitude (Basset et al., 2016).
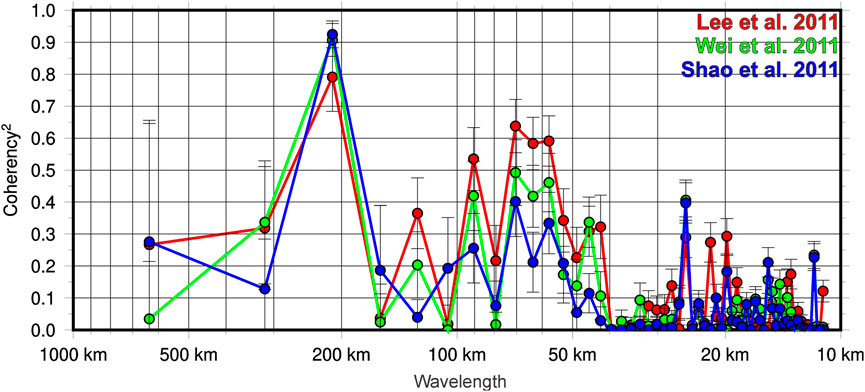
FIGURE 3. Cross-spectral analysis estimation assuming that the vertical gravity gradient (Tzz) is the input and the co-seismic displacements (Slip) are the output data. The spectral coherence diagram shows that in most cases a better coherency is found at those frequencies close to the model-limited resolution (N = 200), while for frequencies with lower spectral content, there is a poor or sparse coherency.
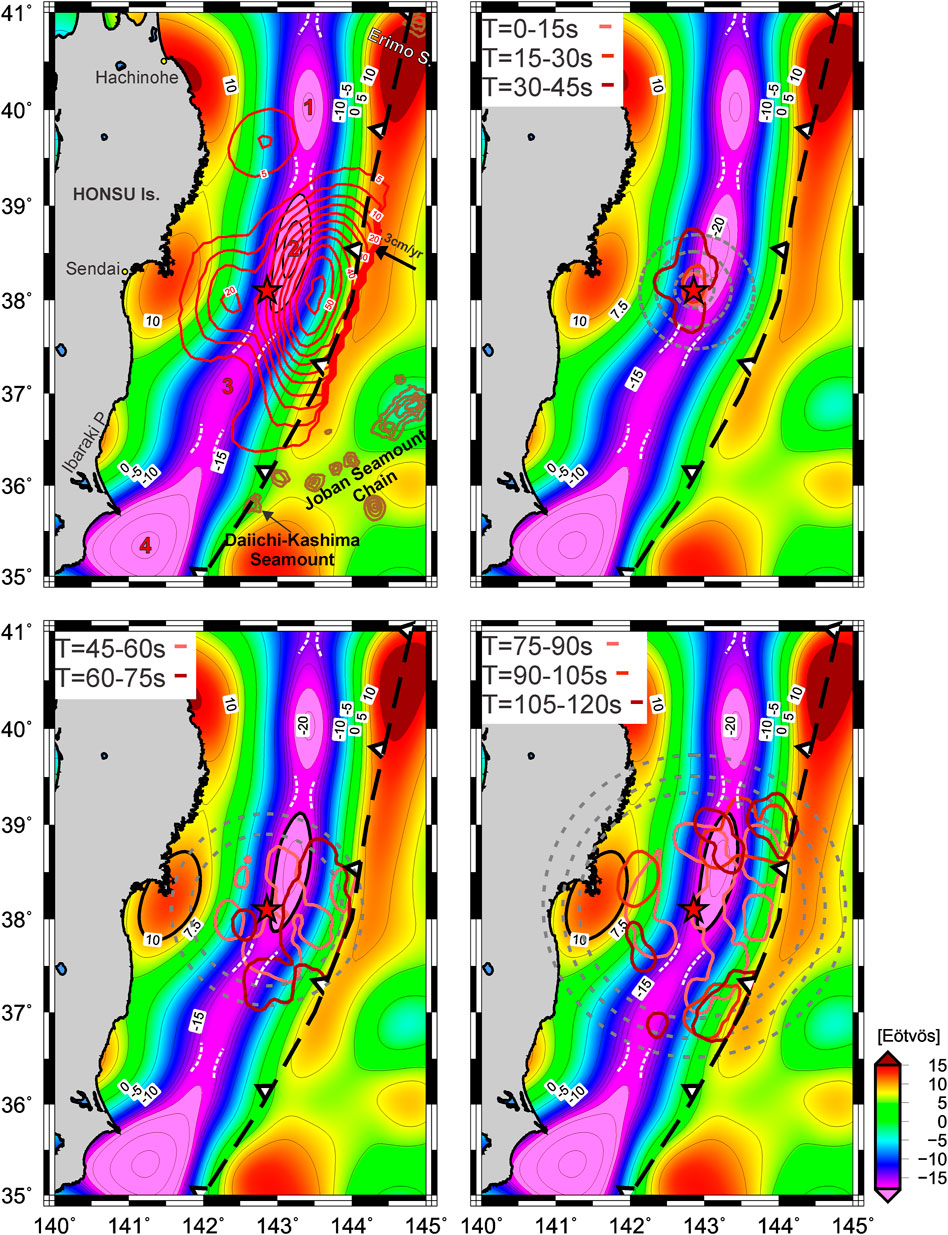
FIGURE 4. Co-seismic slip distribution and kinematic rupture process for the Tohoku-Oki Mw = 9.0 earthquake from Shao et al. (2011). Note how the rupture is delayed with respect to the theoretical wave-front (dashed grey circles) in the high Tzz zone (down-dip), while rupture accompanies the wavefront when Tzz is low. Seismic barriers (white dashed contours) also acted as attenuators to different energy bursts.
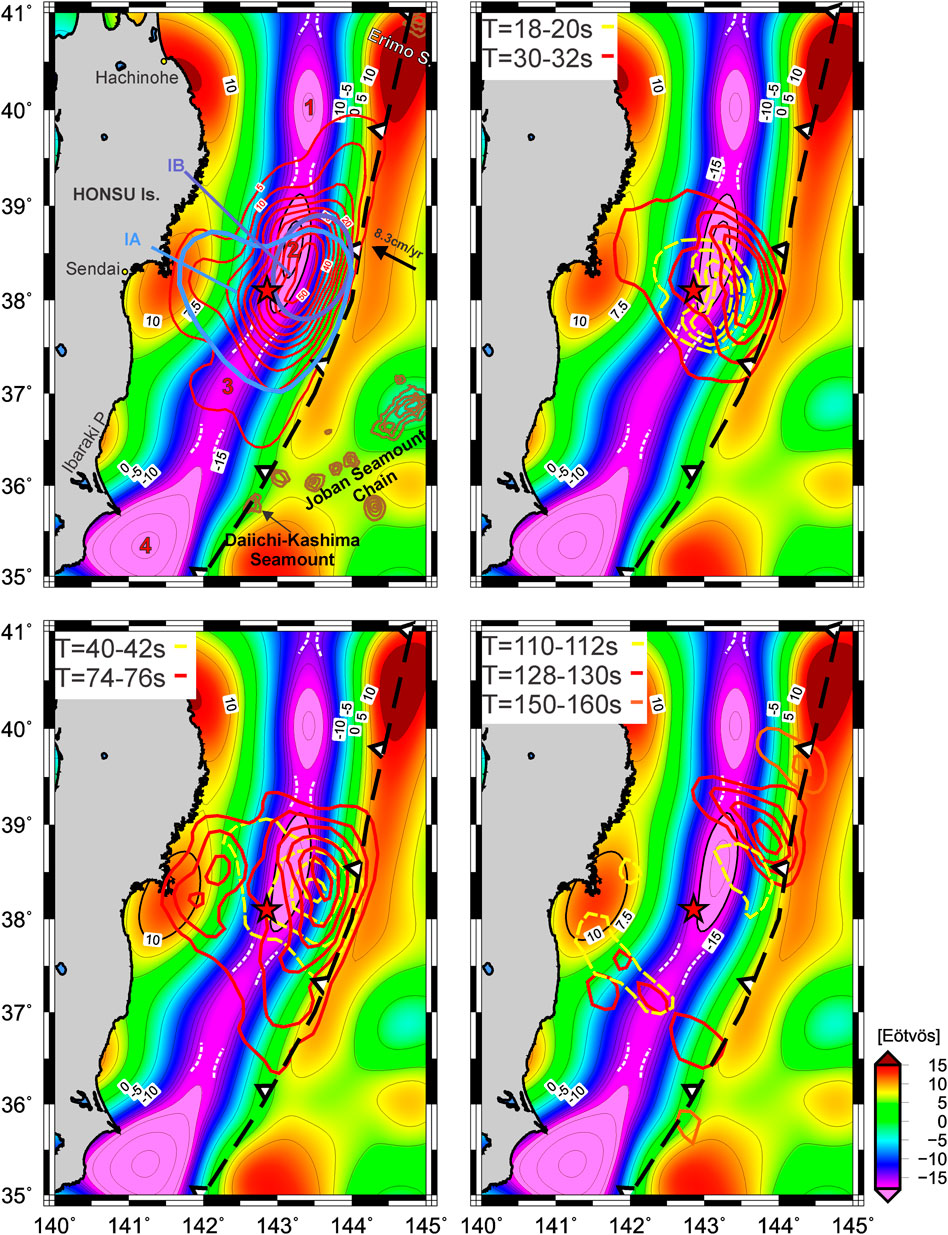
FIGURE 5. Co-seismic slip distribution and kinematic rupture process for the Tohoku-Oki Mw = 9.0 earthquake from Lee et al. (2011) plotted over Tzz. Seismic barriers (white dashed contours) also acted as attenuators to the different energy bursts. In this model, the asperity IB (blue ellipse) ruptured two times during de co-seismic stage.
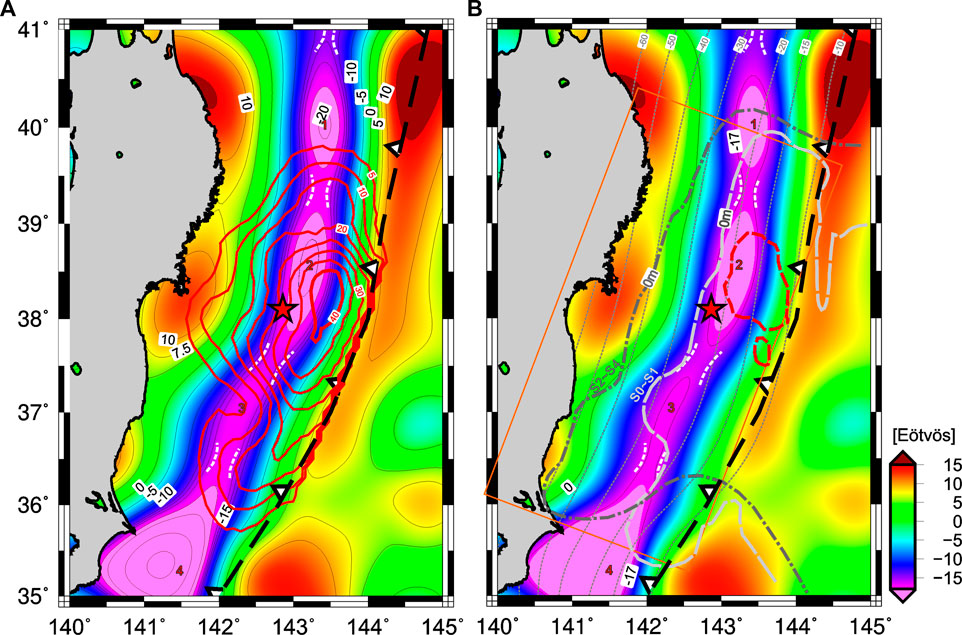
FIGURE 6. (A) Tzz superimposed to the Slip model from Wei et al. (2012). To the (B), the vertical deformation from Wei et al. (2012) is plotted in grey dashed lines (S0-S1) and in dot and dashed lines (S2-S4), the orange rectangle indicates the fault plane used for this slip model. The low b-value patch before the Tohoku-Oki earthquake is indicated with a red dashed line (Tormann et al., 2015).
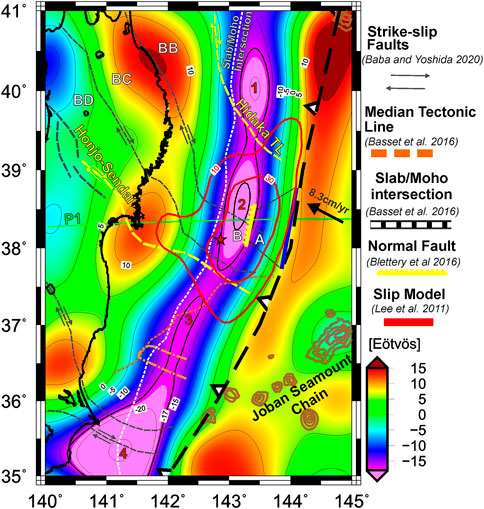
FIGURE 7. The minima Tzz lobe, roughly coincident with the 30 m slip patch of Lee et al. (2011), is bounded in the down-dip direction by the slab/Moho intersection (Bassett et al. 2016, which roughly coincides with the 30 km iso-depth contour from Hayes et al. 2018). The normal fault (yellow) mapped by Blettery et al. (2016) is located along the right border of the minima Tzz lobe (i.e., in the up-dip direction). Segmentation of Tzz along-strike is coincident with strike-slip faults (Baba and Yoshida, 2020) segmenting the outer forearc. Note that this segmentation acted as a main order control on the rupture as proposed by Baba and Yoshida (2016).
Opposite to this, Tormann et al. (2015) explained that there is no significant variation in the low b-values to suggest that the plate interface is segmented in a way that might limit potential ruptures. These authors also found no indication for a long assumed lateral segmentation of the megathrust plate interface into smaller areas that would only rupture in isolation, limiting the maximum magnitude. Our results, based on densities distribution derived from the gravity field, disagree with this hypothesis about the absence of identified barriers. At approximately ∼36.5°N 142°E, a seismic barrier can be identified (Figure 2) indicated by the slight narrowing of the −17 Eötvös contour (orange dashed contour) which coincides with a subducted seamount chain (orange dot and dashed contour) reported by Mochizuki et al. (2008). In this sense, Nakatani et al. (2015) who analyzed the Tohoku-Oki earthquake aftershocks, by using dense ocean bottom seismic array data, suggested that the large coseismic slip zone ended in the vicinity of the frontal region of the Daiichi-Kashima subducting seamount and may not have extended off Ibaraki. This seismic barrier, not only marks the southern ending of the rupture propagation for the Tohoku-Oki earthquake but also separates the 2011 M7.7 rupture to the south from the 1938 M7.5 rupture area to the north. The Tzz signal between 36.75°N and 37.5°N encloses relatively minima values (identified as C in Figure 2), indicating the possible location of a seismic asperity (Alvarez et al., 2019; Alvarez et al., 2021 and references therein); this region that encloses the 1938 earthquake rupture area was also activated by the Tohoku-Oki earthquake (see the 5 m contour in Figure 2). The relatively higher Tzz value at 37.5°N (and approx. 142.5°E) indicates the location of another seismic barrier (orange dashed contour in Figure 2) that separated the 1938 M7.5 earthquake from the 2003 M6.8 rupture area. To the north, at about 39.5°N 143.25°E, the rupture ended in a region with a pronounced Tzz signal segmentation, indicating the location of the third barrier to seismic energy.
Kinematic rupture history and Tzz
Shao et al. (2011) modeled the kinematic rupture history (consistent with Ide et al., 2011) with a time interval of 15 s, revealing a complex rupture process with a weak rupture during the first 5 s, initiating at an approximate depth of 23 km (Figure 4). During the following 25 s, the rupture propagated in a speed of apparently less than 1 km/s, illustrated by the lag of rupture front at 30 s (outlined by the 4-m contour of fault slip in red gamma) relative to the 1.5 km/s pseudo-rupture front (grey dashed circles, see Figure 4 from Shao et al., 2011). Then, as explained by Shao et al. (2011) the apparent rupture propagation significantly speeded up from 30 s to 45 s, accompanied by a larger slip rate and producing the first peak in the moment rate function; being the rupture limited to faults with centroid depths similar or deeper than the hypocenter. At this time, the rupture that was propagating mostly in the downdip direction reached the 0 Eötvös contour (with more positive Tzz values to the coast) where the slip was attenuated. Then at about 45 s, as explained by Shao et al. (2011), the “explosive” failure of the near trench asperity took place (in the opposite direction or up-dip) reaching up to 60 m of slip.
Similar results were shown in previous works (e.g., Alvarez et al., 2014; Alvarez et al. 2019; Alvarez et al. 2021), where we have characterized these abrupt changes in the Tzz signal, either across or along strike, as seismic barriers or attenuators to the propagation of seismic energy; being the high Tzz signal across the continental forearc (parallel to the coast, and beneath the coastline along south-central Chilean margin) indicative of the down-dip limit for rupture propagation.
From a more precise source of information, Lee et al. (2011) performed a joint source inversion (teleseismic body waves, seafloor, and terrestrial GPS coseismic deformation data and dense local strong motion records) finding a better-constrained model (Figure 5). These authors mapped the slip and accumulated slip through time, finding a large-scale repetition of slips during the temporal rupture process. Their inverted source model shows several time periods of energy release with three main peaks, suggesting repetition of large-scale slip on the largest of the three found asperities. They denoted the largest asperity, developed around the hypocentre, with a maximum slip over 50 m and a broad area of about 200 × 200 km2, as Asperity I. It concentrated slip in two areas (Figure 5): Asperity IA around the hypocenter (depth between 10 and 50 km), and other Asperity IB located slightly north of the hypocenter (at about 10–30 km depth). In this model, extremely large Asperity IA activated for 40–90 s and extended from shallow to the down-dip along the fault plane. Then, when the rupture front moved slowly to the south gradually forming Asperity II (between 100 and 140 s approximately), the area just above the hypocentre started to slip again expanding northward and merging with Asperity IA that had slipped before, producing the second slip concentrated area on Asperity I, i.e., Asperity IB (Lee et al., 2011 for more details).
This main asperity of approximately 80 km wide inferred by different source models (e.g., Shao et al., 2011 at T = 45 s–90 s or Lee et al., 2011 at 30–22 and 74–76 s), located right above the hypocentre, is over the minima Tzz lobe with less than −20 Eötvös (named N° 2 and highlighted with a black solid ellipse in Figure 7). These Tzz minima were proposed as seismic asperities (Alvarez et al., 2019; Alvarez et al., 2021) in the sense proposed by Lay and Kanamori (1981) and by Lay et al. (1982), Lay et al. (2012). Results from Bletery et al. (2014) reinforce this hypothesis, where the stress drop along the fault was dominated by two very large patches (localized halfway between the epicenter and the trench) with amplitudes exceeding 8 MPa. These patches, occurring after large stress-drop after earthquake nucleation, are thought to be the result of the rupture of locked asperities loaded in stress during the interseismic period (Chlieh et al., 2007; Konca et al., 2008) as explained by Bletery et al. (2014).
Using the vertical seafloor deformation, Wei et al. (2012) separated the contributions to the slip model into shallower (S0–S1) and deeper (S2–S4) portions by performing a forward prediction for the 4 nearest Deep-ocean Assessment (ocean bottom geodetic) and Reporting of Tsunamis (DART) records. They found that the S0–S1 portion (at shallow depths and with high slip amplitude) produced the most marked seafloor deformation and the higher tsunami recorded and found a nearly complete stress drop on the upper fault portion (S0). The Tzz signal shows two well-differentiated areas along the marine forearc (along the megathrust) in consonance with observations made by Wei et al. (2012), who proposed that the shallower (S0–S1) and deeper (S2–S4) portions of the rupture have fundamentally different characteristics. These authors proposed that these differences are related to a strong and very efficient dynamic weakening process, possibly thermal pressurization (the existence of abundant free water and low permeability, due to the large clay fraction in the sediments accumulated in the trench and dragged along the megathrust), which produced a large displacement rupture at shallow depth with little high-frequency seismic radiation (as region B in the sense of Lay et al., 2012); while the deeper rupture was characterized by relatively small fault displacement with relatively strong high-frequency radiation (as region C in the sense of Lay et al., 2012). Practically all the vertical deformation predicted by this model (Wei et al., 2012) is located to the east of the 0 Eötvös contour, where the Tzz signal is negative (Figure 6).
Tormann et al. (2015) resolved a low-b-value structure in the subsequent high-slip area of the Tohoku-Oki main shock (between 38°N and 39°N), indicating locally a specifically strong stress accumulation. This asperity on the plate interface (low-b-value structures can be usefully interpreted as mapping asperities; Schorlemmer and Wiemer 2005), which latitudinally matches the Tzz minima lobe (<−20 Eötvös), extends about 200 km north-south and 100 km east-west, reaching b-values <0.5, and seems to have formed over several years before this mega-earthquake occurrence (white dashed line in Figure 7). This segment of the plate interface is a hard-to-break segment that remained largely locked or with strong coupling (Hashimoto et al., 2009), can sustain high levels of stress, and tends to release the accumulated slip deficit in large ruptures as occurred (Tormann et al., 2015). The hypothesis of the existence of asperity in this region is reinforced by the fact that the areas of large co-seismic slip during the Tohoku-Oki event exhibited a significant increase in b-values after the mainshock (returning to values similar to those seen between 1998 and 2003 in the same period that the aftershock rate to reach the average long-term level), representing a strong stress release in these areas 21, 28 (Figs 2T2 and T3 and 3; Tormann et al., 2015). Different interseismic coupling models exhibited a high degree of coupling (close to 100%; Suwa et al., 2006; Perfettini and Avouac 2014) and a high back slip rate (close to 10 cm/yr, Loveless and Meade 2011) centered to the east of the Oshika Peninsula in agreement to the region where the Tzz minima low is observed and occurred maximum slip in the Tohoku-Oki earthquake. In a former work, Alvarez et al. (2015) reported a positive correlation between the Tzz and b-value (previously observed by Sobiesiak et al., 2007 but using Isostatic Residual Anomalies) proposing to use gravity as an indirect tool for mapping low b-value zones and more indirectly potential zones of asperities along the seismogenic zone that could trigger large events.
The relationship between the Tzz signal and seismic behavior in the region of the Tohoku-Oki earthquake agrees with previous observations along the South-American margin (Alvarez et al., 2014; Alvarez et al., 2019) and along the Sunda subduction zone (Alvarez et al., 2021). In all these regions, rupture propagated mainly along negative Tzz, which in turn showed a high degree of interseismic coupling (e.g., Chlieh et al., 2008; Chlieh et al., 2011; Metois et al., 2016), slip enhanced at Tzz minima lobes, and was attenuated at intermediate values and arrested at Tzz highs both along and across strike.
Tectonic constraints and forearc block model proposal
By using offshore 2D/3D seismic survey data, Baba and Yoshida, (2020) analyzed in detail the geological structure over the NE Japan forearc, demonstrating that the structure in the hanging-wall plate of the subduction system consists of a series of structural blocks (segments) separated by NW–SE trending strike-slip faults. They also proposed that the inherited geological structural configuration of the overriding plate showed a close relationship with the seismic activity related to the 2011 M9.0 Tohoku-Oki megathrust earthquake (i.e., distribution of foreshocks, mainshock, and aftershocks, coseismic slip models of the coseismic slip area of M-7 class earthquakes, quasi-static slip rates, back slip rate, and seismic tomography images). By comparing two different coseismic slip models, Baba and Yoshida, (2020) highlighted that the trenchward forearc of the structural blocks between the offshore Hidaka tectonic line and the Honjo-Sendai tectonic line (yellow dashed lines in Figure 7) fitted well with the coseismic slip area of the 2011 Tohoku-Oki earthquake. These strike-slip faults coincided with the observed segmentation of the Tzz identified as barriers (white dashed contours in Figure 2) that confine the minima Tzz lobe N° 2 (Figure 7) related to the main asperity of the Tohoku-Oki earthquake.
On the other hand, Bletery et al. (2014) highlighted the crucial role of normal faulting in the overriding plate and reported that the largest slip occurred just in the up-dip direction of an important normal fault revealed in seismic lines (Tsuji et al., 2011, 2013) co-seismically reactivated. Bletery et al. (2014) also explained, based on Cubas et al. (2013), that this normal fault (yellow line in Figure 7) could have activated coseismically (under very low dynamic friction conditions) allowing a large amount of slip to propagate up to the free surface. These authors proposed that low friction authorized large slip with a low-stress drop in the shallowest part of the megathrust defined as block A (consistent with the large Tsunami), which is a coherent unit separated by the normal fault from another block B (Figure 7) located to the west (see Bletery et al., 2014 for more details). Finally, they proposed that the rupture of a long-term locked asperity on the megathrust (located below the normal fault) caused block A to move as a coherent unit with respect to block B. Our results show that the eastern edge (i.e., trenchwards) of the low Tzz lobe N° 2 coincides with the location of this normal fault (from Tsuji et al., 2011) separating very low Tzz values (<−20 Eötvös) on the ceiling block (B) with respect to higher Tzz values over the floor block (A) (Figures 7, 8).
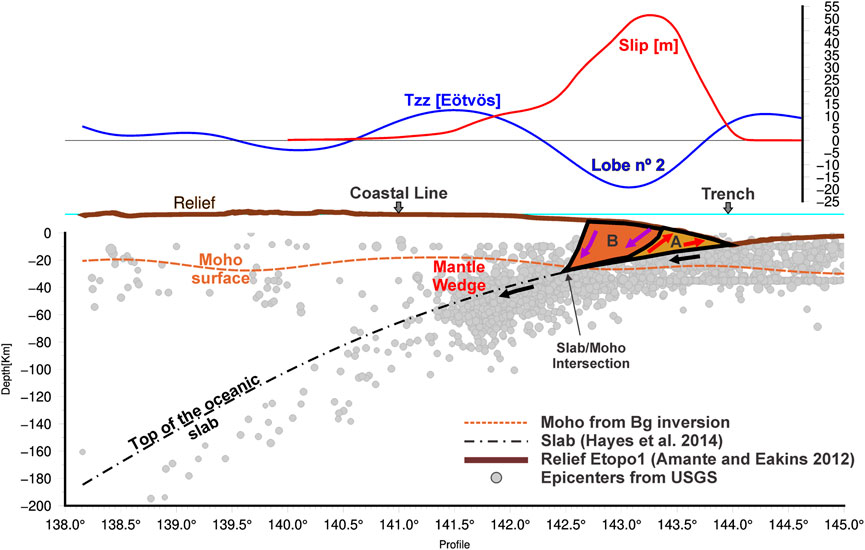
FIGURE 8. Profile (Figure 7 for location in a plan view) across maximum slip distribution (red solid line) and minima Tzz lobe (blue solid line). The maximum slip occurred over B and A blocks, which moved freely in response to the released seismic energy. Relief (brown solid line) is from ETOPO1 (Amante and Eakins 2012). Slab contour plotted in dot and bashed black line is from Hayes et al. (2018). Crust-mantle boundary (Moho) was determined from the Bouguer anomaly field (obtained from GFZ calculation service http://icgem.gfz-potsdam.de/calcgrid) by applying gravity inverse calculations using Lithoflex software package (www.lithoflex.org, Braitenberg et al. 2007; Wienecke et al. 2007).
In this way, both Bletery et al. (2014) and Baba and Yoshida, (2020) proposed a block motion behavior segmenting the forearc but analyzing different fault systems. The first, proposes that the motion of block A, which is decoupled from block B by a trench parallel normal fault, allows it to slip freely with respect to both the incoming plate and the rest of the overriding plate. This proposal is consistent with the absence of aftershocks in the frontal wedge (i.e., block A) observed by Obana et al. (2013) and because the amount of slip does not significantly decrease as the rupture reaches the free surface. The last (i.e., Baba and Yoshida, 2020), suggests that the structural blocks (in that work referred to as Blocks B, C, and D, named in Figure 7 as BB, BC and BD respectively), bounded by the offshore Hidaka tectonic line and the Honjo-Sendai tectonic line, slipped rapidly trenchward when the 2011 Tohoku-Oki earthquake occurred (Figure 7). Thus, the low Tzz lobe (identified as N° 2) could be mapping a main crustal block along the marine forearc, limited along-strike by strike-slip faults (Baba and Yoshida, 2020) and up-dip by a trench parallel normal fault (Tsuji et al., 2011; Tsuji et al., 2013). This main block is probably limited towards the down-dip direction by another fault just over the slab/Moho intersection (mapped by Bassett et al., 2016). The above-mentioned Tzz lobe is located along the large and relatively uniform region with unstable sliding frictional properties that generate modest levels of diffuse short-period radiation, high coseismic slip, high seismic moment release, and high-stress drop from the central domain B (i.e., asperities) at source depths spanning from 15 to 30 km where most megathrust events occur (see Lay et al., 2012).
Similarly, blocks segmenting the forearc were mapped from Tzz and geological data along the southern Chilean margin, where the Maule 2010 Mw = 8.8 earthquake occurred (Alvarez et al., 2019). For this earthquake, some authors (e.g., Moreno et al., 2012) suggested that splay faults in the upper plate limited rupture propagation in the up-dip and along-strike directions. In this region, four structures that segment the upper plate and control rupture behavior could be mapped from Tzz. (1) A north-south trending Thrust Ridge (TR in Figure 9) coincident with the up-dip limit to rupture propagation is depicted by the −5 Eötvös contour. This structure is associated with splay faults (Geersen et al., 2011) that coincide with the mechanical discontinuity between the frontal accretionary prism and the forearc paleoaccretionary structures (Contreras-Reyes et al., 2010; Moscoso et al., 2011). (2) The Santa María Fault (SMF), which consists of a series of back-thrusts extending between ∼36°S and 37°S rooted in the plate interface (Melnick et al., 2009), separating the northern main rupture lobe from the southern minor lobe. (3) The Lanalhue Fault Zone (LF), where transpressional deformation has been associated with the displacement of a forearc sliver, matches the southern ending of the rupture and coincides with Tzz segmentation. (4) To the North, the Pichilemu Fault (PF) which coincides with Tzz along-strike segmentation, marks the northern ending of the Maule earthquake rupture (Figure 9).
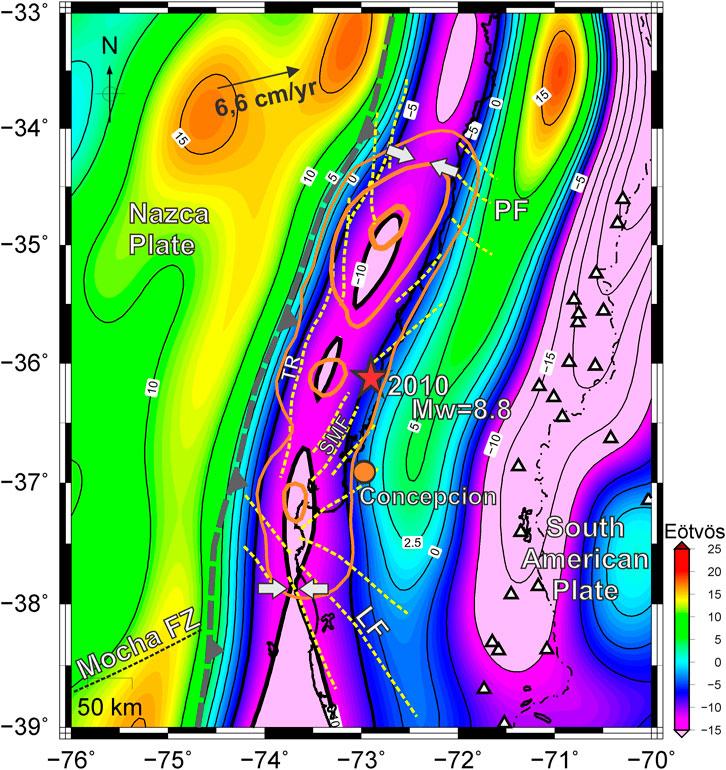
FIGURE 9. Topography and sediment corrected vertical gravity gradient in the region of Maule earthquake (along the southern Chilean margin) obtained from GOCE satellite-only model GO_CONS_GCF_2_DIR_R5 (Bruinsma et al., 2013) up to N=200 (Modified from Alvarez et al. 2019). The −5 Eötvös contour (thick black line) roughly coincides with the seismogenic zone along the forearc. The −10 Eötvös contour coincides with the location of maximum slip lobes. Solid white arrows indicate a narrowing of the Tzz minima contours which corresponds to main rupture limits. White dashed lines are major upper plate faults from Moreno et al. (2012): Thrust Ridge (TR), Santa María Fault (SMF), Lanalhue Fault (LF), and Pichilemu Fault (PF). References: Nazca-South American plates convergence (black arrow) is from De Mets et al. (2010), the Perú- Chilean trench is indicated with a grey dashed line. Superimposed slip distribution (orange solid line) for the 2010 Mw = 8.8 Maule (Moreno et al., 2012) earthquake. The red star indicates the epicenter.
For the Tohoku-Oki earthquake, the negative Tzz signal along the marine forearc (located approximately over 10 km and 30 km of slab contours), which coincided with the shallow fault portion S0 (Figure 6) proposed by Wei et al. (2012), could also be indicative of regions where thermal pressurization is favored, enhancing the probability of occurrence of a great megathrust earthquake. These authors explained that the theoretical framework from Noda and Lapusta (2010) provided one possible explanation of many aspects of the Tohoku-Oki earthquake. The last authors considered two patches, X and Y, (side-by-side with distinct hydraulic diffusivity (being lower within patch Y allowing for thermal pressurization within that patch only) and found that most events nucleated in X and sometimes propagated into Y where slip enhanced due to thermal pressurization. Then, as rupture enters patch Y, the pulse grows broader and the slip velocity increases reaching a much larger final slip in patch Y than in X. For the NE Japan forearc, Wei et al. (2012) proposed that the shallow fault portion S0 (Figure 6), where thermal pressurization has been favored, would rupture only occasionally in very large ruptures as occurred in the Tohoku-Oki earthquake (like patch Y in the simulations of Noda and Lapusta (2010)); while deeper regions should rupture more frequently during more moderate events (like patch X of Noda and Lapusta (2010)), agreeing with the more frequent M7 seismicity. These deeper regions, which present a positive Tzz signal, could be related to the A side from Noda and Lapusta (2010) with less thermal pressurization.
Forearc blocks mapped from the gravity-derived signal (e.g., negative Tzz lobes as asperity N° 2, or those in Figure 9 for Maule) could present a sustained subsidence behavior during the interseismic period (Figure 10) as they are under a high coupling degree (in the cases that the elastic deformation is not recovered during earthquakes, in agreement to that proposed by Sugiyama 1994 and Wells et al., 2003). The existence of this behavior can be found in a previous work, where Alvarez et al. (2015) found that the area where intense foreshocks and a slow slip event preceded the 2014 Iquique Mw = 8.1 earthquake (e.g., Ruiz et al., 2014), and later, maximum slip occurred (e.g., Hayes et al., 2014), presented subsidence in the late interseismic period. These results are also in agreement with the foreslip model of Socquet et al. (2017) (see Alvarez et al., 2015 for more details). Contreras Reyes (2018) inferred these subsided coastal blocks, characterized by a gravitational collapse of the outermost fore-arc, from 2-D velocity-depth models at different latitudes along the South American margin. The location of these blocks (Figures 4–6 from Contreras Reyes, 2018) agrees with low Tzz lobes (Alvarez et al., 2015; Alvarez et al., 2017b), which in turn present a great correlation with the maximum slip for different megathrust earthquakes (e.g., Pisagua-Iquique Mw = 8.2 2014, Tocopilla Mw = 7.7 2007, Illapel Mw=8.3 2015 earthquakes).
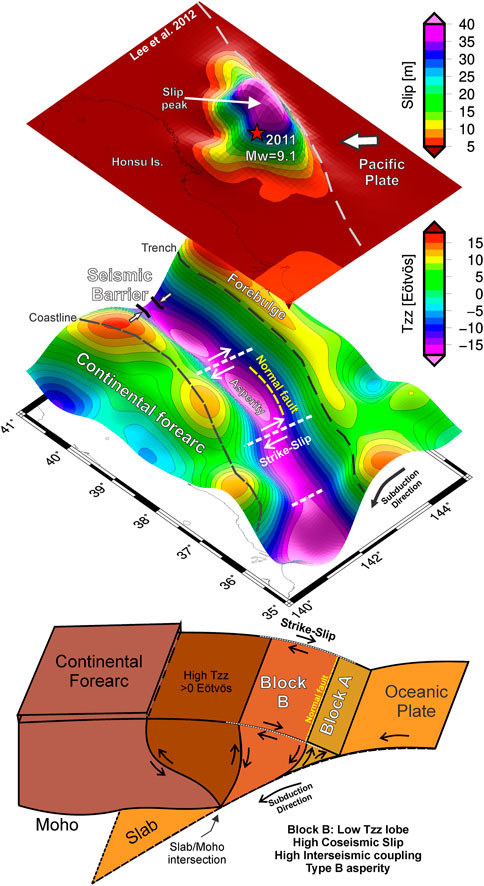
FIGURE 10. 3D view of the cosesimic slip model from Wei et al. (2012) and Tzz from GOCE up to N = 200. The maximum slip occurred over minima Tzz lobe, limited along-strike by strike-slip faults, and by a normal fault in the up-dip direction affecting the submerged forearc. The high gradient across strike in the down-dip coincided with the slab/Moho intersection. The model proposed implies a block B under subsidence during the interseismic period (when coupling is significative), modeled by a low Tzz lobe using the GOCE signal. Along different subduction settings, these low Tzz lobes agree with high interseismic coupling areas and with high slip during the co-seismic stage.
Conclusion
Along different tested subduction zones (South America, Mexico, Sunda, NE Japan), we have observed a strong correlation between the seismogenic behavior during rupture of megathrust earthquakes and fore-arc density structure (Alvarez et al., 2014; Alvarez et al., 2019; Alvarez et al., 2021). Maximum slip from different megathrust earthquakes, including the last three largest measured, agree with minima Tzz lobes mapped from GOCE models up to degree/order N = 200. This leads to proposing that we can map asperities from domain B (Lay et al., 2012) and, in some cases, asperities located in domain C (e.g., Alvarez et al., 2017a; Alvarez et al., 2019). Interposed relative Tzz highs (between minima lobes) mapped in these works were associated with seismic barriers in agreement with historic seismic segmentation (e.g., Sparkes et al., 2010; Contreras-Reyes and Carrizo, 2011), recent co-seismic slip models (e.g., Chlieh et al., 2007; Moreno et al., 2012) and also the degree of interseismic coupling (Metois et al., 2012; Metois et al., 2016). These relatively higher Tzz are mostly related to oceanic subducting plate topographic highs (e.g., seamounts, aseismic ridges, fracture zones, etc.), but also to forearc lithological heterogeneities and geological structures (Alvarez et al., 2019; Alvarez et al., 2021).
In this work, we performed a spectral analysis between the Tzz and three different slip models finding a correlation that ranges from 0.8 to 0.9, demonstrating the key role of forearc density structure and internal faulting in co-seismic development. From a large number of works that have addressed the Thohoku-Oki earthquake from different approaches, a fault-limited forearc block (lobe N° 2) is delimited using the gravity-derived signal, a case similar to the Maule earthquake along the South American margin. This block, developed along the marine forearc, is controlled by a parallel-to-the-trench normal fault that accommodates subsidence during the interseismic period. During this stage, this forearc block couples with the subducted slab subsiding (similarly to the Iquique-Pisagua earthquake studied in Alvarez et al., 2017b) resulting in a low Tzz lobe. This low Tzz lobe matches highly coupling patches, as observed along central to southern Chile (Alvarez et al., 2019) and along the Mentawi region in the Sunda subduction zone (Alvarez et al., 2021). Then, after earthquake nucleation, this block is decoupled in the co-seismic, promoting tectonic inversion and uplift, enhanced by thermal pressurization.
In this way, from the vertical gravity gradient, it is possible to map forearc geological structures and lithological heterogeneities that are first-order characteristics controlling earthquakes nucleation, directivity, and maximum slip location. Thus, the knowledge of the density structure along the marine forearc greatly improves the understanding of seismogenic processes and related hazards along a subduction zone.
Data availability statement
The raw data supporting the conclusion of this article will be made available by the authors, without undue reservation.
Author contributions
OA: Have been involved in drafting the manuscript and shaping the figures, data processing, analysis and interpretation. MG: Have made substantial contributions to conception, analysis and interpretation of data. AF: Have been involved in revising it critically for important geological content and geodinamyc context, language and figures edititng.
Acknowledgments
The authors acknowledge the use of the GMT-mapping software of Wessel et al. (2019). The authors would like to acknowledge CONICET Argentina. Satellite GOCE models and derived data can be downloaded from the International Centre for Global Earth Models (ICGEM) http://icgem.gfz-potsdam.de/home. Topographic correction can be performed by forward modeling of gravitational fields in spherical coordinates following Uieda et al. (2016), software freely available at Zenodo: doi:10.5281/zenodo.582366, http://tesseroids.leouieda.com.
Conflict of interest
The authors declare that the research was conducted in the absence of any commercial or financial relationships that could be construed as a potential conflict of interest.
Publisher’s note
All claims expressed in this article are solely those of the authors and do not necessarily represent those of their affiliated organizations, or those of the publisher, the editors and the reviewers. Any product that may be evaluated in this article, or claim that may be made by its manufacturer, is not guaranteed or endorsed by the publisher.
Supplementary material
The Supplementary Material for this article can be found online at: https://www.frontiersin.org/articles/10.3389/feart.2022.1068435/full#supplementary-material
References
Alvarez, O., Gimenez, M. E., Braitenberg, C., and Folguera, A. (2012). GOCE satellite derived gravity and gravity gradient corrected for topographic effect in the South Central Andes region. Geophys. J. Int. 190 (2), 941–959. doi:10.1111/j.1365-246X.2012.05556.x
Alvarez, O., Nacif, S., Gimenez, M., Folguera, A., and Braitenberg, C. (2014). GOCE derived vertical gravity gradient delineates great earthquake rupture zones along the Chilean margin. Tectonophysics 622, 198–215. doi:10.1016/j.tecto.2014.03.011
Alvarez, O., Nacif, S., Spagnotto, S., Folguera, A., Gimenez, M., Chlieh, M., et al. (2015). Gradients from GOCE reveal gravity changes before Pisagua Mw=8.2 and Iquique Mw=7.7 large megathrust earthquakes. J. South Am. Earth Sci. 64 (P2), 273–287. doi:10.1016/j.jsames.2015.09.014
Alvarez, O., Pesce, A., Gimenez, M., Folguera, A., Soler, S., and Chen, W. (2017a). Analysis of the Illapel Mw=8.3 thrust earthquake rupture zone using GOCE derived gradients. Pure Appl. Geophys. 174 (1), 47–75. doi:10.1007/s00024-016-1376-y
Alvarez, O., Folguera, A., and Gimenez, M. E. (2017b). Rupture area analysis of the Ecuador (Musine) Mw=7.8 thrust earthquake on april 16 2016, using GOCE derived gradients. Geod. Geodyn. 8, 49–58. doi:10.1016/j.geog.2017.01.005
Alvarez, O., Gimenez, M., Folguera, A., Moreno Chaves, C. A., and Braitenberg, C. (2019). Reviewing megathrust slip behavior for recent Mw > 8.0 earthquakes along the Peru-Chilean margin from satellite GOCE gravity field derivatives. Tectonophysics 769, 228188. doi:10.1016/j.tecto.2019.228188
Alvarez, O., Pechuan Canet, S., Gimenez, M. E., and Folguera, A. (2021). Megathrust slip behavior for great earthquakes along the sumatra-andaman subduction zone mapped from satellite GOCE gravity field derivatives. Front. Earth Sci. (Lausanne). 8, 581396. Research Topic: Major to Great Earthquakes: Multidisciplinary Geophysical Analyses for Source Characterization. doi:10.3389/feart.2020.581396
Álvarez, O., Gimenez, M., Guillen, S., Tocho, C., and Folguera, A. (2018a). Goce derived geoid changes before the Pisagua 2014 earthquake. Geod. Geodyn. 9, 50–56. doi:10.1016/j.geog.2017.09.005
Amante, C., and Eakins, B. W. (2009)ETOPO1, 1 Arc-Minute global relief model: procedures, data sources and analysis NOAA technicalmemorandum NESDIS. National Geophysical Data Center, NOAA 24, 19. doi:10.7289/V5C8276M
Ammon, C. J., Lay, T., Kanamori, H., and Cleveland, M. (2011). A rupture model of the 2011 off the Pacific coast of Tohoku Earthquake. Earth Planets Space 63, 693–696. doi:10.5047/eps.2011.05.015
Baba, K., and Yoshida, T. (2020). Geological structures controlled the rupture process of the 2011 M9.0 Tohoku-Oki earthquake in the Northeast Japan Arc. Earth Planets Space 72, 94. doi:10.1186/s40623-020-01212-3
Barthelmes, F. (2013). “Definition of functionals of the geopotential and their calculation from spherical harmonic models,” in Theory and formulas used by the calculation service of the international Centre for global Earth models (ICGEM). Scientific technical report, STR09/02, revised edition, Jannuary2013 (Postdam, Germany: GFZ German Research Centre for Geosciences). doi:10.2312/GFZ.b103-0902-26
Bassett, D., Sandwell, D., Fialko, Y., and Watts, A. B. (2016). Upper-plate controls on co-seismic slip in the 2011 magnitude 9.0 Tohoku-oki earthquake. Nature 531, 92–96. doi:10.1038/nature16945
Bassett, D., and Watts, A. B. (2015). Gravity anomalies, crustal structure, and seismicity at subduction zones: 2. Interrelationships between fore-arc structure and seismogenic behavior. Geochem. Geophys. Geosyst. 16, 1541–1576. doi:10.1002/2014GC005685
Bletery, Q., Sladen, A., Delouis, B., Vallée, M., Nocquet, J.-M., Rolland, L., et al. (2014). A detailed source model for theMw9.0 Tohoku-Oki earthquake reconciling geodesy, seismology, and tsunami records. J. Geophys. Res. Solid Earth 119, 7636–7653. doi:10.1002/2014JB011261
Braitenberg, C., Mariani, P., Ebbing, J., and Sprlak, M. (2011). “The enigmatic Chad lineament revisited with global gravity and gravity-gradient fields,” in The Formation and evolution of africa: A synopsis of 3.8 Ga of Earth history, geol. Soc. London spec. Publ. Editors D. J. J. Van Hinsbergen, S. J. H. Buiter, T. H. Torsvik, C. Gaina, and S. J. Webb (London: Geological Society), 357, 329–341. doi:10.1144/SP357.18
Braitenberg, C., Wienecke, S., Ebbing, J., Bom, W., and Redfield, T. (2007). “Joint gravity and isostatic analysis for basement studies-a novel tool,” in Proceedings, EGM 2007 international wokshop, innovation on in EM, grav. And mag. Methods: A new perspective for exploration, villa orlandi capri, extended abstracts.
Bruinsma, S. L., Marty, J. C., Balmino, G., Biancale, R., Förste, C., Abrikosov, O., et al. (2010). “GOCE gravity field recovery by means of the direct numerical method,” in Proceedings of the ESA living planet symposium. Editor H. Lacoste-Francis (Bergen, Norway: ESA Publication), SP-686.
Bruinsma, S. L., Förste, C., Abrikosov, O., Lemoine, J.-M., Marty, J.-C., Mulet, S., et al. (2014). ESA’s satellite-only gravity field model via the direct approach based on all GOCE data. Geophys. Res. Lett. 41, 7508–7514. doi:10.1002/2014GL062045
Bruinsma, S. L., Forste, C., Abrikosov, O., Marty, J. C., Rio, M. H., Mulet, S., et al. (2013). The new ESA satellite-only gravity field model via the direct approach. Geophys. Res. Lett. 40 (14), 3607–3612. doi:10.1002/grl.50716
Cambiotti, G., and Sabadini, R. (2012). A source model for the great 2011 Tohoku earthquake (Mw = 9.1) from inversion of GRACE gravity data. Earth Planet. Sci. Lett. 335, 72–79. doi:10.1016/j.epsl.2012.05.002
Cambiotti, G., and Sabadini, R. (2013). Gravitational seismology retrieving centroid-moment-tensor solution of the 2011 Tohoku earthquake. J. Geophys. Res. Solid Earth 118, 183–194. doi:10.1029/2012JB009555
Chlieh, M., Avouac, J. P., Hjorleifsdottir, V., Song, T. R. A., Ji, C., Sieh, K., et al. (2007). Coseismic slip and afterslip of the great Mw 9.15 Sumatra-Andaman earthquake of 2004. Bull. Seismol. Soc. Am. 97 (1A), S152–S173. doi:10.1785/0120050631
Chlieh, M., Avouac, J. P., Sieh, K., Natawidjaja, D. H., and Galetzka, J. (2008). Heterogeneous coupling of the Sumatran megathrust constrained by geodetic and paleogeodetic measurements. J. Geophys. Res. 113, B05305. doi:10.1029/2007JB004981
Chlieh, M., Perfettini, H., Tavera, H., Avouac, J., Remy, D., Nocquet, J., et al. (2011). Interseismic coupling and seismic potential along the Central Andes subduction zone. J. Geophys. Res. 116, B12405. doi:10.1029/2010JB008166
Contreras-Reyes, E., and Carrizo, D. (2011). Control of high oceanic features ans subduction channel on earthquake ruptures along the Chile-Peru subduction zone. Phys. Earth Planet. Inter. 186, 49–58. doi:10.1016/j.pepi.2011.03.002
Contreras-Reyes, E. (2018). “Structure and tectonics of the Chilean convergent margin from wide-angle seismic studies: A review,” in The evolution of the Chilean-argentinean andes. Springer Earth system sciences. Editor A. Folgueraet al. (Cham: Springer). doi:10.1007/978-3-319-67774-3_1
Contreras-Reyes, E., Flueh, E. R., and Grevemeyer, I. (2010). Tectonic control on sediment accretion and subduction off south central Chile: Implications for coseismic rupture processes of the 1960 and 2010 megathrust earthquakes. Tectonics 29, TC6018. doi:10.1029/2010TC002734
Cubas, N., Avouac, J., Leroy, Y., and Pons, A. (2013). Low friction along the high slip patch of the 2011 Mw 9.0 Tohoku-Oki earthquake required from the wedge structure and extensional splay faults. Geophys. Res. Lett. 40, 4231–4237. doi:10.1002/grl.50682
Dai, C., Shum, C. K., Wang, R., Wang, L., Guo, J., Shang, K., et al. (2014). Improved constraints on seismic source parameters of the 2011 Tohoku earthquake from GRACE gravity and gravity gradient changes. Geophys. Res. Lett. 41, 1929–1936. doi:10.1002/2013GL059178
DeMets, C., Gordon, R. G., Argus, D. F., and Stein, S. (1994). Effect of recent revisions to the geomagnetic reversal time-scale on estimates of current plate motions. Geophys. Res. Lett. 21, 2191–2194. doi:10.1029/94GL02118
DeMets, C., Gordon, R. G., and Argus, D. F. (2010). Geologically current plate motions. Geophys. J. Int. 181, 1–80. doi:10.1111/j.1365-246X.2009.04491.x
Featherstone, W. (1997). On the use of the geoid in geophysics: A case study over the north west shelf of Australia. Explor. Geophys. 28 (1/2), 52–57. doi:10.1071/eg997052
Fuchs, M., Bouman, J., Broerse, T., Visser, P., and Vermeersen, B. (2013). Observing coseismic gravity change from the Japan Tohoku-Oki 2011 earthquake with GOCE gravity gradiometry. J. Geophys. Res. Solid Earth 118, 5712–5721. doi:10.1002/jgrb.50381
Fuchs, M., Broerse, T., Hooper, A., Pietrzak, J., and Bouman, J. (2015). “Grace gravity data to enhance the modeling of coseismic slip distribution for the 2011 Tohoku-Oki earthquake,” in IAG 150 years. International association of geodesy symposia. Editors C. Rizos, and P. Willis (Cham: Springer), Vol. 143. doi:10.1007/1345_2015_90
Fuchs, M. J., Hooper, A., Broerse, T., and Bouman, J. (2016). Distributed fault slip model for the 2011 Tohoku-Oki earthquake from GNSS and GRACE/GOCE satellite gravimetry. JGR. Solid Earth 121, 1114–1130. doi:10.1002/2015JB012165
Geersen, J., Behrmann, J., Völker, D., Krastel, S., R. Ranero, C., Diaz-Naveas, J., et al. (2011). Active tectonics of the South Chilean marine fore arc (35°S–40°S). Tectonics 30. doi:10.1029/2010TC002777
Graindorge, D., Klingelhoefer, F., Sibuet, J. C., McNeill, L., Henstock, T. J., Dean, S., et al. (2008). Impact of lower plate structure on upper plate deformation at the NW Sumatran convergent margin from seafloor morphology. Earth Planet. Sci. Lett. 275, 201–210. doi:10.1016/j.epsl.2008.04.053
Grevemeyer, I., and Tiwari, V. M. (2006). Overriding plate controls spatial distribution of megathrust earthquakes in the Sunda–Andaman subduction zone. Earth Planet. Sci. Lett. 251, 199–208. doi:10.1016/j.epsl.2006.08.021
Han, S. C., Shum, C., Bevis, M., Ji, C., and Kuo, C. (2006). Crustal dilatation observed by GRACE after the 2004 sumatra-andaman earthquake. Science 313, 658–662. doi:10.1126/science.1128661
Han, S.-C., Sauber, J., and Luthcke, S. (2010). Regional gravity decrease after the 2010 Maule (Chile) earthquake indicates large-scale mass redistribution. Geophys. Res. Lett. 37, L23307. doi:10.1029/2010GL045449
Han, S. C., Sauber, J., and Riva, R. (2011). Contribution of satellite gravimetry to understanding seismic source processes of the 2011 Tohoku-Oki earthquake. Geophys. Res. Lett. 38, L24312. doi:10.1029/2011GL049975
Han, S. C., Sauber, J., and Pollitz, F. (2014). Broadscale postseismic gravity change following the 2011 Tohoku-Oki earthquake and implication for deformation by viscoelastic relaxation and afterslip. Geophys. Res. Lett. 41, 5797–5805. doi:10.1002/2014GL060905
Hashimoto, C., Noda, A., Sagiya, T., and Matsu’ura, M. (2009). Interplateseismogenic zones along the Kuril–Japan trench inferred from GPS data inversion. Nat. Geosci. 2, 141–144. doi:10.1038/ngeo421
Hayes, G. P., Herman, M. W., Barnhart, W. D., Furlong, K. P., Riquelme, S., Benz, H. M., et al. (2014). Continuingmegathrust earthquake potential in Chile after the 2014 Iquique earthquake. Nature 512, 295–298. doi:10.1038/nature13677
Hayes, G. (2018). Slab2 – a comprehensive subduction zone geometry model. Science 362, 58–61. doi:10.1126/science.aat4723
Heki, K., and Matsuo, K. (2010). Coseismic gravity changes of the 2010 earthquake in central Chile from satellite gravimetry. Geophys. Res. Lett. 37, L24306. doi:10.1029/2010GL045335
Henstock, T. J., McNeill, L. C., Bull, J. M., Cook, B. J., Gulick, S. P. S., Austin, J. A., et al. (2016). Downgoing plate topography stopped rupture in the A.D. 2005 Sumatra earthquake. Geology 44 (1), 71–74. doi:10.1130/G37258.1
Hicks, S. P., Rietbrock, A., Rydera, I. M. A., Lee, C-S., and Miller, M. (2014). Anatomy of a megathrust: The 2010 M8.8 Maule, Chile earthquake rupture zone imaged using seismic tomography. Earth Planet. Sci. Lett. 405, 142–155. doi:10.1016/j.epsl.2014.08.028
Ide, S., Baltay, A., and Beroza, G. C. (2011). Shallow dynamic overshoot and energetic deep rupture in the 2011 Mw 9.0 Tohoku-Oki earthquake. Science 332, 1426–1429. doi:10.1126/science.1207020
Isozaki, Y., Aoki, K., Nakama, T., and Yanai, S. (2010). New insight into a subduction-related orogen: A reappraisal of the geotectonic framework and evolution of the Japanese islands. Gondwana Res. 18, 82–105. doi:10.1016/j.gr.2010.02.015
Janak, J., and Sprlak, M. (2006). New software for gravity field modelling using spherical armonic. Geod. Cartog. Hor. 52, 1–8. (in Slovak).
Kanamori, H. (1972). Mechanism of tsunami earthquakes. Physics of the Earth and Planetary Interiors 6 (5), 346–359. doi:10.1016/0031-9201(72)90058-1
Koketsu, K., Yokota, Y., Nishimura, N., Yagi, Y., Miyazaki, S., Satake, K., et al. (2011). A unified source model for the 2011 Tohoku earthquake. Earth Planet. Sci. Lett. 310, 480–487. doi:10.1016/j.epsl.2011.09.009
Konca, A. O., Avouac, J. P., Sladen, A., Meltzner, A. J., Sieh, K., Fang, P., et al. (2008). Partial rupture of a locked patch of the Sumatra megathrust during the 2007 earthquake sequence. Nature 456 (7222), 631–635. doi:10.1038/nature07572
Kopp, H. (2013). Invited review paper: The control of subduction zone structural complexity and geometry on margin segmentation and seismicity. Tectonophysics 589, 1–16. doi:10.1016/j.tecto.2012.12.037
Lay, T., Kanamori, H., and Ruff, L. (1982). The asperity model and the nature of large subduction zone earthquakes. Earthq. Pred. Res. 1, 3–71. doi:10.1029/ME004p0579
Lay, T., Kanamori, H., Ammon, C., Koper, K., Hutko, A., Ye, L., et al. (2012). Depth varying rupture properties of subduction zone megathrust faults. J. Geophys. Res. 117, B04311. doi:10.1029/2011JB009133
Lay, T., and Kanamori, H. (1981). “An asperity model of large earthquake sequences,” in Earthquake prediction, an international review. Editors D. W. Simpson, and P. G. Richards (Maurice Ewing Book Series). (American Geophysical Union (AGU)), 4, 579–592. doi:10.1029/ME004p0579
Lee, S. J., Huang, B. S., Ando, M., Chiu, H. C., and Wang, J. H. (2011). Evidence of large scale repeating slip during the 2011 Tohoku-Okie arthquake. Geophys. Res. Lett. 38. doi:10.1029/2011gl049580
Li, X. (2001). Vertical resolution: Gravity versus vertical gravity gradient. Lead. Edge 20, 901–904. doi:10.1190/1.1487304
Loveless, J. P., and Meade, B. J. (2010). Geodetic imaging of plate motions, slip rates, and partitioning of deformation in Japan. J. Geophys. Res. 115, B02410. doi:10.1029/2008JB006248
Loveless, J. P., and Meade, B. J. (2011). Spatial correlation of interseismic coupling and coseismic rupture extent of the 2011 Mw =9.0 Tohoku-okiearthquake. Geophys. Res. Lett. 38. doi:10.1029/2011GL048561
Matsuo, K., and Heki, K. (2011). Coseismic gravity changes of the 2011 Tohoku-oki earthquake from satellite gravimetry. Geophys. Res. Lett. 38, L00G12. doi:10.1029/2011GL049018
Melnick, D., Bookhagen, B., Strecker, M., and Echtler, H. (2009). Segmentation of megathrust rupture zones from fore-arc deformation patterns over hundreds to millions of years, Arauco peninsula, Chile. J. Geophys. Res. 114. doi:10.1029/2008JB005788
Métois, M., Socquet, A., and Vigny, C. (2012). Interseismic coupling, segmentation and mechanical behavior of the central Chile subduction zone. J. Geophys. Res. 117 (B3). doi:10.1029/2011JB008736
Métois, M., Vigny, C., and Socquet, A. (2016). Interseismic coupling, megathrust earthquakes and seismic swarms along the Chilean subduction zone (38°–18°S). Pure Appl. Geophys. 173, 1431–1449. doi:10.1007/s00024-016-1280-5
Mochizuki, K., Yamada, T., Shinohara, M., Yamanaka, Y., and Kanazawa, T. (2008). Weak interplate coupling by seamounts and repeating M ∼ 7 earthquakes. Science 321 (5893), 1194–1197. doi:10.1126/science.1160250
Moreno, M., Melnick, D., Rosenau, M., Baez, J., Klotz, J., Oncken, O., et al. (2012). Toward understanding tectonic control on the Mw 8.8 2010 Maule Chile earthquake. Earth Planet. Sci. Lett. 321-322, 152–165. doi:10.1016/j.epsl.2012.01.006
Moscoso, E., Grevemeyer, I., Contreras-Reyes, E., Flueh, E., Dzierma, Y., Rabbel, W., et al. (2011). Revealing the deep structure and rupture plane of the 2010 Maule, Chile earthquake (mw=8.8) using wide angle seismic data. Earth Planet. Sci. Lett. 307 (1–2), 147–155. doi:10.1016/j.epsl.2011.04.025
Nakatani, Y., Mochizuki, K., Shinohara, M., Yamada, T., Hino, R., Ito, Y., et al. (2015). Changes in seismicity before and after the 2011 Tohoku earthquake around its southern limit revealed by dense ocean bottom seismic array data. Geophys. Res. Lett. 42, 1384–1389. doi:10.1002/2015GL063140
Noda, H., and Lapusta, N. (2013). Stable creeping fault segments can become destructive as a result of dynamic weakening. Nature 493 (7433), 518–521. doi:10.1038/nature11703
Obana, k. (2013). Aftershocks near the updip end of the 2011 Tohoku-Oki earthquake. Earth Planet. Sci. Lett. 382, 111–116. doi:10.1016/j.epsl.2013.09.007
Ogawa, R., and Heki, K. (2007). Slow postseismic recovery of geoid depression formed by the 2004 Sumatra-Andaman earthquake by mantle water diffusion. Geophys. Res. Lett. 34, L06313. doi:10.1029/2007GL029340
Okubo, S. (1992). Gravity and potential changes due to shear and tensile faults in a half-space. J. Geophys. Res. 97, 7137–7144. doi:10.1029/92JB00178
Ozawa, S., Nishimura, T., Suito, H., Kobayashi, T., Tobita, M., and Imakiire, T. (2011). Coseismic and postseismic slip of the 2011 magnitude-9 Tohoku-Oki earthquake. Nature 475, 373–376. doi:10.1038/nature10227
Ozawa, S., Nishimura, T., Munekane, H., Suito, H., Kobayashi, T., Tobita, M., et al. (2012). Preceding, coseismic, and postseismic slips of the 2011 Tohoku earthquake, Japan. J. Geophys. Res. 117, B07404. doi:10.1029/2011JB009120
Pail, R., Bruinsma, S., Migliaccio, F., Förste, C., Goiginger, H., Schuh, W. D., et al. (2011). First GOCE gravity field models derived by three different approaches. J. Geod. 85, 819–843. doi:10.1007/s00190-011-0467-x
Panet, I., Mikhailov, V., Diament, M., Pollitz, F., King, G., De Viron, O., et al. (2007). Coseismic and post-seismic signatures of the Sumatra 2004 December and 2005 March earthquakes in GRACE satellite gravity. Geophys. J. Int. 171, 177–190. doi:10.1111/j.1365-246X.2007.03525.x
Panet, I., Pollitz, F., Mikhailov, V., Diament, M., Banerjee, P., and Grijalva, K. (2010). Upper mantle rheology from GRACE and GPS postseismic deformation after the 2004 Sumatra-Andaman earthquake. Geochem. Geophys. Geosyst. 11, Q06008. doi:10.1029/2009GC002905
Panet, I., Bonvalot, S., Narteau, C., Remy, D., and Lemoine, J. M. (2018). Migrating pattern of deformation prior to the Tohoku-Oki earthquake revealed by GRACE data. Nat. Geosci. 11, 367–373. doi:10.1038/s41561-018-0099-3
Perfettini, H., and Avouac, J. P. (2014). The seismic cycle in the area of the 2011Mw9.0 Tohoku-Oki earthquake. J. Geophys. Res. Solid Earth 119, 4469–4515. doi:10.1002/2013JB010697
Pollitz, F. (1997). Gravity anomaly from faulting on a layered spherical Earth with application to central Japan. Phys. Earth Planet. Interiors 99, 259–271. doi:10.1016/S0031-9201(96)03204-9
Ruiz, S., Metois, M., Fuenzalida, A., Ruiz, J., Leyton, F., Grandin, R., et al. (2014). Intense foreshocks and a slow slip event preceded the 2014 Iquique Mw 8.1 earthquake. Science 345, 1165–1169. doi:10.1126/science.1256074
Schorlemmer, D., and Wiemer, S. (2005). Microseismicity data forecast rupture area. Nature 434, 1086. doi:10.1038/4341086a
Shao, G. F., Li, X. Y., Ji, C., and Maeda, T. (2011). Focal mechanism and slip history of the 2011 M(w) 9.1 off the Pacific coast of Tohoku Earthquake, constrained with teleseismic body and surface waves. Earth Planets Space 63, 559–564. doi:10.5047/eps.2011.06.028
Sobiesiak, M. M., Meyer, U., Schmidt, S., Götze, H. J., and Krawczyk, C. (2007). Asperity generating upper crustal sources revealed bybvalue and isostatic residual anomaly grids in the area of Antofagasta, Chile. J. Geophys. Res. 112, B12308. doi:10.1029/2006JB004796
Socquet, A., Valdes, J. P., Jara, J., Cotton, F., Walpersdorf, A., Cotte, N., et al. (2017). An 8 month slow slip event triggers progressive nucleation of the 2014 Chile megathrust. Geophys. Res. Lett. 44, 4046–4053. doi:10.1002/2017GL073023
Song, T. R., and Simons, M. (2003). Large trench-parallel gravity variations predict seismogenic behavior in subduction zones. Science 301, 630–633. doi:10.1126/science.1085557
Sparkes, R., Tilmann, F., Hovius, N., and Hillier, J. (2010). Subducted seafloor relief stops rupture in South American great earthquakes: Implications for rupture behaviour in the 2010 Maule, Chile earthquake. Earth Planet. Sci. Lett. 298, 89–94. doi:10.1016/j.epsl.2010.07.029
Suwa, Y., Miura, S., Hasegawa, A., Sato, T., and Tachibana, K. (2006). Interplate coupling beneath NE Japan inferred from three-dimensional displacement field. J. Geophys. Res. 111, B04402. doi:10.1029/2004JB003203
Tassara, A. (2010). Control of forearc density structure on megathrust shear strength along the Chilean subduction zone. Tectonophysics 495, 34–47. doi:10.1016/j.tecto.2010.06.004
Tormann, T., Enescu, B., Woessner, J., and Wiemer, S. (2015). Randomness of megathrust earthquakes implied by rapid stress recovery after the Japan earthquake. Nat. Geosci. 8, 152–158. doi:10.1038/ngeo2343
Tsuji, T., Ito, Y., Kido, M., Osada, Y., Fujimoto, H., Ashi, J., et al. (2011). Potential tsunamigenic faults of the 2011 off the pacific coast of Tohoku earthquake. Earth Planets Space 63 (7), 831–834. doi:10.5047/eps.2011.05.028
Tsuji, T., Kawamura, K., Kanamatsu, T., Kasaya, T., Fujikura, K., Ito, Y., et al. (2013). Extension of continental crust by anelastic deformation during the 2011 Tohoku-Oki earthquake: The role of extensional faulting in the generation of a great tsunami. Earth Planet. Sci. Lett. 364, 44–58. doi:10.1016/j.epsl.2012.12.038
Uieda, L., Ussami, N., and Braitenberg, C. F. (2010). Computation of the gravity gradient tensor due to topographic masses using tesseroids. Eos Trans. AGU 91 (26). Meeting America Supply, Abstract G22A-04. World Wide Web Address: http://code.google.com/p/tesseroids/.
Uieda, L., Barbosa, V., and Braitenberg, C. (2016). Tesseroids: Forward-modeling gravitational fields in spherical coordinates. Geophysics 81, F41–F48. doi:10.1190/geo2015-0204.1
Wang, L., Shum, C., Simons, F., Tassara, A., Erkan, K., Jekeli, C., et al. (2012a). Coseismic slip of the 2010 Mw 8.8 Great Maule, Chile, earthquake quantified by the inversion of GRACE observations. Earth Planet. Sci. Lett. 335–336, 167–179. doi:10.1016/j.epsl.2012.04.044
Wang, L., Shum, C. K., Simons, F. J., Tapley, B., and Dai, C. (2012b). Coseismic and postseismic deformation of the 2011 Tohoku-Oki earthquake constrained by GRACE gravimetry. Geophys. Res. Lett. 39, L07301. doi:10.1029/2012GL051104
Wang, L., Shum, C., and Jekeli, C. (2012c). Gravitational gradient changes following the 2004 December 26 Sumatra–Andaman earthquake inferred from GRACE. Geophys. J. Int. 191 (3), 1109–1118. doi:10.1111/j.1365-246X.2012.05674.x
Wei, S., Graves, R., Helmberger, D., Avouac, J. P., and Jiang, J. (2012). Sources of shaking and flooding during the tohoku-oki earthquake: A mixture of rupture styles. Earth Planet. Sci. Lett. 333-334, 91–100. doi:10.1016/j.epsl.2012.04.006
Wells, R. E., Blakely, R. J., Sugiyama, Y., Scholl, D. W., and Dinterman, P. A. (2003). Basin centered asperities in great subduction zone earthquakes: A link between slip, subsidence and subduction erosion? J. Geophys. Res. 108 (B10), 2507–2536. doi:10.1029/2002JB002072
Wessel, P., Luis, J. F., Uieda, L., Scharroo, R., Wobbe, F., Smith, W. H. F., et al. (2019). The generic mapping tools version 6. Geochem. Geophys. Geosyst. 20, 5556–5564. doi:10.1029/2019GC008515
Wienecke, S., Braitenberg, C., and Göetze, H. J. (2007). A new analytical solution for estimating the flexural rigidity in the Central Andes. Geophys. J. Int. 169, 789–794. doi:10.1111/j.1365-246X.2007.3396.x
Zhou, X., Sun, W., Zhao, B., Fu, G., Dong, J., and Nie, Z. (2012). Geodetic observations detecting coseismic displacements and gravity changes caused by the Mw = 9.0 Tohoku-Oki earthquake. J. Geophys. Res. 117, B05408. doi:10.1029/2011JB008849
Keywords: GOCE (gravity field and steady-state ocean-circulation explorer), vertical gravity gradient, Tohoku 2011 earthquake, coseismic, forearc structure
Citation: Álvarez O, Gimenez M and Folguera A (2022) Analysis of the coseismic slip behavior for the MW = 9.1 2011 Tohoku-Oki earthquake from satellite GOCE vertical gravity gradient. Front. Earth Sci. 10:1068435. doi: 10.3389/feart.2022.1068435
Received: 12 October 2022; Accepted: 23 November 2022;
Published: 06 December 2022.
Edited by:
Mauricio Fuentes, University of Chile, ChileReviewed by:
Joern Lauterjung, GFZ German Research Centre for Geosciences, GermanyRobert Tenzer, Hong Kong Polytechnic University, Hong Kong SAR, China
Copyright © 2022 Álvarez, Gimenez and Folguera. This is an open-access article distributed under the terms of the Creative Commons Attribution License (CC BY). The use, distribution or reproduction in other forums is permitted, provided the original author(s) and the copyright owner(s) are credited and that the original publication in this journal is cited, in accordance with accepted academic practice. No use, distribution or reproduction is permitted which does not comply with these terms.
*Correspondence: Orlando Álvarez, b3JsYW5kb19hX3BAeWFob28uY29tLmFy, b3JsYW5kby5hbHZhcmV6QGNvbmljZXQuZ292LmFy