 Weiwei Xie
 Yaning Dong1*
- 1Research Institute for Eco-civilization, Chinese Academy of Social Sciences, Beijing, China
- 2Institute of Spatial Planning and Regional Economy, The Academy of Macroeconomic Research, Beijing, China
The green transition of the Yellow River Basin (YRB) plays an important role in China’s economic and social development, as well as its ecological security. In view of the wicked problem dilemmas of development and emissions reduction in the YRB, this study theoretically and empirically examines the driving forces of its green transition. A six-sector green endogenous growth model reveals that low-carbon governance and innovation activities are the main drivers of green transition. Subsequently, a panel econometric model empirically explores how these drivers can solve the challenges of green transition. The findings are summarized as follows: low-carbon governance and innovative human and physical capital are key elements of green transition. The investment and innovation-driven periods regression results confirm that these elements drive green transition in the latter period. The regional heterogeneity show that drivers can promote green transition in highly developed areas. At the same time, with the inflow of innovative human capital, the promotion of low-carbon governance and innovative human capital to green transition has increased to an extent. Hence, combining the urban development stage and level to avoid a uniform policy may be key to the green transition in the YRB.
1 Introduction
Environmental deterioration is a disastrous consequence of the global industrial revolution. Extreme weather events such as excessive precipitation, droughts, floods, cold waves, heat waves, and storms have become more frequent and intense, affecting regions worldwide (Hao et al., 2018; Zhu et al., 2022). The climate change phenomenon has forced nations to stress on global green transition, with its first aim being adherence to the Paris Agreement and systematic upgrades to eco-friendly human development (Roberts et al., 2018; Mao et al., 2019).
Carbon emissions reduction has long been a path to green transition (Zhou et al., 2022). According to Net Zero Tracker, most countries are now actively and systematically exploring emissions reduction; indeed, more than 68% of the 198 countries worldwide have thus far proposed carbon neutral, climate neutral, net zero, and other independent contribution emissions reduction targets. Countries that have reached the carbon peak have completed the historical mission of industrialization and urbanization (Dong et al., 2019). In terms of gross domestic product (GDP), the per capita GDP of some countries that have already reached their carbon peak (BP Statistical Review of World Energy, 2020) ranges from United States$ 26,000 to 44,000. The service industry often accounts for over 65% of the GDP, with the United States and Japan revealing shares as high as 76.8% and 73.8%, respectively (Word Bank, 2022). In 2021, for instance, China’s per capita GDP was United States $12,600, exceeding the global average for the first time; its service industry’s share of GDP and urbanization rate were 53.3% and 64.7%, respectively (CNBS, 2020). Still, China’s industrialization and urbanization are far from complete, leaving it vulnerable to the wicked dilemma of balancing development and emissions reduction to achieve carbon neutrality.
At a length of 5,464 km, Yellow River is only the second largest river in China after the Yangtze. Its origin lies in the Qinghai Tibet Plateau. Its vastness and richness has made the Yellow River the seat of China’s prosperity since the start of its civilizations, and it continues to serve as an important ecological barrier and economic growth rod. Thus, the sustainable development of the Yellow River YRB (from here, “YRB”) is essential to China’s economic, social, and environmental security (Sun et al., 2022). In September 2019, the General Office of the State Council of the People Republic of China listed ecological protection and high-quality development of the YRB as its prime national strategy, justifying the urgency of green transition therein. The cities surrounding the YRB comprise more than 27% of the national population but contribute only 21% to China’s GDP. Despite this relative underdevelopment, the YRB produces 33% of the total CO2 emissions, confirming the wicked dilemma between development and protection of the YRB (Figure 1).
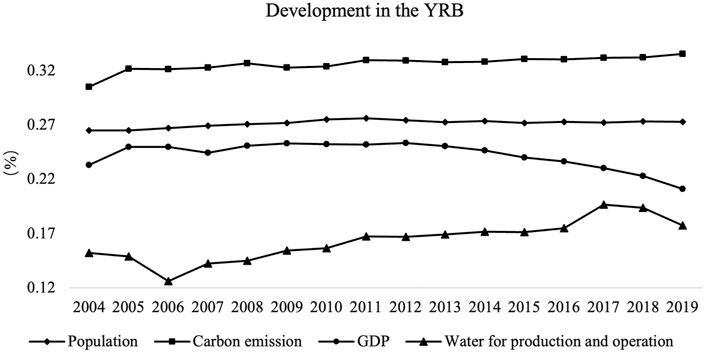
FIGURE 1. Trend of the proportion of population, economy, water resources and carbon emissions in the YRB of China from 2004 to 2019.
To progress in our research, we must understand two points. First, to scientifically judge the quality of regional green transition we must accurately measure green transition. Regional green transition refers to high efficiency and low emissions economic growth pattern that meets the concept of sustainable development (Zeng et al., 2023). Compared to the traditional development mode of high consumption and high emissions, both energy and environment are endogenous variables of sustainable development goals (Sun et al., 2019; Su and Zhang, 2020). We risk greatly overestimating green productivity if it is calculated without reflecting environmental factors. Indeed, Chen (2010) shows that the average annual productivity growth exclusive of environmental factors was more than 5% during 1980–2008, and only 2.29% inclusive of them. To address this problem, scholars now employ data envelopment analysis with energy and environmental variables as key factors for measuring green development (Lin and Benjamin, 2017; Huang et al., 2021). Still, research continues to stress on energy input in the measurement of green transition, while ignoring water as a resource and output.
Second, factors that drive green transition in river basins and urban agglomerations have been a popular—often singular—focus of scrutiny (Chen Y. et al., 2020). Environmental regulation is one such critically important factor (Wang et al., 2019). However, there are generally three types of cognition regarding the role of environmental regulation in green transition: promotion, inhibition, and uncertainty (Tian et al., 2022). Regarding promotion, studies show that environmental regulation has a direct positive role in promoting green transition or indirectly improves green total factor productivity (GTFP) through technological innovation or government actions (Zhai and An, 2020). A corresponding critique is that environmental regulations require enterprises to reduce pollution emissions in a way that increases the cost of pollution prevention and production. Ultimately, regulations are not conducive to improving GTFP (Ambec et al., 2013). The uncertainty view suggests that the relationship between environmental regulation and regional green transition is not simple and linear, but significantly U-shaped and curvilinear (Song et al., 2020). Empirical research in China also gives credence to this claim—various scholars show that environmental regulation may have a restraining effect on GTFP in the short term, but significantly promotes green transition in the long run (Wu et al., 2020; Du et al., 2021; Qiu et al., 2021).
Since China’s entry into information-based and innovation-driven development, the innovation vitality in environmental regulation is another key driver of green economic growth. Fan and Sun (2020) show that environmental regulation and green technology innovation are major drivers that promote green economic growth. Shangguan and Ge (2020) further discuss the synergistic effect of environmental regulation and technological innovation in promoting green economic growth. Despite the literature incorporating environmental regulation and technological innovation into a unified framework, the description of innovation activities still emphasizes a single output. The close relationship between innovation human capital and innovation material capital in promoting green transition continues to be ignored.
To address the question of how the YRB’s internal mechanism leads to the antagonistic characteristics of green transition, we first identify the mechanism that drives green transition at the theoretical level, and then construct regression models to test the driving mechanisms of the dilemmas of green transition in the YRB.
2 Theoretical framework
With the emergence of the endogenous growth model, economists began to introduce pollution into production functions and environmental quality into utility functions when discussing environmental deterioration and sustainable development under the framework of the new model. Representative models, such as Bovenberg and Smulders’ (1995) model, introduced environmental factors into a production function based on the Romer model. By extending Barro’s AK model and introducing a pollution index as one of the control variables of representative consumers. Stokey’s (1998) study focuses on the externality of environmental pollution and sustainable economic growth. Aghion and Howitt (1998) reasonably changed the Stokey’s (1998) model assumptions, stipulating a threshold value for environmental quality; if the level falls below this value, environmental damage would become irreversible. They then introduced environmental pollution into the new Schumpeter model to investigate the effect of environmental resource constraints on sustainable development. Then, Howitt and Aghion (1998) added pollution and non-renewable resources into the production function and environmental quality into the utility function to build an endogenous growth analysis framework. Although they did not perform further solution analysis, they employed Schumpeter and AK’s methods for comparative analysis. Later, Barbier (1999) introduced resource scarcity and population growth into the Romer Stiglitz model to explore the optimal equilibrium growth path.
Brock and Taylor (2005) regard nature both as a sink that accepts human waste and a source of economic growth. The “source and sink” approach simultaneously introduces energy and environmental constraints into the economic growth model. However, the model also introduces environmental pollution or environmental quality into the production function as exogenous variables instead of directly introducing environmental quality into the production function as a production factor. Thus, the model does not comprehensively consider the effect of environmental regulation and technological innovation on green transition from an endogenous perspective, and ultimately fails to systematically reveal its internal coupling mechanism.
The present study is based on the Romer model and introduces human capital development, natural resources development, and environmental management sectors. Among these, the human capital development sector conducts human capital development through investing of a certain amount of human capital, and its output is a human capital increment
a) Maximize consumer utility. It is assumed that both consumption and environmental pollution affect consumer utility, and the intertemporal utility function is as follows:
where
b) Product production sector. Natural resources and environmental factors are included in the Cobb–Douglas production function, and the total production function of the final product sector is expressed as:
where
c) Human capital sector. The total amount of human capital of the whole economic system is assumed to be
where
d) R&D sector. It is assumed that intellectual capital is a non-competitive investment; that is, when the R&D sector is developing new product design schemes or patents, it can freely obtain all knowledge. Here, the stock of knowledge capital represents the level of regional technological innovation. Assuming that the output level of the R&D sector mainly depends on the sector’s human capital input, innovation efficiency, and innovation quality, the R&D sector’s production function is set as:
where
e) Natural resources sector. Natural resources are the resources obtained from nature and consumed by human production activities. They include renewable and non-renewable natural resources. Non-renewable natural resources (e.g., oil and coal) are essential input factors in current economic development. As water is the key factor for high-quality development in the YRB, natural resources here mainly refer to water resources and non-renewable natural resources. It is assumed that the production function of the natural resources development sector is:
where
f) Environmental management sector. From the production perspective, the environment is included in the endogenous growth model as a production factor. Assuming
where
where
Under the condition of the optimal growth path, the growth rate of any economic variable is constant, and
Comparative static analysis yields two propositions:
Proposition 1. When other conditions remain unchanged, innovative human capital and innovative material capital have a positive marginal effect on the long-term steady-state green economic growth rate. Specifically,
Proposition 2. When other conditions remain unchanged, improvements in the investment efficiency of environmental governance can reduce pollutant emissions, which can not only reduce the constraints of environmental pollution on economic growth but improve the long-term steady-state green economic growth rate, that is,
3 Methodology
3.1 Research area
This study takes the YRB as its research area. Based on the Yellow River Yearbook, the YRB’s outline for ecological protection and high-quality development planning, we take the prefecture level cities of Shandong, Henan, Shanxi, Inner Mongolia, Shaanxi, Ningxia, Gansu, and Qinghai, as well as some cities in Anhui and Hebei through which the Yellow River flows, as our research area. The YRB comprises 87 prefecture level cities (see Figure 2).
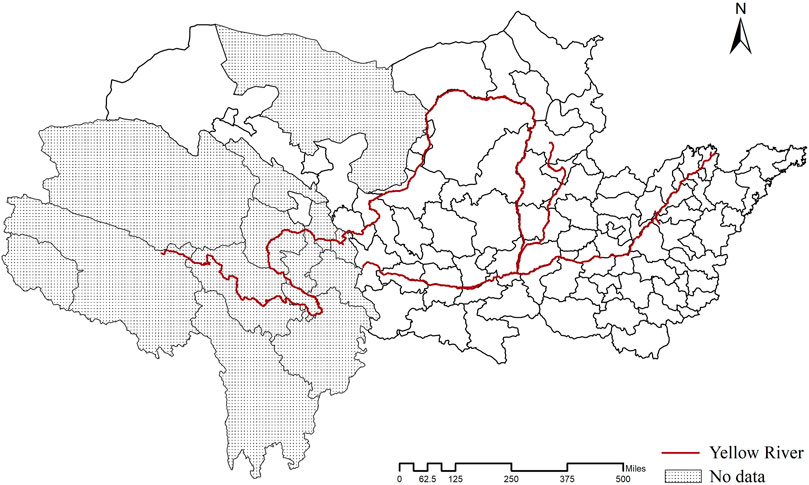
FIGURE 2. The Yellow River Basin.
3.2 Research method
3.2.1 Measurement of green transition
Green transition is a transformation process (Kemp and Never, 2017; Song et al., 2020). It refers to the transformation of regional economy from traditional extensive development mode to intensive sustainable development under resources and environment constraints (López-Gamero et al., 2010). The measurement of the green transition is the relative efficiency of various inputs and outputs in the sustainable development model (Shen et al., 2019). Total factor productivity (TFP) is used to represent traditional economic efficiency. While GTFP including “good” and “bad” outputs allows for evaluating the performance of green transition with ecological constraints (Chen et al., 2018; Huang et al., 2022).
To evaluate the GTFP of the YRB, we use a global Malmquist Luenberger productivity index based on the directional distance function of a Slacks-based model that includes environmental input factors and undesirable output (Oh, 2010; Liu and Xin, 2019). In most research, labor, capital, and energy are input factors (Fare et al., 2007; Li et al., 2016; Long et al., 2018), while economic output and industrial pollution emissions (e.g., the three industrial wastes, sulfur dioxide, wastewater, and soot) are output factors in the GTFP calculation (Wu et al., 2017; Li et al., 2018).
Considering the particularity and importance of water as a natural factor in the YRB’s study area, we consider water resource endowment a resource input factor (Miao et al., 2010; Chen Y. P. et al., 2020). Correspondingly, we make sewage discharge as an unexpected output of the water environment (Song et al., 2020). As air pollution is an important component of environmental pollution, carbon emissions (Li and Lin, 2017) and fine particulate matter are selected as undesirable outputs to describe the green transition accurately, especially given the need for complying with the “double carbon” goal.
The regional carbon emissions are derived from the 1997–2017 China county carbon emissions dataset simulated and retrieved by the CEADs database based on DMSP/OLS and VIIRS/NPP night light data (Chen J. et al., 2020). The 2018 and 2019 data are inversely extrapolated based on the trend of the chain-based growth rate in the past 5 years and proportion of various cities’ carbon emissions in the province in the past 5 years. We cover the period from 2004 to 2019. Specific measurement indicators are provided in Table 1.
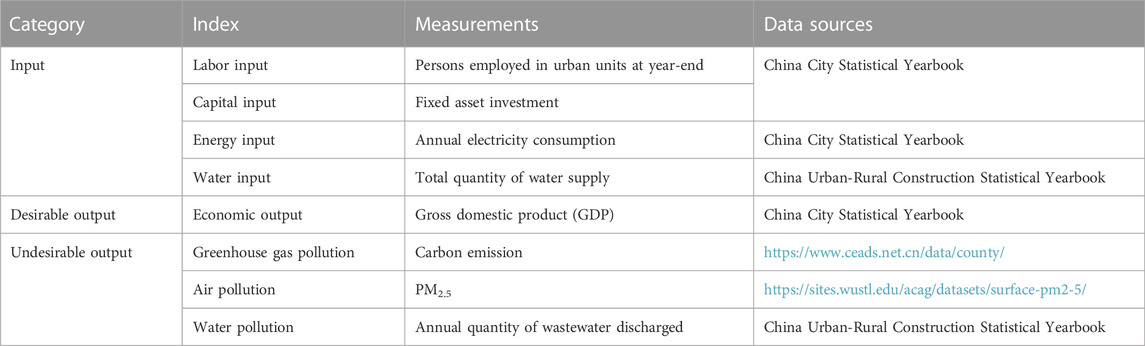
TABLE 1. Description of the indicators of green total factor productivity measurement.
3.2.2 Empirical model
To test the research hypothesis of the effect of environmental governance, innovative human capital, and innovative material capital investment on green transition, we constructed the following benchmark measurement model:
where
The traditional linear regression framework cannot be used test the non-linear effect of low-carbon governance and innovation activities on green transition when cities have non-linear characteristics. A panel threshold model can be used to study the heterogeneous effects of dependent variables on independent variables when urban characteristics are inconsistent (Hansen, 1999). Take the single threshold panel model as an example:
In the formula,
when
The first step is to use Tsay’s permutation regression to find the threshold estimated value; the second step is to use the bootstrap method to test for a possible threshold effect. If a threshold effect exists, the likelihood ratio statistic is further used to detect whether the true value and the threshold estimate are the same (Wang, 2015). Generally, there may be multiple threshold values, making it necessary to test the number of threshold values. Consequently, the panel threshold model is set as follows:
In this equation,
3.3 Data description
The core explanatory variables and control variables are set as follows.
3.3.1 Low-carbon governance variable (ER)
Most studies choose the total investment in (industrial) environmental pollution or composite indicators that include measures such as SO2 removal, smoke removal, comprehensive utilization of industrial solid waste, domestic sewage treatment, and industrial sewage treatment rates as a surrogate indicator of environmental governance (Wang and Shen, 2016; Ren et al., 2018; Wang and Zhang, 2022). We use the carbon intensity reduction rate index as a proxy for the effect of low-carbon governance to test the effect of environmental governance on green transition.
3.3.2 Innovation activities
Innovation activities include innovative human capital investment and innovative physical capital investment. Of these, the level of innovative human capital reflects the labor force’s ability to imitate technology, absorb knowledge, and innovate and create; it is a more suitable proxy indicator to measure the labor force’s skill level (Ang et al., 2011). Among various industries, scientific research, technical services and geological exploration is the key industy that serve the R&D sector. Hence, the scientific research, technical services, and geological exploration industry is selected for this study. The number of employees in the exploration industry and in the information transmission, computer services, and software industry are used as proxy variables for innovative human capital (human_e) to estimate the green growth elasticity of human capital changes; innovation material capital investment (patent_e) is measured using scientific and technological financial expenditure required for unit patent application.
3.3.3 Control variables
To alleviate bias in the model estimation results caused by variables that are potentially omitted, it is necessary to include control variables that could affect the TFP of urban greening. In the literature, the factors that affect GTFP include government intervention, foreign investment level, and population density. Fiscal pressure (
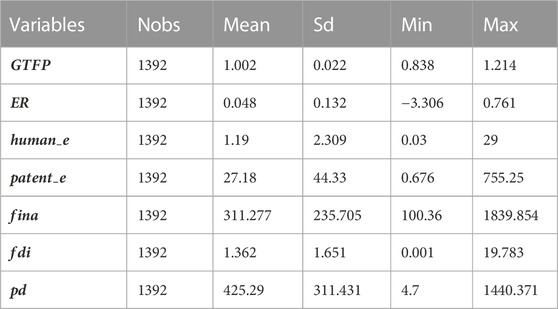
TABLE 2. Descriptive statistical results.
4 Mechanism test of green transition in the YRB
4.1 Identifying the characteristics of the wicked problem
Wicked problems are complex and marked by deep uncertainty, and climate change is one such problem (Rittel and Webber, 1973; Head, 2014; Sun and Yang, 2016). The green transition of the YRB is characterized by a typical wicked problem dilemma of balancing development with emissions reduction (Figure 3). The overall dilemma is manifested in a mismatched development, where the YRB proportion of secondary industry increment between 2004 and 2019 continued to decline, while its carbon emissions increased.
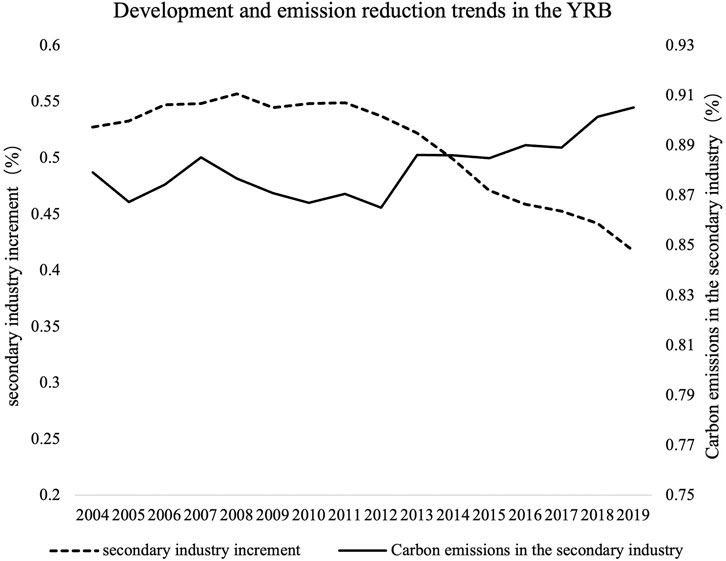
FIGURE 3. Development and emission reduction trends in the YRB of China from 2004 to 2019.
To further verify the dilemmas above, the GTFP of the 87 prefecture-level cities in the YRB is measured to represent green transition. The GTFP of the YRB increased from .987 in 2004 to 1.009 in 2019, with parallel trends in economic development and green and low-carbon development (Figure 4). Among these, GTFP rose rapidly from 2004 to 2008. This stage corresponds to the factor-driven stage in China, which mainly relies on a large amount of labor, capital, and other factors to drive economic growth. With the emergence of the 2008 financial crisis, the overall economic downturn coupled with the environmental consequences of high investment in the early stage, as well as extensive and extended high-carbon development mode led to a continuous decline in the growth rate of green total factors. Although there was a substantial short-term increase in 2012 that led to a continuous increase in efficiency from 2013 to 2015, we see a downward trend in efficiency after 2015. Although the GTFP of the YRB has significantly improved, the task of ensuring a high-quality development-oriented green and low-carbon transition are facing dilemmas between development and emissions reduction.
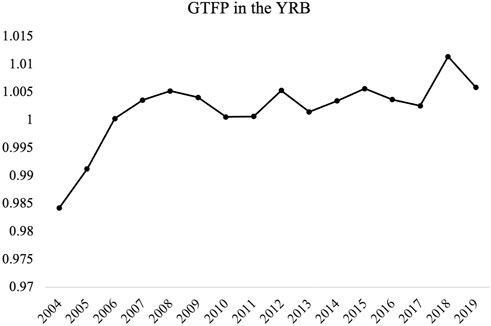
FIGURE 4. GTFP evolution trends in the YRB.
4.2 Result of overall sample regression
This study addresses a overall sample regression model to examine the main factors that led to the dilemmas above in the transition of the Yellow River basin.
Table 3 reports the regression results of the benchmark model; columns 1 to 3 present the regression results after adding low-carbon governance, innovative human capital, and innovative physical capital as input variables, respectively. The three main explanatory variables are all positive and significant at the 10% level. After adding all explanatory and control variables (column 3), the R2 significantly improves, indicating that the selection of control variables is effective.
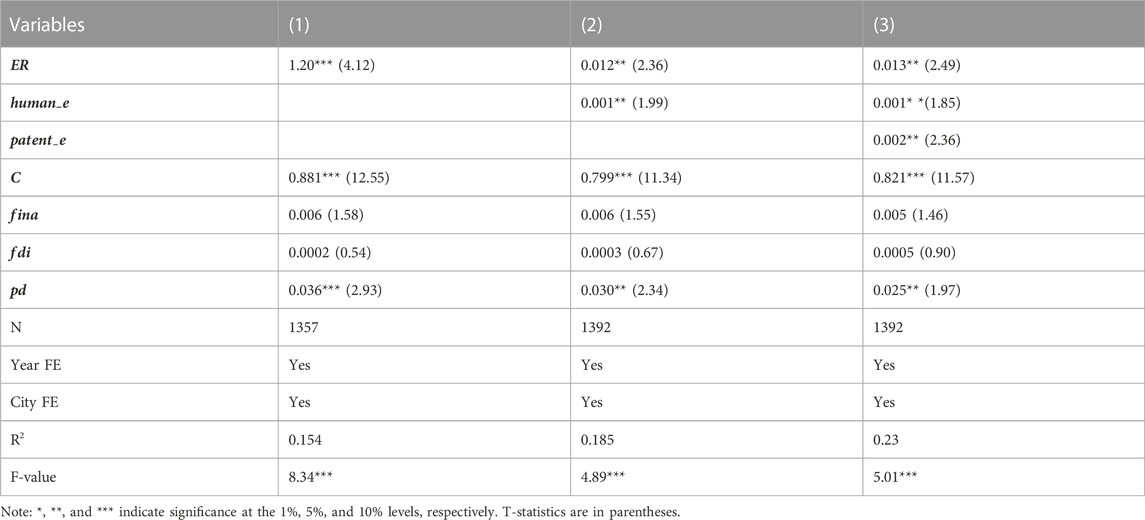
TABLE 3. Benchmark results and robustness checks of the full sample.
Specifically, the estimated coefficient on ER is .013 and significant at the 1% level (column 4), which shows that the overall low-carbon governance in the YRB has achieved remarkable results through playing a role in promoting green transition. Importantly, the test results are consistent with Proposition 1.
The carbon intensity reduction rate is essentially the degree of reduction in pollutant emissions brought about by low-carbon governance; that is, the more obvious the reduction in carbon intensity, the better the low-carbon governance effect. To reflect the effect of low-carbon governance intensity on the YRB’s GTFP from an intuitive point of view, we use the ratio of environment-related words to the total word count of the report on the government’s work as a proxy variable for the government’s environmental governance (Chen et al., 2018; Zhong et al., 2021). The results in column 2 show that low-carbon governance intensity also has a significant effect on GTFP, indicating that the carbon intensity reduction rate is properly characterized. Environmental governance investment efficiency (
From the perspective of the two core explanatory variables on innovation, the coefficients on innovative human capital (human_e) and innovative physical capital (patent_e) are both significantly positive, indicating that the greater the input of innovative human and physical capital, the higher the GTFP, supporting the effectiveness of Proposition 2. Thus, innovative human and physical capital, as the key factors promoting technological progress, play key roles in increasing the ability to digest, absorb, and apply existing technologies. As we empirically demonstrate, they are of great significance to the YRB’s green and low-carbon transition of the YRB.
Above all, low-carbon governance has obviously promoted the green transition of the Yellow River basin. In contrast, innovation activities, as important factors of sustainable and high-quality economic and social development, have played a very weak role in the green transition of the YRB. We believe that the lack of innovative vitality may be the key reason for the slow and even backward process of low-carbon transformation in the Yellow River basin.
To ensure robustness, four approaches were used to re-estimate the relevant parameters and test the robustness of the empirical conclusions (Table 4). We replaced explanatory variable ER (column 4), replaced the GTFP value from the global Malmquist-Luenberger index with the adjacent reference global Malmquist-Luenberger index as the explained variable (column 5), removed the provincial capital city (column 6), and performed a generalized method of moments regression with a one-period lag of the explained variable (column 7). In column (4), the proportion of the word frequency related to the word “environmental protection” in the work report of each city’s government in the total number of words in the report is used as a substitute variable for the intensity of environmental governance. The results show that ER-new has also significantly improved the GTFP, which fully shows that it is reasonable and effective to characterize the investment efficiency of environmental governance in the model by the reduction rate of carbon intensity. The results of the robustness tests show that the estimation results of the three main explanatory variables are consistent with the model’s benchmark regression results. Thus, the results are relatively robust.
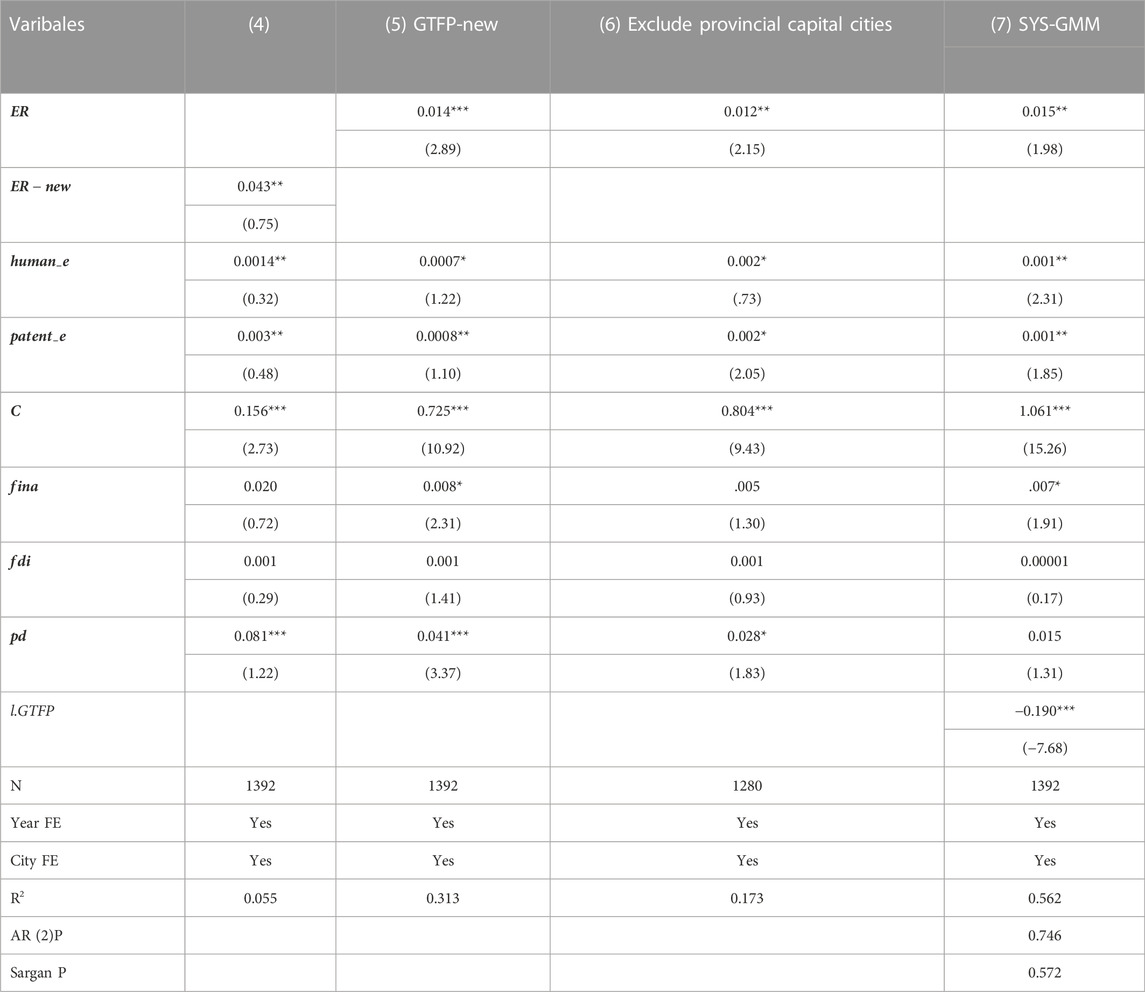
TABLE 4. Robustness tests.
4.3 Regression results of development period
At present, China is transitioning from a high-speed development period that is driven by factors and investment to a high-quality development stage that is driven by innovation. The effect of low-carbon governance and innovation activities on green transition is further examined in two periods, namely 2004–2011, the investment-driven period, and the innovation-driven period after 2012. Table 5 reports the regression results. It is obvious that low-carbon governance and innovation activities have significant temporal heterogeneity in these two periods.
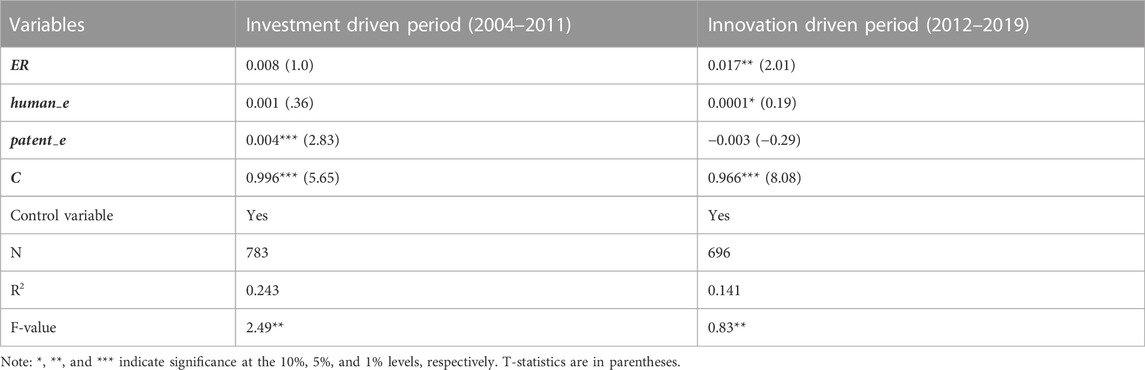
TABLE 5. Estimated results at different periods of development.
First, low-carbon governance plays a significant role in enhancing GTFP only in the innovation-driven period. That is, in the rapid economic growth stage, development-oriented high investment and high consumption lead to weak low-carbon governance effects. Second, although innovative human capital has made insufficient contribution to green transformation in the investment-driven period. While it has accumulated rich human capital. As a result, human capital in innovation-driven period begin to play a role in promoting green transformation. Third, innovative physical capital significantly improved GTFP in the investment-driven period, but did not play a significant role in promoting the innovation-driven period. The drive of physical capital investment has been unable to promote high-quality economic development in the YRB, and physical capital has gradually weakened against innovative human capital. One possible explanation is that with the arrival of the high-quality development, division of labor based on specialization is deepened. Material capital is gradually replaced by innovative human capital.
According to the results, the factors driving green transition are changing at different stages of development. This also means that at different stages of development, the factors leading to the dilemma of green transformation will also change. For example, in innovation driven period, innovative physical capital may be the main reason for the decline of green transformation. To solve the dilemma of green transformation in the current and future time of the innovation driven stage, we should not only reverse the negative effect of innovative material capital, but further enhance the impetus of innovative human capital and low-carbon governance to green transformation.
5 Further study
The YRB not only exhibits non-linear coupling characteristics between development and emissions (Figure 3), but its green transition quality also fluctuates with time (Figure 4). GFTP increased from .987 in 2004 to 1.009 in 2019; during this time, it went through multiple stages of decline. This may be because the driving effects of low-carbon governance and innovation activities on the YRB’s green transition have different effects owing to the idiosyncratic characteristics of each city. Therefore, a panel threshold model was established to explore the non-linear characteristics of the driving mechanism of the YRB’s green transition, which is also a realistic path to address its third dilemma.
5.1 Non-linear test of urban development levels
The development gap among the regions along the YRB is large. In 2019, Qingdao, which has the highest level of economic development, had a GDP over 40 times that of Jiayuguan City. Therefore, the effect on GTFP of low-carbon governance and innovation activities are further examined when cities have different levels of development. Specifically, the logarithm (dev) of per capita GDP is used as the threshold variable in Hansen’s panel threshold model, and the likelihood ratio is simulated 1,000 times using the bootstrap method. The results show that the panel threshold model has only a single threshold value, which is 8.9, and the F value is 28.95, which is significant at the 10% level.
The results in Table 6 show that, as the level of urban development crosses the threshold, the effects of low-carbon governance, innovative human capital, and innovative physical capital on GTFP change from insignificant to significant at the 1% level. That is, in cities with low levels of urban development, increasing the government’s low-carbon governance and enriching innovation activities cannot effectively improve GTFP. The effect of the green development of low-carbon governance and innovation activities can be fully demonstrated only when urban development reaches a certain level.
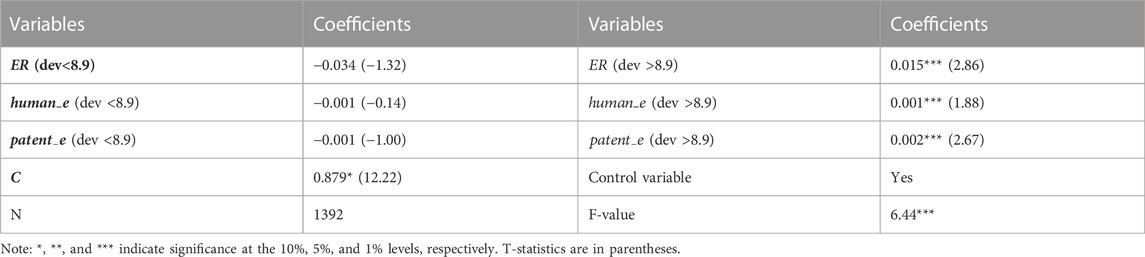
TABLE 6. Regression results of the panel threshold model.
5.2 Non-linear test of the spatial configuration of innovation elements
The YRB has long faced a relatively low quality of human capital and generally high degree of brain drain, a bottleneck of “talent collapse,” and the misallocation of innovative talent elements in urban agglomerations. Existing research shows that innovative human capital has a weak effect on GTFP, and hence the difference in the spatial allocation of innovative factors may be an important source of the non-linear characteristics of development and transition. Therefore, the key to breaking through the human capital dilemma is to weaken the spatial mismatch of innovative elements, among which the spatial allocation of innovative talent is the most important.
This study further examines the effect of innovative talent influx on low-carbon governance, innovative activities, and urban green transition to explore solutions from the perspective of the spatial allocation of innovative talent.
Using the China Migrants Dynamic Survey, the proportion of the immigrant population in prior years with college education or above is calculated to measure the inflow of regional innovative talent (talent), and then a panel threshold model is established as a threshold variable. The threshold test results show that the model passes only the single threshold test, with a threshold value of .866 and an F value of 10.57. The regression results confirm a continuous inflow of innovative talent that has significantly enhanced the effect of low-carbon governance and local innovative human capital on GTFP (Table 7). However, as regions have had high performance in eliminating fragmentation and improving transportation efficiency, the speed and intensity of the inflow of innovative talent has greatly improved. This has been accompanied by a collision of knowledge and thinking between foreign talent and local innovative human capital, thus enhancing regional low-carbon governance power and technology, which is more conducive to GTFP growth.
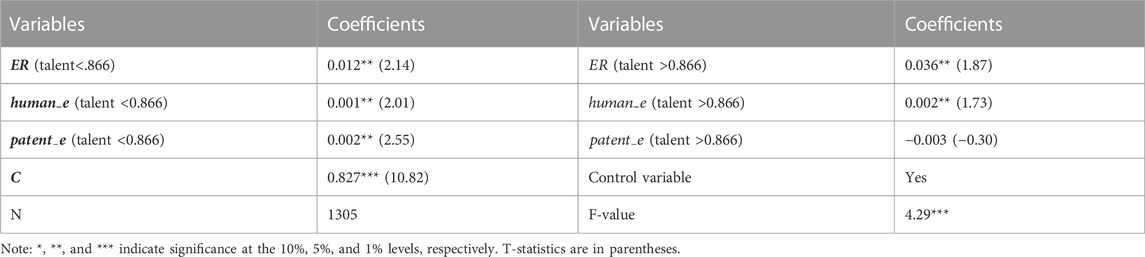
TABLE 7. Regression results of panel threshold.
The role of innovation material capital investment is relatively more obvious at the beginning of innovation talent flow. This may be because innovation output is more dependent on local science and technology financial expenditure when local human innovation capital plays a dominant role in the market. Establishing a unified national market has brought the inevitable trend of multi-center network development to the forefront. Adhering to the urban network concept that cities have boundaries while urban networks do not, inter-regional innovation networks have been promoted in all directions. Therefore, when the amount of innovative foreign talent exceeds a certain threshold, traditional innovation output driven by physical capital cannot keep up with the improvement in the green economy’s efficiency in the new era. This further reinforces importance of the spatial allocation of innovative talent in this new development stage.
6 Conclusion
China has publicly committed to transforming into an “ecological civilization,” that requires green development. This study explores a path to solving the dilemmas affecting the YRB’s green transition process. We constructed a six-sector green endogenous growth model including natural resources, environmental quality, environmental governance investment, knowledge spillovers, environmental self-purification capabilities, and the impact mechanism of green economic growth. Then, a Slacks-based model using the directional distance function measured the degree of green transition of cities in the YRB from 2003 to 2019. In this model, we incorporated undesired outputs such as air, greenhouse gas, and water pollution. Finally, we used a panel econometric model to test the driving role of carbon governance and innovation activities on the YRB’s green transition.
The results of our varied methodological approach confirm the role of low-carbon governance, innovative human capital, and innovative material capital investment in promoting green transition. When the research period is divided into investment- and innovation-driven development stages, low-carbon governance and innovative human capital are shown to have played positive roles in the YRB’s green transition in the innovation-driven development stage. Further research based on urban development levels and the spatial allocation of innovation elements revealed that the effects of low-carbon governance and innovation activities on green transition are non-linear. On the one hand, green transition can benefit from low-carbon governance only when urban development is above a certain level. On the other hand, the spatial allocation effect of innovative talent has significantly improved the driving force of low-carbon governance and innovative human capital on the YRB’s green transition.
We propose that the YRB’s triple wicked problem requires governments to further improve the level of innovative human capital and enhance the density and quality of green technologies. The YRB’s green transition is largely driven by innovative physical capital investment than innovative human capital. Three paths arise from this result: intensify R&D in green technology innovation, promote independent innovation, and improve green technology progresses.
Green transition also requires increased publicity of green technology, active promotion and use of green technology, saving of resources, protecting the environment from root causes of degradation, and realizing a green economy. First, the innovative output of human capital, especially innovative talent, should be fully stimulate. Scientific researchers need to be better compensated particularly through incentivizing technological achievement We believe these measures could enhance innovation vitality. Second, the motivation for retaining, attracting, and utilizing talent requires a combination of efforts. The support services of the whole talent industrial chain should be expanded to ensure the quality of new talent. Acquiring and retaining talent from abroad should be further prioritized. We also suggest combining green transition with the stage and development level and avoiding accelerating transition in a one-size-fits-all manner. Efforts should be made to narrow the green economic development gap between the upstream and the middle and lower reaches, especially for upstream areas with high locations. This will further strengthen the construction of compact urban forms, compressing spatial distance and eliminating divisions. Constructing regionally coordinated and efficient environmental regulation policies should also be explored. As water is the YRB’s core element, urban agglomeration policies for water environment, atmospheric environment, and low-carbon governance should be formulated to avoid uncoordinated environmental governance caused by economic competition and improvements.
Data availability statement
The original contributions presented in the study are included in the article/Supplementary Materials, further inquiries can be directed to the corresponding author.
Author contributions
WX: Conceptualization, methodology, writing–review and editing. YD: Supervision, review and editing. TJ: Additional review and editing.
Funding
This research was funded by the State Key of National Natural Science Foundation of China (No. 71733001), the National Social Science Fund of China (No. 20ZDA086) China Postdoctoral Science Foundation (No. 2021M703573) and National Social Science Foundation Youth Project (No. 17CRK009).
Conflict of interest
The authors declare that the research was conducted in the absence of any commercial or financial relationships that could be construed as a potential conflict of interest.
Publisher’s note
All claims expressed in this article are solely those of the authors and do not necessarily represent those of their affiliated organizations, or those of the publisher, the editors and the reviewers. Any product that may be evaluated in this article, or claim that may be made by its manufacturer, is not guaranteed or endorsed by the publisher.
References
Ambec, S., Cohen, M. A., Elgie, S., and Lanoie, P. (2013). The porter hypothesis at 20: Can environmental regulation enhance innovation and competitiveness? Rev. Environ. Econ. Policy 7, 2–22. doi:10.1093/reep/res016
Ang, J. B., Madsen, J. B., and Islam, M. R. (2011). The effects of human capital composition on technological convergence. J. Macroecon. 33 (3), 465–476. doi:10.1016/j.jmacro.2011.03.001
Barbier, E. (1999). Endogenous growth and natural resource scarcity. Environ. Resour. Econ. 14, 51–74. doi:10.1023/A:1008389422019
Bovenberg, A. L., and Smulders, S. (1995). Environmental quality and pollution-augmenting technological change in a two-sector endogenous growth model. J. Public Econ. 57 (3), 369–391. doi:10.1016/0047-2727(95)80002-Q
BP Statistical Review of World Energy (2020). BP statistical review of world energy 2020. Available at: https://www.bp.com/conte nt/dam/bp/business-sites/en/global/corporate/pdfs/energy-economics/statistical-review/bp-stats-review-2020-full-report.pdf. [Accessed 14 October 2022].
Brock, W. A., and Taylor, M. S. (2005). Economic growth and the environment: A review of theory and empirics. Handb. Econ. growth 1, 1749–1821. doi:10.1016/s1574-0684(05)01028-2
Chen, C., Lan, Q., Gao, M., and Sun, Y. (2018). Green total factor productivity growth and its determinants in China’s industrial economy. Sustainability 10 (4), 1052. doi:10.3390/su10041052
Chen, J., Gao, M., Cheng, S., Hou, W., Song, M., Liu, X., et al. (2020a). County-level CO2 emissions and sequestration in China during 1997–2017. Sci. Data 7, 391. doi:10.1038/s41597-020-00736-3
Chen, S. (2010). Green industrial revolution in China: A perspective from the change of environmental total factor productivity. Econ. Res. 45 (11), 21–34+58.
Chen, Y. P., Fu, B. J., Zhao, Y., Wang, K. b., Zhao, M. M., Ma, J. F., et al. (2020b). Sustainable development in the Yellow River Basin: Issues and strategies. J. Clean. Prod. 263, 121223. doi:10.1016/j.jclepro.2020.121223
Chen, Y., Zhu, M., Lu, J., Zhou, Q., and Ma, W. (2020c). Evaluation of ecological city and analysis of obstacle factors under the background of high-quality development: Taking cities in the Yellow River Basin as examples. Ecol. Indic. 118, 106771. doi:10.1016/j.ecolind.2020.106771
Chen, Z., Kahn, M. E., Liu, Y., and Wang, Z. (2018). The consequences of spatially differentiated water pollution regulation in China. J. Environ. Econ. Manag. 88, 468–485. doi:10.1016/j.jeem.2018.01.010
CNBS (National Bureau of Statistics of China). (2020). China statistical Yearbook. Available at: http://www.stats.gov.cn/tjsj/ndsj/. [Accessed 14 October 2022].
Dong, F., Wang, Y., Su, B., Hua, Y., and Zhang, Y. (2019). The process of peak CO2 emissions in developed economies: A perspective of industrialization and urbanization. Resour. Conservation Recycl. 141, 61–75. doi:10.1016/j.resconrec.2018.10.010
Du, K., Cheng, Y., and Yao, X. (2021). Environmental regulation, green technology innovation, and industrial structure upgrading: The road to the green transformation of Chinese cities. Energy Econ. 98, 105247. doi:10.1016/j.eneco.2021.105247
Fan, D., and Sun, X. T. (2020). Environmental regulation, green technological innovation and green economic growth. China Popul. Resour. Environ. 30 (6), 105–115.
Fare, R., Grosskopf, S., and Pasurka, C. A. (2007). Environmental production functions and environmental directional distance functions. Energy 32 (7), 1055–1066. doi:10.1016/j.energy.2006.09.005
Hansen, B. E. (1999). Threshold effects in non-dynamic panels: Estimation, testing, and inference. J. Econ. 93 (2), 345–368. doi:10.1016/S0304-4076(99)00025-1
Hao, Z., Hao, F., Singh, V. P., and Zhang, X. (2018). Changes in the severity of compound drought and hot extremes over global land areas. Environ. Res. Lett. 13 (12), 124022. doi:10.1088/1748-9326/aaee96
Head, B. W. (2014). Evidence, uncertainty, and wicked problems in climate change decision making in Australia. Environ. Plan. C Gov. Policy 32 (4), 663–679. doi:10.1068/c1240
Howitt, P., and Aghion, P. (1998). Capital accumulation and innovation as complementary factors in long-run growth. J. Econ. Growth 3 (2), 111–130. doi:10.1023/A:1009769717601
Huang, H., Mo, R., and Chen, X. (2021). New patterns in China's regional green development: An interval Malmquist–Luenberger productivity analysis. Struct. Change Econ. Dyn. 58, 161–173. doi:10.1016/j.strueco.2021.05.011
Huang, Y., Li, X., and Liu, Y. (2022). The impact of environmental regulation or bargaining power on green total factor productivity: Evidence from Taiwan-funded enterprises in Chinese mainland. Front. Environ. Sci. 1773, 982430. doi:10.3389/fenvs.2022.982430
Kemp, R., and Never, B. (2017). Green transition, industrial policy, and economic development. Oxf. Rev. Econ. Policy 33 (1), 66–84. doi:10.1093/oxrep/grw037
Li, J., Gong, L., Chen, Z., Zeng, L., Yang, G. L., and Zhang, J. (2016). The Hierarchy and transition of China's urban energy efficiency. Energy Procedia 104, 110–117. doi:10.1016/j.egypro.2016.12.020
Li, K., and Lin, B. (2017). Economic growth model, structural transformation, and green productivity in China. Appl. Energy 187, 489–500. doi:10.1016/j.apenergy.2016.11.075
Li, W., Wang, W., Wang, Y., and Ali, M. (2018). Historical growth in total factor carbon productivity of the Chinese industry – A comprehensive analysis. J. Clean. Prod. 170 (1), 471–485. doi:10.1016/j.jclepro.2017.09.145
Lin, B., and Benjamin, N. I. (2017). Green development determinants in China: A non-radial quantile outlook. J. Clean. Prod. 162, 764–775. doi:10.1016/j.jclepro.2017.06.062
Liu, Z., and Xin, L. (2019). Has China's belt and road initiative promoted its green total factor productivity?——evidence from primary provinces along the route. Energy Policy 129, 360–369. doi:10.1016/j.enpol.2019.02.045
Long, X., Chen, B., and Park, B. (2018). Effect of 2008's Beijing Olympic Games on environmental efficiency of 268 China's cities. J. Clean. Prod. 172, 1423–1432. doi:10.1016/j.jclepro.2017.10.209
López-Gamero, M. D., Molina-Azorín, J. F., and Claver-Cortés, E. (2010). The potential of environmental regulation to change managerial perception, environmental management, competitiveness and financial performance. J. Clean. Prod. 18 (10-11), 963–974. doi:10.1016/j.jclepro.2010.02.015
Mao, W. X., Wang, W. P., and Sun, H. F. (2019). Driving patterns of industrial green transformation: A multiple regions case learning from China. Sci. Total Environ. 697, 134134. doi:10.1016/j.scitotenv.2019.134134
Miao, C., Ni, J., and Borthwick, A. G. (2010). Recent changes of water discharge and sediment load in the Yellow River basin, China. Prog. Phys. Geogr. 34, 541. doi:10.1177/0309133310369434
Oh, D. H. (2010). A global Malmquist-Luenberger productivity index. J. Prod. analysis 34 (3), 183–197. doi:10.1007/s11123-010-0178-y
Qiu, S., Wang, Z., and Geng, S. (2021). How do environmental regulation and foreign investment behavior affect green productivity growth in the industrial sector? An empirical test based on Chinese provincial panel data. J. Environ. Manag. 287, 112282. doi:10.1016/j.jenvman.2021.112282
Ren, S., Li, X., Yuan, B., Li, D., and Chen, X. (2018). The effects of three types of environmental regulation on eco-efficiency: A cross-region analysis in China. J. Clean. Prod. 173, 245–255. doi:10.1016/j.jclepro.2016.08.113
Rittel, H. W., and Webber, M. M. (1973). Dilemmas in a general theory of planning. Policy Sci. 4 (2), 155–169. doi:10.1007/BF01405730
Roberts, C., Geels, F. W., Lockwood, M., Newell, P., Schmitz, H., Turnheim, B., et al. (2018). The politics of accelerating low-carbon transitions: Towards a new research agenda. Energy Res. Soc. Sci. 44, 304–311. doi:10.1016/j.erss.2018.06.001
Shangguan, X. M., and Ge, B. H. (2020). Scientific and technological innovation, environmental regulation and high-quality economic development. China Popul. Resour. Environ. 30 (6), 95–104.
Song, M., Zhao, X., Shang, Y., and Chen, B. (2020). Realization of green transition based on the anti-driving mechanism: An analysis of environmental regulation from the perspective of resource dependence in China. Sci. Total Environ. 698, 134317. doi:10.1016/j.scitotenv.2019.134317
Su, S., and Zhang, F. (2020). Modeling the role of environmental regulations in regional green economy efficiency of China: Empirical evidence from super efficiency DEA-tobit model. J. Environ. Manag. 261 (1), 110227. doi:10.1016/j.jenvman.2020.110227
Sun, H., Edziah, B. K., Sun, C., and Kporsu, A. K. (2019). Institutional quality, green innovation and energy efficiency. Energy policy 135, 111002. doi:10.1016/j.enpol.2019.111002
Sun, J., and Yang, K. (2016). The wicked problem of climate change: A new approach based on social mess and fragmentation. Sustainability 8 (12), 1312. doi:10.3390/su8121312
Sun, X., Zhang, H., Ahmad, M., and Xue, C. (2022). Analysis of influencing factors of carbon emissions in resource-based cities in the Yellow River basin under carbon neutrality target. Environ. Sci. Pollut. Res. 29, 23847–23860. doi:10.1007/s11356-021-17386-6
Tian, C., Li, X., Xiao, L., and Zhu, B. (2022). Exploring the impact of green credit policy on green transformation of heavy polluting industries. J. Clean. Prod. 335, 130257. doi:10.1016/j.jclepro.2021.130257
Wang, H., and Zhang, R. (2022). Effects of environmental regulation on CO2 emissions: An empirical analysis of 282 cities in China. Sustain. Prod. Consum. 29, 259–272. doi:10.1016/j.spc.2021.10.016
Wang, Q. (2015). Fixed-effect panel threshold model using Stata. Stata J. 15 (1), 121–134. doi:10.1177/1536867X1501500108
Wang, Y., and Shen, N. (2016). Environmental regulation and environmental productivity: The case of China. Renew. Sustain. Energy Rev. 62, 758–766. doi:10.1016/j.rser.2016.05.048
Wang, Y., Sun, X., and Guo, X. (2019). Environmental regulation and green productivity growth: Empirical evidence on the porter hypothesis from OECD industrial sectors. Energy Policy 132, 611–619. doi:10.1016/j.enpol.2019.06.016
World bank. 2022, World Bank. Available at: https://data.worldbank.org.cn/.
Wu, H., Hao, Y., and Ren, S. (2020). How do environmental regulation and environmental decentralization affect green total factor energy efficiency: Evidence from China. Energy Econ. 91, 104880. doi:10.1016/j.eneco.2020.104880
Wu, L., Nie, Q., and Chen, C. (2017). Government expenditure, corruption and total factor productivity. J. Clean. Prod. 168 (1), 279–289. doi:10.1016/j.jclepro.2017.09.043
Zeng, M., Zheng, L., Huang, Z., Cheng, X., and Zeng, H. (2023). Does vertical supervision promote regional green transformation? Evidence from central environmental protection inspection. J. Environ. Manag. 326, 116681. doi:10.1016/j.jenvman.2022.116681
Zhai, X., and An, Y. (2020). Analyzing influencing factors of green transformation in China’s manufacturing industry under environmental regulation: A structural equation model. J. Clean. Prod. 251, 119760. doi:10.1016/j.jclepro.2019.119760
Zhong, S., Xiong, Y., and Xiang, G. (2021). Environmental regulation benefits for whom? Heterogeneous effects of the intensity of the environmental regulation on employment in China. J. Environ. Manag. 281, 111877. doi:10.1016/j.jenvman.2020.111877
Zhou, S., Li, W., Lu, Z., and Lu, Z. (2022). A technical framework for integrating carbon emission peaking factors into the industrial green transformation planning of a city cluster in China. J. Clean. Prod. 344, 131091. doi:10.1016/j.jclepro.2022.131091
Zhu, K., Liu, Q. C., Xiong, X., Zhang, Y., Wang, M., and Liu, H. (2022). Carbon footprint and embodied carbon emission transfer network obtained using the multi–regional input–output model and social network analysis method: A case of the hanjiang River basin, China. Front. Ecol. Evol. 10, 941520. doi:10.3389/fevo.2022.941520
Keywords: Yellow River Basin, green transition, wicked problem, low-carbon governance, innovative human capital, innovative physical capital
Citation: Xie W, Dong Y and Jin T (2023) Exploring the wicked problem dilemmas and driving mechanism of green transition: Evidence from the Yellow River Basin, China. Front. Earth Sci. 10:1073276. doi: 10.3389/feart.2022.1073276
Received: 18 October 2022; Accepted: 22 December 2022;
Published: 06 January 2023.
Edited by:
Chuanbao Wu, Shandong University of Science and Technology, ChinaReviewed by:
Fang Fang, Xinjiang University, ChinaYongguang Zhu, China University of Geosciences Wuhan, China
Zoltán Csedő, Corvinus University of Budapest, Hungary
Copyright © 2023 Xie, Dong and Jin. This is an open-access article distributed under the terms of the Creative Commons Attribution License (CC BY). The use, distribution or reproduction in other forums is permitted, provided the original author(s) and the copyright owner(s) are credited and that the original publication in this journal is cited, in accordance with accepted academic practice. No use, distribution or reproduction is permitted which does not comply with these terms.
*Correspondence: Yaning Dong, ZG9uZ3luQHBrdS5lZHUuY24=