 Uzonna Okenna Anyiam1
 Haijiang Zhang1,2*
 Yuyang Tan3*
 Jiawei Qian4
 Lei Gao1
 Ying Liu1
 Kezhen Zuo5Cuiping Zhao5
- 1Laboratory of Seismology and Physics of Earth’s Interior, School of Earth and Space Sciences, University of Science and Technology of China, Hefei, China
- 2Mengcheng National Geophysical Observatory, University of Science and Technology of China, Hefei, China
- 3Frontiers Science Center for Deep Ocean Multispheres and Earth System, Key Lab of Submarine Geosciences and Prospecting Techniques MOE, College of Marine Geosciences, Ocean University of China, Qingdao, China
- 4College of Oceanography, Hohai University, Nanjing, China
- 5Institute of Earthquake Forecasting, China Earthquake Administration, Beijing, China
Current extensive seismicity in southern Sichuan Basin is ascribed to the reactivation of pre-existing faults, as a result of prolonged fluid injection for salt mining and shale gas development, respectively. However, the structural framework of the region remains poorly understood. Here, we apply Vp/Vs consistency-constrained double-difference seismic tomography to high quality phase data from 36,314 earthquakes jointly recorded by our local array and a regional seismic network to determine high-resolution velocity models. Earthquake relocations reveal shallow hypocenters for the Ms>5.0 earthquakes and two distinct seismogenic zones corresponding to the salt mine and shale gas regions, with most induced seismic events forming widespread lineaments some of which extend to the basement and are remarkably similar to the fault and fracture trends interpreted on reflection seismic and outcrops, respectively. Our 3-D crustal velocity analyses show that seismicity beneath the Changing salt mining area is associated with a combination of relatively low Vp/Vs (1.6–1.74) and high Vp/Vs (1.75–1.86) expressions, while most of small earthquakes within the Xingwen shale gas block are associated with relatively high Vp/Vs values (1.77–1.87), indicating the earthquakes in these two areas are caused by unique inducing mechanisms. The two moderately strong 2018 Xingwen Ms5.7 and 2019 Gongxian Ms5.3 earthquakes in the Xingwen shale gas block are located around low Vp/Vs. zones, suggesting they could be structurally controlled. In comparison, the 2019 Changning Ms6.0 earthquake in the Changning salt mining area is associated with high Vp/Vs. expression, suggesting its occurrence is related to fluid injections. In addition, top of the crystalline early Neoproterozoic (pre-Sinian) Sichuan basement is characterized by the 6.5 km/s Vp contour, which is new for earthquake tomographic studies in the region. Combined with outcrop analysis, we are able to construct a structural framework for induced seismicity in southern Sichuan basin, which unravels the structural architecture of induced seismicity.
1 Introduction
Induced seismicity resulting from subsurface fluid injection activities has been documented globally (Ellsworth, 2013; Lei et al., 2020), including waste water disposal in midcontinental United States, shale gas hydraulic fracturing in western Canada, and shale gas development in southern Sichuan basin. As the second largest unconventional shale gas production area in the world, the Sichuan basin has experienced abrupt increase in earthquake activity since the mass production of shale gas began in 2014 (Lei et al., 2020). In southern Sichuan basin, there are mainly three shale gas production fields, including the Changning-Zhaotong field, the Weiyuan field, and the Fuling field (Lei et al., 2020). To the north of the Changning-Zhaotong shale gas field, there is a salt mining field. In both Changning shale gas field and salt mining field on the Jianwu syncline and the Changning-Shuanghe anticline system (Figure 1) respectively, a few devastating earthquakes coupled with a considerable number of seismic events of Ms>3.0 (felt seismicity) have been induced by both prolonged and temporary subsurface fluid injections (Ruan et al., 2008; Sun et al., 2017; Lei et al., 2019b; Tan et al., 2020), respectively. Prolonged injections are mainly related to wastewater disposal and salt mining operations and last for a couple of years to some decades (Lei et al., 2008; Zhang et al., 2012; Lei et al., 2013). In contrast, temporary injections are characteristic of hydraulic fracturing at designated well pads for shale gas exploitation and are typically carried out for only a few months (Lei et al., 2017; Lei et al., 2019a; Meng et al., 2019; Tan et al., 2020). In the shale gas hydraulic fracturing region, the concentration of induced seismicity was only on a handful of hydraulic fracturing sites (Lei et al., 2020), similar to the observation of Atkinson et al. (2016) on other zones.
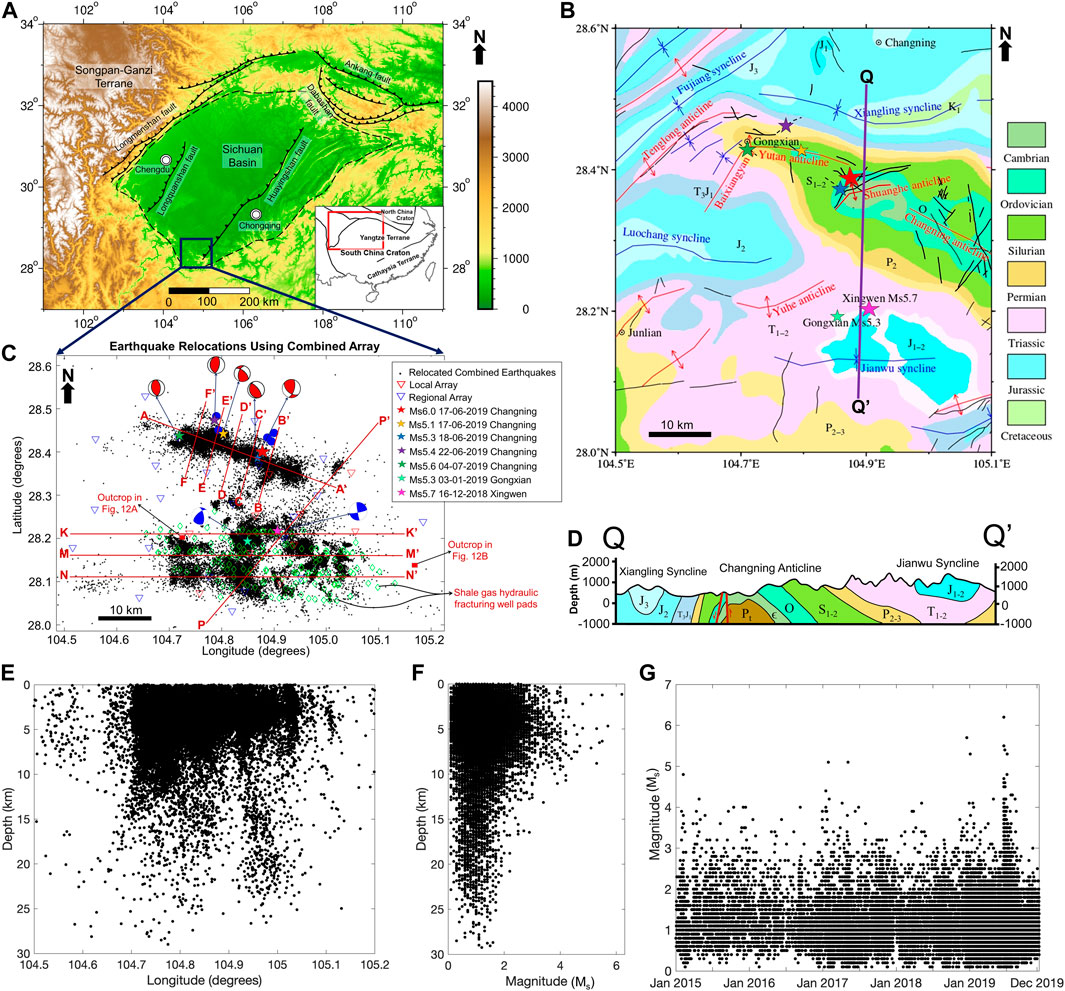
FIGURE 1. (A) Topographic map of Sichuan basin showing area studied and prominent thrust structures. (B) Distribution of relocated epicenters (dots), seismic stations (triangles), and shale gas hydraulic fracturing well pads (diamonds) within the target study area. Beachballs with red and blue tension quadrants represent focal mechanisms of Ms>5.0 earthquakes after Wang et al. (2020) and Lei et al. (2019b) within the salt mine and shale gas regions respectively. Red squares denote outcrop locations while blue circles represent zones of co-seismic surface deformations. (C) Tectonic and geological settings map of southern Sichuan basin, modified from Zuo et al. (2020). Red lines with outward pointing arrows are anticlines, blue lines with inward pointing arrows are synclines, black lines are mapped seismic-scale faults and black dashed lines are previously unmapped faults. (D) Cross-section showing the structural architecture of the Xingwen shale gas and Changning salt mining zones corresponding to Jianwu synclinal region and Changning-Shuanghe anticlinal system respectively, modified from Wang S. et al. (2020). (E) Vertical view of relocated earthquakes. (F) Magnitude distribution with depth. (G) Magnitude distribution with time.
A swarm of induced earthquakes with magnitudes reaching Ms6.0 battered Changning and the neighboring towns (Lei et al., 2019b; Yi et al., 2019; Liu and Zahradník, 2020) after the 2018 Xingwen Ms5.7 main shock that was interpreted to have resulted from hydraulic fracturing for shale gas production (Lei et al., 2019a). This rise in the magnitude and frequency of induced seismicity has aroused increasing concern of potential risks in shale gas exploitation and salt mining operations in this region. Therefore, further investigation of the source mechanisms, source locations and subsurface velocity architecture are imperative to understand induced seismicity in the Changning-Xingwen region.
Neoproterozoic Sichuan basement rocks constitute portions of the Precambrian Igneous complex, which controls structural deformation and spans the entire Sichuan Basin with outcrop equivalents that bound the edges of the basin (Liu et al., 2021). Therefore, to better understand the cause of earthquake activity in southern Sichuan basin, it is important to have detailed comprehension of seismicity induced by fluid injection and improved understanding of the structural morphology of the characteristic down-to-basement faults. Previous research works by Lei et al. (2017), Lei et al. (2019a), Meng et al. (2019) and Tan et al. (2020) were primarily focused on earthquake location and focal mechanism determination. Lei et al. (2017), Lei et al. (2019a) and Yi et al. (2019) mainly utilized the conventional cut-and-paste (CAP) inversion method to calculate the centroid depths and focal mechanisms of some moderate to strong earthquakes. However, while centroid depths and focal mechanisms are helpful for understanding the relationship between induced seismicity and fluid injection activity, they do not provide the accurate structural framework for the occurrence of induced seismicity. InSAR data have been used to infer that the Changning anticline is characterized by a single seismogenic fault (Wang S. et al., 2020), which is highly unlikely given the several faults that deform the anticline (Figure 1C). Recently, Wang et al. (2022) applied InSAR inversions to define three seismogenic faults beneath the Jianwu syncline, however, they could only achieve resolution accurate to 10 by 10 km, which is lower than the 5 by 5 km resolution achieved by the earthquake tomographic inversion of this study.
In general, accurate characterization of the structural framework controlling seismicity beneath a seismogenic zone results from detailed interpretation of seismogenic faults from reflection seismic profiles, tomographic velocity models and accurately relocated earthquake lineaments. Unfortunately, only very few seismic reflection profiles are publicly available (e.g., Liu et al., 2021). There exist, however, quite a number of tomographic studies that investigate parts of or the entire Sichuan basin. Wang et al. (2013) utilized ambient noise tomography to obtain S-wave velocity model beneath the entire Sichuan basin with spatial resolution only as good as ∼50 km by 50 km within our study area. At this resolution, only regional scale velocity features are imaged, with detailed reservoir scale features essentially muted out. Up to now, the most prominent study that covers the entire Sichuan basin is the study by Wang et al. (2016), which incorporated a suite of geological and geophysical data to obtain three-dimensional seismic velocity structure beneath the Sichuan basin. At this resolution, basin-scale geologic features are imaged including the structure of the crystalline Sichuan basement. However, detailed field or reservoir scale structural imaging is lacking in most parts of the basin due to the poor coverage of sparsely distributed seismic reflection profiles and seismic events.
In the southern Sichuan basin, there has been continuous influx of body wave arrival time data, derived from continuous monitoring of natural earthquakes and induced seismicity with different networks of seismic stations. This continuous flow of data has led to several seismic studies within the region, many of which focused on seismicity location and focal mechanism determination. A couple of researchers have recently utilized varying portions of this data flow to determine velocity models at these scales (Long et al., 2020; Zhang et al., 2020; Zuo et al., 2020). Pioneering seismic tomographic study of the region is that of Long et al. (2020), which used 5,252 events recorded on relatively sparse seismic stations and 1-D initial velocity model developed from large-scale tomographic results of Zhao and Zhang (1987). They only obtained Vp (P-wave velocity) and Vs (S-wave velocity) models with spatial resolution of 10 km by 10 km in the longitude and latitude directions, which showed that generally seismicity in this region is predominantly situated in high Vp and high Vs zones, suggesting them to be structurally controlled. Later work by Zhang et al. (2020) utilized a dataset of 8,818 seismic events, which were recorded by a local array of 39 seismic stations between the first of December 2018 and the fourth of July 2019 to determine the velocity structure of the region with similar resolution as Long et al. (2020). They obtained similar Vp and Vs results with Long et al. (2020) with the exception of characterization of low Vp associated with high Vs and low Vp/Vs expressions beneath the southern part of the studied region that correlates with the Jianwu syncline from 4 to 16 km depths. These low Vp zones were inferred as evidence of presence of deep fluids (Zhang et al., 2020), thereby suggesting fluid induced mechanism for these earthquakes. However, this inference is highly skeptical without commensurate low Vs expression, which corresponds to high Vp/Vs ratio. Given that the region has undergone extensive fluid injection involving over 200 wells (Figure 1B) since 2014, it is imperative that the Vs model should reflect features related to fluid distribution. Recently, Zuo et al. (2020) used a more complete version of the regional data set made up of 24,640 earthquakes, recorded by an array of 86 seismic stations to determine the crustal velocity structure of the region up to 5 km by 5 km resolution in the longitude and latitude directions. Their results show obvious high Vs and low Vp/Vs ratio features for seismicity within the region, suggesting no fluid influence on seismicity. Even though these studies imaged the subsurface at this important seismogenic environment, they could not resolve structures clearly representative of fluid influence and their resolvability of local geologic features is also limited due to sparse catalog travel time data utilized in the tomography and the 1-D initial velocity models that were derived from poorly resolved travel time tomography (Zhao and Zhang, 1987) and ambient noise tomography (Lei et al., 2017) results, which are not as accurate as vertical seismic profiles or reflection seismic velocities. We posit that velocity structure beneath this region can be improved by utilizing a more precise 1-D starting velocity model and incorporating denser local catalog data, in the absence of adequate well and seismic data that is essential for the construction of a reliable 3D velocity model.
In this study, we aim at enhancing earthquake locations and consequently better constrain velocity models to improve understanding of the structural framework for induced seismicity in the Changning region, southern Sichuan basin by incorporating local temporary seismic stations. Basically, we combined earthquake catalog data of Zuo et al. (2020) and arrival times recorded by temporary local stations in Tan et al. (2020). More accurate relocations of induced seismicity and crustal velocity structure are determined by Vp/Vs consistency-constrained double-difference seismic tomography (Guo et al., 2018). In addition, we describe the fault and fracture patterns of the Paleozoic sedimentary strata exposed in southwestern Sichuan Basin. These investigations combine to provide better understanding of the controlling structural framework for induced seismicity in the Changning region. This study also supplies the first map of basement structure of southern Sichuan basin from the inverted velocity model, and provides direct indication of linkage between basement structure and induced earthquakes, as well as reveals likely avenues for the migration of injected fluids upward into the overlying siliceous quartz-rich Tertiary rocks resulting in the shallow initiation point of the main shock, and downward to the basement complex from the injection intervals, which are an indispensable tool for rapid generation of induced seismicity.
2 Tectonic and geologic setting
2.1 Basin evolution
The Sichuan Basin is a large intracontinental basin in western China, which has undergone various structural transformations in the vicinity of the Tibetan Plateau (Liu et al., 2012). It is situated on the western edge of the south China craton (Figure 1A), which is bounded in the northwest by the Yangtze platform and in the southeast by the Cathaysia block (Liu et al., 2012; Liu et al., 2017; Liu et al., 2021). Recently, the basin has gone through a transformation from a comparatively stable craton stage to an unstable stage that is marked by convoluted deformation (Wang, 1989). The late Paleozoic to middle Mesozoic Qinling Orogenic belt detached the basin from the North China craton (Meng and Zhang, 2000; Dong et al., 2011), while the fold and thrust belts of Longmenshan-Daliangshan separated it from the Mesozoic-Cenozoic eastern Tibetan Plateau (Roger et al., 2010; Liu et al., 2013). According to Meng and Zhang (2000), the Qinling orogenic belt underwent an extensive tectonic past and is thought to have experienced collision along the Shangdan suture area of middle Paleozoic and the Mianlue suture area of middle to late Triassic periods. The subsequent two-phase collision of the North and South China cratons along the Mianlue suture area applied serious effect on the development of the Sichuan Basin (Liu et al., 2005) and entire Yangtze terrace (Liu et al., 2021).
Following the Early Triassic, two major tectonic periods were responsible for the structural configuration of the eastern Tibetan Plateau: Late Triassic thrusting that is composed of sinistral strike-slip motions (Chen and Wilson, 1996; Deng et al., 2012; Yan et al., 2018) and Cenozoic fault reactivations under E-W compression (Burchfiel et al., 1995), which grew into prevailing deformation that involved the crystalline basement beneath the southern part of Longmenshan and Daliangshan (Deng et al., 2018; Tian et al., 2018). Wilson et al. (2006) and Royden et al. (2008) described the reactivation of preexisting structures as the product of late Cenozoic eastward or southeastward thrust of the Tibetan Plateau. Slip on these preexisting structures is believed to be the source of frequent microearthquakes (Ms<3) and several moderate-to-major (Ms>3) earthquakes in the Sichuan basin. Therefore, the tectonostratigraphic configuration of the Sichuan basin is believed to be mainly controlled by thrust belts that circumscribe the basin, which comprises the Longmenshan belt to the west, the Dabashan to the north, the Eastern Sichuan belt to the east, and the Kangdian belt to the south (Wang et al., 2016) (Figure 1A). Within the basin, however, structural deformation is mainly characterized by a complex array of thrust and normal faults, with some strike-slip counterparts (Liu et al., 2021).
2.2 Stratigraphy
The Sichuan basin was developed from Sinian to Late Triassic period, during which a tenuous, deficient sequence of marine and non-marine debris accumulated (Burchfiel et al., 1995; Jia et al., 2006). The basin transformed to completely non-marine in the course of the Late Triassic Indosinian orogeny, as a result of the closing of the Paleo-Tethys (Chen and Wilson, 1996). During the orogenic deformation, the Sichuan foreland basin was formed by the thrusting of the Longmenshan toward the basin (Burchfiel et al., 1995; Li et al., 2003; Jia et al., 2006). The areal extent of the resultant Sichuan basin is approximately 190,000 km2 and it contains Sinian to Quaternary sediments with thickness ranging from 5 to 12 km (Zhai, 1992; Li et al., 2005). Strata overlying Cretaceous rocks in the southwestern part of the Sichuan basin mostly consists of Early Tertiary sediments that are composed of fluvial lacustrine red siltstones and sandstones (Burchfiel et al., 1995; Chen and Wilson, 1996; Zhou et al., 2002; Jia et al., 2006), which are highly rich in quartz and silica content. Situated to the west, however, is a thin foreland basin exclusively composed of Quaternary sediments (Burchfiel et al., 1995; Hubbard and Shaw, 2009; Hubbard et al., 2010), which developed in the Late Cenozoic as a result of rapid uplift of the Longmenshan area (Kirby et al., 2002). Most outcrop occurrences of sedimentary strata within the basin are of Mesozoic to Cenozoic age (Wang et al., 2016). Figure 2 shows the stratigraphic column of three wells Ning 201 and 203 drilled within the Shale gas block in the Jianwu syncline and Ning 2, which was drilled on the salt mine block in the Changning anticline. These stratigraphic sections reveal younger formations that correspond to low Vp and Vs values in the Jianwu area, in contrast to the older formations associated with high Vp and Vs values that characterize the Changning anticline area, thus, buttressing the effect of complex tectonic deformations on strata within the southern Sichuan basin. At the base of the Sichuan sedimentary sequence is the faulted crystalline Neoproterozoic basement complex that developed during the complex magmatic tectonic evolution known as the Yanshanian orogeny (Li and Li, 2003; Yan et al., 2003). Outcrop equivalents of these crystalline basement rocks can be seen at the outskirts of the basin, and reveal the characteristic fault framework of the basement.
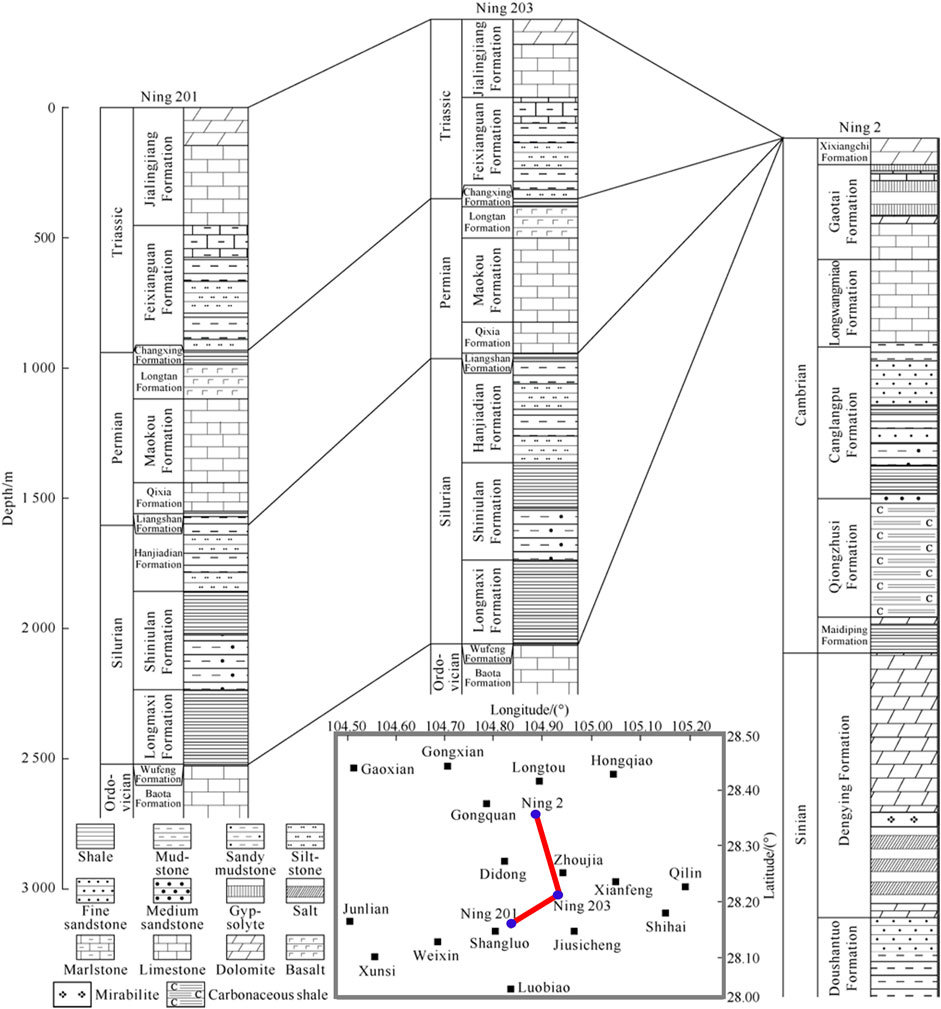
FIGURE 2. Comparison of stratigraphic sections of the Changning anticline and Jianwu syncline, modified from He et al. (2019). Note: red solid line represents cross-section profile, while blue circles denote wellhead positions.
2.3 Seismic activity
The southwestern Sichuan Basin (our study area) is bounded on the west by Qinghai-Tibet block, and on the south by the mountain transition range of the Yungui Plateau (Figure 1A). The most prominent structural feature is the Changning-Shuanghe compound anticlinal system that trends in the NWW to SEE direction, and primarily consists of Baixiangyan-Yutan, Shuanghe, Changning and Tenglong anticlines (Figures 1C,D). The Changning Ms6.0 earthquake of June 2019 occurred on the Changning anticline within our study area (Figures 1B,C). Higher (steeper) limb dips characterize the northern part of the Changning-Shuanghe anticlinal system, as opposed to lower (gentle) limb dips observed in the southern part (Zuo et al., 2020), and Cambrian strata are revealed with in the core. Axial direction of the maximum horizontal principal stress was determined by Lei et al. (2019a) to be 77o within the Changning-Shuanghe anticlinal system. The foreshocks and aftershocks of Ms6.0 Changning earthquake mostly occur along the Changning anticlinal axis. The extended source region of southwestern Sichuan basin is believed to be bounded by the northeast-southwest trending active major Huayingshan fault, which is characterized by thrust and dextral strike-slip movements (Deng et al., 2003). The crestal and limb regions of the Changning-Shuanghe anticlinal systems are believed to be predominantly characterized by several mini high-angle thrust and normal faults (Wang et al., 2016; Liu et al., 2021). On the other hand, focal mechanisms determined by Lei et al. (2017) show the shale gas region within the Jianwu syncline, as having maximum horizontal principal stress direction of approximately N100oE to N115oE, which conforms to results gotten from in-situ rock stress measurements by Wang et al. (2016). The Jianwu and Luochang synclines are large with gentle intrasynclinal structural morphology and Jurassic aged topmost layer (Zuo et al., 2020). Nevertheless, two major earthquakes—2018 Xingwen Ms5.7 and 2019 Gongxian Ms5.3 shocks occurred on the Jianwu syncline (Figures 1B,C), whose seismogenic structures were well constrained by InSAR inversions (Wang et al., 2022). These synclines are mostly characterized by high-angle large scale tectonic faults and fractures that are well developed and trend mainly in the EW, NE and NNW directions (Shi et al., 2019; Wang et al., 2022).
3 Data and methodology
3.1 Data availability
We utilize combined seismic phase arrivals from 86 regional stations of Zuo et al. (2020) and 10 local stations (Figure 3). The regional stations recorded phase arrivals of about 34,296 individual seismic events within our study area from the first of January 2015 to the 31st of August 2019 (Zuo et al., 2020). Our local stations on the other hand, recorded seismic phase arrivals of about 15,126 earthquakes from the 19th of January 2019 to the 10th of December 2019.
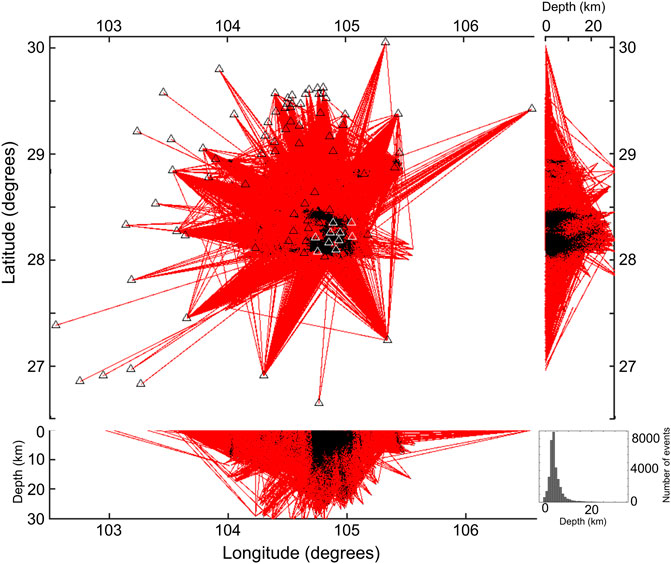
FIGURE 3. Coverage of seismic ray paths involved in the joint inversion. Black dots represent seismic events recorded by the combined array. Black triangles represent regional array stations used in Zuo et al. (2020), and white triangles represent our local stations, respectively, while red lines represent ray paths.
Epicentral distances to be considered during data selection was set to be below 150 km, similar to Zuo et al. (2020), and data with substantial deviations from the time-distance curves were effectively removed (Figure 4A). The earthquakes are determined based on the requirement of at least 8 phase arrivals, both for the regional and local arrays. Analogous to the regional data from Zuo et al. (2020), the distance between any given event pair was set under 10 km for calculating the event-pair differential times, with a maximum number of neighbors of 20. Overall, phase data of 36,314 (24,640 regional array and 11,674 local array) earthquakes with high signal-to-noise-ratio were selected for seismic tomography. The chosen regional array seismic events consisted of 161276P-wave absolute, 161515S-wave absolute, 148818S-P absolute, 1575384P-wave relative, 1569036S-wave relative and 1447388S-P relative arrival data, while those of the local array included 83577P-wave absolute, 74724S-wave absolute, 65546S-P absolute, 2196834P-wave relative, 1988838 S-wave relative and 1916632S-P relative arrival data. Detailed explanation of the meaning of the data and inversion terminologies utilized in this section can be found in the manual for TomoDD (Zhang and Thurber, 2003; Zhang et al., 2009). We utilized an initial one-dimensional (1-D) velocity model that was developed as an average based on vertical seismic profile (VSP) from a well located about 40 km northwest of our study area and modelled reflection seismic P-wave velocity data within our study area from Wang et al. (2016), see Figure 4B. Average velocity values were utilized for depths shallower than 5 km, while the velocity values of the deeper levels were determined solely from the results of the modelled reflection seismic P-wave velocity data. This initial velocity model was preferred to the 1-D initial velocity model used by Zuo et al. (2020) (Figure 4B), which was proposed by Lei et al. (2017) based on results of seismic ambient noise tomography, because VSP and reflection seismic velocities are superior and more accurately express the geology of the area. As expected, the initial residuals are smaller and better distributed around 0 s, with an improved approximate Gaussian distribution (Supplementary Figure S1). By adopting a fixed Vp/Vs of 1.73, which is an average crustal Vp/Vs estimated for the Sichuan basin by Lei et al. (2017), we derive the initial one-dimensional Vs model. This Vs model was preferred to the Vs from the VSP in order to ensure that fluid changes resulting from widespread injection in the region are better constrained, without the introduction of velocity artifacts, which would have arisen from the sole use of the Vs from VSP. Generally, P-wave velocities are less affected by injected fluids, which significantly alter S-wave velocities. Therefore, Vp is more suitable for regional velocity estimation than the Vs.
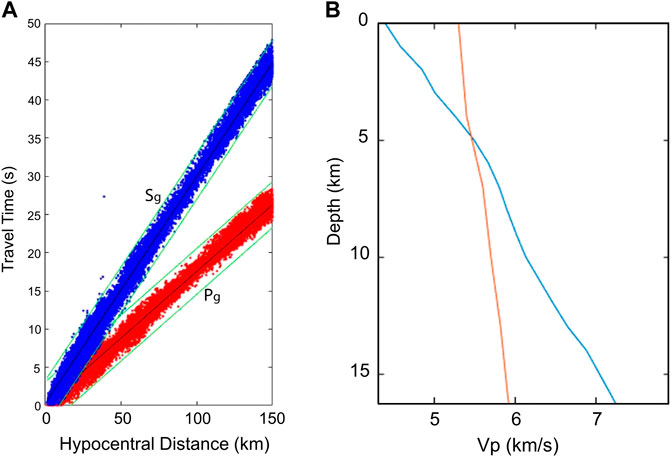
FIGURE 4. (A) Time–distance curves of P-wave phase data in red and S-wave phase data in blue. Black lines represent the linear fitting of travel time against hypocentral distance, and the green lines denote tolerance limits for data with large deviations. Sg and Pg denote direct S- and P-wave arrivals, respectively. (B) Initial 1D P-wave velocity model. Blue line denotes the model used in this study, while red line denotes that used in Zuo et al. (2020).
3.2 Seismic tomography method and model resolution analysis
To carry out seismic tomography, we use a recently updated version of the original double difference seismic tomography (TomoDD) method developed by Zhang and Thurber (2003), Zhang and Thurber (2006). The tomoDD method inverts the three-dimensional Vp, Vs models and earthquake locations using both absolute and relative arrival times, which can improve earthquake locations and velocity structure in the source area. Zhang et al. (2009) improved the TomoDD method by expanding it to include inversion of Vp/Vs with S-P (Ts-Tp, where Ts is the arrival time of S-wave and Tp is the arrival time of P-wave) differential data. Due to the relative paucity of S-P data, the recovered Vp/Vs model, though reliable, lacked good resolution (Guo et al., 2018). On the other hand, dividing inverted Vp model by the corresponding Vs model can also yield a Vp/Vs model. Unfortunately, Vp/Vs model inverted in this manner is highly unreliable, even though it typically shows higher resolution, making the resultant model very challenging for any meaningful geologic interpretation (Eberhart-Phillips, 1990; Huang et al., 2014). This issue is resolved by the Vp/Vs model consistency-constrained double-difference seismic tomography (TomoDDMC) by Guo et al. (2018). TomoDDMC utilizes P-wave, S-wave and S-P data to obtain reliable Vp/Vs model with enhanced resolution, as well as generate accurate Vp and Vs models and earthquake relocations. Therefore, we employ TomoDDMC to carry out joint inversion of the 3-D Vp, Vs and Vp/Vs models in the southern Sichuan basin.
Taking into consideration the distribution of stations and recorded seismicity, we set the coordinate origin at 104.8oE and 28.3oN, which corresponds to the center of our study area. The X-axis is oriented to the east while the Y-axis is oriented to the north. Along the X-axis and Y-axis, grid nodes were situated at −300, −60, −45, −30, −20, −15, −10, −5, 0, 5, 10, 15, 20, 30, 45, 60, 300 km, similar to Zuo et al. (2020). The grid nodes for the Z-axis in the downward vertical direction were densely situated at −100, −2, 0, 1, 2, 3, 4, 5, 6, 7, 8, 9, 10, 11, 12, 13, 14, 15, 16, 17, 18, 19, 20, 30, 200 km depths below the mean sea level (MSL). Coverage of seismic ray paths are displayed in Figure 3. TomoDDMC applies two major constraints—damping, which constrains model slowness and earthquake relocations, as well as smoothing that only constrains the model slowness. The L-curve method for establishing trade-offs for model solution norm and data residual norm, developed by Eberhart-Phillips (1986) was applied to obtain the optimal damping and smoothing parameters for the joint inversion. Figure 5 shows the determined optimal damping and smoothing parameters for inversion to be 800 and 80, respectively.
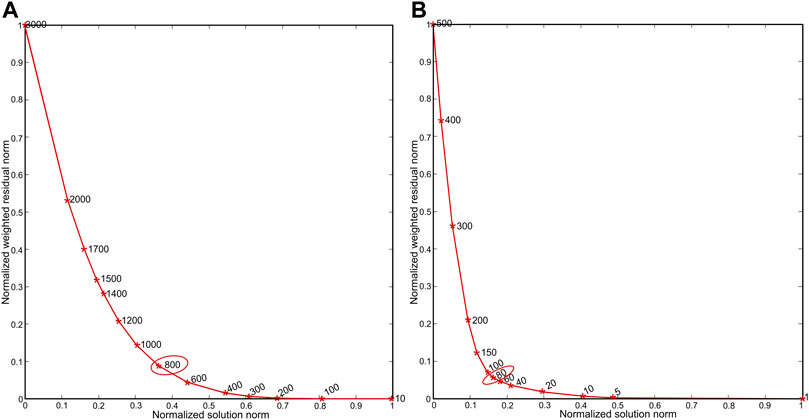
FIGURE 5. Trade-off curves. (A) L-curve for selection of damping parameter. (B) L-curve for selection of smoothing parameter. Optimal parameters selected are enclosed within the red ovals.
The reliability and quality of tomographic inversion models are typically estimated from checkerboard resolution test, which was originally developed by Humphreys and Clayton (1988), as well as from restoration test developed by Zhao and Hasegawa (1993). First, we constructed a synthetic checkerboard velocity model that comprised of alternating perturbations to the initial 3-D Vp and Vp/Vs models of ±5% and ±10% respectively. The corresponding alternating perturbations of the synthetic Vs checkerboard model were computed from the synthetic Vp and Vp/Vs models to be approximately +5.5% and −4.5%. Then, we applied the pseudo-bending ray tracing algorithm by Um and Thurber (1987) to calculate the synthetic phase arrivals, using our checkerboard model and the same distribution of seismicity (catalog data) and stations within the study area. The final step involved inversion of the synthetic input dataset with identical inversion parameters as were utilized in the inversion of the real data. On the other hand, the restoration test was similar to the checkerboard test but synthetic travel times are calculated using the seismicity relocations and Vp, Vs and Vp/Vs models inverted with TomoDDMC. The checkerboard resolution test and restoration test results are displayed in Figure 6 and Supplementary Figure S2, respectively. It is clear that our inversion is of high resolution (5 km by 5 km) and reliability from 0 to ∼13 km, with the exception of some peripheral areas. Supplementary Figure S3 shows that resolution deteriorates with finer horizontal grid spacing of 2.5 km by 2.5 km, therefore, confirming that the best obtainable resolution with the current dataset is 5 km by 5 km in the horizontal directions. The final root-mean-square (RMS) travel time residuals are well minimized from 1.5 s to 0.2 s after inversion, with the comprehensive initial and final RMS values for all travel time data being 0.944 s and 0.056 s, respectively. The residuals are roughly distributed around 0 s and have an approximate Gaussian distribution, indicating that the final models can fit the data (Figure 7).
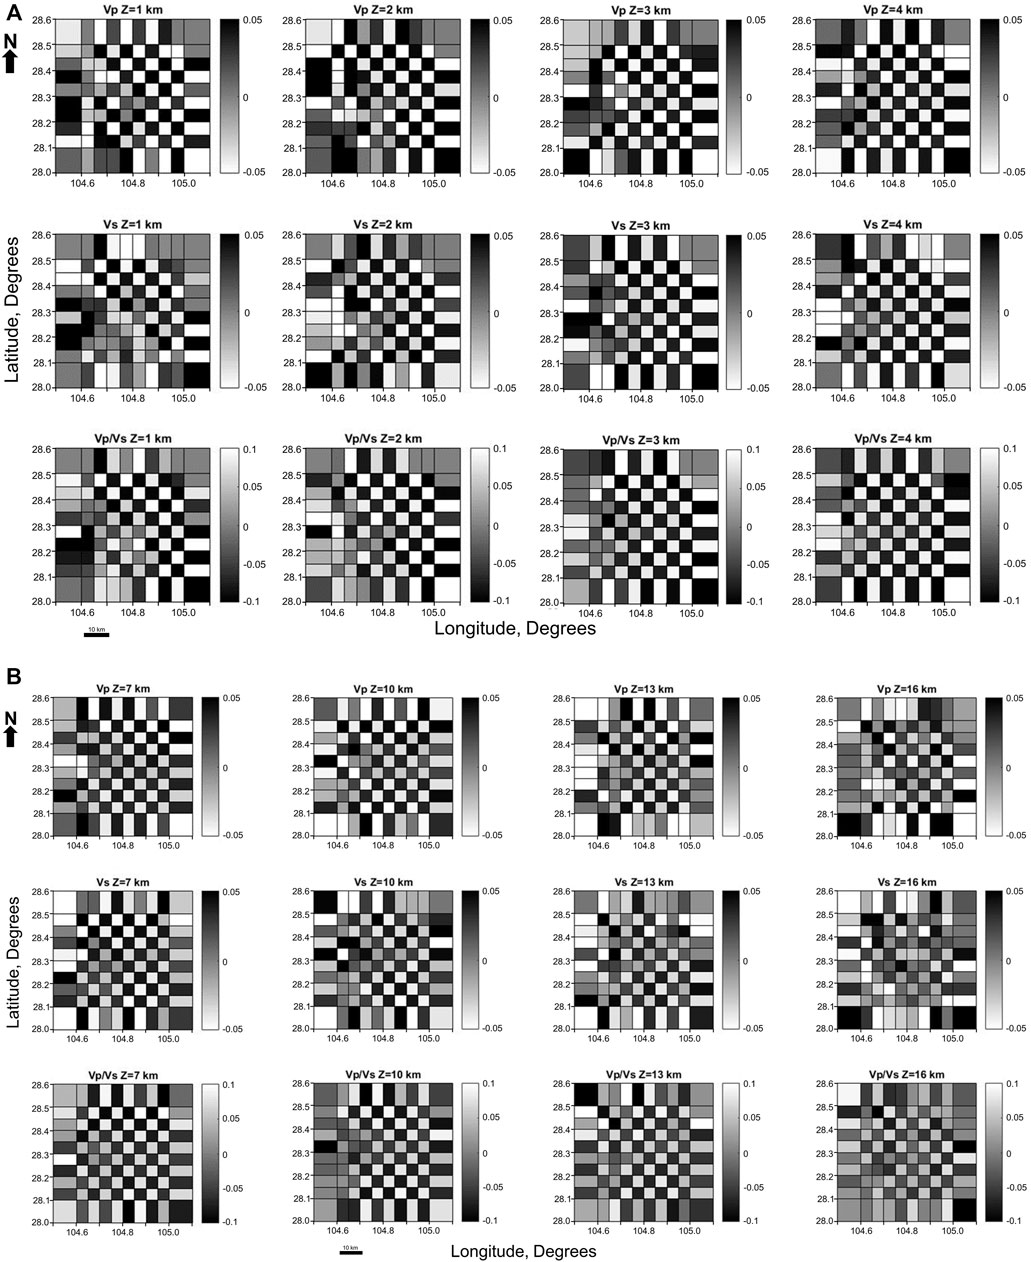
FIGURE 6. Inverted Vp, Vs and Vp/Vs checkerboard resolution for (A) 1–4 km depth slices. (B) 7, 10, 13 and 16 km depth slices. The checkerboard size is 5 km by 5 km in the horizontal; directions.
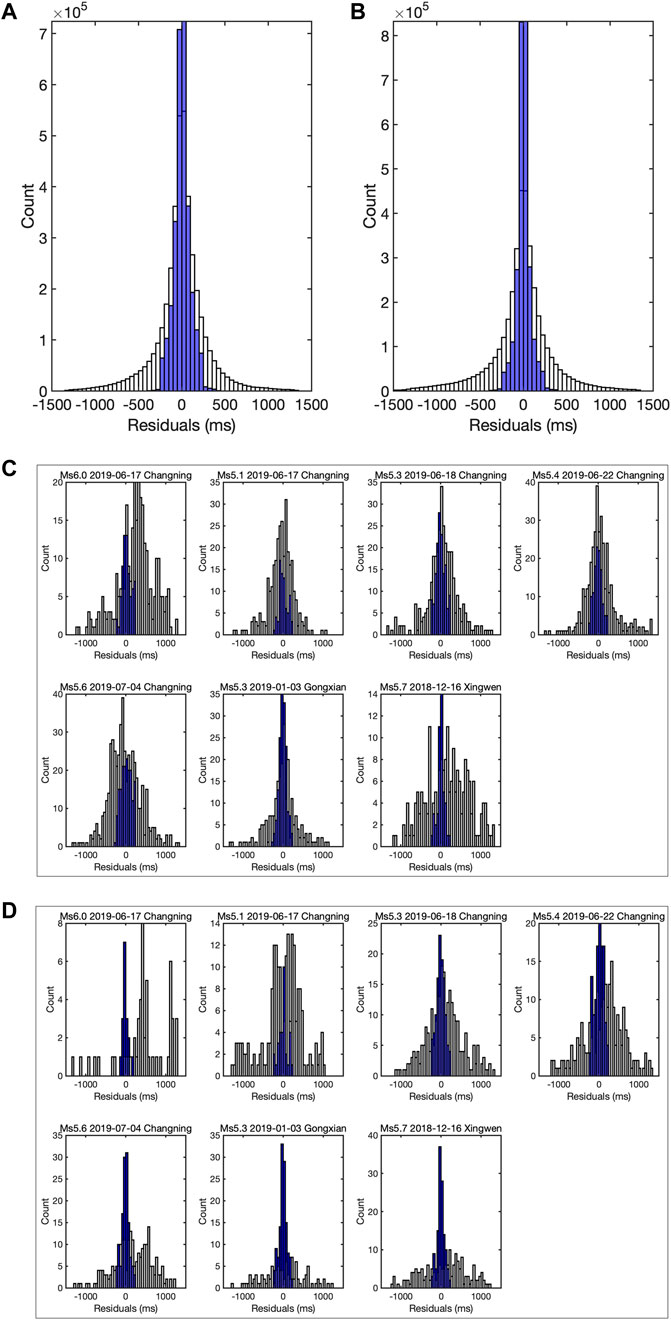
FIGURE 7. Histograms of travel time residuals before and after inversion. Note that white and blue bars denote residuals before and after inversion respectively. (A) Full P-wave. (B) Full S-wave. (C) P-wave residuals for the seven major earthquakes. (D) S-wave residuals for the same major earthquakes in c.
We employ the bootstrapping uncertainty analysis (Efron and Gong, 1983; Efron and Tibshirani 1991), which is based on data resampling to estimate the uncertainties associated with our relocated earthquakes. In this study, we randomly resample our catalog phase arrival data 50 times, and subsequently utilize TomoDDMC to invert the 50 sets of resampled data and obtain their corresponding seismicity relocations. This is followed by computation of the uncertainties of the relocated seismicity in longitude, latitude and vertical directions. We also examined the spatiotemporal location uncertainties associated with the sparse stations of the 2015–2017 events and the dense stations of the 2018–2019 events. The histograms of the estimated location uncertainties in different directions and periods for the relocated seismicity in this study are presented in Figure 8 and Supplementary Figures S4, S5.
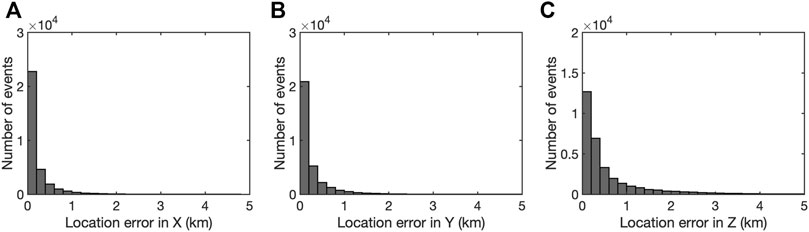
FIGURE 8. Comprehensive seismicity relocation uncertainties in different directions estimated by the bootstrapping method. (A) X (Longitude). (B) Y (Latitude). (C) Z (Vertical).
4 Results
4.1 Seismicity relocation and focal mechanisms
Application of TomoDDMC resulted in the relocation of a total of 35,039 earthquakes. The relocated seismicity is distributed into clusters both in plan and vertical views, as seen in Figures 1B,E and the subsequent profiles, indicating improved relative event locations. Likewise, incorporation of absolute arrival times of new additional data in the seismic tomography resulted in well resolved absolute seismic locations, with RMS relocation uncertainties estimated from bootstrapping method as low as 0.102, 0.119 and 0.274 km in longitude, latitude and vertical directions. Based on Guo and Zhang (2017), the location uncertainties estimated in this way mostly refer to relative event locations. Further examination shows location uncertainties as low as 0.085 km (longitude), 0.09 km (latitude) and 0.217 km (vertical) for 2018–2019 events, and 0.152 km (longitude), 0.179 km (latitude) and 0.349 km (vertical) for 2015–2017 events. It is clear that 2015–2017 events have larger location errors in comparison with the comprehensive data, while the 2018–2019 events have smaller location errors, suggesting that the uncertainties obtained with the complete data set can be interpreted as a tradeoff result. It is also important to note that location uncertainties for the 2015–2017 events are comparable to the complete data set, suggesting that the effect from the sparsely recorded events of 2015–2017 can be ignored.
Enhanced seismic relocations delineate very clear planar features of traces of active preexisting faults that characterize the Changning salt mine and shale gas regions, many of which are believed to be sub-seismic. Based on the combined data from our local array and the regional array, seven major induced earthquakes (Ms>5) within the study area are accurately relocated (Figure 1B). The relocation results of the Changning Ms6.0 main shock that is said to be fluid induced (Ruan et al., 2008; Zeng et al., 2014; Zhu and He, 2014; Sun et al., 2017; Lei et al., 2019b; Yi et al., 2019; Liu and Zahradnik, 2020), the associated Ms > 5 aftershocks situated within the Changning salt mining area and the Ms5.3 Gongxian and Ms5.7 Xingwen earthquakes that occurred within the shale gas block are listed in Supplementary Table S1. Given the consistency in the centroid depth, spatial orientation and rupture distribution of the source faults of the 27 January 2017 Ms5.1 Xingwen earthquake, 16 December 2018 Ms5.7 Xingwen earthquake and the 3 January 2019 Ms5.3 Gongxian earthquake, determined from centroid moment solutions (Lei et al., 2017; Lei et al., 2019b; Yi et al., 2019) and recent InSAR inversions (Wang et al., 2022), we utilize their results in comparatively assessing the uncertainties of our results (Supplementary Table S2). We find that the focal depth results determined by our study agree with the shallower centroid depths obtained for these major earthquakes with thrust, strike-slip and thrust focal mechanisms, respectively. This buttresses the enhanced resolution and location accuracy achieved in this study, which is also supported by the trivial relative location errors computed as a result of utilizing a robust data set and seismic tomographic method of 5 by 5 km higher resolution. The spatio-temporal distribution of earthquake magnitude in Figures 1F,G show that majority of seismicity beneath the study area have Ms<3.0 and are spread between 0 and 27 km, while the events with Ms>3.0 occur shallower between 0 and 9 km.
4.2 3-D Vp, Vs and Vp/Vs models
4.2.1 Depth slices
We show depth slices of Vp, Vs and Vp/Vs models and earthquakes plotted within 1 km above and below the depth slices in Figure 9. The tomographic results reveal crustal structures characterized by pronounced velocity heterogeneities within 0–10 km depth range, which correlate with the background regional geology. The 1-km depth slice shows a high velocity region beneath the Changning-Shuanghe anticlinal system. This is flanked by low velocity regions that can be related to mini basinal areas with younger sediments in the NE, NNW and NW, which correspond to the Xiangling, Fujiang and Luochang synclines, respectively. The Vs structure at this depth generally shows similar trends beneath the anticlinal and synclinal regions as described for Vp structure. The high Vp trend continues beneath the Shuanghe anticline up to 6 km depth (Figure 9 and Supplementary Figure S6), beyond which, a southwest trending low Vp expression appears (Supplementary Figure S6). This low Vp expression is bounded to the east and west by high Vp expressions. Similarly, the anticlinal region is mainly characterized by high Vs expression up to 7 km depth (Figure 9). Below 7 km, relatively homogeneous Vs structure that is characterized by sparse seismicity is observed (Supplementary Figure S7). Structural result of Vp/Vs shows segmentation at 1 km depth slice, with low Vp/Vs and high Vp/Vs expressions on the eastern and western parts of the Changning-Shuanghe anticline, respectively (Figure 9). This segment-style Vp/Vs expression is observed up to 2 km (Supplementary Figure S8). At 4 km slice, low Vp/Vs expression covers the Changning-Shuanghe anticlinal region up to 7 km depth. Below 7 km, the Vp/Vs structure becomes less heterogeneous and predominantly characterized by low Vp/Vs expression (Supplementary Figure S8).
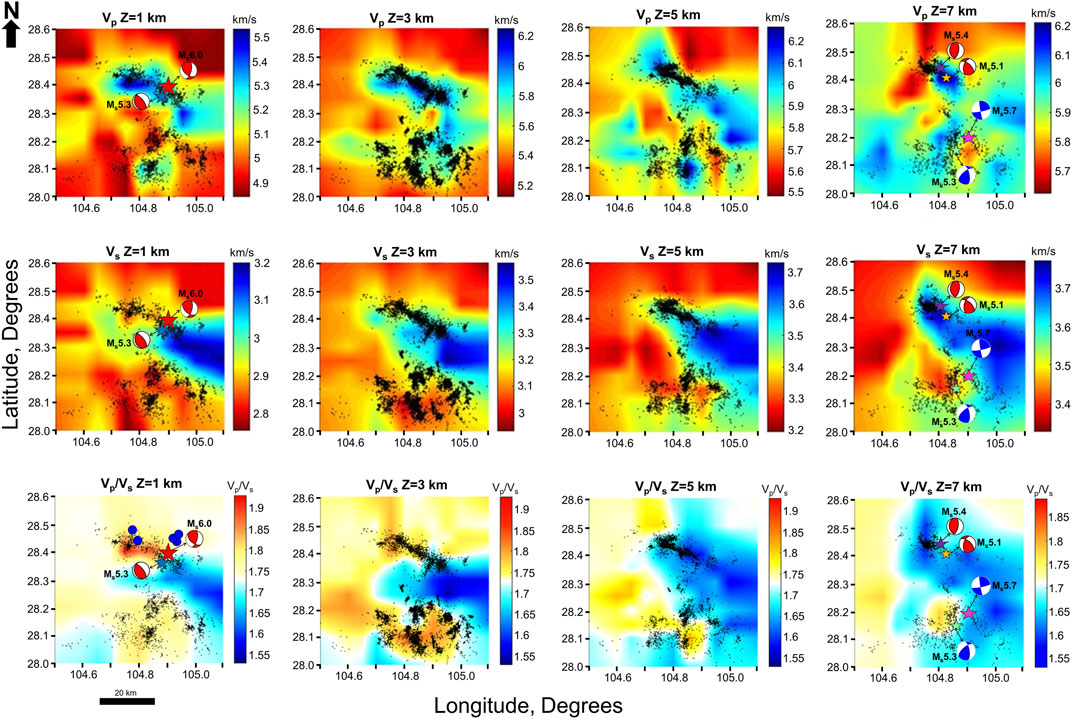
FIGURE 9. Depth slices of Vp, Vs and Vp/Vs models at 1, 3, 5 and 7 km. Black dots represent the vertical projection of earthquakes within 1.0 km on both sides of horizontal section, while blue circles on Vp/Vs slice at 1 km depth are zones of co-seismic surface deformations. The projected epicenters of the Ms6.0 earthquake and its Ms>5.0 aftershocks, Gongxian Ms5.3 earthquake and Xingwen Ms5.7 earthquake are denoted by stars with colors matching the legend in Figure 1B, while their respective focal mechanisms are displayed on the sides.
Within the Jianwu synclinal region (shale gas region), low Vp and Vs expressions are revealed at 1 km depth slice (Figure 9). Predominantly, rocks of high Vp expressions are revealed beneath the Yuhe anticline up to 16 km, while beneath the Jianwu syncline rocks with typically low Vp expressions in comparison with Vp expression of rocks at the same depth level beneath the Changning anticlinal system are mostly revealed up to 4 km (Figure 9 and Supplementary Figure S6). On the other hand, low Vs expression is revealed within the Jianwu syncline (shale gas region) up to 4 km depth, beyond which Vs is mostly high (Supplementary Figure S7). The resultant Vp/Vs model reveals low (∼1.6) to moderately high Vp/Vs expressions (∼1.75) within the region at 1 km depth slice. Also, very high Vp/Vs expression (∼1.76–∼1.88) is revealed at 3 km (Supplementary Figure S8) and 4 km (Figure 9) depth slices. Below 4 km depth, low Vp/Vs feature dominates in the east, while the west is characterized by high Vp/Vs (Figure 9 and Supplementary Figure S8). This Vp/Vs trend continues up to 13 km depth slice, which reveals an east to west trending high Vp/Vs expression in the eastern part of the Jianwu syncline (Supplementary Figure S8).
4.2.2 Vertical cross sections
Ten vertical cross-sections along strategic profiles outlined on Figure 1B are presented in this section. The corresponding surface topography of each profile is also shown. The profiles show systematic structural velocity changes that are consistent with Wang et al. (2016), Long et al. (2020), but differ in several ways from Zhang et al. (2020) and Zuo et al. (2020), as well as imaged deeper than the 10 km threshold of Long et al. (2020).
Along profile AA’ (Figure 10A), we observe low Vp and Vs features up to ∼3 km depth. The relatively flat morphology of the northwest to southeast trending Changning anticline is visible on the Vp expression of this profile. We observe layers of low and high seismic velocities (Vp and Vs) below 3 km depth. It can also be seen that the earthquakes correlate with moderately high to high Vp, high Vs and very low Vp/Vs zone. This zone shallows upward from about 10 km depth in the northwestern part (A) to about 2 km depth in the southeastern part (A’). The Changning Ms6.0 main shock is situated at the transition zone between high Vp/Vs and low Vp/Vs expressions. It obviously occurs in a contrasting structural environment, similar to the Ms>5.0 aftershocks.
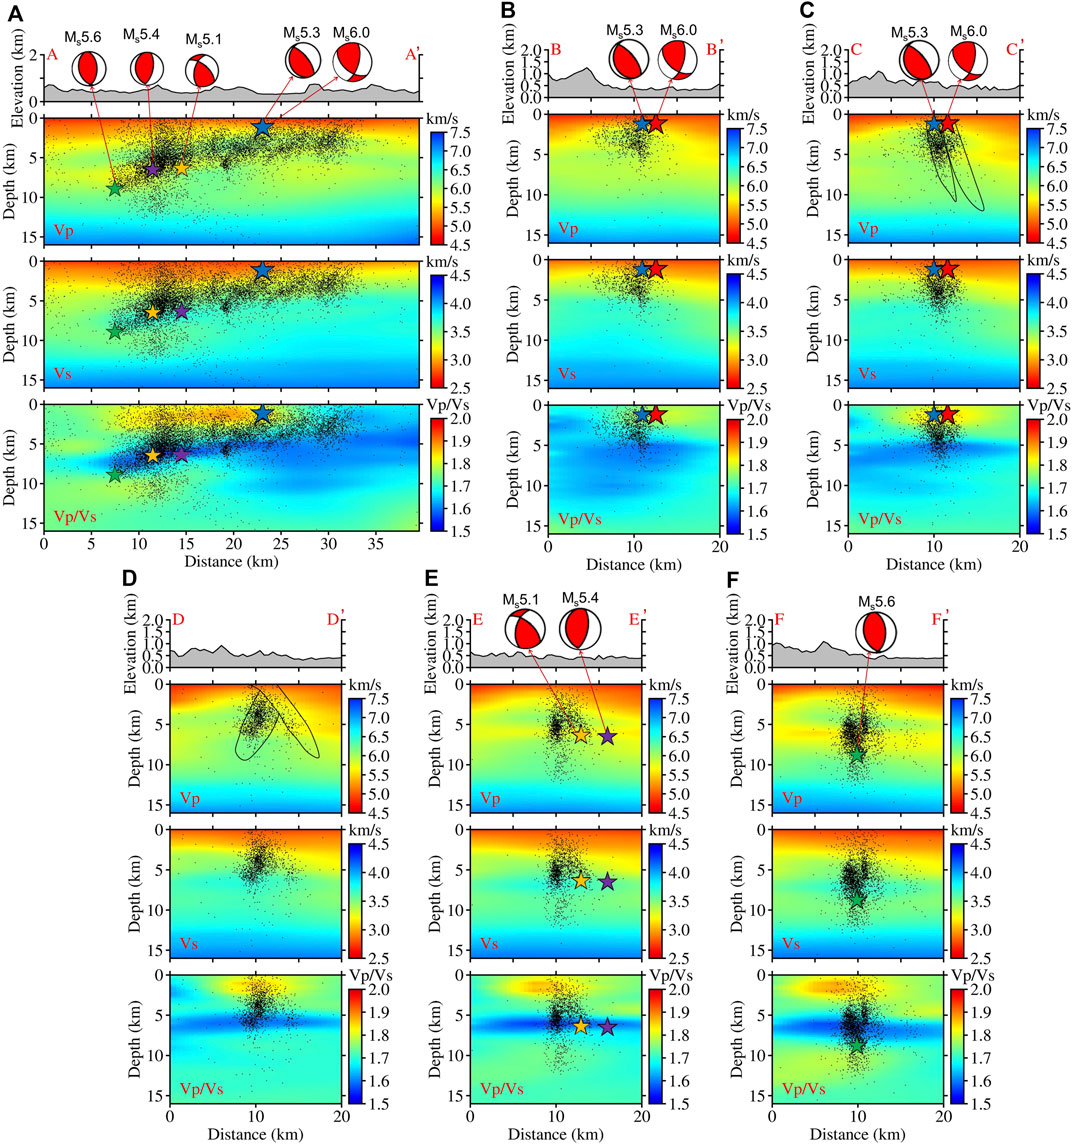
FIGURE 10. Cross-sections of Vp, Vs and Vp/Vs models along different vertical profiles within Changning salt mining region. (A) AA’. (B) BB’. (C) CC’. (D) DD’. (E) EE’. (F) FF’. Black dots are horizontal projections of seismic events within 2.5 km on both sides of the profile. The green, purple, yellow and blue stars on profile AA′ represent the aftershocks with Ms > 5, while the red star behind the blue star represents the Ms 6.0 Changning main shock. The corresponding focal mechanisms for the Ms>5.0 earthquakes are also represented. See Figure 1B for profile directions.
Profiles BB′, CC′, DD′, EE′ and FF′ that run in the southwest (SSW) to northeast (NNE) direction, perpendicular to AA′ are evenly spaced by ∼4 km and are displayed in Figures 10B–F. These results evidently show that the seismic events are predominantly situated within zones characterized by high Vp and Vs, or along the edge of low Vp and Vs expressions, which are associated with low Vp/Vs zones. The earthquakes displayed on profile BB′ clearly show earthquake clusters that extend up to about 5 km depth, with the source zone of the Changning mainshock and associated Ms5.3 aftershock characterized by low Vs and high Vp/Vs expressions. Profile CC′ shows earthquakes that form two separate lineaments that dip towards the northeast (Figure 10). On the other hand, profile DD′ shows earthquakes that form two separate lineaments, one of which is densely populated with seismic events and the other that is characterized by sparse seismicity. Both clusters have varying dips that are similar to the lineaments on profile EE’ (Figure 10). Along profile EE′, the relocated earthquakes evidently form two lineaments similar to profile DD′, with the lineament with more seismic events dipping to the south at very high angles (∼85o), while the other dips to the north at lower angles (∼40o). In addition, the Ms5.1 and Ms5.4 aftershocks of the Changning mainshock align with the northeast dipping lineament of relocated earthquake clusters. On profile FF’, the relocated earthquakes are distributed along two nearly vertical lineaments. The profile also shows that the southernmost lineament is wider than the northernmost lineament. In general, the anticlinal morphology of the Changning anticline is clearly visible on the Vp models along these five profiles, to the extent that the steeper NNE structure is evident.
Profile KK′ extracted within the Changning shale gas block, shows earthquake clusters that are generally situated within moderately low Vp and Vs zones, which typically correlate to low Vp/Vs zones (Figure 11A). MM′ profile reveals a western part with earthquake distributions and velocity structure of similar characteristics to those of KK′ described above (Figure 11B). On the other hand, profile NN′ and eastern part of MM’ show earthquake clusters that are characterized by moderately lowered Vp and low Vs expressions, which correspond to moderately high Vp/Vs expression (Figures 11B,C). However, a few planar seismic clusters are situated within and around low Vp/Vs zones at the distal flanks of the moderately high Vp/Vs expression. These profiles show that lineaments of relocated earthquakes with varying dips and strikes are clearly resolved by seismic tomography.
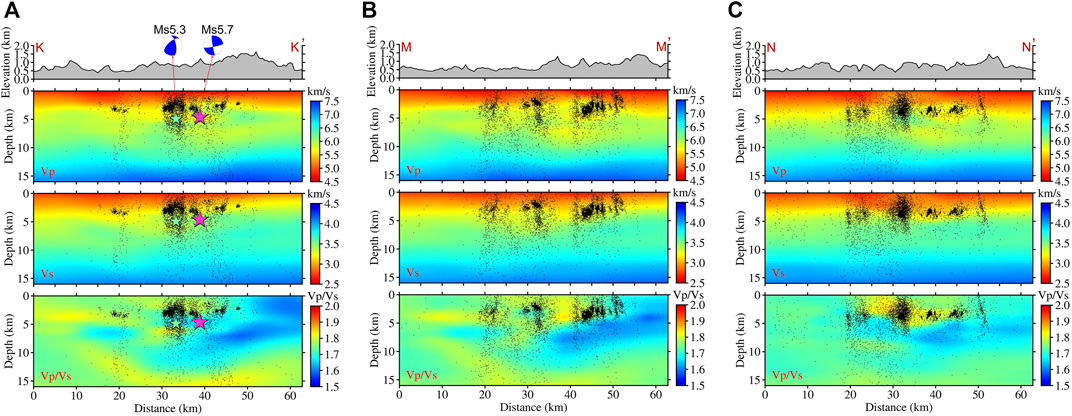
FIGURE 11. Cross-sections of Vp, Vs and Vp/Vs models along different vertical profiles within Xingwen shale gas exploitation region. (A) KK’. (B) MM’. (C) NN’. Black dots are horizontal projections of seismic events within 2.5 km on both sides of the profile. The lemon green and pink stars on profile KK′ represent the Ms 5.3 Gongixan and Ms 5.7 Xingwen earthquakes, respectively. See Figure 1B for profile directions.
5 Discussions
Several upper crustal-scale earthquake relocation and tomographic studies, which utilized P- and S-wave phase arrival data have been executed for Sichuan Basin (Chen et al., 2017; Improta et al., 2017; Chen et al., 2018; Wang and Kao, 2019; Long et al., 2020; Tan et al., 2020; Zhang et al., 2020; Zuo et al., 2020). These analyses were carried out with distinct data sets, different methods and varying model resolutions. The high-resolution crustal velocity structure obtained from this study with good model resolution up to 16 km depth, revealed accurate velocity characteristics of the structural controls on induced seismicity within the southern Sichuan Basin. The results show low Vp and Vs expressions beneath the mini basinal and synclinal areas up to 1 km depth (Figure 9), which are believed to be composed of younger sedimentary rocks (Figure 1C). These mini basinal areas include the Xiangling, Fujiang, Luochang and Jianwu synclines (Figure 1C). In contrast, higher Vp and Vs expressions are revealed beneath the Changning-Shuanghe anticline system and Yuhe anticline up to 1 km depth, as a result of the older more consolidated rocks elevated to this level by compression. To our understanding, this is the first study that incorporates additional catalog arrival data from local stations with very short epicentral distances (4–40 km) to the Changning Ms6.0 main shock and aftershocks compared to previous studies, to obtain high resolution velocity structure beneath the southern Sichuan basin and accurately relocate the highly destructive Ms6.0 Changning earthquake, associated aftershocks and general seismicity beneath the studied region. The estimation of in situ Vp/Vs ratios using the Wadati diagram (Wadati, 1933) and the method by Lin and Shearer (2007) that is based on differential times of cross-correlated waveforms, yielded low and high Vp/Vs ratios for selected clusters within the salt mining field on the Changning-Shuanghe anticline system (Supplementary Figure S9) and the shale gas field on the Jianwu syncline (Supplementary Figure S10), respectively, which correlate with the Vp/Vs expressions resolved by seismic tomography, thereby validate our inverted velocity models and relocated earthquakes.
Compared to velocity models of Zuo et al. (2020), overall, our Vp and Vs models are relatively lower above ∼5 km depth and higher below ∼5 km depth (Supplementary Figure S10, 11). This is mainly because the two studies use different initial velocity models (Figure 4B). For the same regional dataset, the RMS travel time residual for the initial 1-D models used in Zuo et al. (2020) is 0.7391 s, while it is 0.3297 s for the initial 1-D models used in this study. This indicates that the 1-D initial models used in this study are more appropriate for the area in the absence of reliable 3-D model, which is preferable, given its robustness.
Next, we interpret the resultant velocity models and discuss the characteristic connection between structural deformations, relocated seismicity and prolonged fluid injection beneath the southern Sichuan Basin. Our principal conclusions are described in detail based on geologic, tomographic, outcrop, induced seismicity and reflection seismic observations.
5.1 Earthquake locations for large induced earthquakes in southwestern Sichuan basin
Due to the usage of local stations, our study yielded enhanced earthquake relocation results. The Changning Ms6.0 earthquake was relocated at hypocenter of 1.6 km, with aftershocks of moderate to major magnitudes that span 1.7 km–9.1 km (Figure 10). The focal depth of this main shock is obviously shallower than the corresponding centroid depth of 3 km computed by Yi et al. (2019) using the cut-and-paste method. The hypocenter estimated from TomoDDMC represents the rupture initiation point using P- and S-wave first arrivals, while the centroid depth represents the average depth of the rupture area of the earthquake. Therefore, a hypocenter relocated at 1.6 km for the Changning main shock is consistent with deeper centroid depth. Display of the relocated epicenters of the Changning Ms6.0 earthquake and associated Ms>5.0 aftershock sequence on the Changning geologic map (Figure 1C) reveals alignment with some previously interpreted faults, thereby suggesting that the sequence ruptured several faults in an interchanging style following the mainshock. Previous InSAR inversions show that the Changning Ms6.0 mainshock initiated at depth shallower than 3 km, with the sequence rupturing a single seismogenic fault in the SE-NW direction (Wang S. et al., 2020), which is extremely improbable, given that several faults segment the Changning anticline (Liu et al., 2021). However, our interpretation of geometry comprising of multiple faults is further supported by the postulation of rupture geometry involving a previously mapped major fault and slip on a shallow blind fault for the Changning mainshock by Yang et al. (2020).
Similarly, the obtained centroid depths of 3 km and 1.8 km for the Xingwen Ms5.7 and Gongxian Ms5.3 respectively, using the generalized cut-and-paste method (Lei et al., 2019b), validates the corresponding deeper hypocenters of 5.6 km and 5.9 km from this study, respectively (Figure 11A). Likewise, our results are consistent with the 1.0 km and 1.6 km centroid depths obtained from InSAR inversions by Wang et al. (2022). In order to further validate our earthquake relocation results, we compared the arrival times predicted by our velocity model with the picked arrival times on individual waveforms, and great matching is observed (Supplementary Figure S11).
5.2 Structural velocity relationship with relocated seismicity in Changning salt mining zone
From the depth slices and vertical cross-sections of Vp, Vs and Vp/Vs images, our results show that the Changning Ms6.0 main shock occurred at the transitional area from low-Vs region to high-Vs region that is characterized by moderately high Vp/Vs expression (Figure 10). The depth slice at 1 km through our velocity model remarkably outlines two zones marked by low Vs that corresponds to high Vp/Vs expression and high Vs that corresponds to low Vp/Vs expression, which correlate with the Yutan anticline and the Changning-Shuanghe anticline respectively. The characteristic high Vp/Vs expression beneath the Yutan anticline at this level could be due to considerably lowered Vs, possibly resulting from accumulation of severe water loss resulting from long term injection of fluids by salt mining operation in the region. In addition, given that the Yutan and the Changning-Shuanghe anticlines dip towards the northwest, it is highly likely for injected fluids to migrate to the northwestern Yutan anticline, thus significantly lowering Vs. On the other hand, the high Vs expression beneath the Changning-Shuanghe anticline that corresponds to low Vp/Vs expression is believed to be representative of the highly brittle Cambrian to Ordovician aged formations beneath the regions, which have not been influenced by injected fluids due to segmentation by northeast-southwest trending Changning faults and northwestern fluid migration. Our result is partly consistent with the preceding research by Zuo et al. (2020), which found that the Changning Ms6.0 earthquake is situated at the edge of a high velocity expression (see Supplementary Figures S10, S11 for the differences), and agrees with extreme water loss reported to be associated with decades long dissolution salt mining in the region (Ruan et al., 2008; Sun et al., 2017; Lei et al., 2019b; Yi et al., 2019; Liu and Zahradnik, 2020). Similarly, while studying the significance of tomographic edge zones for large earthquakes in Taiwan, Wang and Kao (2019) reached the conclusion that major earthquakes are located within the transition zone from high Vp/Vs to low Vp/Vs expression. Likewise, the Changning M>5 aftershocks are also located within structural velocity area that is analogous to the Changning Ms6.0 main shock (Figure 10). Generally, seismicity beneath the Changning-Shuanghe anticlinal system in the Changning salt mining region is associated with zones of relatively high Vp and high Vs expressions that mainly correspond to a dipping significantly low Vp/Vs area (Figure 10). The high Vs and low Vp/Vs expressions correspond to zones that are predominantly composed of highly fractured brittle Cambrian to Ordovician aged formations, which can more easily accumulate stresses and thus favor induced seismicity (Lei et al., 2020). This scenario is similar to the tomography study in the San Jacinto fault zone of southern California, where seismicity is clearly associated with low Vp/Vs expressions (Fang et al., 2019). This dipping low Vp/Vs area determined from TomoDDMC is further corroborated by estimated Vp/Vs value of 1.62 from Wadati diagram and in-situ Vp/Vs value of 1.62 estimated by the method of Lin and Shearer (2007) using the clustered events located in the low Vp/Vs area (Supplementary Figure S9).
In addition, our results show a high Vp/Vs area that correlates with moderately high Vp and low Vs zones that extends up to ∼4 km depth (see depth slices at 1–4 km in Supplementary Figures S6–S8 and Figure 9, as well as cross-sections in Figure 10A), and is relatively centralized on profile AA′, but occurs to the northeastern part of the profiles taken perpendicular to AA’ (Figure 10). This zone suggests possible evidence of formations that have been influenced by migrated fresh water resulting from severe water loss due to extensive prolonged injection through several deep wells, within 2.7–3 km interval for salt mining (Lei et al., 2020). Thurber et al. (1995) and Chiarabba and Amato (2003) postulated that shear forces diminish abruptly towards the uppermost end of a fault that terminates within a zone characterized by significant Vp/Vs increase, resulting in upward cut-off of rupture. Similarly, Doi et al. (2013) concluded that an environment characterized by low Vs and relatively high Vp/Vs would significantly inhibit the progress of earthquake ruptures. Figure 10A shows low Vp/Vs expression to the southeast of the Changning main shock and high Vp/Vs zone to the northwest of the main shock that extends from roughly 10 km–25 km along profile AA’. The northwestern high Vp/Vs zone correlates with zones of co-seismic InSAR observations and slip models documented by Wang S. et al. (2020), which found that the Changning Ms6.0 main shock resulted in major deformations from surface to ∼3 km depth. Similarly, zones of co-seismic surface deformations of the Changning Ms6.0 main shock determined from field mapping by Jiang et al. (2020), correspond to the edges of the northwesterly high Vp/Vs expression. Figure 1B shows location of the areas that experienced co-seismic surface deformations after Jiang et al. (2020), which are also projected on the Vp/Vs values at 1 km depth slice and are associated with edges of high Vp/Vs expressions, directly above the mainshock and the Ms5.4 aftershock. We observe that this very high Vp/Vs zone that extends up to about 11 km in the northwestern direction is mostly without co-seismic surface deformations, except at its edges directly above the mainshock and the Ms5.4 aftershock, where a few closely spaced co-seismic surface deformations occur (Blue circles in Figure 1B and Vp/Vs at Z=1 km in Figure 9). Considering the clear correlation between the high Vp/Vs expression associated with the Changning Ms6.0 mainshock (This study) and the distribution of co-seismic surface deformations of the Changning Ms6.0 earthquake (Jiang et al., 2020; Wang S. et al., 2020), we infer the rupture associated with the Changning Ms6.0 earthquake to be mostly confined within the low Vp/Vs zone dipping in the northwest direction, which coincides with the northwestward rupture direction determined by Li et al. (2020), with the exception of the zones directly above the mainshock and the Ms5.4 aftershock that are characterized by major faults. The shallow hypocenter of the Changning main shock, associated slip and presence of these major faults are believed to have contributed to the localization of co-seismic surface deformations only in these two zones. Therefore, we posit that the high Vp/Vs zone predominantly acts as an effective upward terminator of rupture, thereby yielding no co-seismic surface deformations, except for regions characterized by seismically active faults.
5.3 Structural velocity relationship with relocated seismicity in Xingwen shale gas block
Within the Changning shale gas block, high-resolution velocity models and seismic relocations reveal the characteristic connections between small seismic events and variations in velocity structure. In general, the relocated earthquakes are profoundly distributed into various clusters, many of which are linear in nature (Figure 11). In general, the seismic events occur as lineaments with high dip angles that substantially agree with the high angle fractures and faults previously interpreted in the region. However, several lineaments of the relocated earthquakes show varying strikes, in comparison with the prior interpreted faults. Therefore, we suggest them to be sub-seismic faults or fractures.
In Figure 11, most small seismic events appear to be situated in low Vs zones and are associated with relatively high Vp/Vs expressions in the central part of the Xingwen shale gas block around latitude 28.1° and longitude 104.9o, likely indicating that they are induced by the high fluid pressures caused by fluid injections for hydraulic fracturing within the zones (Figure 9 and Supplementary Figure S8). From in-situ Vp/Vs estimation by the method of Lin and Shearer (2007), high Vp/Vs zone imaged from TomoDDMC also shows relatively higher Vp/Vs (Supplementary Figure S8), supporting the association of seismicity and high Vp/Vs expressions, thereby strengthening the interpretation of these earthquakes as fluid induced. However, we notice that some events are located in relatively low Vp/Vs areas around this high Vp/Vs zone (Figure 9 and Supplementary Figure S8), For example, in the zone around latitude 28.15° and longitude 105.0°, the seismicity is associated with relatively low Vp/Vs values, similar to the results over a small area covering two hydraulic fracturing well pads in Tan et al. (2020). It is also noticed that the Ms5.3 Gongixan and Ms5.7 Xingwen earthquakes are associated with relatively low Vp/Vs expressions (Figure 11). This suggests that low Vp/Vs areas in the depths around 5 km represent zones that could act as asperities for moderately strong earthquakes induced by hydraulic fracturing.
Similarly, Chen et al. (2017), Chen et al. (2018) and Zuo et al. (2020) suggested that the existence of fluid-filled fractures could yield low velocity expressions around hydraulic fracturing zones. Our results largely agree with previous Vp and Vs models obtained by Long et al. (2020), as well as those of Zuo et al. (2020), but with some notable differences. For example, in contrast to the velocity models by Long et al. (2020), Zhang et al. (2020) and Zuo et al. (2020), the shallow subsurface (up to ∼4 km depth) in our model is evidently characterized by low Vp and Vs expressions that correlate with low velocity sedimentary strata within this zone. In addition, inverted 3D subsurface magnetic susceptibility model by Wang J. et al. (2020) found evidence of intrusion of the Neoproterozoic basement rock only at about 15 km depth, not at shallow regions as imaged in Long et al. (2020), Zhang et al. (2020) and Zuo et al. (2020).
5.4 Inferred subsurface structural architecture and Sichuan basement characterization
We carried out field work that focused on characterization of the fracture and fault systems in sedimentary outcrops of the Mesozoic to Cenozoic aged formations within the southern part of the studied region (see the red squares in Figure 1B for location of outcrops). The exposures reveal numerous high angle fracture networks, many of which exhibit brittle shear features (Figure 12). These brittle shear indicators are prevalent in shear zones characterized by intense rotational tectonic deformation, such as the Sichuan basin (Wang et al., 2016; Lei et al., 2020), which includes our study area. Analysis of the fractures showed thrust and oblique reverse faults to be predominant with a few oblique normal faults that have slight displacements of 2–21 cm.
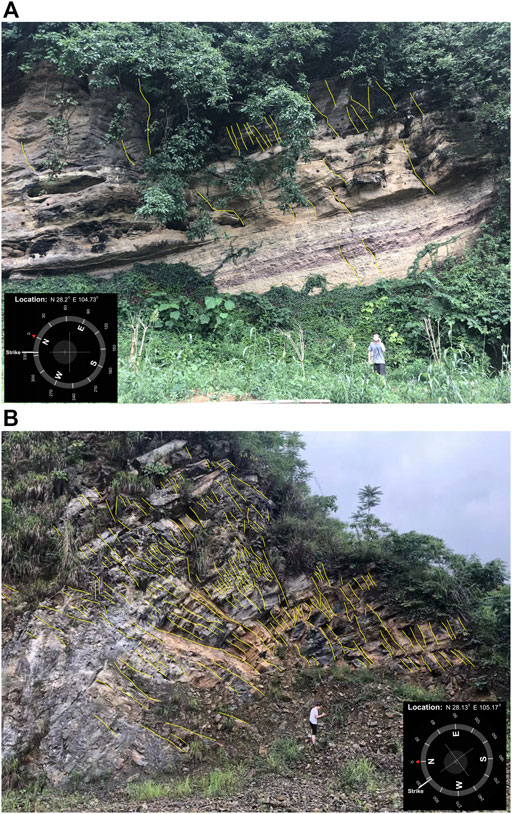
FIGURE 12. Mesozoic to Cenozoic sedimentary outcrops within the Xingwen shale gas region with numerous high-angle fractures of dips that are predominantly >40o, interpreted to be surface equivalents of the deeper well developed thrust and oblique fault zones. (A) Outcrop location 1. (B) Outcrop location 2.
Even though majority of the fractures are broadly distributed, we discovered various distinct zones of severe deformation with numerous cramped fractures. However, both damage zones predominantly exhibit conjugate shear fracture sets, orderly increment of fracture frequency as the center is approached, dense arrangement of several parallel and bifurcating fractures with miniature local gouges, mineralized fractures and hierarchical fracturing with reverse slip components (Figure 12). Therefore, we interpret these deformation zones as the outcrop equivalents of the deep-seated thrust, normal and strike-slip faults within the Sichuan sedimentary column, and thus posit that the Sinian Dengying Formation (target for salt mining) and Silurian Longmaxi Formation (target for shale gas exploitation), as well as the Tertiary formations (cap rocks) overlying them are highly fractured and faulted. Our interpretation stems from previous works that correlate subsurface faults with their analyzed outcrop counterparts (Segall and Pollard, 1983; Kolawole et al., 2019). It is evident from surface (outcrop) and subsurface characterizations of faults and fractures that fracture density and intensity of deformation are maximal at the center, but reduces away from the fracture or fault core (Barton and Zoback, 1992; Sagy et al., 2001).
Our newly obtained high-resolution earthquake locations and Vp, Vs and Vp/Vs models can also be used to characterize the subsurface fault and basement structures beneath the seismically active regions that cover a 4,900 km2 area, which includes the Changning salt mining and Xingwen shale gas zones. As mentioned, the high-resolution relocated earthquake epicenters are spatially distributed as clusters that form numerous obvious lineaments, some of which align with previously interpreted fault traces. Similar lineament features that no doubt align with some faults interpreted on reflection seismic profile are displayed by the jointly inverted hypocenters (Figures 13A,B). Therefore, interpretation of these lineaments as traces of seismically active faults is reasonable (e.g., Kolawole et al., 2019). This interpretation is further buttressed by the trivial spatial and temporal location uncertainties determined for the 2018 to 2019 seismic events and also for the 2015 to 2017 events, which represent the majority of the down-to-basement lineament clusters. On that note, we interpret the unaligned lineaments as sub-seismic fault traces that are newly illuminated by our relocated hypocenters.
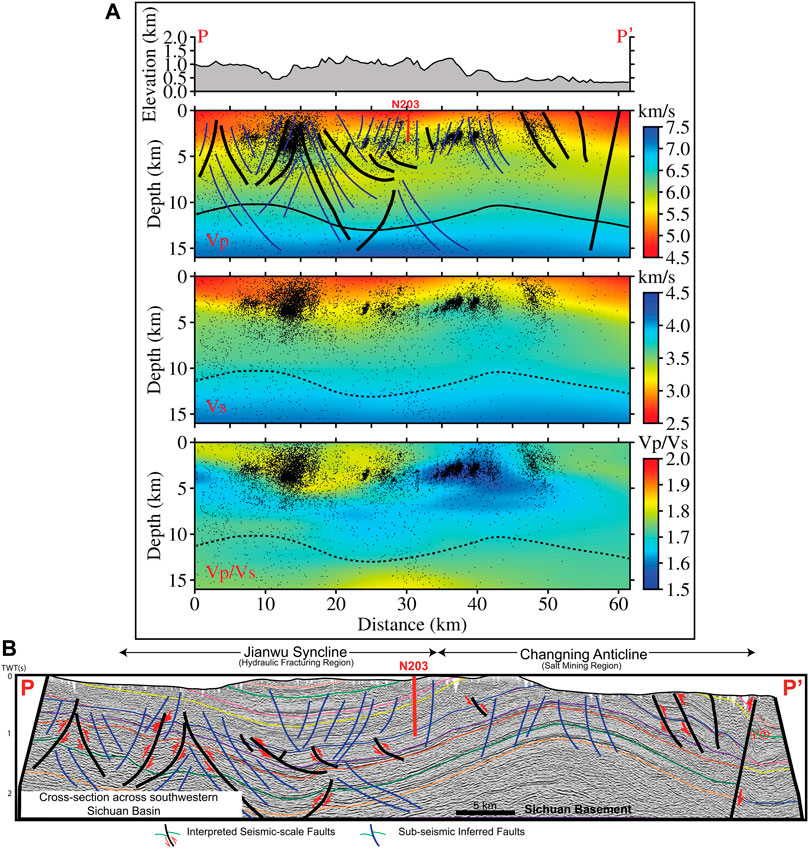
FIGURE 13. Characterization of Sichuan Basement and subsurface fault structures. (A) Cross-section of Vp, Vs and Vp/Vs models along PP′ profile showing basement structure with 6.5 km/s Vp contour. Black dots are horizontal projections of seismic events within 2.5 km on both sides of the profile. (B) Seismic interpretation of reflection seismic profile alone PP′, modified from He et al. (2019). Thick black lines represent interpreted seismic faults, while blue thin lines represent inferred sub-seismic faults illuminated by the earthquake lineaments.
Given the growing induced seismicity beneath the Sichuan Basin, and knowing that slip on basement penetrating faults potentially result in large magnitude earthquakes (Lu et al., 2021), delineation of the basement architecture is of utmost importance. In this study, we estimate the top of the Sichuan basement with the 6.5 km/s P-wave velocity contour (Figure 13A), which was inferred from integrated 3D reflection seismic and well data assisted velocity model by Wang et al. (2016). We went further to extract the depth values of the 6.5 km/s Vp contour along the grid lines and performed enhanced contouring on them to generate the depth structure map of top of basement rocks beneath the southwestern Sichuan Basin (Figure 14). The basement structural map shows superb agreement with existing large scale geologic features in the basin, such as the Changning-Shuanghe anticlinal system, Jianwu syncline, Xiangling syncline, Tenglong anticline, Luochang syncline and Yuhe-Junlian anticlinal system (Figure 1), which are respectively underlain by high, low, low, high, low and high basement morphologies (Figure 14). Overall, the crystalline basement shows P-wave speeds between 6.5 and 7.3 km/s and an undulating top structure with depths ranging from 10.2 km in the shallow parts to 13 km in the deeper zones. It can be clearly seen that the earthquakes have been induced within the basement and along some basement faults, most of which are concentrated in the Yuhe-Junlian anticlinal system (Figure 14). The deep basement characterization presented here corresponds to the sedimentary foredeeps of the western Longmenshan thrust belt that are composed of Late Triassic to Cretaceous terrigeneous clastics (Wang et al., 2016), and are consistent with their result of top of basement structure depth ranging from 9 to 12 km within southwestern Sichuan basin. Our results are likewise supported by the 3D subsurface magnetic susceptibility model by Wang J. et al. (2020), which found that the southwestern Sichuan Basin is covered by 10–14 km thick non-magnetic sedimentary rocks of Neoproterozoic to Cenozoic period that overly the magnetic pre-Sinian (early Neoproterozoic) Sichuan basement, and are relatively in agreement with the 8 km and 10 km top of basement depth derived from the velocity structure inverted from receiver function of seismic stations ROC and PAL respectively, situated between 100 and 120 km northeast of our study area near Chongqing in the Sichuan basin (Wang et al., 2012). Superimposition of the structural morphology of the top of the basement on the corresponding Vs and Vp/Vs models along profile PP’ reveal obvious high Vs and relatively high Vp/Vs characteristics of the Sichuan basement in this region. The enhanced characterization of the Vp, Vs, Vp/Vs and depth structure of the Sichuan basement presented in this study is new for earthquake tomographic studies in the region at remarkably high-resolution of 5 by 5 km in longitude and latitude directions, and we posit that dense seismicity data significantly contributes to improved imaging resolution in earthquake tomography.
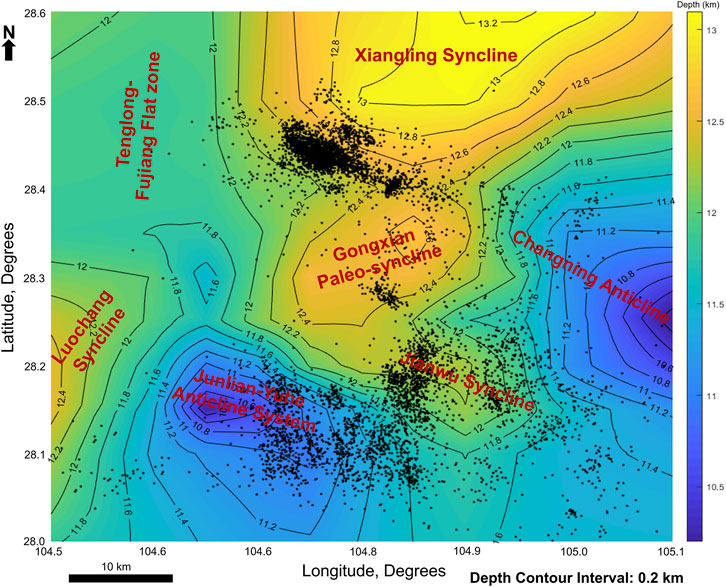
FIGURE 14. Depth structure map of top of basement rocks beneath our study area showing induced seismicity associated with the basement, as well as structural high and low areas that significantly agree with local geology.
6 Conclusion
In this study we present new high-resolution induced seismicity relocations, Vp, Vs and Vp/Vs structures of the upper crust down to 16 km beneath the southern Sichuan basin, using the Vp/Vs consistency-constrained double difference seismic tomography method and extensive high-quality combined phase data of 36,314 earthquakes from our local array and the regional array. These data sets were used to unravel the structural velocity control on induced seismicity beneath the Changning salt mining and Xingwen shale gas regions in the basin. The Changning Ms6.0 main shock and the Changning Ms5.3 aftershock are relocated within the shallow subsurface, above the target Dengying Formation (salt rock), at the transitional area from low-velocity to high-velocity structure that is characterized by moderately high Vp/Vs expression, while the other three major aftershocks of Ms5.1, Ms5.4 and Ms5.6 that likewise occurred on the Changning-Shuanghe anticlinal system are characterized by low Vp/Vs expressions. Generally, seismicity beneath the Changning-Shuanghe anticlinal system in the Changning salt mining region is associated with zones of relatively high Vp and Vs expressions that mainly correspond to an inclined significantly low Vp/Vs area. Within the Xingwen shale gas exploitation area, the Xingwen Ms5.7 main shock and Gongxian Ms5.3 main shock are located around low Vp/Vs expressions, indicating that moderately strong earthquakes in this region could be structurally controlled. For most of the small earthquakes in the Xingwen shale gas block, they are associated with relatively high Vp/Vs expressions, which may indicate regions where seismicity is induced by excess pore fluid pressure due to hydraulic fracturing. In general, the relocated earthquakes are profoundly distributed into various lineaments with dips and strike directions that partly align with previously interpreted faults, suggesting illumination of previously unrecognized pre-existing and potentially sub-seismic faults.
Our results also reveal a crystalline basement complex at the bottom of sedimentary strata, which shows P-wave speeds between 6.5 and 7.3 km/s and has an undulating top structure that conforms with local geology and ranges from 10.2 km in the shallow parts to 13 km in the deeper zones (Figure 14). Detailed structural architecture of the early Neoproterozoic (pre-Sinian) Sichuan basement beneath the Sichuan basin has not been previously resolved by earthquake tomographic studies. A noteworthy observation from this integrated structural evaluation is the clear characterization of down-to-basement lineaments, which are reasonably interpreted as reactivated fault traces beneath the Xingwen hydraulic fracturing area (Figures 10, 11, 13). This serves as a direct indication of the linkage between the Silurian shale, which is the target formation for hydraulic fracturing for shale gas production, and the basal Sichuan basement structures. Where such fluid migration pathways exist, they can promote seismicity generation by prolonged fluid injection. Therefore, we speculate that the Sichuan basement could be susceptible to extensive earthquake occurrence resulting from the reactivation of pre-existing and potentially sub-seismic basement faults and/or fractures.
Data availability statement
The datasets presented in this article are not readily available because we do not have the right to release the waveform data from the regional stations, which have to go through the China Earthquake Administration (CEA) authority. Requests to access the passive seismic data from our local stations should be directed to the corresponding author. TomoDD has been released by the authors through workshops and will soon be available through a repository. The event locations and velocity models from this study can be accessed via https://zenodo.org/record/7312205.
Author contributions
Conceptualization: UA and HZ Methods: UA, HZ, YT, and JQ Interpretation: All Authors Writing: UA and HZ Supervision: HZ.
Funding
This research is supported by National Natural Science Foundation of China under grants U1839205 and 41961134001.
Acknowledgments
We acknowledge the intellectual and material contributions of CAS-TWAS President’s Fellowship. We are grateful for the comments from the Editor LL and the two reviewers XL and GR that helped to improve the paper. We thank Shaobo Yang, Sheng Dong, Shoucheng Han, Bingwen Wang and Yuqi Huang for their technical support.
Conflict of interest
The authors declare that the research was conducted in the absence of any commercial or financial relationships that could be construed as a potential conflict of interest.
The handling editor LL declared a past co-authorship with the author YT.
Publisher’s note
All claims expressed in this article are solely those of the authors and do not necessarily represent those of their affiliated organizations, or those of the publisher, the editors and the reviewers. Any product that may be evaluated in this article, or claim that may be made by its manufacturer, is not guaranteed or endorsed by the publisher.
Supplementary material
The Supplementary Material for this article can be found online at: https://www.frontiersin.org/articles/10.3389/feart.2022.1082122/full#supplementary-material
References
Atkinson, G. M., Eaton, D. W., Ghofrani, H., Walker, D., Cheadle, B., Schultz, R., et al. (2016). Hydraulic fracturing and seismicity in the western Canada sedimentary basin. Seismol. Res. Lett. 87, 631–647. doi:10.1785/0220150263
Barton, C. A., and Zoback, M. D. (1992). Self-similar distribution and properties of macroscopic fractures at depth in crystalline rock in the Cajon Pass scientific drill hole. J. Geophys. Res. 97, 5181–5200. doi:10.1029/91jb01674
Burchfiel, B. C., Chen, Z. L., Liu, Z. P., and Royden, L. H. (1995). Tectonics of the Longmen Shan and adjacent regions, central China. Int. Geol. Rev. 37, 661–735. doi:10.1080/00206819509465424
Chen, S. F., and Wilson, C. J. L. (1996). Emplacement of the longmen Shan thrust-nappe belt along the eastern margin of the Tibetan plateau. J. Struct. Geol. 18, 413–419. doi:10.1016/0191-8141(95)00096-8
Chen, Y., Zhang, H., Miao, Y., Zhang, Y., and Liu, Q. (2017). Back azimuth constrained double-difference seismic location and tomography for downhole microseismic monitoring. Phys. Earth Planet. Inter. 264, 35–46. doi:10.1016/j.pepi.2016.10.003
Chen, H., Meng, X., Niu, F., Tang, Y., Yin, C., and Wu, F. (2018). Microseismic monitoring of stimulating shale gas reservoir in SW China: 2. Spatial clustering controlled by the preexisting faults and fractures. J. Geophys. Res. Solid Earth 123, 1659–1672. doi:10.1002/2017JB014491
Chiarabba, C., and Amato, A. (2003). VP and VP/VS images 391 in the MW 6.0 colfiorito fault region (central Italy): A contribution to the understanding of seismotectonic and seismogenic processes. J. Geophys. Res. 108. doi:10.1029/2001JB001665
Deng, Q., Zhang, P., Ran, Y., Yang, X., Min, W., and Chu, Q. (2003). Basic characteristics of active tectonics of China. Sci. China, Ser. D. Earth Sci. 46 (4), 356–372.
Deng, B., Liu, S. G., Jansa, L., Cheng, Y., Li, Z. W., Liu, S., et al. (2012). Sedimentary record of late triassic transpressional tectonics of the longmenshan thrust belt, SW China. J. Asian Earth Sci. 48, 43–55. doi:10.1016/j.jseaes.2011.12.019
Deng, B., Liu, S. G., Jiang, L., Zhao, G. P., Huang, R., Li, Z. W., et al. (2018). Tectonic uplift of the Xichang Basin (SE Tibetan Plateau) revealed by structural geology and thermochronology data. Basin Res. 30, 75–96. doi:10.1111/bre.12243
Doi, I., Noda, S., Iio, Y., Horiuchi, S., and Sekiguchi, S. (2013). Relationship between hypocentral distributions and VP/VS ratio structures inferred from dense seismic array data: a case study of the 1984 Western nagano prefecture earthquake, central Japan. Geophys. J. Int. 195, 1323–1336. doi:10.1093/gji/ggt312
Dong, Y. P., Zhang, G. W., Neubauer, F., Liu, X. M., Genser, J., and Hauzenberger, C. (2011). Tectonic evolution of the Qinling orogen, China: Review and synthesis. J. Asian Earth Sci. 41, 213–237. doi:10.1016/j.jseaes.2011.03.002
Eberhart-Phillips, D. (1986). Three-dimensional velocity structure in northern California Coast Ranges from inversion of local earthquake arrival times. Bull. Seismol. Soc. Am. 76 (4), 1025–1052.
Eberhart-Phillips, D. (1990). Three-dimensional P and S velocity structure in the Coalinga region, California. J. Geophys. Res. 95 (B10), 15343–15363. doi:10.1029/jb095ib10p15343
Efron, B., and Gong, G. (1983). A leisurely look at the bootstrap, the jackknife, and cross-validation. Am. Stat. 37 (1), 36–48. doi:10.2307/2685844
Efron, B., and Tibshirani, R. (1991). Statistical data analysis in the computer age. Science 253, 390–395. doi:10.1126/science.253.5018.390
Ellsworth, W. L. (2013). Injection-induced earthquakes. Science 341, 1225942–1226017. doi:10.1126/science.1225942
Fang, H., Yao, H., Zhang, H., Thurber, C., Ben-Zion, Y., and van der Hilst, R. D. (2019). Vp/Vs tomography in the southern California plate boundary region using body- and surface-wave traveltime data. Geophys. J. Int. 216, 609–620. doi:10.1093/gji/ggy458
Guo, H., and Zhang, H. (2017). Development of double-pair double difference earthquake location algorithm for improving earthquake locations. Geophys. J. Int. 208, 333–348. doi:10.1093/gji/ggw397
Guo, H., Zhang, H., and Froment, B. (2018). Structural control on earthquake behaviors revealed by high-resolution VP/VS imaging along the Gofar transform fault, East Pacific Rise. Earth Planet. Sci. Lett. 499, 243–255. doi:10.1016/j.epsl.2018.07.037
He, D., Lu, R., Huang, H., Wang, X., Jiang, H., and Zhang, W. (2019). Tectonic and geological setting of the earthquake hazards in the Changning shale gas development zone, Sichuan Basin, SW China. Pet. Explor. Dev. 46 (5), 1051–1064. doi:10.1016/S1876-3804(19)60262-4
Huang, H. H., Wu, Y. M., Song, X., Chang, C. H., Lee, S. J., Chang, T. M., et al. (2014). Joint Vp and vs tomography of taiwan: Implications for subduction-collision orogeny. Earth Planet. Sci. Lett. 392, 177–191. doi:10.1016/j.epsl.2014.02.026
Hubbard, J., and Shaw, J. H. (2009). Uplift of the longmen Shan and Tibetan plateau, and the 2008 wenchuan (M = 7.9) earthquake. Nature 458 (7235), 194–197. doi:10.1038/nature07837
Hubbard, J. A., Shaw, J. H., and Klinger, Y. (2010). Structural setting of the 2008 Mw 7.9 Wenchuan, China, earthquake. Bull. Seismol. Soc. Am. 100 (5B), 2713–2735. doi:10.1785/0120090341
Humphreys, E., and Clayton, R. W. (1988). Adaptation of back projection tomography to seismic travel time problems. J. Geophys. Res. 93 (B2), 1073–1085. doi:10.1029/jb093ib02p01073
Improta, L., Bagh, S., De Gori, P., Valoroso, L., Pastori, M., Piccinini, D., et al. (2017). Reservoir structure and wastewater-induced seismicity at the Val d’Agri oilfield (Italy) shown by three-dimensional VP and VP/VS local earthquake tomography. J. Geophys. Res. Solid Earth 122 (11), 9050–9082. doi:10.1002/2017jb014725
Jia, D., Wei, G., Chen, Z., Li, B., Zeng, Q., and Yang, G. (2006). Longmen Shan fold-thrust belt and its relation to the Western Sichuan Basin in central China: New insights from hydrocarbon exploration. Am. Assoc. Pet. Geol. Bull. 90 (9), 1425–1447. doi:10.1306/03230605076
Jiang, D., Zhang, S., and Ding, R. (2020). Surface deformation and tectonic background of the 2019 Ms 6.0 Changning earthquake, Sichuan Basin, SW China. J. Asian Earth Sci. 200, 104493–104517. doi:10.1016/j.jseaes.2020.104493
Kirby, E., Reiners, P. W., Krol, M. A., Whipple, K. X., Hodges, K. V., Farley, K. A., et al. (2002). Late Cenozoic evolution of the eastern margin of the Tibetan Plateau: Inferences from 40 Ar/39 Ar and (U-Th)/He thermochronology. Tectonics 21 (1), 1-1–1-20. doi:10.1029/2000TC001246
Kolawole, F., Johnston, C. S., Morgan, C. B., Chang, J. C., Marfurt, K. J., Lockner, D. A., et al. (2019). The susceptibility of Oklahoma’s basement to seismic reactivation. Nat. Geosci. 12 (10), 839–844. doi:10.1038/s41561-019-0440-5
Lei, X., Yu, G., Ma, S., Wen, X., and Wang, Q. (2008). Earthquakes induced by water injection at ∼ 3 km depth within the Rongchang gas field, Chongqing, China. J. Geophys. Res. 113, B10310–B10312. doi:10.1029/2008jb005604
Lei, X., Ma, S., Chen, W., Pang, C., Zeng, J., and Jiang, B. (2013). A detailed view of the injection-induced seismicity in a natural gas reservoir in Zigong, southwestern Sichuan Basin, China. J. Geophys. Res. Solid Earth 118, 4296–4311. doi:10.1002/jgrb.50310
Lei, X., Huang, D., Su, J., Jiang, G., Wang, X., Wang, H., et al. (2017). Fault reactivation and earthquakes with magnitudes of up to Mw4.7 induced by shale-gas hydraulic fracturing in Sichuan Basin, China. Sci. Rep. 7, 7971. doi:10.1038/s41598-017-08557-y
Lei, X., Wang, Z., and Su, J. (2019a). Possible link between long-term and short-term water injections and earthquakes in salt mine and shale gas site in Changning, south Sichuan Basin, China. Earth Planet. Phys. 3 (6), 510–525. doi:10.26464/epp2019052
Lei, X., Wang, Z., and Su, J. (2019b). The December 2018 ML 5.7 and January 2019 ML 5.3 earthquakes in south Sichuan Basin induced by shale gas hydraulic fracturing. Seismol. Res. Lett. 90 (3), 1099–1110. doi:10.1785/0220190029
Lei, X., Su, J., and Wang, Z. (2020). Growing seismicity in the Sichuan Basin and its association with industrial activities. Sci. China Earth Sci. 63, 1633–1660. doi:10.1007/s11430-020-9646-x
Li, W. X., and Li, X. H. (2003). Adakitic granites within the NE jiangxi ophiolites, south China: geochemical and Nd isotopic evidence. Precambrian Res. 122, 29–44. doi:10.1016/s0301-9268(02)00206-1
Li, Y., Allen, P. A., Densmore, A. L., and Qiang, X. (2003). Evolution of the longmen Shan foreland basin (western sichuan, China) during the late triassic indosinian orogeny. Basin Res. 15, 117–138. doi:10.1046/j.1365-2117.2003.00197.x
Li, J., Xie, Z. Y., Dai, J. X., Zhang, S. C., Zhu, G. Y., and Liu, Z. L. (2005). Geochemistry and origin of sour gas accumulations in the northeastern Sichuan Basin, SW China. Org. Geochem. 36 (12), 1703–1716. doi:10.1016/j.orggeochem.2005.08.006
Li, W., Ni, S., Zang, C., and Chu, R. (2020). Rupture directivity of the 2019 Mw 5.8 changning, sichuan, China, earthquake and implication for induced seismicity. Bull. Seismol. Soc. Am. 110, 2138–2153. doi:10.1785/0120200013
Lin, G., and Shearer, P. M. (2007). Estimating local Vp/Vs ratios within similar earthquake clusters. Bull. Seismol. Soc. Am. 97, 379–388. doi:10.1785/0120060115
Liu, J., and Zahradník, J. (2020). The 2019 Mw 5.7 changning earthquake, Sichuan Basin, China: A shallow doublet with different faulting styles. Geophys. Res. Lett. 47. doi:10.1029/2019gl085408
Liu, S. F., Steel, R., and Zhang, G. W. (2005). Mesozoic sedimentary basin development and tectonic implication, northern Yangtze block, eastern China: Record of continent–continent collision. J. Asian Earth Sci. 25, 9–27. doi:10.1016/j.jseaes.2004.01.010
Liu, S. G., Deng, B., Li, Z. W., and Sun, W. (2012). Architecture of basin-mountain systems and their influences on gas distribution: A case study from the Sichuan basin, south China. J. Asian Earth Sci. 47, 204–215. doi:10.1016/j.jseaes.2011.10.012
Liu, S. G., Deng, B., Li, Z. W., Jansa, L., Liu, S., Wang, G. Z., et al. (2013). Geological evolution of the longmenshan intracontinental composite orogen and the eastern margin of the Tibetan plateau. J. Earth Sci. 24 (6), 874–890. doi:10.1007/s12583-013-0391-5
Liu, S. G., Deng, B., Jansa, L., Li, Z., Sun, W., Wang, G., et al. (2017). Multi-stage basin development and hydrocarbon accumulations: A review of the Sichuan Basin at eastern margin of the Tibetan plateau. J. Earth Sci. 29, 307–325. Available at: http://en.earth-science.net. doi:10.1007/s12583-017-0904-8
Liu, S. G., Yang, Y., Deng, B., Zhong, Y., Wen, L., Wei, S., et al. (2021). Tectonic evolution of the Sichuan Basin, southwest China. Earth. Sci. Rev. 213, 103470. doi:10.1016/j.earscirev.2020.103470
Long, F., Zhang, Z. W., Qi, Y. P., Liang, M. J., Ruan, X., Wu, W. W., et al. (2020). Three dimensional velocity structure and accurate earthquake location in Changning–Gongxian area of southeast Sichuan. Earth Planet. Phys. 4 (2), 1–15. doi:10.26464/epp2020022
Lu, R., He, D., Liu, J.-Z., Tao, W., Huang, H., Xu, F., et al. (2021). Seismogenic faults of the changning earthquake sequence constrained by high-resolution seismic profiles in the southwestern Sichuan Basin, China. Seismol. Res. Lett. 92, 3757–3766. doi:10.1785/0220200302
Meng, Q. R., and Zhang, G. W. (2000). Geologic framework and tectonic evolution of the Qinling orogen, central China. Tectonophysics 323, 183–196. doi:10.1016/s0040-1951(00)00106-2
Meng, L., McGarr, A., Zhou, L., and Zang, Y. (2019). An investigation of seismicity induced by hydraulic fracturing in the Sichuan Basin of China based on data from a temporary seismic network. Bull. Seismol. Soc. Am. 109 (1), 348–357. doi:10.1785/0120180310
Roger, F., Jolivet, M., and Malavieille, J. (2010). The tectonic evolution of the songpan-garze (north tibet) and adjacent areas from proterozoic to present: A synthesis. J. Asian Earth Sci. 39, 254–269. doi:10.1016/j.jseaes.2010.03.008
Royden, L. H., Burchfiel, B. C., and van der Hilst, R. D. (2008). The geological evolution of the Tibetan Plateau. Science 321, 1054–1058. doi:10.1126/science.1155371
Ruan, X., Cheng, W., Zhang, Y., Li, J., and Chen, Y. (2008). Research of the earthquakes induced by water injections in salt mines in Changning, Sichuan. Earthq. Res. China 24 (3), 226–234. doi:10.3969/j.issn.1001-4683.2008.03.004 (in Chinese).
Sagy, A., Reches, Z. E., and Roman, I. (2001). Dynamic fracturing: field and experimental observations. J. Struct. Geol. 23, 1223–1239. doi:10.1016/s0191-8141(00)00190-5
Segall, P., and Pollard, D. D. (1983). Nucleation and growth of strike slip faults in granite. J. Geophys. Res. 88, 555–568. doi:10.1029/jb088ib01p00555
Shi, X., Tong, Y., Liu, W., Zhao, C., Liu, J., and Fang, J. (2019). Analysis of seismic-scale fracture system of shale reservoir and its petroleum significance: a case study of well Ning 201 area of changning block, Sichuan Basin. Mar. Orig. Petrl. Geol. 24 (4), 87–96. doi:10.3969/j.issn.1672-9854.2019.04.009 (in Chinese with English abstract).
Sun, X. L., Yang, P. T., and Zhang, Z. W. (2017). A study of earthquakes induced by water injection in the Changning salt mine area, SW China. J. Asian Earth Sci. 136, 102–109. doi:10.1016/j.jseaes.2017.01.030
Tan, Y., Hu, J., Zhang, H., Chen, Y., Qian, J., Wang, Q., et al. (2020). Hydraulic fracturing induced seismicity in the southern Sichuan Basin due to fluid diffusion inferred from seismic and injection data analysis. Geophys. Res. Lett. 47 (4). doi:10.1029/2019GL084885
Thurber, C. H., Atre, S. R., and Eberhart-Phillips, D. (1995). Three-dimensional Vp and vp/vs structure at loma prieta, California, from local earthquake tomography. Geophys. Res. Lett. 22, 3079–3082. doi:10.1029/95gl03077
Tian, Y. T., Kohn, B. P., Qiu, N. S., Yuan, Y. S., Hu, S. B., Gleadow, A. J. W., et al. (2018). Eocene to miocene out-of-sequence deformation in the eastern Tibetan plateau: Insights from shortening structures in the Sichuan Basin. J. Geophys. Res. Solid Earth 123, 1840–1855. doi:10.1002/2017JB015049
Um, J., and Thurber, C. (1987). A fast algorithm for two-point seismic ray tracing. Bull. Seismol. Soc. Am. 77 (3), 972–986. doi:10.1785/bssa0770030972
Wang, Z., and Kao, H. (2019). The significance of tomographic edge zones for large earthquakes in Taiwan. J. Geophys. Res. Solid Earth 124 (11), 11822–11839. doi:10.1029/2019jb017875
Wang, X., Ma, S., Lei, X., Guo, X., Wang, Q., Yu, G., et al. (2012). Fine velocity structure and relocation of the 2010 ml5.1 earthquake sequence in the Rongchang gas field. Earthq. Res. China 20 (4), 467–478.
Wang, X., Ma, S., Guo, Z., Lei, X., Xia, Y., Guo, X., et al. (2013). S-wave velocity of the crust in Three Gorges Reservoir and the adjacent region inverted from seismic ambient noise tomography. Chin. J. Geophys. 56 (12), 1–11. doi:10.6038/cjg20131201 (In Chinese).
Wang, M., Hubbard, J., Plesch, A., Shaw, J. H., and Wang, L. (2016). Three-dimensional seismic velocity structure in the Sichuan basin, China. JGR. Solid Earth 121, 1007–1022. doi:10.1002/2015JB012644
Wang, S., Jiang, G., Lei, X., Barbour, A. J., Tan, X., Xu, C., et al. (2022). Three Mw ≥ 4.7 earthquakes within the Changning (China) shale gas field ruptured shallow faults intersecting with hydraulic fracturing wells. JGR. Solid Earth 127, e2021JB022946. doi:10.1029/2021JB022946
Wang, J., Yao, C., Li, Z., Zheng, Y., Shen, X., Zeren, Z., et al. (2020). 3D inversion of the Sichuan Basin magnetic anomaly in South China and its geological significance. Earth Planets Space 72, 40–10. doi:10.1186/s40623-020-01167-5
Wang, S., Jiang, G., Weingarten, M., and Niu, Y. (2020). InSAR evidence indicates a link between fluid injection for salt mining and the 2019 Changning (China) earthquake sequence. Geophys. Res. Lett. 46, e2020GL087603. doi:10.1029/2020GL087603
Wang, B. J. (1989). The sichuan hydrocarbon province. Volume 10 of petroleum geology of China. Beijing: Petroleum Industry Press, 516. (in Chinese).
Wilson, C. J. L., Harrowfield, M. J., and Reid, A. J. (2006). Brittle modification of triassic architecture in eastern tibet: implications for the construction of the cenozoic plateau. J. Asian Earth Sci. 27, 341–357. doi:10.1016/j.jseaes.2005.04.004
Yan, D. P., Zhou, M. F., Song, H. L., Wang, X. W., and Malpas, J. (2003). Origin and tectonic significance of a mesozoic multi-layer over-thrust system within the Yangtze block (south China). Tectonophysics 361, 239–254. doi:10.1016/s0040-1951(02)00646-7
Yan, D. P., Qiu, L., Wells, M. L., Zhou, M. F., Meng, X. K., Lu, S., et al. (2018). Structural and geochronological constraints on the early mesozoic north longmen Shan thrust belt: Foreland fold-thrust propagation of the SW qinling orogenic belt, northeastern Tibetan plateau. Tectonics 37, 4595–4624. doi:10.1029/2018TC004986
Yang, Y., Hu, J., Chen, Q., Lei, X., Zhao, J., Li, W., et al. (2020). Shallow slip of blind fault associated with the 2019 Ms 6.0 Changning earthquake in fold-and-thrust belt in salt mines of Southeast Sichuan, China. Geophys. J. Int. 224, 909–922. doi:10.1093/gji/ggaa488
Yi, G. X., Long, F., Liang, M. J., Zhao, M., Wang, S. W., Gong, Y., et al. (2019). Focal mechanism solutions and seismogenic structure of the 17 June 2019 MS6.0 Sichuan Changning earthquake sequence. Chin. J. Geophys. 62 (9), 3432–3447. doi:10.6038/cjg2019N0297 (in Chinese).
Zeng, X., Han, L., and Shi, Y. (2014). The april 24, 2013 changning ms 4.8 earthquake: A felt earthquake that occurred in paleozoic sediment. Earthq. Sci. 27 (1), 107–115. doi:10.1007/s11589-014-0062-3
Zhang, H., and Thurber, C. H. (2003). Double-difference tomography: The method and its application to the Hayward fault, California. Bull. Seismol. Soc. Am. 93 (5), 1875–1889. doi:10.1785/0120020190
Zhang, H., and Thurber, C. H. (2006). Development and applications of double-difference seismic tomography. Pure Appl. Geophys. 163, 373–403. doi:10.1007/s00024-005-0021-y
Zhang, H., Thurber, C. H., and Bedrosian, P. (2009). Joint inversion for Vp, vs, and vp/vs at SAFOD, parkfield, California. Geochem. Geophys. Geosyst. 10 (11). doi:10.1029/2009GC002709
Zhang, Z., Cheng, W., Liang, M., Wang, X., Long, F., Xu, Y., et al. (2012). Study on earthquakes induced by water injection in Zigong-Longchang area, Sichuan. Chin. J. Geophys. 55, 1635–1645. doi:10.6038/j.issn.0001-5733.2012.05.021
Zhang, B., Lei, J., and Zhang, G. (2020). Seismic evidence for influences of deep fluids on the 2019 Changning Ms 6.0 earthquake, Sichuan Basin, SW China. J. Asian Earth Sci. 200, 104492–104512. doi:10.1016/j.jseaes.2020.104492
Zhao, D., and Hasegawa, A. (1993). P wave tomographic imaging of the crust and up-per mantle beneath the Japan Islands. J. Geophys. Res. 98, 4333–4353. doi:10.1029/92jb02295
Zhao, Z., and Zhang, R. S. (1987). Primary study of crustal and upper mantle velocity structure of Sichuan province. Acta Seismol. Sin.9 (2), 154–166. (in Chinese).
Zhou, M. F., Yan, D. P., Kennedy, A. K., Li, Y. Q., and Ding, J. (2002). SHRIMP U-Pb zircon geochronological and geochemical evidence for Neoproterozoic arc-magmatism along the Western margin of the Yangtze block, South China. Earth Planet. Sci. Lett. 196, 51–67. doi:10.1016/s0012-821x(01)00595-7
Zhu, H., and He, C. (2014). Focal mechanism changning character of earthquake sequence induced by water injection: A case study of changning sequence, sichuan province. Earth Sci. J. China Univ. Geosci. 39 (12), 1776–1782. doi:10.3799/dqkx.2014.161
Keywords: induced-seismicity, trigger-mechanism, double-difference, seismic tomography, basement characterization, fluid injection
Citation: Anyiam UO, Zhang H, Tan Y, Qian J, Gao L, Liu Y, Zuo K and Zhao C (2023) Enhanced 3D velocity structure, seismicity relocation and basement characterization of Changning shale gas and salt mining regions in southern Sichuan basin. Front. Earth Sci. 10:1082122. doi: 10.3389/feart.2022.1082122
Received: 27 October 2022; Accepted: 14 November 2022;
Published: 19 January 2023.
Edited by:
Lei Li, Central South University, ChinaReviewed by:
Xinglin Lei, National Institute of Advanced Industrial Science and Technology (AIST), JapanGerman Rodriguez, University of Bristol, United Kingdom
Copyright © 2023 Anyiam, Zhang, Tan, Qian, Gao, Liu, Zuo and Zhao. This is an open-access article distributed under the terms of the Creative Commons Attribution License (CC BY). The use, distribution or reproduction in other forums is permitted, provided the original author(s) and the copyright owner(s) are credited and that the original publication in this journal is cited, in accordance with accepted academic practice. No use, distribution or reproduction is permitted which does not comply with these terms.
*Correspondence: Haijiang Zhang, emhhbmcxMUB1c3RjLmVkdS5jbg==; Yuyang Tan, dGFueXV5YW5nQG91Yy5lZHUuY24=