 Lulu Lei
 Sheng Jin1,2*†
 Hao Dong
 Gaofeng Ye
 Letian Zhang
- 1School of Geophysics and Information Technology, China University of Geosciences, Beijing, China
- 2Key Laboratory of Geo-detection of Ministry of Education, Beijing, China
The well-known N-S-trending fault in the Yangbajing area plays a crucial role in the tectonic evolution of the Tibetan Plateau. Previous researches on a few E-W geophysical profiles suggested that the eastern shear at the base of the upper crust and/or lithosphere deformation brought on by asthenosphere upwelling are the major causes of the Yadong-Gulu rift’s creation. Here we propose a 3-D electrical resistivity model derived from the magnetotelluric (MT) array data spanning the Yadong-Gulu rift (YGR), and the distribution of temperature and melt fraction is estimated by the experimental calibrated relationships bridging electrical conductivity and temperature/melt fraction. The result reveals that the Indian slab subducted steeply in the east of the Yadong-Gulu rift, while Indian slab may have delaminated with a flat subduction angle in the west. The temperature distribution shows that the upper mantle of the northern Lhasa terrane is hotter than that of the southern Lhasa terrane. This is likely the result of mantle upwelling caused by either the subduction of the Indian slab or thickened Tibetan lithosphere delamination. Moreover, the strength of the mid-lower crust is so low that it may meet the conditions of the local crust flow in the west-east direction. The local crustal flow and the pulling force from the upwelling asthenosphere jointly contributed to the formation of the Yadong-Gulu rift. These main factors exist in different stages of the evolution of the Yadong-Gulu rift.
1 Introduction
Since the collision of Indian and Eurasia about 50 Ma ago, at least 2,000 km of convergence has been accommodated by thickening the crust and elevating the Himalayan-Tibetan Plateau (Yin and Harrison, 2000). How the high topography and the thickened crust of the Tibetan Plateau formed has been explained by several geodynamic models. They usually include the lateral eastern extrusion of continental lithosphere along several plateau bounding strike-slip faults (Tapponnier et al., 2001), a thin viscous sheet where the Tibetan Plateau undergoes distributed shortening and crustal thickening (England and McKenzie, 1982) and ductile flow in the middle-lower crust, that decouples deformation between the upper crust and mantle lithosphere (Clark and Royden, 2000).
As the continent-continent collision, a variety of tectonically and seismically active faulting zones are formed in different regions of Tibetan Plateau, with NW-SE and NE-SW trending conjugate strike-slip faults in central Tibet and N-S normal faulting systems in southern Tibet (Pang et al., 2018), and these rifts always suggest generally east-west extension of the Tibet (Molnar and Tapponnier, 1978). However, the mechanism of these extensional structures is still unclear. According to previous studies, two main genetic models have been proposed. These include as follows: 1) model related to the gravity collapse after a maximum uplift and crustal thickening of the plateau or delamination of the lithospheric mantle (England and Houseman, 1989). 2) model related to the regional stress filed and boundary conditions, which consists of lateral extrusion model (Tapponnier et al., 1982), arc bending model (Klootwijk et al., 1985), radioactive spreading model (Murphy and Copeland, 2005), oblique convergence model (McCaffrey and Nabelek, 1998) and Pacific plate rotation model (Yin, 2000). The broad similarities in the history of volcanism, the age of rift initiation, and the trend and direction of extension of rifts in Tibet, Lake Baikal, and Shanxi were emphasized in the model of the Pacific plate rotation model (Yin, 2000). Furthermore, Yin (2000) proposed that as the Indian northward subducted, all of eastern Asian experienced mantle upwelling beginning at ∼40–35 Ma leading to thermal weakening of the lithosphere and eventual rift development at ∼8–4 Ma. The Ultrapotassic N-S trending dikes and adakitic intrusives usually accompany the W-E extension in southern Tibet implying a magma source in the lithosphere mantle that also triggered melting of an eclogitic lower crust (Hou et al., 2004). Despite the insights provided by previous studies, the mechanism of the formation and evolution of the N-S trending faults in the southern Tibet is complex and controversial, and it may be not controlled by merely one factor.
As one of the most famous rifts in the southern Tibet, the formation of the Yadong-Gulu rift (YGR) has been studied by seismic studies (e.g., Zhang et al., 2013; Tian et al., 2015; Liu et al., 2019) and magnetotelluric study (e.g., Wang et al., 2017). Evidenced by the observation of shear wave splitting, Zhang et al. (2013) suggests that the onset of the N-S normal faulting does not indicate the gravitational collapse of the Tibetan lithosphere, and the shear rifting in the YGR is attributed to an eastern shear at the base of the upper crust. However, Tian et al. (2015) proposed that the continued extension of the YGR is mainly due to lithospheric deformation in response to asthenospheric upwelling and far-field W-E extensional stress. Wang et al. (2017) and Liu et al. (2019) indicate that the underthrusting of the Indian plate may cause slab tearing of the Indian slab and the upwelling of the asthenosphere, which could also drive E-W extension of the crust and contribute to the formation of the YGR in southern Tibet. However, these results are mainly reported by some E-W profiles in some specific regions. To better understand the evolution mechanism of the YGR, we did a 3-D magnetotelluric study by using MT array data from Sinoprobe, deployed in the Yangbajing region. Compared with the previous work of 3-D electrical profile across the YGR, this work covers a wider range near the Yadong-Gulu rift, which may provide us with a more comprehensive view of the electrical structure of this area. Also, more widely distributed electrical structure indicates the essential role of the mid-lower crustal conductors in the N-S rifting. In addition, the adding of the long-period MT data provides more reliable constraints for deep electrical structure.
The thermal state of the upper mantle of the lithosphere can help us understand 1) the origin and evolution of the lithosphere. 2) Lithospheric structure changes such as tectonic shortening, rifting, and mantle convection. 3) Relationship between shallow characteristics and deep dynamic processes. 4) Location of important mineral deposits and so on. The lithospheric thermal state is mainly acquired by four geophysical ways. We can use gravity data, surface heat flow data (SHF) and elevation to obtain a temperature model that can fit the observed data within the error range (e.g., Kaban et al., 2010). However, this method ignores the influence of factors such as the compressibility coefficient, phase transformation of rocks, and heterogeneity of composition in the upper mantle, which may lead to some differences between the thermal structures obtained by other methods. Thermal state of the lithosphere can also be established based on seismic data (usually shear wave). This method is usually dependent on the empirical relationship between seismic wave velocity (usually shear wave) and petrological parameters (Priestley and McKenzie, 2006). Although this is a direct method to detect the mantle structure, the mantle structure information obtained from seismic data cannot clearly distinguish the influence of thermal structure and composition structure in the mantle and thus this method still has a certain degree of ambiguity (e.g. Schutt and Lesher, 2006). Since the electrical conductivity of solid aggregates is exponentially sensitive to temperature through an Arrhenius relationship, Magnetotellurics (MT) has the potential to provide constraints on the lithospheric thermal state. Recent studies have shown encouraging results towards linking conductivity, composition, water content, temperature and melt fraction (e.g. Sheng et al., 2020).
In this work, from the derived 3-D electrical structure, we estimated the lithospheric thermal structure. Thermal state in this region can help us have a knowledge of the strength of the lithosphere, so as to further understand the formation of YGR and the tectonic and magmatic activities.
2 Magnetotelluric data and analysis
2.1 Magnetotelluric data
The magnetotelluric (MT) data in this study are located in the longitude of 90°E to 93°E and the latitude of 29°N to 32°N (Figure 1), which are from the China Magnetotelluric Standard-Grid Network (SINOPROBE, Dong and Li, 2009) acquired by China University of Geosciences, Beijing (CUGB) from 2011 to 2013. There is a total of 119 MT data in the study area, including 107 broad-band MT data (BBMT) and 12 long-period MT data (LMT).

FIGURE 1. (A) Topographic map of study area showing location of broad-band MT stations (blue triangles) and long-period MT stations (white triangles). The green lines mark the locations of the electrical resistivity profiles. QT, Qiangtang terrane; NL, northern Lhasa; CL, central Lhasa; SL, southern Lhasa; TH, Tethys-Himalaya terrane; BNS, Banggong-Nujiang suture; YGR, Yadong-Gulu rift; RCR, Riduo-Cuona Rift; SNMZ, Shiquanhe-Yongzhu-Nam Tso Mélange Zone; LMF, Luobadui-Milashan fault; IYS, Indus-Yarlung Zangbo suture (B) The extent of our study area (white rectangle). (C) Location of the thermal heat flow points (purple circles), hot springs (red, yellow, blue, and green circles), porphyry Cu-Mo deposits.
tHigh-quality broadband MT (BBMT) data were collected by Phoenix MTU-5 instruments over a period range of approximately .003–3,000 s and High-quality Long-period MT (LMT) data were collected by LVIV Lemi-417 long-period MT (LMT) instruments over an optimized period range of approximately 10–15,000 s. The incoherent noise was removed by synchronously recording the orthogonal electric field (E) and magnetic field (H) of different sites with GPS based on the geomagnetic coordinates (so called remote reference), and the data quality was improved. Robust statistic methods (LMT: Egbert and Booker, 1986; BBMT; Egbert, 1997) were used to analyze and process the MT time series files and estimate the frequency-dependent transfer function. The BBMT and LMT data were merged into single responses for each station. The apparent resistivity and phase curves of representative MT sites in the study area are shown in Figure 2. Furthermore, because of the extremely low environmental and human noise in Tibet, almost all of the MT data are of good quality.
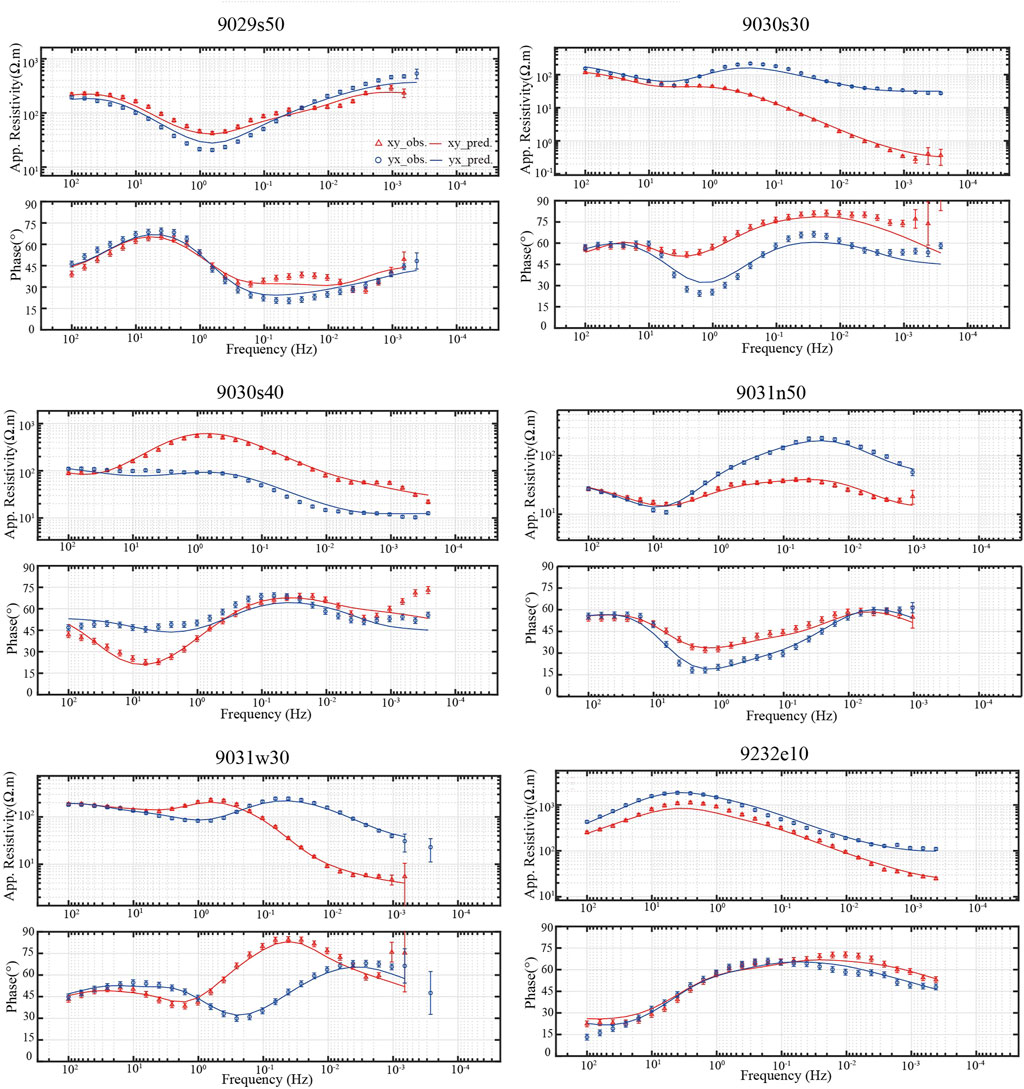
FIGURE 2. Examples of apparent resistivity and phase curves for the sites 9029s50, 9030s30, 9030s40, 9031n50, 9031w30, 9232e10 (marked by the white circles in Figure 1A). The red triangles and blue circles represent the off-diagonal elements of the impedances. The solid lines (red, blue) show the predicted responses for the preferred model. The error bars are corresponding to the measurement errors of the observed data.
2.2 Dimensional analysis
Before the MT data are used to employ inversion, it is needed to analyze whether the 2-D inversion or 3-D inversion is preferred for the MT data in the study area. Given that the phase tensor (PT) parameters can generally avoid the frequency—independent electric field galvanic distortion from heterogeneities (Caldwell et al., 2004) and need no prior dimensionality assumption, we use the phase tensor decomposition method to evaluate the dimensionality of the MT data. The equivalent geoelectrical strike direction of the MT data is indicated by the ellipse long axis, and the skew angle β denoted by the filled color of the ellipse can indicate the dimensionality at different periods (Caldwell et al., 2004). It is generally indicated that the MT data show complex 3-D structures in the isotropric case when the absolute value of β (|β|-values) is more than 3° (Booker, 2014). The more the absolute value β changes, the stronger three-dimensionality exhibits.
As illustrated in Figure 3, in the period of .01–0.1 s, the |β|-values are less than 3° and the ellipses are nearly circular, which indicates that the shallow structure exhibits the quasi-2D feature. In the period of 0.1 s, the |β|-values are less than 3° in the northern Lhasa terrane and near the IYS, which indicates generally 1-D or 2-D feature, but in the other areas, the |β|-values are more than 3° which shows the 3-D feature. The results of the phase tensor in the high-frequency period show that the shallow structure is pretty complex which may due to the fault and rift zone. The flatted ellipses with light color show that the consistent dimensionality pattern in deep structure and 3-D dimensionality become increasingly stronger with the increase of depth. Furthermore, the lithospheric-scale suture zones probably dominate the dimensionality in the deep structure. As suggested by the dimensionality above, the MT data in the survey necessarily call for a 3-D inversion and interpretation.
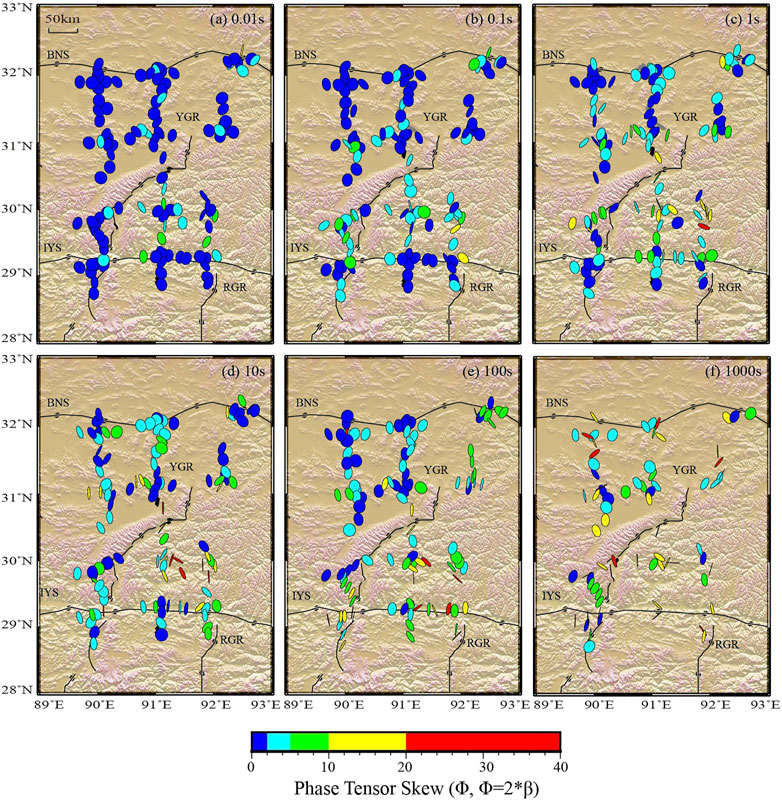
FIGURE 3. The phase tensor ellipses for periods. (A)0.01 s, (B)0.1 s, (C)1 s, (D)10 s, (E)100 s, (F)1,000 s. The colors of the ellipses indicate the skew angle
3 The 3-D inversion of the MT data
3.1 Details of the inversion and preferred model
Here, the ModEM inversion algorithm (Egbert and Kelbert, 2012; Kelbert et al., 2014), which utilizes the staggered-grid finite-difference approach to solve Maxwell’s equations and the non-linear conjugate gradient method to invert the MT data, is employed to invert the full impedance tensors (Z) in the study. A total of 32 frequency points in the range of .1–1,0000 s are used in the 3-D inversion. The initial model was a uniform half-space with resistivity of 100
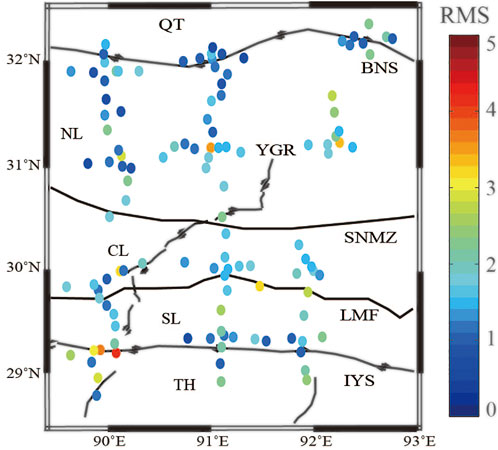
FIGURE 4. Site-by-site RMS of the 3D inversion. The misfit is <3 at almost all sites.
Supplementary Figures S1, S2 are the comparations of the horizontal pseudo-slices of the observed data and 3-D inversion response at different periods. The apparent resistivity shows pretty good agreement between the observed data and 3-D inversion response at all periods while the phases of both are also consistent in the periods of less than 1,000 s. Meanwhile, several sites have minor difference in the impedance phase in the period of 1,000 s and 1,0000 s. It is further proved that the 3-D electrical resistivity model is reliable.
3.2 Inversion results
Our 3-D electrical resistivity model (see Figure 5) shows that a large-scale resistive layer with the uneven bottom interface is at depths of less than 20 km in the upper crust, which is separated by several small-scale, isolated conductors. Five conductors marked C1, C2, C3, C4, and C5 are distributed beneath the resistive layer in the Lhasa terrane, respectively. Furthermore, a resistor (R1) is located in the mid-lower crust of the TH terrane in the south of the IYS, the northern boundary of which is also uneven.
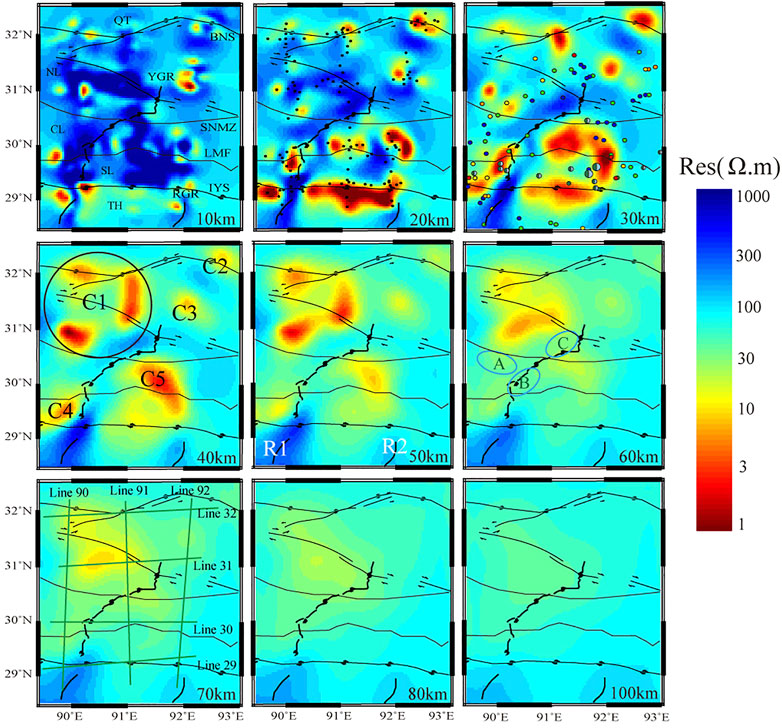
FIGURE 5. Horizontal slices of the 3-D electrical resistivity model for depth of 10, 20, 30, 40, 50, 60,70, 80, and 100 km. See Figure 1 for labels.

FIGURE 6. Cross sections of 3-D electrical resistivity model, approximately oriented East to West (line 29, line30, line 31, line 32 marked in Figure 5). Inverted triangles: magnetotelluric measurement stations; Red lines: Yadong-Gulu rift; Cyan circles: major Miocene porphyry Cu-Mo deposits (PCDs); Yellow dashed open circles: possible supply magma chambers. The Moho depths are from Li et al. (2014)
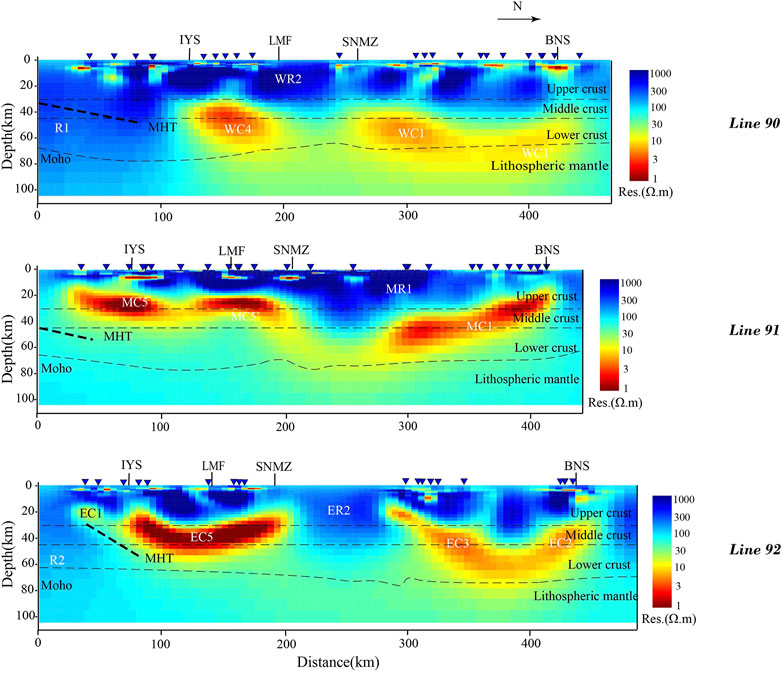
FIGURE 7. Cross sections of the 3-D electrical resistivity model, approximately oriented South to North (line 90, line 91, line 92 marked in Figure 5). Inverted triangles: magnetotelluric measurement stations; Bold dashed black lines: possible locations of the main Himalayan thrust fault (MHT, Wei et al., 2001)
A series of sensitivity tests were carried out to verify whether the MT data has good constraints on these electrical anomalies. As a result, the 3-D electrical model is frozen with a block of 100
Our electrical structure also shows three channel-like conductive zones that link the main conductors in the middle-lower crust. The specific locations of these conductive zones are illustrated in the Supplementary Figures S8–S10 and they were marked as A, B, and C. In order to verify the existence of the three conductors, we conducted sensitivity tests of conductors A and B in the depth range of ca. 50–80 km, by replacing the resistivity of the corresponding space with 30
In addition, Supplementary Figures S11A, B, C show the comparisons between the cross-section electrical structure of line 30 (this study) and the previous result of Wang et al. (2017). An obvious difference is whether a conductor with its bottom at a depth of approximately 77 km is in the east of the YGR. Note that the distribution of the MT data covering the conductive zones in the work of Wang et al. (2017) is denser than that in this study. In order to discuss what causes the difference between these two models, some sensitivity tests were carried out. Firstly, based on the scale of conductor C6 of the result of Wang et al. (2017), three groups of the modified models were established. In different depth ranges, we replaced the same area as C6 in our electrical resistivity model with the blocks with the resistivity of 3, 10, and 30 Ω·m respectively (Supplementary Figures S11–S13). Moreover, we also conducted another group of 3D inversion only with BBMT data (Supplementary Figures S14, S15). Generally, LMT data always has a relatively better constrains on the deep electrical structure. Compared with these three 3D inversion results and sensitivity tests, we found that involving of LMT data provides a better constrains on the bottom of the conductors and thus, there may not exist conductor C6 beneath the YGR in the depth range of 60–77 km or the C6 exists with a resistivity greater than 30 Ω·m. The difference in electrical structures between this work and Wang et al. (2017) may be due to the lack of LMT data which may provide more information about the deep earth. Furthermore, compared with the profile data, array data provide more information about the electrical structure of the study area and avoid the effect on the electrical resistivity profile from the conductors around.
Magnetotelluric studies often reveal anomalously high electrical conductivity in the mantle wedge above subducting plates (e.g., Worzewski et al., 2010; Pommier and Garnero, 2014; Ichiki et al., 2015), in the deep crust beneath young fold belts, such as the Himalaya (e.g., Gaillard, 2004; Le Pape et al., 2012). These anomalies are usually attributed to the presence of partial melts, brine-bearing aqueous fluids, or other high conductive phases, such as graphite (Wei et al., 2001; Unsworth et al., 2005; Jin, 2009), granulite (Fuji-ta et al., 2004), gabbro (Kariya and Shankland 1983), quartzite (Shimojuku et al., 2012) and granite (Olhoeft, 1981). Furthermore, recent petrological study of Guo et al. (2022) proposed that dehydration melting of garnet amphibolite contributes the conductivity comparable to the high conductivity anomalies. The possible origin of the high-conductivity layers (.1–1 S/m) widely distributed in the mid-lower crust of the Tibet plateau, is a long-standing and controversial issue (Nelson et al., 1996; Wei et al., 2001; Unsworth et al., 2005; Le Pape et al., 2012).
Among the factors that may lead to the high conductivity anomalies in the mid-lower crust of the Tibet plateau, metallic minerals, such as iron and copper sulphide, and graphite films can be easily ruled out due to the limited spatial distribution and low stability at the geological time-scale (Yoshino and Noritake, 2011). Furthermore, the conductivities contributed by typical rocks, such as graphite, granulite, gabbro, quartzite and granite are much lower than the high-conductivity anomalies (Yang et al., 2012). Therefore, Aqueous fluids or crustal-derived and/or mantle derived melts, or combination of both are always used to explain the high-conductivity anomalies in the Tibet plateau, because the conductivity of the aqueous fluids and melts are high enough for the crustal high-conductivity anomalies. Even a small amount of fluid can cause an order of magnitude reduction in the bulk resistivity, and in the viscosity (e.g., Rosenberg and Handy, 2005), but corresponding changes in seismic velocity are small-and may go undetected (Watanabe, 2013).
Aqueous fluids in the crust and upper mantle of the subduction zones usually contain some dissolved salts, especially the Nacl (Kawamoto et al., 2013; Frezzotti and Ferrando, 2015), which greatly enhance conductivity (Sinmyo and Keppler 2017). However, a brine-bearing, crustal-rock model is only applicable in regions with low geotherm (Guo et al., 2022).
The melts especially the partial dehydration melting of amphibolite and garnet amphibolite under lower crust conditions are also a potential candidate model for explaining seismic anisotropy and is also the origin of the low-velocity-high-conductivity zones (LV-HCZs) in the mid-lower crust of Tibet, especially for the following three reasons: The first is that amphibolite dominates the rock type in the region where LV-HCZs exist (Hou et al., 2017). The second is that the melts of amphibolite are of relatively high conductivity and low velocity; The third is the temperature is high enough to initial the dehydration melting of the amphibolite. In addition, phase equilibrium experiments have revealed that the dehydration melting of amphibolite stars at nearly 1123 K at 1.5 Gpa (Wang H. et al., 2019). Therefore, we reasonably consider that dehydration melting of amphibolite is likely to occur in the geotherm of the Tibet (Guo et al., 2022).
In our electrical resistivity model, conductors are located in the three different subterranes of the Lhasa terrane. Widely distributed shallow conductive layers (<5 km) in the Lhasa terrane may be considered to be a reflection of the geothermal activities. We notice that the relatively high-conductive structure in the western segment (west of 90°E) of the northern Lhasa subterrane is at depths of approximately 30–80 km with resistivity of 1–20
The widely distributed resistive cover identified in the shallow crust (∼10 km) might be the granite and multiple volcanic materials in the Lhasa terrane (Xu et al., 2006). The resistivity body in the Tethys-Himalaya terrane, such as R1 and R2 may represent the northern subducted Indian plate, which has been verified in the previous studies (Wei et al., 2001; Gao et al., 2014; Shi et al., 2015; Xie et al., 2017; Sheng et al., 2020; Sheng et al., 2021), while the resistive layer above the MHT presumably represents the high Himalaya crystalline rocks (Wei et al., 2001). In addition, the thick resistive layers (NR, MR1, MR2, and SR) in the Lhasa terrane are explained as the upward extrusion and cooling process of deep magma, which reflects the extensive and strong magmatic events under the Tibet plateau (Mo et al., 2009).
4 Thermal characteristic of lithospheric upper mantle and mid-lower crust
4.1 Thermal state of the lithospheric upper mantle
It is generally assumed minerals’ electrical conductivity is dependent on pressure, temperature, water content and composition, which can be described by the Arrhenius equation (Logan, 1982). Considering the different conduction modes in the minerals, the petrologically calibrated relationships between electrical conductivity and temperature of the main upper mantle minerals (55% Olivine, 28% orthopyroxene, 11% clinopyroxene and 6% garnet) (Peslier, 2010) (Dai and Karato, 2009; Yoshino et al., 2009; Yang et al., 2011; Zhang et al., 2012) and the basalt melt (Tyburczy and Waff, 1983) were utilized to calculated the lithospheric temperature. Moreover, Berryman (1995) and Jones et al. (2009) concluded that the Hashin-Shtrikman (HS) extreme bounds (Hashin and Shtrikman, 1962) are the most reliable approach for estimating the electrical conductivity of multiphase materials. Here, under the condition of the lithospheric mantle, we use the upper and lower bounds of the HS boundary to calculate the solid and solid-liquid mixed lithospheric mantle respectively. Besides, melt fraction of the lithospheric mantle was calculated based on thermo-dynamic modelling as well as experimental investigations of peridotite melting, and hydrous equilibria conducted by Katz et al. (2003).
It is worth noting that since MT data are better at constraining the conductance than in resolving the electrical conductivity (EC) with depth, we prefer to use bulk conductivity estimated by conductance and corresponding thickness rather than EC to estimate the thermal state of the upper mantle. Moreover, Water content, carbon dioxide content and pressure are very important for calculating the temperature and melt fraction of the lithospheric mantle (Peslier, 2010; Zhang et al., 2021). The maximum water content in the Tibetan plateau, according to Vozar et al. (2014) and Zhang (2017), was 200 ppm, but Le Pape et al. (2015) found that the water content in northern Tibet is roughly 100 ppm. Thus, we calculated the upper mantle thermal state with water content of 0 ppm (dry mantle) and 150 ppm (wet mantle with average water content) respectively, given that the ratio of water to carbon dioxide mass of the oceanic island basalt derived mantle (OIB) and basaltic mantle from mid ocean ridge was .82 (
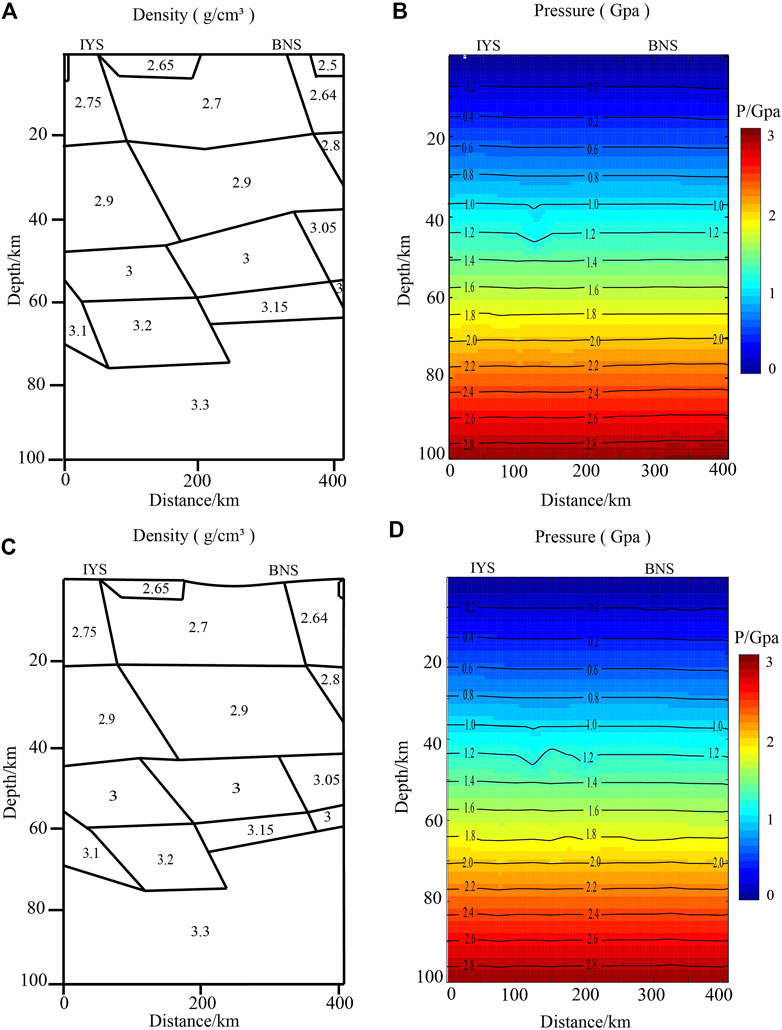
FIGURE 8. (A,B) The density model (modified from Bai et al., 2013) and pressure model calculated based on the
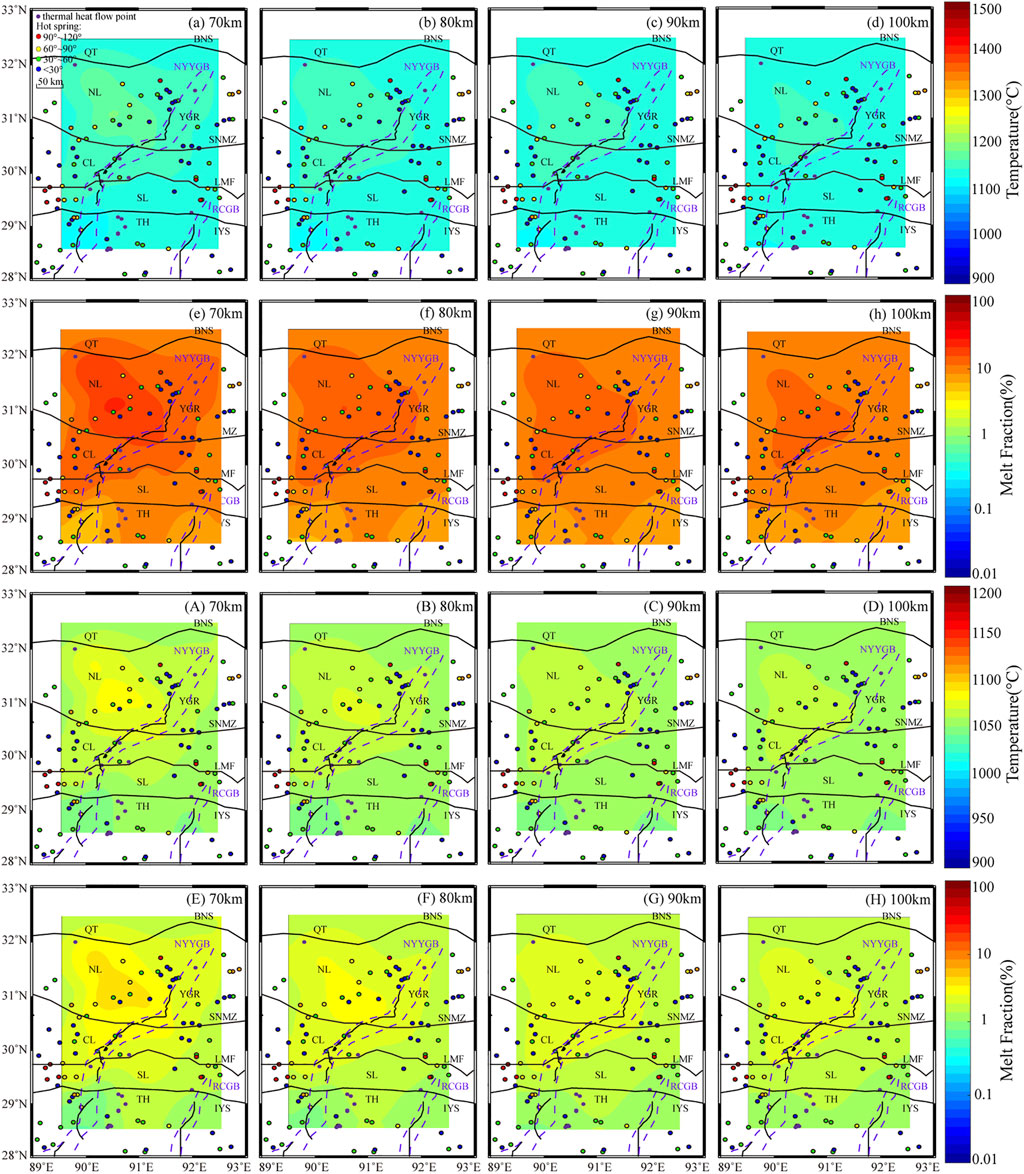
FIGURE 9. (A–H) Distribution of the temperature and melt fraction at depths of 70, 80, 90, and 100 km [
The temperature model of the upper mantle shows that temperature increase slightly with the increasing depths and the maximum temperature of the lithospheric upper mantle can reach to ca. 1,142°C and 1,087°C with a condition of dry mantle and wet mantle respectively. However, the melt fraction of the upper mantle appears to decrease with the increasing depth and increasing temperature. The maximum melt fraction of the upper mantle can reach to 12.39% at 70 km when the mantle is dry, while the maximum melt fraction is only 1.90% at 70 km when the mantle water content is 150 ppm.
The thermal state difference between the west and east of the YGR is so obvious that we speculate that the differences in underground metamorphism, material migration, volcanic earthquake activity between the two regions are partially caused by the asymmetry thermal state and eventually form the unique surface features.
4.2 Temperature of the lithosphere
Thermal state of the lithosphere controls its mechanical and may affect the lithospheric dynamics. Based on the steady heat conduction equation, the data of heat flow and element abundance of U, Th, K in the Tibetan plateau are used to calculate the crustal temperature in/beneath the Tibet plateau (Wang and Huang, 1990; Jiang et al., 2019; Čermák and Laštovičková, 1987 and reference therein). According to the study of Zhang and Zhao (2003), the depth of the Curie isotherm in the Yangbajing area is approximately 15–18.6 km, with the temperature of 580°C. The least square method was adapted to combine the calculated temperature of lithospheric upper mantle with the Curie temperature and crustal temperature to obtain the lithospheric temperature (Figure 10). The results show that crustal temperature in the east of YGR is relatively higher than that in the west of YGR, while the lithospreric mantle temperature in the two regions is similar.
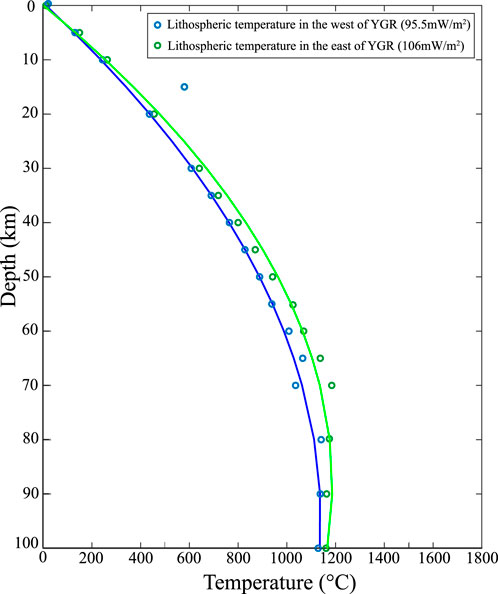
FIGURE 10. (A) Lithospheric temperature in the north west of the YGR estimated by using average terrestrial heat flow of 95.5
4.3 Moho temperature
The Moho discontinuity marks the boundary between the crust and the mantle and it plays a key role in mass transport. Constraining the depth and shape of the Moho beneath the Lhasa terrane may help elucidate the geometry of the subducting Indian plate beneath Lhasa Terrane (Shi D. et al., 2020). Moreover, the degree of coupling between upper and mid-lower crust and/or between the crust and lithospheric mantle is mainly controlled by the Moho temperature acting as a critical factor in influencing lithospheric rheology (Liao and Gerya, 2017). Here, by using the temperature calculation method same as the method mentioned in Section 4.1, the Moho temperature is estimated (Figure 11C). In this study, Moho depths refer to a compilation of receiver function (Li et al., 2014; Figure 11B) and water content in Moho depth is also similar to the “wet lithospheric mantle.” The average Moho temperature in our study area is greater than 1,200°C with relatively higher Moho temperature greater than 1,300°C beneath the Yadong-Gulu rift and Beng Co fault (BCF). This primarily results from the greater crustal thickness there. In contrast, lower Moho temperature west of the NL might at first seem counterintuitive and this primarily reflects thinner crustal thickness there. Moreover, previous study shows that when a crustal thickness of 70 km and linear temperature distribution with a constant strain rate of

FIGURE 11. (A) A curved section of the 3-D electrical resistivity model along the Moho (B) Moho depth from a compilation of receiver function (Li et al., 2014); (C) Estimated Moho temperature [
4.4 The strength of the mid-lower crust
Archie’s law is considered to be a feasible method to estimate the melt fraction of the crust when the melt in the crust is interconnected in the previous studies (e.g., Bai et al., 2010; Rippe and Unsworth, 2010; Le Pape et al., 2015; Wang et al., 2017; Comeau et al., 2018). However, conventional Archie’s law is only valid for one conducting phase distributed within a non-conducting phase, which make it inapplicable in instance where the rock matrix has a significance conductivity such as for clay-rich rocks and in calculation involving partial melting (Glover et al., 2000). The modified Archie’s law (see Eq. 1; Glover et al., 2000) was put forward and it describes the electrical behavior of the tow-phase porous medium extremely well, improving greatly on the conventional Archie’s law.
Where
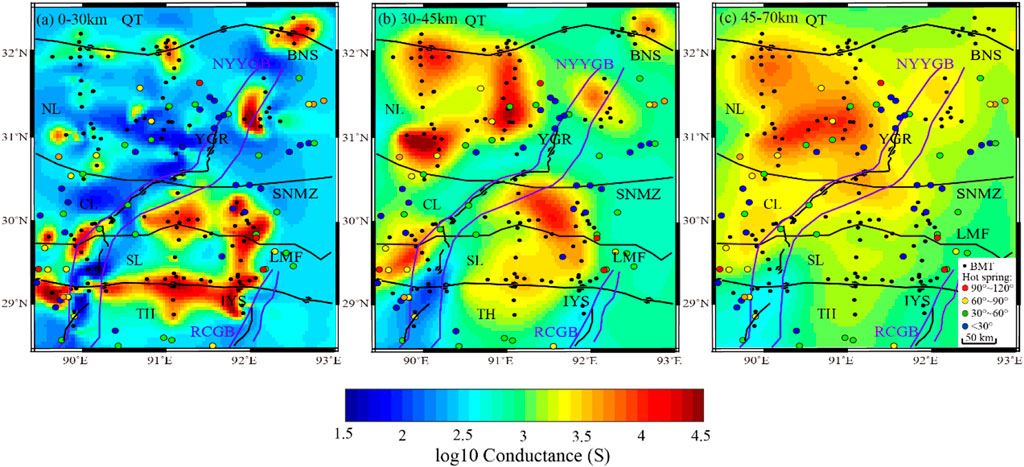
FIGURE 12. A map showing the distribution of conductance (A) Horizontal distribution of conductance at depths of 0–30 km. (B) Horizontal distribution of conductance at depths of 30–45 km. (C) Horizontal distribution of conductance at depths of 45–70 km.

FIGURE 13. The melt fraction in the mid-lower crust. (A) Horizontal distribution of melt fraction in the middle crust (∼30–45 km). (B) Horizontal distribution of melt fraction in the lower crust (∼45–70 km).
Previous studies have shown that melt conductivity can vary in a certain range. Some scholars argued that when the melt was assumed to be well interconnected, the pure melt resistivity was assumed to be .1–.3
Where
In the middle crust, the partial melting mainly occurred in the northwest of the northern Lhasa terrane and southeast of the central with more than 6% melt fraction and southern Lhasa terrane with minimum melt fraction of 10%, which shows a pretty consistent with the hot springs in the study area. In contrast, the melt fraction in most areas of the lower crust exceeds 10%. The effective viscosity would be reduced by an order of magnitude, when the melt fraction was larger than 5% (Rosenberg and Handy, 2005; Unsworth et al., 2005). The distribution of the melt fraction in the mid-lower crust shows that the mid-lower crust in our study area is relatively weak with a maximum melt fraction of approximately 20 vol%. It is well known that melt may introduce a drop in wave velocity. Moreover, Liu et al. (2019) indicates that there is a subtle drop in S-wave velocity (>12%) in the mid-lower crust, which may be due to the weak mid-lower crust in this area. Our result sheds lights on that possible local crustal flow may exist in our study area, even though more evidences are needed to support our deductions.
5 Interpretation and discussion
5.1 Subduction of the indian plate
The northward dipping resistors R1 and R2 located in the mid-lower crust and upper mantle beneath the Tethys-Himalaya terrane, which is also shown as the resistive zones (Wei et al., 2001; Wei et al., 2009; Xie et al., 2016; 2017; Sheng et al., 2020) and high-velocity zones (Liang et al., 2016; Huang et al., 2020), are indicated as the Indian lithospheric plate. Previous studies (Liang et al., 2016; Wang et al., 2017; Li and Song, 2018) indicated that the subduction angles of the Indian slab moving northwards are various in this region. Taking the YGR as a boundary, the subduction angle of the western segment is as different as than that of the eastern segment.
In our electrical resistivity model, the north-dipping resistor R1, with its northern boundary at approximately 29.5°N at depths of 30–80 km, is beyond IYS and does not extend to LMF in the west of the YGR. The resistor R2 in the mid-lower crust does not extend to IYS, which is consistent with the work of Sheng et al. (2020). No obvious resistive zones are between resistors R1 and R2. The resistive features mentioned above may indicate the different locations of the Indian lower crust (ILC) in different regions, which may result from the different onset locations of the Indian subduction because of the arched nature of the Himalayas and the IYS (Rosenbaum et al., 2008).
It is reported that the Indian lithospheric mantle may detach from the Indian crust and continue to move northwards (Kosarev et al., 1999; Shi et al., 2015). Previous studies have revealed that central Lhasa subterrane and the eastern segment of the northern Lhasa subterrane (east of 90°E) were considered to be subterranes with ancient basement rock, while the southern Lhasa and western segment of the northern Lhasa subterranes were juvenile blocks (Zhu et al., 2011; Hou et al., 2015). Our works reveal that in our study area, conductive layers widely distribute in the Lhasa terrane while the eastern portion of the northern subterrane (ENL) and the west portion of the central subterrane (WCL) exhibit moderate resistive. In addition, the ENL and WCL correspond well to the high-velocity, ancient, rigid and stable areas (Huang et al., 2020). Comparing with the WCL, the ECL appears to be relatively high-conductivity and highly molten from middle to lower crust. The maximum melt fraction of the ECL can reach to ∼20% and the lithospheric upper mantle temperature in this region is ∼1,400°C, indicating that the ancient subterrane has undergone active magmatism.
Based on the discussion on the ENL, it is possible that ENL represents the remnant of ancient lithosphere of the Lhasa terrane (Zhu et al., 2011), which may play a key role in blocking the subduction of Indian slab, resulting in steep-angle subduction and short-distance advancement in the east of the YGR.
The continuous subduction of the Indian mantle beneath the Lhasa terrane caused the disturbance of the asthenosphere and upwelling of the hot materials to heat the mid-lower crust, resulting in the partial melting of the mid-lower crust (Li et al., 2008; Kind and Yuan, 2010). The possible subduction Frontier of the Indian lithosphere could be sketched according to the northern edge of the conductive layers in the mid-lower crust. Thus, combined with the electrical resistivity model and previous studies (Li and Song, 2018; Liu et al., 2019), we sketch a modified subduction model (Figure 14). Taking the YGR as the boundary, the subduction angle of the Indian slab in the east of the YGR may be steeper than that in the west of the YGR, while the Indian slab in the west of the YGR advances more northward than that in the east of the YGR. The sufficient strain localization triggered by the distinct variations in the subduction geometry of the Indian lithosphere may be one of the factors that caused the slab tearing. In addition, Liu et al. (2019) reported that the thickness of the Tibetan lithosphere is ∼30 km greater in the west of the YGR than in the east. The Indian lithosphere has an offset of ∼70 km across the YGR, which results in the deeper Moho depth in the west of the YGR than in the east (Liu et al., 2019). The unique structure of the Indian lithosphere led to the upwelling of the asthenosphere at different depths in west-east direction and formed the conductors C1 in the mid-lower crust and C5 in the mid-upper crust. Thus, the inherited structures of the Indian lithosphere may become another factor resulting in the tearing of the Indian lithosphere.
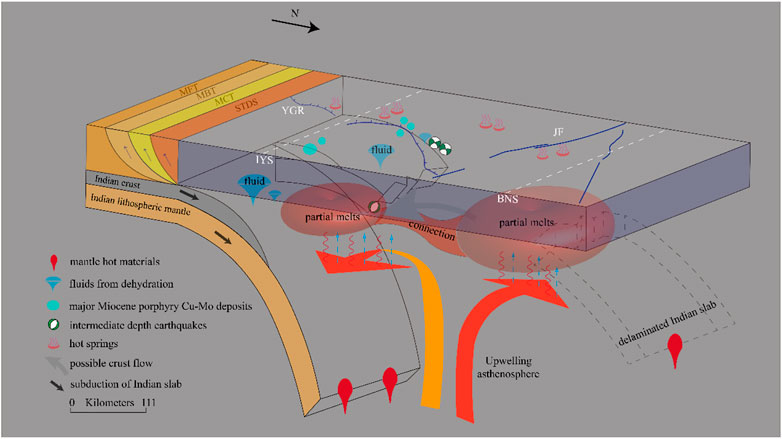
FIGURE 14. 3-D interpretative diagram of the current crustal and lithospheric mantle structure beneath YGR, showing the subduction mode of the Indian slab. MFT, Main Frontal Thrust; MBT, Main Boundary Thrust; MCT, Main Central Thrust; STDS, Southern Tibetan detachment system; JF, Jiali fault.
The uneven Moho surface (Figure 11B) corresponds well with the Hf mapping (Hou and Wang, 2018), which may imply that the Lhasa terrane has undergone the crustal thickening, mainly resulting from the wedge of the Indian slab and emplacement of the large-scale mantle sourced magma during the co-collision (Mo et al., 2007; Zhu et al., 2017). The thicker crust, with high Hf value beneath YGR suggests the double thickening effects and it may represent the juvenile crust caused by the subduction of the Indian slab. The small-scale conductor C3 to the north of the BNS may indicate the juvenile thickened crust caused by the bi-subduction of the Bangong Co-Nujiang (Hou et al., 2015), while the large scaled thickening beneath the YGR may due to the active tectonic activities caused by the N-S trending fault disturbing the asthenosphere and forming the extensive emplacement of the magmas in the mid-lower crust. However, the thickening of the crust in the area of the conductive layer C1 is not as prominent as the surrounding region. It is generally known that rolling back and delamination may occur as the subduction of the Indian slab and thereby triggering upwelling of the asthenosphere, forming large-scale magmatic activities (Chung et al., 2005; Ji et al., 2016; Niu et al., 2017). Thus, we indicate that the Indian mantle delamination may occur during the underthrust of the Indian slab along 90°E, which has been also verified by the teleseismic waves recorded by a temporary broadband network in approximately the same region (Kosarev et al., 1999), resulting in the not thickened crust in this area. The delaminated Indian slab resulted in the slab rebounding and forming the lower subduction angle of the Indian slab (Hou et al., 2020).
Localized Indian lithospheric mantle delamination into upwelling asthenoshperic mantle along 90°E can also well interpreted the distribution of the
In addition, phase transitions may occur during the injection of the Indian lithosphere. The base of the crust may be eclogitized with the low geotherm at the early stage of mountain building (Nabelek et al., 2009; Zhao et al., 2010), and the followed major extensional event with magma intrusion from asthenosphere may cause the increasing temperature, rocks re-equilibrating of the rocks within the granulite facies in the lower crust (Richardson and England, 1979). Jackson et al. (2004) indicated that earthquakes near the Moho may relate to the infiltration of hydrous fluids and brittle fracture that accompanies a transformation of metastable granulite to eclogite. In the southern Lhasa terrane, the obviously thick crust suggests the granulite lower crust beneath the YGR. Moreover, dehydration of the subducting Indian lithosphere may generate fluids in/above the Indian lithospheric mantle (Zhu et al., 2015), thereby make the granulite-eclogite transformation process (Jackson et al., 2004). Combined with all these factors above, the intermediate-depth earthquakes (
5.2 Formation of the Yadong-Gulu rift
Yadong-Gulu rift (YGR) is one of the most important structures in our study area. The thermal state, geophysical features and even structures on both sides of the YGR show obvious asymmetry. The different depths of C1 (20–80 km) and C5 (20–60 km) are mainly due to the inherited structure of the Indian lithosphere, which leads to the upwelling of the asthenosphere at different depths in west-east direction. Meanwhile, tearing windows were formed as the tearing happened and asthenosphere upwelled through the tearing windows, heating and weakening the overlying crust and resulting in the mantle convection. It is worth noting that the conductive layers do not spatially match the surface rifts. We speculated that in the process of asthenosphere upwelling, mantle convection may provide east-west driving force on the Tibetan crust, which may cause the extension of the Tibetan and eventually formed the YGR. The formation mechanism is similar to the pattern in the Tian et al. (2015).
In addition, previous works have proposed that middle crust flow or lower crustal flow was pervasive in the Tibetan plateau (Nelson et al., 1996; Cogan et al., 1998; Clark and Royden, 2000; Huang et al., 2020). In our study, large-scale conductive layers are located in the mid-lower crust and we do a set of sensitivity tests to verify the connections between the isolated conductors. It seems that the isolated conductors (C1, C2, C3, C4, and C5) were interconnected in the middle and lower crusts, but whether the local crust flow exists in these areas still need to be verified from other physical characteristics. Based on the parameters of the Archie’s law in this region, the melt fraction of 5%, acted as the minimum threshold of the reduction of the effective viscosity by an order of magnitude, is estimated by the bulk conductivity of at least .038 S/m (26.5 Ω m), which may contribute to the local “crust flow.” When the resistivity is less than 26.5
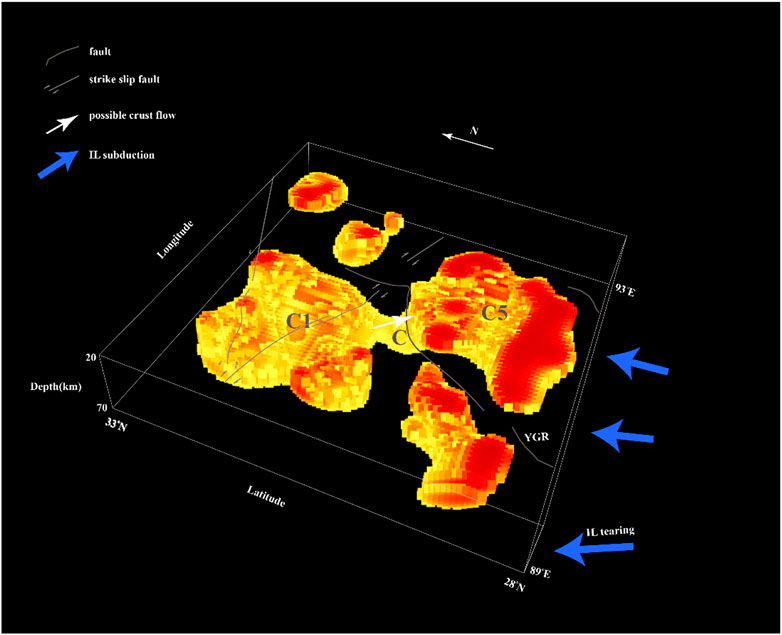
FIGURE 15. 3-D view of the crust electrical structure of the study area. The maximum resistivity of this model is 26.5
In addition, the temperatures on the both sides of the YGR are calculated in the Section 4.2, which shows that the lithospheric temperature is relatively higher in the west of the YGR than that in the east. As a result, connection C is not only a channel for material migration, but also a pathway for heat convection. Under the condition of bidirectional (N-S compression and E-W extension) lithospheric deformation, the widely distributed mid-lower crustal weak zones resulting from dehydrate melting or wet melting play a crucial role in the formation of the N-S trending rifts (Pang et al., 2018). Eastward crustal flow occurred due to the pressure difference in the west-east direction (Clark and Royden, 2000), which could create a west-east basal shear on the Tibetan crust that facilitates surface rifting. The high Moho temperature (See Figure 11) also indicates that strong decoupling exists between the brittle upper crust and ductile mid-lower crust. And thus, the west-east direction crustal flow also makes contributions to the dextral slip of the Beng Co fault to some extent, resulting in the faster ∼EW extension rate of up to 3–6 mm/yr near the northern end of the rift (Gulu) compared with only 1.3
Both mantle convection and local crust flow lead to the west-east slip of the YGR supporting the focal mechanisms along YGR (Zhu and Helmberger, 1996; Chen and Yang, 2004; Baur, 2007; Ekstrom et al., 2012). The genesis of the YGR has the characteristics of multi-stage and multi-factor.
Comparing with the previous viewpoint that the rift zones were just restricted to the upper crust (Masek et al., 1994; Nelson et al., 1996; Cogan et al., 1998), the estimated melt fraction and the electrical resistivity structure of the lower crust and upper mantle suggest that northern and central YGR may cuts throughout the entire crust and mantle lithosphere for the local migration of the lower crust and the hot materials upwelling from the upper mantle through the rift zones. Furthermore, instability analysis of rift spacing (Yin, 2000), the ultrapotassic and adakitic magmatism along rift zones (Williams et al., 2001; Chung et al., 2005), body wave tomography studies (Ren and Shen, 2008; Liang et al., 2011; 2012; Huang et al., 2020), surface wave tomography (Jiang et al., 2014) provided the direct evidences to support that the YGR originate from deep lithosphere.
6 Conclusion
In this study, we have presented the results from a 3-D magnetotelluric study covering the Yadong-Gulu rift. Based on the electrical structure, the experimentally calibrated relationships bridging electrical conductivity and temperature/melt fraction were applied to construct the thermal and rheological structures of lithosphere.
On basis of the electrical structure, thermal structure as well as rheological structure, our study proposed the subduction model of the Indian slab which shows a steeper subduction angle in the east of the YGR and an Indian slab delamination in the west of the YGR. Moreover, subduction of the Indian slab may disturb the asthenosphere and trigger the mantle flow beneath the Lhasa terrane and the upwelling asthenosphere from the deep may widely melt the mid-lower crust of the corresponding area.
The estimated Moho temperature suggests that the decoupling between the brittle upper crust and ductile mid-lower crust is so strong that they may contribute to the formation of the YGR and BCF. Furthermore, the derived rheological feature shows that the mid-lower crust is so weak that it meets the rheological conditions to generate local crust flow from west to east under a pressure difference beneath the YGR. It is the local crustal flow that play an essential role in pulling the Indian and Tibetan crust and forming the YGR.
What’s more, the combination of the granulite lower crust beneath the Lhasa terrane, the fluids generated by dehydration of the Indian slab and the extremely high strain-rate for the special locations contributed to the occurrence of the intermediate-depth earthquakes along the Frontier of the delaminated Indian slab.
Data availability statement
The original contributions presented in the study are included in the article/Supplementary Material, further inquiries can be directed to the corresponding authors.
Author contributions
LL: data curation, methodology, visualization, software, writing—original draft. SJ: writing—review and editing, project administration, funding acquisition. HD: writing—review and editing. WW: writing—review and editing. GY: writing—review and editing. LZ: writing—review and editing.
Funding
This study is funded by the Second Tibetan Plateau Scientific Expedition and Research Program (2019QZKK0701), China Scholarship Council (202006400054) and the National Key R&D Program of China (2016YFC0600301).
Acknowledgments
We thank Gary Egbert and Anna Kelbert for providing their 3-D MT inversion code Modem. Special thanks must go to our field crews and students; this study would not have been possible without their efforts. We used the GMT software package (Wessel and Smith, 1998) for production of some figures.
Conflict of interest
The authors declare that the research was conducted in the absence of any commercial or financial relationships that could be construed as a potential conflict of interest.
Publisher’s note
All claims expressed in this article are solely those of the authors and do not necessarily represent those of their affiliated organizations, or those of the publisher, the editors and the reviewers. Any product that may be evaluated in this article, or claim that may be made by its manufacturer, is not guaranteed or endorsed by the publisher.
Supplementary material
The Supplementary Material for this article can be found online at: https://www.frontiersin.org/articles/10.3389/feart.2022.1089675/full#supplementary-material
References
Bai, D., Unsworth, M. J., Meju, M. A., Ma, X., Teng, J., Kong, X., et al. (2010). Crustal deformation of the eastern Tibetan plateau revealed by Magnetotelluric imaging. Nat. Geosci. 3 (5), 358–362. doi:10.1038/ngeo830
Bai, Z. M., Zhang, S. F., and Braitenberg, C. (2013). Crustal density structure from 3D gravity modeling beneath Himalaya and Lhasa blocks, Tibet. J. Asian Earth Sci. 78 (12), 301–317. doi:10.1016/j.jseaes.2012.12.035
Baur, J. R. (2007). Seismotectonics of the Himalayas and the Tibetan plateau: Moment tensor analysis of regional seismograms. Corvallis, OR: Oregon State University, 275.
Berryman, J. G. (1995). “Mixture theories for rock properties,” in Rock physics and phase relations: A handbook of physical constants, agu ref. Shelf, vol. 3. Editor T. J. Ahrens (Washington, D. C: AGU), 205–228. doi:10.1029/RF003p0205
Booker, J. R. (2014). The magnetotelluric phase tensor: A critical review. Surv. Geophys. 35 (1), 7–40. doi:10.1007/s10712-013-9234-2
Caldwell, T. G., Bibby, H. M., and Brown, C. (2004). The magnetotelluric phase tensor. Geophys. J. Int. 158 (2), 457–469. doi:10.1111/j.1365-246x.2004.02281.x
Čermák, V., and Laštovičková, M. (1987). Temperature profiles in the Earth of importance to deep electrical conductivity models. Pure Appl. Geophys. 125 (2-3), 255–284. doi:10.1007/bf00874497
Chen, W. P., and Yang, Z. H. (2004). Earthquakes beneath the Himalayas and tibet: Evidencefor strong lithospheric mantle. Science 304, 1949–1952. doi:10.1126/science.1097324
Chen, Y., Li, W., Yuan, X., Badal, J., and Teng, J. (2015). Tearing of the Indian lithospheric slab beneath southern Tibet revealed by SKS-wave splitting measurements. Earth Planet. Sci. Lett. 413, 13–24. doi:10.1016/j.epsl.2014.12.041
Chevalier, M. L., Tapponnier, P., vander Woerd, J., Leloup, P. H., Wang, S., Pan, J., et al. (2020). Late Quaternary extension rates across the northern half of the Yadong-Gulu rift: Implication for east-west extension in southern Tibet. J. Geophys. Res. Solid Earth 125, e2019JB019106. doi:10.1029/2019JB019106
Chu, R., Zhu, L., and Helmberger, D. V. (2009). Determination of earthquake focal depths and source time functions in central Asia using teleseismic P waveforms. Geophys. Res. Lett. 36 (17), L17317. doi:10.1029/2009gl039494
Chung, S. L., Chu, M. F., Zhang, Y., Xie, Y., Lo, C. H., Lee, T. Y., et al. (2005). Tibetan tectonic evolution inferred from spatial and temporal variations in post-collisional magmatism. Earth-Science Rev. 68 (3-4), 173–196. doi:10.1016/j.earscirev.2004.05.001
Clark, M. K., and Royden, L. H. (2000). Topographic ooze: Building the eastern margin of tibet by lower crustal flow. Geology 28 (8), 703–706. doi:10.1130/0091-7613(2000)028<0703:tobtem>2.3.co;2
Cogan, M. J., Nelson, K. D., Kidd, W. S. F., and Wu, C.Project INDEPTH Team (1998). Shallow structure of the Yadong-Gulu rift, southern Tibet, from refraction analysis of Project INDEPTH common midpoint data. Tectonics 17, 46–61. doi:10.1029/97tc03025
Comeau, M. J., Unsworth, M. J., and Cordell, D. (2016). New constraints on the magma distribution and composition beneath Volcán Uturuncu and the southern Bolivian Altiplano from Magnetotelluric data. Geosphere 12 (5), 1391–1421. doi:10.1130/ges01277.1
Comeau, M. J., Käufl, J. S., Becken, M., Kuvshinov, A., Grayver, A. V., Kamm, J., et al. (2018). Evidence for fluid and melt generation in response to an asthenospheric upwelling beneath the Hangai Dome, Mongolia. Earth Planet. Sci. Lett. 487, 201–209. doi:10.1016/j.epsl.2018.02.007
Dai, L., and Karato, S.-i. (2009). Electrical conductivity of pyrope-rich garnet at high temperature and high pressure. Phys. Earth Planet. Interiors 176, 83–88. doi:10.1016/j.pepi.2009.04.002
Dong, S. W., and Li, T. D. (2009). SinoProbe: The exploration of deep interior beneath the Chinese continent. Acta Geologica Sinica (in Chinese), 83 (7), 895–909.
Dong, H., Wei, W., Jin, S., Ye, G., Zhang, L., Yin, Y., et al. (2016). Extensional extrusion: Insights into south-eastward expansion of Tibetan Plateau from Magnetotelluric array data. Earth Planet. Sci. Lett. 454, 78–85. doi:10.1016/j.epsl.2016.07.043
Egbert, G. D., and Booker, J. R. (1986). Robust estimation of geomagnetic transfer functions. Geophys. J. Int. 87 (1), 173–194. doi:10.1111/j.1365-246X.1986.tb04552.x
Egbert, G. D., and Kelbert, A. (2012). Computational recipes for electromagnetic inverse problems. Geophys. J. Int. 189 (1), 251–267. doi:10.1111/j.1365-246x.2011.05347.x
Egbert, G. D. (1997). Robust multiple-station magnetotelluric data processing. Geophys. J. Int. 130 (2), 475–496. doi:10.1111/j.1365-246x.1997.tb05663.x
Ekstrom, G., Nettles, M., and Dziewonski, A. M. (2012). The global CMT project 2004–2010: Centroid-moment tensors for 13017 earthquakes. Phys. Earth Planet. Inter. 200-201, 1–9. doi:10.1016/j.pepi.2012.04.002
England, P., and Houseman, G. (1989). Extension during continental convergence, with application to the Tibetan Plateau. J. Geophys. Res. 94 (12), 17 561–617 579. doi:10.1029/jb094ib12p17561
England, P., and McKenzie, D. (1982). A thin viscous sheet model for continental deformation. Geophys. J. R. Astron. Soc. 70, 295–321. doi:10.1111/j.1365-246x.1982.tb04969.x
Frezzotti, M. L., and Ferrando, S. (2015). The chemical behavior of fluids released during deep subduction based on fluid inclusions. Am. Mineralogist 100 (2-3), 352–377. doi:10.2138/am-2015-4933
Fuji-ta, K., Katsura, T., and Tainosho, Y. (2004). Electrical conductivity measurement of granulite under mid-to-lower crustal pressure-temperature conditions. Geophys. J. Int. 157 (1), 79–86. doi:10.1111/j.1365-246X.2004.02165.x
Gaillard, F. (2004). Laboratory measurements of electrical conductivity of hydrous and dry silicic melts under pressure. Earth Planet. Sci. Lett. 218 (1), 215–228. doi:10.1016/s0012-821x(03)00639-3
Gao, R., Ye, Z., Li, Q., Zhang, H., Shen, X., Liu, X., et al. (2014). “Seismic evidence for north China plate subduction beneath northeastern Tibet and its implications for plateau growth,” in AGU Fall Meeting Abstracts, New Delhi, San Francisco, California, December 15–19, 2014.
Glover, P. W. J., Hole, M. J., and Pous, J. (2000). A modified Archie's law for two conducting phases. Earth Planet. Sci. Lett. 180 (3–4), 369–383. doi:10.1016/S0012-821X(00)00168-0
Guo, Z., Wilson, M., Zhang, M., Cheng, Z., and Zhang, L. (2015). Post-collisional ultrapotassic mafic magmatism in South Tibet: Products of partial melting of pyroxenite in the mantle wedge induced by roll-back and delamination of the subducted Indian continental lithosphere slab. J. Petrology 56 (7), 1365–1406. doi:10.1093/petrology/egv040
Guo, X., Zhang, L., Su, X., Mao, Z., Gao, X. Y., Yang, X., et al. (2018). Melting inside the Tibetan crust? Constraint from electrical conductivity of peraluminous granitic melt. Geophys. Res. Lett. 45 (9), 3906–3913. doi:10.1029/2018GL077804
Guo, X., Chen, S., Song, Y., Wu, Y., Wu, X., and Zhang, J. (2022). Origin of the high conductivity anomalies in the mid-lower crust of the Tibetan Plateau: Dehydration melting of garnet amphibolites. Lithos 436-437, 106988. doi:10.1016/j.lithos.2022.106988
Hashim, L., Gaillard, F., Champallier, R., Le Breton, N., Arbaret, L., and Scaillet, B. (2013). Experimental assessment of the relationships between electrical resistivity, crustal melting and strain localization beneath the Himalayan-Tibetan Belt. Earth Planet. Sci. Lett. 373, 20–30. doi:10.1016/j.epsl.2013.04.026
Hashin, Z., and Shtrikman, S. (1962). A variational approach to the theory of the elastic behaviour of polycrystals. J. Mech. Phys. Solids 10 (4), 343–352. doi:10.1016/0022-5096(62)90005-4
He, R., Gao, R., Zheng, H., and Zhang, J. (2007). Matched-filter analysis of aeromagnetic anomaly in mid-western Tibetan Plateau and its tectonic implications. Chin. J. Geophys. (in Chinese) 50 (4), 984–994. doi:10.1002/cjg2.1115
Hou, Z., and Wang, T. (2018). Isotope mapping and deep material detection (Ⅱ): Revealing the three-dimensional structure of the crust and regional metallogenic regularity. Frontiers in Geoscience 25 (6), 22. doi:10.13745/j.esf.sf.2018.11.19
Hou, Z. Q., Gao, Y. F., Qu, X. M., Rui, Z. Y., and Mo, X. X. (2004). Origin of adakitic intrusives generated during mid-Miocene east–west extension in southern Tibet. Earth and Planetary Science Letters 220 (1-2), 139–155. doi:10.1016/s0012-821x(04)00007-x
Hou, Z., Duan, L., Lu, Y., Zheng, Y., Zhu, D., Yang, Z., et al. (2015). Lithospheric architecture of the Lhasa terrane and its control on ore deposits in the Himalayan-Tibetan orogen. Economic Geology 110 (6), 1541–1575. doi:10.2113/econgeo.110.6.1541
Hou, Z., Zhou, Y., Wang, R., Zheng, Y., He, W., Zhao, M., et al. (2017). Recycling of metal-fertilized lower continental crust: Origin of non-arc Au-rich porphyry deposits at cratonic edges. Geology 45, 563–566. doi:10.1130/g38619.1
Hou, Z., Zheng, Y., Lu, Z., Xu, B., Wang, C., and Zhang, H. (2020). Growth, thickening and evolution of the thickened crust of the Tibet Plateau. Acta Geologica Sinica 94 (10), 2797–2815. doi:10.19762/j.cnki.dizhixuebao.2020199
Huang, S. Y., Yao, H. J., Lu, Z. W., Tian, X. B., Zheng, Y., Wang, R., et al. (2020). High-resolution 3-D shear wave velocity model of the Tibetan plateau: Implications for crustal deformation and porphyry Cu deposit formation. Journal of Geophysical Research Solid Earth 125. doi:10.1029/2019JB019215
Ichiki, M., Ogawa, Y., Kaida, T., Demachi, T., Hirahara, S., Honkura, Y., et al. (2015). “Geofluid migration process inferred from a 3-D electrical conductivity model beneath Tohoku district,” in Japan,” in Japan Geoscience Union Meeting 2015 Abstracts, Makuhari, Chiba, Japan, May 24–28.
Jackson, J., Austrheim, H., McKenzie, D., and Priestley, K. (2004). Metastability, mechanical strength, and the support of mountain belts. Geology 32, 625–628. doi:10.1130/g20397.1
Ji, W. Q., Wu, F. Y., Chung, S. L., Wang, X. C., Liu, C. Z., Li, Q. L., et al. (2016). Eocene neo-tethyan slab breakoff constrained by 45 ma oceanic island basalt–type magmatism in southern tibet. Geology 44, 283–286. doi:10.1130/g37612.1
Jiang, M., Ai, Y., Zhou, S., and Chen, Y. J. (2014). Distribution of the low velocity bulk in the middle-to-lower crust of southern tibet: Implications for formation of the north–south trending rift zones. Acta Seismologica Sinica (English Edition) 27 (2), 149–157. doi:10.1007/s11589-014-0080-1
Jiang, G., Hu, S., Shi, Y., Zhang, C., Wang, Z., and Hu, D. (2019). Terrestrial heat flow of continental China: Updated dataset and tectonic implications. Tectonophysics 753, 36–48. doi:10.1016/j.tecto.2019.01.006
Jin, S. (2009). The characteristic of crust-mantle electrical structure and dynamics within Tibetan Plateau. Doctoral dissertation. Beijing: University of Geosciences.
Jones, A. G., Evans, R. L., and Eaton, D. W. (2009). Velocity–conductivity relationships for mantle mineral assemblages in archean cratonic lithosphere based on a review of laboratory data and hashin–shtrikman extremal bounds. Lithos 109 (1-2), 131–143. doi:10.1016/j.lithos.2008.10.014
Kaban, M. K., Flóvenz Ólafur, G., and Gudmundur, P. (2010). Nature of the crust-mantle transition zone and the thermal state of the upper mantle beneath Iceland from gravity modelling. Geophysical Journal International 149, 281–299. doi:10.1046/j.1365-246x.2002.01622.x
Kariya, K. A., and Shankland, T. J. (1983). Electrical conductivity of dry lower crustal rocks. Geophysics 48, 52–61. doi:10.1190/1.1441407
Katz, R. F., Spiegelman, M., and Langmuir, C. H. (2003). A new parameterization of hydrous mantle melting. Geochemistry, Geophysics, Geosystems 4 (9). doi:10.1029/2002gc000433
Kawamoto, T., Yoshikawa, M., Kumagai, Y., Mirabueno, M. H. T., Okuno, M., and Kobayashi, T. (2013). Mantle wedge infiltrated with saline fluids from dehydration and decarbonation of subducting slab. Proceedings of the National Academy of Sciences 110 (24), 9663–9668. doi:10.1073/pnas.1302040110
Kelbert, A., Meqbel, N., Egbert, G. D., and Tandon, K. (2014). ModEM: A modular system for inversion of electromagnetic geophysical data. Computers and Geosciences 66, 40–53. doi:10.1016/j.cageo.2014.01.010
Kind, R., and Yuan, X. (2010). Seismic images of the biggest crash on Earth. Science 329, 1479–1480. doi:10.1126/science.1191620
Klemperer, S. L., Zhao, P., Whyte, C. J., Darrah, T. H., Crossey, L. J., Karlstrom, K. E., et al. (2022). Limited underthrusting of India below tibet: 3He/4He analysis of thermal springs locates the mantle suture in continental collision. Proceedings of the National Academy of Sciences 119 (12), e2113877119. doi:10.1073/pnas.2113877119
Klootwijk, C. T., Conaghan, P. J., and Powell, C. M. (1985). The himalayan arc: Large-scale continental subduction, oroclinal bending and back-arc spreading. Earth and Planetary Science Letters 75 (2-3), 167–183. doi:10.1016/0012-821x(85)90099-8
Kosarev, G., Kind, R., Sobolev, S. V., Yuan, X., Hanka, W., and Oreshin, S. (1999). Seismic evidence for a detached Indian lithospheric mantle beneath Tibet. Science 283 (5406), 1306–1309. doi:10.1126/science.283.5406.1306
Le Pape, F., Jones, A. G., Vozar, J., and Wenbo, W. (2012). Penetration of crustal melt beyond the kunlun fault into northern tibet. Nature Geoscience 5 (5), 330–335. doi:10.1038/ngeo1449
Le Pape, F., Jones, A. G., Unsworth, M. J., Vozar, J., Wei, W., Jin, S., et al. (2015). Constraints on the evolution of crustal flow beneath N orthern T ibet. Geochemistry, Geophysics, Geosystems 16 (12), 4237–4260. doi:10.1002/2015gc005828
Li, J., and Song, X. (2018). Tearing of Indian mantle lithosphere from high-resolution seismic images and its implications for lithosphere coupling in southern Tibet. Proceedings of the National Academy of Sciences 115 (33), 8296–8300. doi:10.1073/pnas.1717258115
Li, S. H., Unsworth, M. J., Booker, J. R., Wei, W. B., and Jones, A. G. (2003). Partial melt or aqueous fluid in the mid-crust of southern tibet? Constraints from INDEPTH magnetotelluric data. Geophys. J. Int. 153 (2), 289–304. doi:10.1046/j.1365-246X.2003.01850.x
Li, C., Van der Hilst, R. D., Meltzer, A. S., and Engdahl, E. R. (2008). Subduction of the Indian lithosphere beneath the Tibetan plateau and Burma. Earth and Planetary Science Letters 274 (1-2), 157–168. doi:10.1016/j.epsl.2008.07.016
Li, Y., Gao, M., and Wu, Q. (2014). Crustal thickness map of the Chinese mainland from teleseismic receiver functions. Tectonophysics 611, 51–60. doi:10.1016/j.tecto.2013.11.019
Li, L., Zhang, X., Liao, J., Liang, Y., and Dong, S. (2021). Geophysical constraints on the nature of lithosphere in central and eastern Tibetan plateau. Tectonophysics 804, 228722. doi:10.1016/j.tecto.2021.228722
Liang, X., Shen, Y., Chen, Y. J., and Ren, Y. (2011). Crustal and mantle velocity models of southern Tibet from finite frequency tomography. J Geophys Res 116, B02408. doi:10.1029/2009JB007159
Liang, X. F., Sandvol, E., Chen, Y. J., Hearn, T., Ni, J., Klemperer, S., et al. (2012). A complex Tibetan upper mantle: A fragmented Indian slab and no south-verging subduction of eurasian lithosphere. Earth Planet Sci Lett 333, 101–111. doi:10.1016/j.epsl.2012.03.036
Liang, X. F., Chen, Y., Tian, X. B., Chen, Y. J., Ni, J., Gallegos, A., et al. (2016). 3D imaging of subducting and fragmenting Indian continental lithosphere beneath southern and central Tibet using body-wave finite-frequency tomography. Earth Planet. Sci. Lett. 443, 162–175. doi:10.1016/j.epsl.2016.03.029
Liao, J., and Gerya, T. (2017). Partitioning of crustal shortening during continental collision: 2-D thermomechanical modeling. J. Geophys. Res. 122, 592–606. doi:10.1002/2016jb013398
Liu, Z., Tian, X., Yuan, X., Liang, X., Zhou, B., Zhu, G., et al. (2019). Complex structure of upper mantle beneath the Yadong-Gulu rift in Tibet revealed by s-to-p converted waves. Earth and Planetary Science Letters 531, 115954. doi:10.1016/j.epsl.2019.115954
Logan, S. R. (1982). The origin and status of the Arrhenius equation. Journal of Chemical Education 59 (4), 279. doi:10.1021/ed059p279
Masek, J. G., Isacks, B. L., Fielding, E. J., and Browaeys, J. (1994). Rift flank uplift in tibet: Evidence for a viscous lower crust. Tectonics 13, 659–667. doi:10.1029/94tc00452
McCaffrey, R., and Nabelek, J. (1998). Role of oblique convergence in the active deformation of the Himalayas and southern Tibet plateau. Geology 26 (8), 691–694. doi:10.1130/0091-7613(1998)026<0691:roocit>2.3.co;2
Mo, X., Hou, Z., Niu, Y., Dong, G., Qu, X., Zhao, Z., et al. (2007). Mantle contributions to crustal thickening during continental collision: Evidence from cenozoic igneous rocks in southern tibet. Lithos 96 (1-2), 225–242. doi:10.1016/j.lithos.2006.10.005
Mo, X. X., Zhao, Z. D., Zhu, D. C., Yu, X. H., Dong, G. C., and Zhou, S. (2009). On the lithosphere of indo-asia collision zone in southern tibet: Petrological and geochemical constraints. Earth Science 34 (1), 17–27. doi:10.3799/dqkx.2009.003
Molnar, P., and Tapponnier, P. (1978). Active tectonics of tibet. J. Geophys. Res. 83, 5361–5375. doi:10.1029/jb083ib11p05361
Murphy, M. A., and Copeland, P. (2005). Transtensional deformation in the central Himalaya and its role in accommodating growth of the Himalayan orogen. Tectonics 24 (4). doi:10.1029/2004tc001659
Nabelek, J., Hetenyi, G., Vergne, J., Sapkota, S., Kafle, B., Jiang, M., et al. (2009). Underplating in the Himalaya–Tibet collision zone revealed by the Hi-CLIMB experiment. Science 325 (5946), 1371–1374. doi:10.1126/science.1167719
Nelson, K. D., Zhao, W., Brown, L. D., Kuo, J., Che, J., Liu, X., et al. (1996). Partially molten middle crust beneath southern Tibet: Synthesis of project INDEPTH results. Science 274 (5293), 1684–1688. doi:10.1126/science.274.5293.1684
Niu, Y. L. (2017). Slab breakoff: A causal mechanism or pure convenience? Science Bulletin 62 (7), 456–461.
Olhoeft, G. R. (1981). Electrical properties of granite with implications for the lower crust. Journal of Geophysical Research 86, 931–936. doi:10.1029/JB086iB02p00931
Pang, Y., Zhang, H., Gerya, T. V., Jie, L., and Shi, Y. (2018). The mechanism and dynamics of n-s rifting in southern tibet: Insight from 3-d thermomechanical modeling. Journal of Geophysical Research Solid Earth 123 (B14), 859–877. doi:10.1002/2017jb014011
Patiño Douce, A. E., and Harris, N. (1998). Experimental constraints on Himalayan anatexis. Journal of Petrology 39 (4), 689–710. doi:10.1093/petroj/39.4.689
Peslier, A. H. (2010). A review of water contents of nominally anhydrous natural minerals in the mantles of Earth, Mars and the Moon. Journal of Volcanology and Geothermal Research 197 (1-4), 239–258. doi:10.1016/j.jvolgeores.2009.10.006
Pommier, A., and Garnero, E. J. (2014). Petrology-based modeling of mantle melt electrical conductivity and joint interpretation of electromagnetic and seismic results. Journal of Geophysical Research Solid Earth 119 (5), 4001–4016. doi:10.1002/2013jb010449
Priestley, K., and McKenzie, D. (2006). The thermal structure of the lithosphere from shear wave velocities. Earth and Planetary Science Letters 244, 285–301. doi:10.1016/j.epsl.2006.01.008
Ren, Y., and Shen, Y. (2008). Finite frequency tomography in southeastern tibet: Evidence for the causal relationship between mantle lithosphere delamination and the north-south trending rifts. J Geophys Res 113, B10316. doi:10.1029/2008JB005615
Richardson, S. W., and England, P. C. (1979). Metamorphic consequences of crustal eclogite production in overthrust orogenic zones. Earth and Planetary Science Letters 42, 183–190. doi:10.1016/0012-821x(79)90023-2
Rippe, D., and Unsworth, M. (2010). Quantifying crustal flow in Tibet with Magnetotelluric data. Physics of the Earth and Planetary Interiors 179 (3-4), 107–121. doi:10.1016/j.pepi.2010.01.009
Rosenbaum, G., Gasparon, M., Lucente, F. P., Peccerillo, A., and Miller, M. S. (2008). Kinematics of slab tear faults during subduction segmentation and implications for Italian magmatism. Tectonics 27, 16. doi:10.1029/2007tc002143
Rosenberg, C. L., and Handy, M. R. (2005). Experimental deformation of partially melted granite revisited: Implications for the continental crust. Journal of metamorphic Geology 23 (1), 19–28. doi:10.1111/j.1525-1314.2005.00555.x
Schutt, D. L., and Lesher, C. E. (2006). Effects of melt depletion on the density and seismic velocity of garnet and spinel lherzolite. Journal of Geophysical Research Atmospheres 111. doi:10.1029/2003jb002950
Sheng, Y., Jin, S., Lei, L., Dong, H., Zhang, L., Wei, W., et al. (2020). Deep thermal state on the eastern margin of the Lhasa-Gangdese belt and its constraints on tectonic dynamics based on the 3-D electrical model. Tectonophysics 793, 228606. doi:10.1016/j.tecto.2020.228606
Sheng, Y., Jin, S., Comeau, M. J., Dong, H., Zhang, L. T., Lei, L. L., et al. (2021). Lithospheric structure near the northern Xainza-Dinggye rift, Tibetan Plateau–Implications for rheology and tectonic dynamics. Journal of Geophysical Research Solid Earth 126, e2020JB021442. doi:10.1029/2020JB021442
Shi, D., Klemperer, S. L., Shi, J., Wu, Z., and Zhao, W. (2020). Localized foundering of Indian lower crust in the India–Tibet collision zone. Proceedings of the National Academy of Sciences 117 (40), 24742–24747. doi:10.1073/pnas.2000015117
Shi, D., Wu, Z., Klemperer, S. L., Zhao, W., Xue, G., and Su, H. (2015). Receiver function imaging of crustal suture, steep subduction, and mantle wedge in the eastern India–Tibet continental collision zone. Earth and Planetary Science Letters 414, 6–15. doi:10.1016/j.epsl.2014.12.055
Shi, Z., Gao, R., Li, W., Lu, Z., and Li, H. (2020). Cenozoic crustal-scale duplexing and flat Moho in southern Tibet: Evidence from reflection seismology. Tectonophysics 790, 228562. doi:10.1016/j.tecto.2020.228562
Shimojuku, A., Yoshino, T., Yamazaki, D., and Okudaira, T. (2012). Electrical conductivity of fluid-bearing quartzite under lower crustal conditions. Physics of the Earth and Planetary Interiors 198-199, 1–8. doi:10.1016/j.pepi.2012.03.007
Sifre, D., Gardes, E., Massuyeau, M., Hashim, L., Hier-Majumder, G., and Gaillard, F. (2014). Electrical conductivity during incipient melting in the oceanic low-velocity zone. Nature 509 , 81–85. doi:10.1038/nature13245
Sinmyo, R., and Keppler, H. (2017). Electrical conductivity of NaCl-bearing aqueous fluids to 600 °C and 1 GPa. Contributions to Mineralogy and Petrology 172 (1), 4. doi:10.1007/s00410-016-1323-z
Sun, Y. J., Dong, S. W., Zhang, H., Li, H., and Shi, Y. L. (2013). 3D rheological structure of the continental lithosphere beneath China and adjacent regions. Chinese Journal of Geophysics 56 (5), 546–558. doi:10.1002/cjg2.20052
Tapponnier, P., Peltzer, G. L. D. A. Y., Le Dain, A. Y., Armijo, R., and Cobbold, P. (1982). Propagating extrusion tectonics in Asia: New insights from simple experiments with plasticine. Geology 10 (12), 611–616. doi:10.1130/0091-7613(1982)10<611:petian>2.0.co;2
Tapponnier, P., Xu, Z. Q., Roger, F., Meyer, B., Arnaud, N., Wittlinger, G., et al. (2001). Oblique stepwise rise and growth of the Tibet plateau. Science 294, 1671–1677. doi:10.1126/science.105978
Tian, X., Yun, C., Tseng, T. L., Klemperer, S. L., Teng, J., Liu, Z., et al. (2015). Weakly coupled lithospheric extension in southern tibet. Earth and Planetary Science Letters 430, 171–177. doi:10.1016/j.epsl.2015.08.025
Tyburczy, J. A., and Waff, H. S. (1983). Electrical conductivity of molten basalt and andesite to 25 kilobars pressure: Geophysical significance and implications for charge transport and melt structure. Journal of Geophysical Research Solid Earth 88 (B3), 2413–2430. doi:10.1029/jb088ib03p02413
Unsworth, M. J., Jones, A. G., Wei, W., Marquis, G., Gokarn, S. G., Spratt, J. E., et al. (2005). Crustal rheology of the Himalaya and southern Tibet inferred from Magnetotelluric data. Nature 438, 78–81. doi:10.1038/nature04154
Vozar, J., Jones, A. G., Fullea, J., Agius, M. R., Lebedev, S., Le Pape, F., et al. (2014). Integrated geophysical-petrological modeling of lithosphere-asthenosphere boundary in central Tibet using electromagnetic and seismic data. Geochemistry, Geophysics, Geosystems 15 (10), 3965–3988. doi:10.1002/2014gc005365
Wang, J-Y., and Huang, S-P. (1990). Compilation of heat flow data in the China continental area. SEISMOLOGY AND EGOLOGY 12 (4), 351. doi:10.6038/cjg20160815
Wang, R., Richards, J., Hou, Z. Q., Yang, Z. M., and Dufrane, S. A. (2013). Increased magmatic water content-the key to oligo-miocene porphyry CuMo±Au formation in the eastern Gangdese Belt, Tibet. Economic Geology 109, 1315–1339. doi:10.2113/econgeo.109.5.1315
Wang, G., Wei, W., Ye, G., Jin, S., Jing, J., Zhang, L., et al. (2017). 3-D electrical structure across the Yadong-Gulu rift revealed by magnetotelluric data: New insights on the extension of the upper crust and the geometry of the underthrusting Indian lithospheric slab in southern Tibet. Earth and Planetary Science Letters 474, 172–179. doi:10.1016/j.epsl.2017.06.027
Wang, H., Wright, T. J., Liu-Zeng, J., and Peng, L. (2019). Strain rate distribution in south-central tibet from two decades of insar and gps. Geophysical Research Letters 46, 5170–5179. doi:10.1029/2019gl081916
Wang, X., Zhang, J., Rushmer, T., Adam, J., Turner, S., and Xu, W. (2019). Adakite-like potassic magmatism and crust-mantle interaction in a postcollisional setting: An experimental study of melting beneath the Tibetan Plateau. Journal of Geophysical Research Solid Earth 124, 12782–12798. doi:10.1029/2019JB018392
Watanabe, T. (2013). Effects of water and melt on seismic velocities and their application to characterization of seismic reflectors. Geophysical Research Letters 20 (24), 2933–2936. doi:10.1029/93gl03170
Wei, W., Unsworth, M., Jones, A., Booker, J., Tan, H., Nelson, D., et al. (2001). Detection of widespread fluids in the Tibetan crust by Magnetotelluric studies. Science 292 (5517), 716–719. doi:10.1126/science.1010580
Wei, W. B., Martyn, U., Jin, S., Ye, G. F., Deng, M., Tan, H. D., et al. (2006). Conductivity structure of crust and upper mantle beneath the northern Tibetan Plateau: Results of superwide band magnetotelluric sounding. Chinese J. Geophysics 49 (4), 1098–1110
Wessel, P., and Smith, W. (1998). New, improved version of generic mapping tools released. Eos Trans AGU 79, 579. doi:10.1029/98eo00426
Williams, H. M., Turner, S. P., Kelley, S. P., and Harris, N. B. W. (2001). Age and composition of dikes in Southern Tibet: New constraints on the timing of east-west extension and its relationship to postcollisional volcanism. Geology 29, 339–342. doi:10.1130/0091-7613(2001)029<0339:aacodi>2.0.co;2
Worzewski, T. W., Jegen, M. D., Kopp, H., Brasse, H., and Taylor, W. (2010). “The cycle of hydration and fluid release in the Costa Rican subduction zone imaged through electromagnetic soundings: Where has all the water gone? (Invited talk),” in AGU Fall Meeting Abstracts, SanFrancisco, California, December 13–17, 2010.
Xie, C., Jin, S., Wei, W., Ye, G., Jing, J., Zhang, L., et al. (2016). Crustal electrical structures and deep processes of the eastern Lhasa terrane in the south Tibetan plateau as revealed by magnetotelluric data. Tectonophysics 675, 168–180. doi:10.1016/j.tecto.2016.03.017
Xie, C., Jin, S., Wei, W., Ye, G., Zhang, L., Dong, H., et al. (2017). Varying Indian crustal front in the southern Tibetan Plateau as revealed by magnetotelluric data. Earth, Planets and Space 69 (1), 147–217. doi:10.1186/s40623-017-0734-z
Xu, Z., Yang, J., Li, H., Zhang, J., Zeng, L., and Jiang, M. (2006). The plateau and continental dynamics: A QinghaiTibet review on terrain tectonics, collisional orogenesis, and processes and mechanisms For the rise of the plateau[J]. Geol. China 33 (2), 221–238.
Yang, X., Keppler, H., McCammon, C., Ni, H., Xia, Q., and Fan, Q. (2011). Effect of water on the electrical conductivity of lower crustal clinopyroxene. Journal of Geophysical Research 116, B04208. doi:10.1029/2010jb008010
Yang, Y., Ritzwoller, M. H., Zheng, Y., Shen, W., Levshin, A. L., and Xie, Z. (2012). A synoptic view of the distribution and connectivity of the mid-crustal low velocity zone beneath Tibet. Journal of Geophysical Research 117, B04303. doi:10.1029/2011JB008810
Yin, A., and Harrison, T. M. (2000). Geologic evolution of the Himalayan–Tibetan orogen. Annu. Rev. Earth Planet. Sci. 28, 211–280. doi:10.1146/annurev.earth.28.1.211
Yin, A., and Taylor, M. H. (2011). Mechanics of V-shaped conjugate strike-slip faults and the corresponding continuum mode of continental deformation. Bulletin 123 (9–10), 1798–1821. doi:10.1130/b30159.1
Yin, A. (2000). Mode of Cenozoic east–west extension in Tibet suggesting a common origin of rifts in Asia during the Indo- Asian collision. J Geophys Res 105, 21745–21759. doi:10.1029/2000jb900168
Yoshino, T., and Noritake, F. (2011). Unstable graphite films on grain boundaries in crustal rocks. Earth and PlanetarySciencedoi 306, 186–192. doi:10.1016/j.epsl.2011.04.003
Yoshino, T., Matsuzaki, T., Shatskiy, A., and Katsura, T. (2009). The effect of water on the electrical conductivity of olivine aggregates and its implications for the electrical structure of the upper mantle. Earth and Planetary Science Letters 288 (1-2), 291–300. doi:10.1016/j.epsl.2009.09.032
Zhang, Z. J., and Klemperer, S. L. (2005). West-east variation in crustal thickness in northern Lhasa block, central Tibet, from deep seismic sounding data. J. Geophys. Res., Solid Earth 110, B09403. doi:10.1029/2004jb003139
Zhang, X., and Zhao, L. (2003). Aeromagnetic anomaly and Curie study of qinghai-tibet plateau. Geodesy and Geodynamics 23 (4), 7.
Zhang, B., Yoshino, T., Wu, X., Matsuzaki, T., Shan, S., and Katsura, T. (2012). Electrical conductivity of enstatite as a function of water content: Implications for the electrical structure in the upper mantle. Earth and Planetary Science Letters 357-358, 11–20. doi:10.1016/j.epsl.2012.09.020
Zhang, Z., Chen, Y., Yuan, X., Tian, X., Klemperer, S. L., Xu, T., et al. (2013). Normal faulting from simple shear rifting in South Tibet, using evidence from passive seismic profiling across the Yadong-Gulu Rift. Tectonophysics 606, 178–186. doi:10.1016/j.tecto.2013.03.019
Zhang, B. H., Guo, X., Yoshino, T., and Xia, Q. K. (2021). Electrical conductivity of melts: Implications for conductivity anomalies in the Earth's mantle. National Science Review 8, nwab064. doi:10.1093/nsr/nwab064
Zhang, L. T. (2017). A review of recent developments in the study of regional lithospheric electrical structure of the Asian continent. Surveys in Geophysics 38, 1043–1096. doi:10.1007/s10712-017-9424-4
Zhao, J. M., Yuan, X. H., Liu, H. B., Kumar, P., Pei, S. P., Kind, R., et al. (2010). The boundary between the Indian and Asian tectonic plates below Tibet. Proc. Natl. Acad. Sci. U. S. A. 107, 11229–11233. doi:10.1073/pnas.1001921107
Zhu, L. P., and Helmberger, D. V. (1996). Intermediate depth earthquakes beneath the India–Tibet collision zone. Geophys. Res. Lett. 23, 435–438. doi:10.1029/96gl00385
Zhu, D. C., Zhao, Z. D., Niu, Y., Mo, X. X., Chung, S. L., Hou, Z. Q., et al. (2011). The Lhasa terrane: Record of a microcontinent and its histories of drift and growth. Earth and Planetary Science Letters 301, 241–255. doi:10.1016/j.epsl.2010.11.005
Zhu, D. C., Wang, Q., Zhao, Z. D., Chung, S. L., Cawood, P. A., Niu, Y., et al. (2015). Magmatic record of India-Asia collision. Scientific reports 5 (1), 14289–9. doi:10.1038/srep14289
Keywords: Tibetan plateau, magnetotellurics, thermal state, lithospheric electrical structure, tectonic dynamics
Citation: Lei L, Jin S, Dong H, Wei W, Ye G and Zhang L (2023) 3-D electrical structure and tectonic dynamics in the Yangbajing area based on the array magnetotelluric data. Front. Earth Sci. 10:1089675. doi: 10.3389/feart.2022.1089675
Received: 04 November 2022; Accepted: 08 December 2022;
Published: 05 January 2023.
Edited by:
Zhanwu Lu, Chinese Academy of Geological Sciences, ChinaCopyright © 2023 Lei, Jin, Dong, Wei, Ye and Zhang. This is an open-access article distributed under the terms of the Creative Commons Attribution License (CC BY). The use, distribution or reproduction in other forums is permitted, provided the original author(s) and the copyright owner(s) are credited and that the original publication in this journal is cited, in accordance with accepted academic practice. No use, distribution or reproduction is permitted which does not comply with these terms.
*Correspondence: Sheng Jin, MTk5MzAxMDgzMEBjdWdiLmVkdS5jbg==
†ORCID: Lulu Lei, orcid.org/0000-0001-8251-1936; Sheng Jin, orcid.org/0000-0001-6336-5785