 Gunag Liu1
 Zhilong Zhang
- 1College of Civil Engineering and Architecture, Xinjiang University, Ürümqi, China
- 2CSCEC Xinjiang Construction & Engineering Group Co. Ltd., Ürümqi, China
Due to the fact that the permeability coefficient of salinized frozen soil is difficult to measure through experimental test, this paper develops a model of the permeability coefficient of salinized frozen soil by using SFCC curves, which takes into account the effects of velocity slip on pore wall and seepage of unfrozen water film. This model is on the basis of capillary bundle model, and combines with phase diagram theory of water-salt binary system. For the silty clay from Qinghai-Tibet Plateau and silts from Onedia, the permeability coefficient fluctuation vs. temperature is calculated using the model. The estimated calculations of the permeability coefficient model were all found to be in good agreement with the experimental data by comparison. Additionally, the variation trend of permeability coefficient of NaCl, Na2SO4, and Na2CO3 type saline soils containing different salt contents is examined. The results indicate that before saline soils freeze, NaCl does not crystallize and thus has little impact on the permeability coefficient, whereas Na2SO4 and Na2CO3 both crystallize and block the pores, the permeability coefficient decreases with decreasing temperature. Once the saline soils have frozen, the freezing temperature has a larger impact on the permeability coefficient. During the early stage of freezing, the lower the freezing temperature is, the larger the permeability coefficient is. In the late stage of freezing, the permeability coefficients with various salt contents tended to be the same.
1 Introduction
The distribution of frozen soil and saline soils in northwest and northeast China largely overlaps (Zhang et al., 2015; Wang et al., 2019), and the soils in this area are generally referred to as saline frozen soil and salinized frozen soil. Therefore, the salinized frozen soil contains the traits of saline and frozen soil soils, and the soil deformation is influenced by both salt and moisture. As a result, the infrastructure constructed in salinized frozen soil regions is extremely vulnerable to diseases, which are primarily brought on by salt expansion and freezing. The existing study (Bing et al., 2015; Lai et al., 2021) have shown that water migration plays an important role in the freezing and thawing of frozen soil and the salt swelling and dissolution of saline soils. Further, the permeability coefficient is a key factor affecting water migration, and thus it is an important influencing factor in the study of the frost damage mechanism of infrastructure in cold regions, whether in normal frozen soil or saline frozen soil. Besides, the permeability coefficient is also a crucial component in numerous numerical models of frozen soil, including the hydrothermal coupled model (Taylor and Luthin, 1978; Zhang et al., 2021a), the hydrothermal salt coupled model (Zhang et al., 2021b; Liu et al., 2021), the hydrothermal force coupled model (Deng et al., 2021), and the hydrothermal salt force coupled model (Xu, 2021).
There have been relatively few researches conducted on the permeability coefficient of saline frozen soil, but researchers made some progress in the permeability coefficient of frozen soil. The studies are concentrated on two key points as follows: the first one is, experiments were used to directly quantify the permeability coefficient of frozen soil. In 1976, Burt and Williams (Burt and Williams, 1976) employed lactose solution for the first time to measure the head difference between two places and the flux in order to determine the permeability coefficient of frozen soil. After that, the most used method for indirectly determining the permeability coefficient of frozen soil is the seepage of antifreeze solution in the soil (Andersland et al., 1996; Tokoro et al., 2010; Watanabe and Osada, 2016). However, the experiments are difficult and the errors are large because the seepage flow is too small to be measured by weighing. The second one is, using empirical formulas to predict the permeability coefficient, and to avoid the challenges of measuring the permeability coefficient in the laboratory, empirical formulas are frequently used to predict the permeability coefficient of frozen soil. There are numerous formulas to describe the parameters of permeability coefficient, mostly including the variables saturation
In conclusion, due to the constraints of utilizing empirical formulas, it is challenging to measure the permeability coefficients of frozen soil soils by experimental methods, and the permeability coefficients of salinized frozen soil are rarely reported. In this paper, starting from the thermodynamic theory of water film at the ice-water interface on the surface of soil particles and Gibbs-Thomson equation, a theoretical model of frozen soil permeability coefficient is proposed by using Navier-Stokes equation and Hagen-Poiseuille equation, which combines with the soil SFCC curve and based on the obtained unfrozen water film thickness of frozen pores and the critical radius of unfrozen pores. Besides, experimental tests are used to confirm the validity of the present model. To further develop the precast ability of the proposed model, the solution phase diagram of the water-salt binary system was used to analyze the effect of salt crystallization in the soil pores prior to freezing on the permeability coefficient of frozen soil, and the permeability coefficient model of salinized frozen soil is established by modifying the permeability coefficient model of frozen soil.
In the salt freezing swelling model, the permeability coefficient is a key parameter to analyze the amount of water and salt migration and accumulation, which is conducive to accurately predict the deformation of salinized frozen soil. Therefore, it is significant to obtain the permeability coefficient change during the cooling process. The model in this article effectively combines unfrozen water, temperature, and permeability coefficient and can be used to analyze the relationship between permeability coefficient and temperature. It also provides key model parameters for the study of the salt freezing swelling model and serves as a guidance and reference for projects aimed at preventing salt freezing swelling in cold areas (Peng et al., 2021; Peng et al., 2022).
2 Model establishment of the permeability coefficient of saline frozen soil
In the study of water diffusion and seepage in porous media, the capillary bundle model, a standard model to represent the internal pore structure of porous media, is crucial. The Hagen-Poiseuille equation and the Navier-Stokes equation serve as the foundation for this model. Based on the experimentally determined frozen soil SFCC curve, and considering the influence of the pore wall and unfrozen water film on water seepage in frozen soil, the permeability coefficient of saturated frozen soil is deduced as a function of initial water content and temperature.
2.1 Capillary seepage in frozen soil
The pores in soil are viewed as a network of vertical capillary tubes. The water flow in the capillary can be characterized as a laminar flow with a parabolic flow velocity distribution since the soil water percolates slowly. Without taking into account the slip of water on the pore wall, the flow velocity distribution of water passing through a capillary pore with the radius of R and length of H under pressure gradient
At the radius of r, the micro ring flow of the width of dr is
where q is the total flow of water in a capillary tube of radius R;
Due to the velocity slip phenomena, as seen in Figure 1, the liquid velocity in the capillary channel close to the wall is not zero,
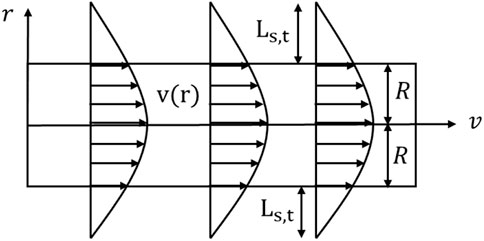
FIGURE 1. Distribution of capillary flow velocity (considering slip).
David M. Huang (Huang et al., 2008) measured the slip length of water flow wall at various contact angles, and found that the real slip length of water
At the same time, the critical thickness can be used to compute the effective viscosity
where
An enhancement factor is introduced, which is defined as the ratio of the measured water flux to the water flux q when no slip is considered, to examine the impact of the velocity slip phenomena on the water flux.
As the curve shown in Figure 2, The pore radius is inversely related to the enhancement factor, and the smaller the pore, the larger the enhancement factor. When the pore radius is less than 100 nm, the trend of decreasing enhancement factor gradually accelerates, indicating that the effect of velocity slip on water flux gradually increases. Relevant researches indicate that soil pore with a radius of less than 100 nm make up more than half of all soil pores (Sasanian and Newson, 2013), thus it is crucial to account for effective water viscosity and the velocity slip phenomenon when calculating the soil seepage volume.
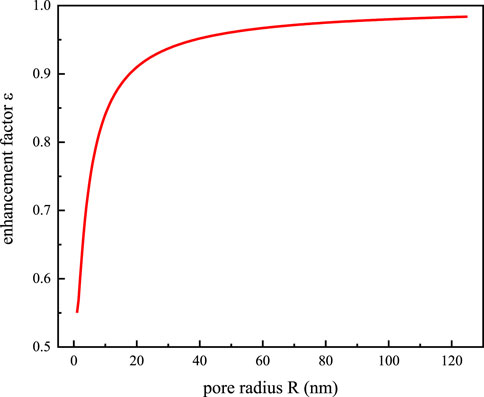
FIGURE 2. Pore radius variation versus enhancement factor.
2.2 Filtration in unfrozen water film of frozen soil soils
The fluid in large pore in the soil freezes when the temperature drops below the freezing point, but the water near the pore wall and in the small pore doesn’t freeze because of the surface tension on pore wall (van der Waals force). On this basis, the of pores can be divided into two categories: the frozen pores and unfrozen pores. Water film seepage not only includes the capillary seepage resulting from frozen pore, but also includes the water film seepage induced by frozen pore.
At temperature T, when a capillary tube is frozen with a radius of R, the film flow velocity distribution of unfrozen water calculated by the Navier-Stokes equation yields the following results (Watanabe and Flury, 2008; Ming et al., 2022)
Besides, in the r direction, the film seepage flux of unfrozen water
The following equation can be used to determine the thickness of unfrozen water film d (Dash et al., 1995; Ishizaki et al., 1996) and the connection between temperature T and pore radius R (Mitchell et al., 2008)
where, A is the Hamaker constant,
A graph of the ratio of
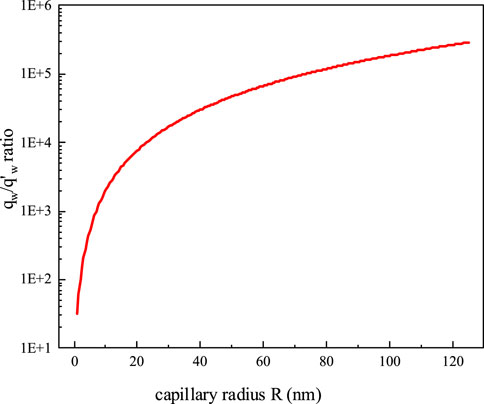
FIGURE 3. The relationship of the ratio and capillary tube radius.
2.3 Permeability coefficient model of frozen soil
As depicted in Figure 4, the pores in soil are simplified as capillary tubes with different radiuses. Using the SFCC curve (unfrozen water content is treated as a function of temperature T), it is assumed that the temperature interval [
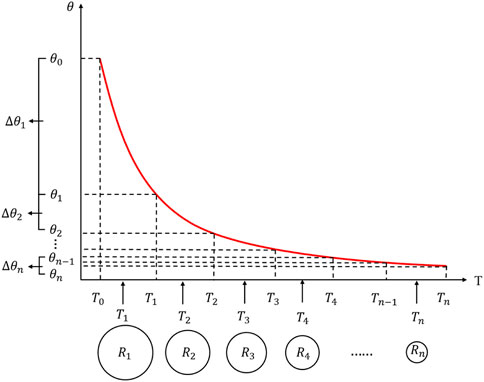
FIGURE 4. The illustration of permeability coefficient model for frozen soil.
At the meantime, the water migration path is idealized to occur in a curving capillary. Assuming that the frozen soil has a length of L and a height of H (H<L), and combining Eqs. 15, 16, the water flux of frozen soil can be described as:
where: j=0, 1, 2,..., n-1, and the corresponding j rises by one for each temperature interval of temperature decrease;
Assuming that water seepage in frozen soil follows Darcy’s law, Eq. 17 can be combined to determine the permeability coefficient of frozen soil per unit area.
According to Eq. 18, when j=0, K is the permeability coefficient of the melted soil under the same conditions. The water in the melted soil primarily flows in large pores, and the pore walls almost have no effect on water flow which can be disregarded. The permeability coefficient of melted soil can then be written as:
Consequently, the frozen soil permeability coefficient can also be expressed as:
2.4 Permeability coefficient model of saline soils
It is required to examine the impact of the amount of salt crystallization on the permeability coefficient in order to adapt the permeability coefficient model of frozen soil to saline frozen soil. The freezing temperature curve of ice, AB, which is the precipitation ice line, and the solubility curve of salt, BC, which is the precipitation salt line, intersect at the eutectic point B, as the phase diagram of the water-salt binary system with three salts, Na2CO3, Na2SO4, and NaCl shown in Figure 5 The precipitation ice line, precipitation salt line, and eutectic point separate the solution phase diagram into four areas, i.e. the unsaturated salt solution, ice-salt solution, ice-crystalline salt, and crystalline salt-salt solution. The phase diagram can be used to predict the direction of several changes that will take place in the system during the temperature lowering process. It is possible to determine the order of phase change, freezing temperature, eutectic temperature, eutectic concentration, and other important parameters of saline soils during the process of temperature reduction and further analyze the amount of salt crystallization. In Table 1, the values of specific parameters during the crystallization of various salt solutions are given.
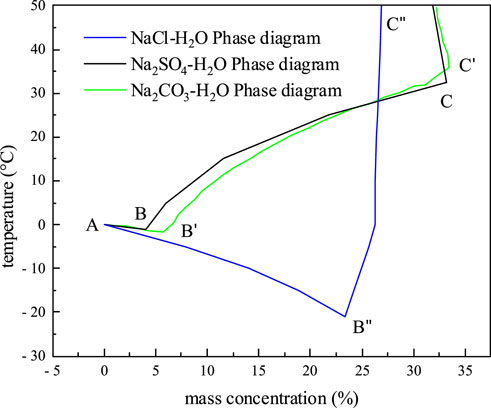
FIGURE 5. The phase diagram of water-salt binary system.

TABLE 1. Physicochemical characteristics of crystalline salts.
Through electron microscopy, Jing Zhao (Zhao and Luo, 2019) discovered that the salt solution in the pores gradually increases in salt crystallization as the temperature decreases. These salt crystals adsorb around the pores, and gradually reduce the pore size. As a result, the permeability coefficient model of impregnated frozen soil only needs to be modified the
If it is assumed that the salt solution is contained in a capillary tube with a radius of
where, C is the initial mass concentration of solution, C′ is the subsequent mass concentration of solution after cooling,
Assuming that the salt crystals are evenly deposited on the pore walls after salt precipitation, the quantity of salt crystallization equals the amount of variation in the pore:
Once the temperature is lowered to the eutectic temperature, the pore solution in soil mass gradually freezes. Since the solubility of salt does not significantly change, the concentration of the salt solution in the pore after the soil freezes is regarded as the eutectic concentration. Eq. 24 can be used to obtain the freezing temperature
In conclusion, in this permeability coefficient model of salinized frozen soil, only the SFCC curve of frozen soil and the permeability coefficient of frozen soil need to be precise measured under the same conditions as well as the phase diagram of salt solution. Then the variation relationship between the permeability coefficient of frozen soil and temperature can be theoretically analyzed, as well as the variation relationship between the permeability coefficient of salinized soil.
3 Calculation of permeability coefficient model
3.1 Verification of permeability coefficient model of frozen soil
As seen in Figure 6, the unfrozen water content of the silty clays from the Tibetan plateau and the silt from Oneida fluctuates with temperature (Burt and Williams, 1976; Hu et al., 2016), and the initial volumetric water contents of the two soils are 50% and 48%, respectively. The unfrozen water content decreases with decreasing temperature, and there is a general power function relationship between the two parameters. The measured temperature of data points ranges from 0 to -5°C. In order to improve prediction capacity of the proposed model, the whole SFCC curve can be derived for by fitting the functional relationship between the above two parameters.
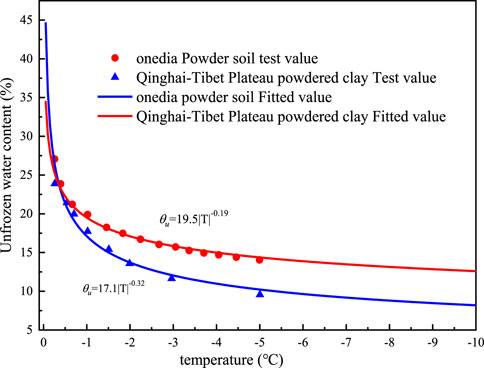
FIGURE 6. The relationship of unfrozen water content and temperature.
As depicted in Figure 7, at the temperatures above −2°C, the difference between the calculated results from the model that takes the influence of an unfrozen water film into account and that does not is relatively minimal. In both cases, the predicted values of the proposed model essentially follow the trend of the test results of soil. When the temperature drops to −5°C, there is a discrepancy between the calculated results of the two models of around one time, and when the temperature drops to −10°C, there is a difference of about nine times. The primary explanation is that, when considering the seepage of unfrozen water film, as temperature decreases, pore water gradually freezes. As a result, the seepage of unfrozen water film eventually occupies the leading position of frozen soil water seepage.
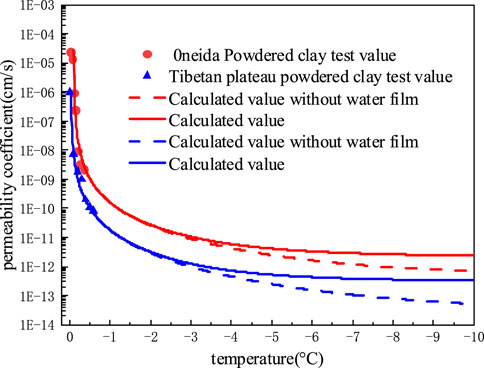
FIGURE 7. The relationship of permeability coefficient and temperature.
The relevant research (Burt and Williams, 1976; Chen and Zhang, 2020) shows that when the temperature is higher than −2°C, the soil still contains a lot of unfrozen water, the soil permeability coefficient is large, and the water salinity still has a certain seepage capacity; When the temperature is lower than −2°C, the content of unfrozen water is greatly reduced, the permeability coefficient of soil is small, and the water salinity almost does not percolate. Therefore, the influence of unfrozen water film seepage is ignored in the calculation of permeability coefficient model of saline frozen soil. In the salt frost heaving model, when the temperature is lower than −2°C, the calculated result of the model considering the seepage permeability coefficient of unfrozen water film is larger, so the calculated salt frost heaving deformation is larger. This may be conducive to accurate analysis of frost heave deformation of salinized salt.
3.2 Permeability coefficient of NaCl saline soil
As noted in Table 1, the eutectic temperature of NaCl solution is −21.1
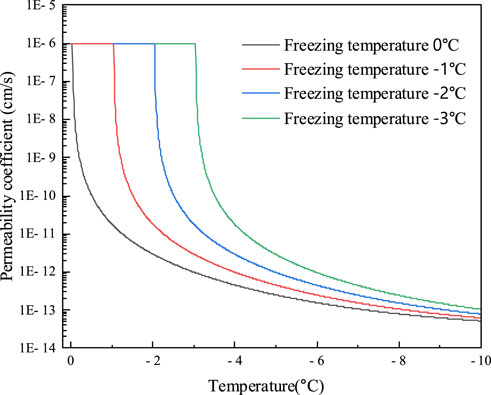
FIGURE 8. Variation in temperature-permeability coefficient relationships for different NaCl concentrations.
3.3 Permeability coefficient of Na2SO4 saline soil
Since Na2SO4 will precipitate before the soil freezes and thus has a less substantial impact on the freezing temperature of the soil than NaCl. Table 1 demonstrates that the eutectic temperature of Na2SO4 solution is -1.2°C and the eutectic concentration is 4%. The Na2SO4 solutions comprising 2%, 4%, 6%, and 8% salt were fabricated, and the mass concentrations of the pore solutions of the powdered clay samples from the Qinghai-Tibet Plateau are 6.01%, 11.34%, 16.11%, and 20.38%, respectively. Due to the presence of supersaturation of the pore solution concentration after freezing, it is difficult to calculate the first freezing temperature using the Pizter theory. Thus, the initial freezing temperature of the soil will be determined using existing studies (Wan et al., 2015; Xiao et al., 2018). Before the soil freezes, salt will precipitate from the Na2SO4 solution during the dropping process of temperature, causing the permeability coefficient to start to fall. This is shown in Figure 9 and Figure 10 for the computation of the permeability coefficient model for sodium sulfate-saline soils. The beginning temperature for salt precipitation increases along with the Na2SO4 content, as does the volume of precipitated mannite. The permeability coefficient of the soil with an 8% salt concentration steadily drops to 4.25
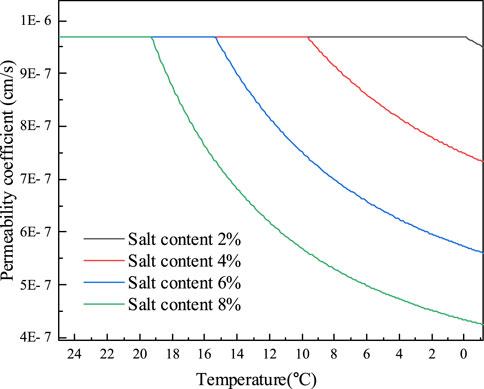
FIGURE 9. The variation of permeability coefficient of Na2SO4 saline soil with temperature before soil freezing.
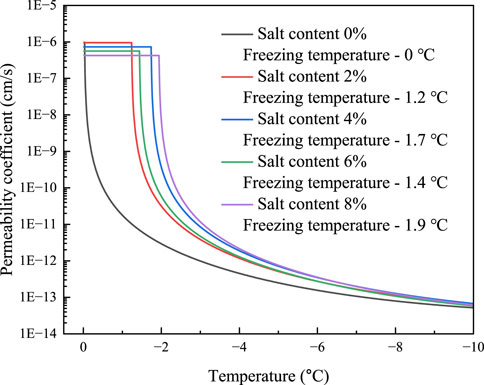
FIGURE 10. The variation of permeability coefficient of Na2SO4 saline soil with temperature after soil freezing.
3.4 Permeability coefficient of Na2CO3 saline soil
Na2CO3 will crystallize and precipitate before the soil freezes, as indicated in Table 1, where the eutectic temperature of the solution is -1.8°C and the eutectic concentration is 5.8%. The permeability coefficient of Na2CO3 saline soils is calculated using the method for Na2SO4 saline soils due to the similarity between these two solutions. The initial freezing temperature of the soils is determined from experiment (Hui and Wei, 2011). The powdered clay soils of the Tibetan plateau, with mass concentrations of 6.01%, 11.34%, 16.11%, and 20.38% are manufactured, and pore solutions are prepared using salt concentrations of 2%, 4%, 6%, and 8%. The calculation results of the permeability coefficient of sodium carbonate saline soils are given in Figures 11, 12. The findings show that the soils with 2% salt content do not crystallize before freezing and that the permeability coefficient remains constant. During the decreasing process of temperature, salt gradually precipitates in the pores of soil with salt contents of 2%, 4%, and 6%, and the permeability coefficient of the soil gradually declines. Likewise, the higher the soil’s salt content, the higher the temperature at which the salt begins to precipitate out, and the lower the permeability coefficient at the same temperature. The permeability coefficient of soil with an 8% salt content drops by around 41%, from 9.68 10−7 cm/s to 5.66 10−7 cm/s. When the soil freezes, the permeability coefficient is comparatively larger under the same temperature conditions and the amount of unfrozen water increases due to the higher Na2CO3 content and lower initial freezing temperature.
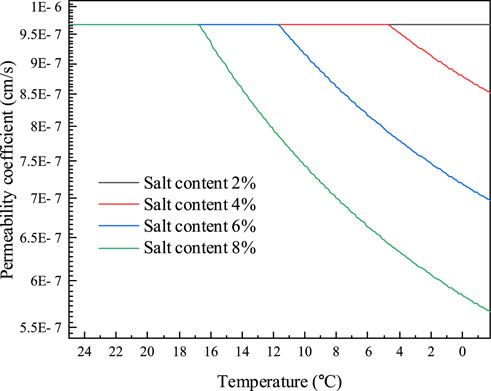
FIGURE 11. The variation of permeability coefficient of Na2CO3 saline soil and temperature before soil freezing.
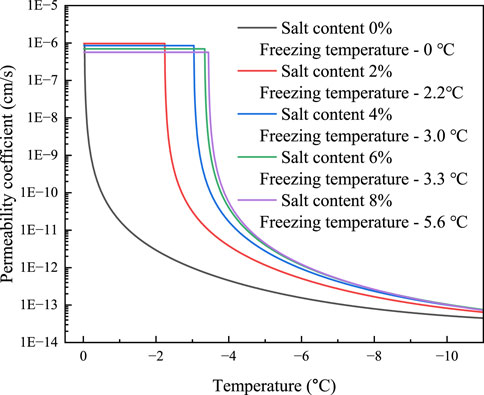
FIGURE 12. The variation of permeability coefficient of Na2CO3 saline soil and temperature after soil freezing.
4 Discussion
On the basis of the thermodynamic theory of water film (Dash et al., 1995) and Gibbs-Thomson equation (Mitchell et al., 2008), the soil pores are simplified to capillary tubes, and the Navier-Stokes equation and Hagen-Poiseuille equation are combined with experimental data to obtain SFCC. Then, a model of the permeability coefficient of frozen soil that takes into account the effect of film seepage of unfrozen water is established, which was compared with the experimental results and shows a good reliability. At the same time, there are many areas that need further study.
1) In order to fill the gap in the theoretical analysis of the permeability coefficient of saline soil, the permeability coefficient model of saline frozen soil was developed on the basis of the frozen soil permeability coefficient model. This model considers the effects of sodium chloride, sodium sulfate, and sodium carbonate contents on freezing temperature as well as the effects of salt crystallization blocking pore space using the phase diagram theory of water-salt binary system. It is difficult to measure the permeability coefficient of salinized frozen soil soils and there are few related studies. The existing studies only measured the permeability coefficients of different salt contents under positive temperature conditions (Deng et al., 2006) and unfrozen water content curves (Ma et al., 2016). This paper also only theoretically analyzes the trend of permeability coefficients in saline soils during temperature reduction, so the credibility of the model results needs to be further confirmed by experiments.
2) There is a certain error between the permeability coefficient at the initial stage of freezing and the measured permeability coefficient. The reason may be that the power function form is used to fit the SFCC curve (Anderson and Tice, 1972; Chai et al., 2018), which tends to be infinite near 0°C, and it cannot accurately reflect the unfrozen water content, so there is a certain error. Therefore, the model should be modified by measuring the permeability coefficient of the melted soil.
3) The adsorption and desorption of particle components to soil particles are related to several factors such as temperature, soil structure, particle type, etc. (Bai et al., 2021; Bai et al., 2022) Considering the complexity of particle adsorption and desorption, this paper does not consider particle adsorption and desorption in analyzing the percolation of salt solution in soil during temperature reduction. The theory of particle adsorption and desorption can be combined with the theory of permeability coefficient in this paper, which may have some application prospects in the analysis of soil pollutant diffusion. At the same time, after the salt solution is added to the soil, the particles adsorb on the surface of soil particles, and the pore solution concentration is bound to decrease, which has a certain influence on the freezing temperature of the soil and the amount of salt crystallization, and considering this issue will make the permeability coefficient model of salinized frozen soil more reasonable.
4) In the present day machine learning methods are heavily applied to the assessment of slope stability (Chang et al., 2020; Huang et al., 2020c), the permeability coefficient as one of the important parameters of the soil is greatly associated with the slope landslide (Jian et al., 2016; Hongwei and Fan, 2021), and the freezing process of the frozen soil is regarded as the drying process of the soil (Spaans and Baker, 1996), and the permeability coefficient of the soil under different water contents can be analyzed by this model, which will be beneficial to the accuracy of the machine learning model in assessing the stability of the slope (Huang et al., 2020a; Huang et al., 2020b). At the same time, the permeability coefficient is an important parameter in the multi physical field coupling model of soil mass, which has certain advantages in analyzing the mechanical properties and deformation of soil mass in the process of underground mineral mining (Li et al., 2022; Tang et al., 2023). In other porous media, the method of this model can be used to analyze the permeability coefficients of different porous materials and different pore solution contents, which has a broad application prospect.
5 Conclusion
1) By comparing the calculation results of the model with and without considering the unfrozen water film, it is found that: When the temperature drops to −5°C, there is a discrepancy between the calculated results of the two models of around one time, and when the temperature drops to −10°C, there is a difference of about nine times. Since the permeability coefficient of soil mass is too small after the temperature is reduced to −2°C, it is not significant to consider the permeability of unfrozen water film.
2) Before the soil freezes, the type of salt is the primary factor impacting the permeability coefficient. In this condition, NaCl does not crystallize and has no influence on the permeability coefficient. For sodium sulfate and sodium carbonate, which are crystallizable salts with similar properties, when the salt content is high, the salt will crystallize when the soil is not frozen, and the permeability coefficient of the soil with salt crystallization starts to decrease. The higher the salt content, the faster the decreasing rate.
3) After the soil freezes, the permeability coefficient is directly impacted by the freezing temperature. the lower the beginning freezing temperature, the larger the permeability coefficient. Because different types of saline soil have different influences on freezing temperature, the reason may be that the easily crystallized salt precipitates a large amount of salt before the soil freezes. in general, the permeability coefficient of saline soils after freezing is not directly related to the salt concentration.
Data availability statement
The original contributions presented in the study are included in the article/supplementary material, further inquiries can be directed to the corresponding author.
Author contributions
GL’s main task is to collate data and write articles. ZZ is the data provider, fund acquirer and innovation point proposer of this article. ZC mainly provided many valuable suggestions for this article. GH, YH, and TF provided help in the article modification.
Funding
Natural Science Foundation of Xinjiang Uygur Autonomous Region: Research on the Mechanism and Effect of High Temperature Frozen Soil Solidification (2020D01C025), 2020.01-2022.12. The research described in this paper was financially supported by 2020D01C025.
Conflict of interest
The authors YH and TF were employed by CSCEC Xinjiang Construction & Engineering Group Co. Ltd.
The remaining authors declare that the research was conducted in the absence of any commercial or financial relationships that could be construed as a potential conflict of interest.
Publisher’s note
All claims expressed in this article are solely those of the authors and do not necessarily represent those of their affiliated organizations, or those of the publisher, the editors and the reviewers. Any product that may be evaluated in this article, or claim that may be made by its manufacturer, is not guaranteed or endorsed by the publisher.
References
Andersland, O. B., Wiggert, D. C., and Davies, S. H. (1996). Hydraulic conductivity of frozen granular soils. J. Environ. Eng. 122, 212–216. doi:10.1061/(asce)0733-9372(1996)122:3(212)
Anderson, D. M., and Tice, A. R. (1972). Predicting unfrozen water contents in frozen soils from surface area measurements. Highw. Res. Rec. 10, 105. doi:10.1016/0022-4898(73)90017-7
Averjanov, S. F. (1950). About permeability of subsurface soils in case of incomplete saturation. Engl. Collect. 7, 19–21.
Bai, B., Bai, F., Li, X., Nie, Q., Jia, X., and Wu, H. (2022). The remediation efficiency of heavy metal pollutants in water by industrial red mud particle waste. Environ. Technol. Innovation 28, 102944. doi:10.1016/j.eti.2022.102944
Bai, B., Nie, Q., Zhang, Y., Wang, X., and Hu, W. (2021). Cotransport of heavy metals and SiO2 particles at different temperatures by seepage. J. Hydrology 597, 125771. doi:10.1016/j.jhydrol.2020.125771
Bing, H., He, P., and Zhang, Y. (2015). Cyclic freeze-thaw as a mechanism for water and salt migration in soil. Environ. Earth Sci. 74, 675–681. doi:10.1007/s12665-015-4072-9
Burt, T. P., and Williams, P. J. (1976). Hydraulic conductivity in frozen soils. Earth Surf. Process. 1, 349–360. doi:10.1002/esp.3290010404
Chai, M., Zhang, J., Zhang, H., Mu, Y., Sun, G., and Yin, Z. (2018). A method for calculating unfrozen water content of silty clay with consideration of freezing point. Appl. Clay Sci. 161, 474–481. doi:10.1016/j.clay.2018.05.015
Chang, Z., Du, Z., Zhang, F., Huang, F., Chen, J., Li, W., et al. (2020). Landslide susceptibility prediction based on Remote sensing images and GIS: Comparisons of supervised and unsupervised machine learning models. Remote Sens. 12, 502. doi:10.3390/rs12030502
Chen, L., and Zhang, X. (2020). A model for predicting the hydraulic conductivity of warm saturated frozen soil. Build. Environ. 179, 106939. doi:10.1016/j.buildenv.2020.106939
Dash, J. G., Fu, H., and Wettlaufer, J. S. (1995). The premelting of ice and its environmental consequences. Rep. Prog. Phys. 58, 115–167. doi:10.1088/0034-4885/58/1/003
Davidson, J. M., Stone, L. R., Nielsen, D. R., and Larue, M. E. (1969). Field measurement and use of soil-water properties. Water Resour. Res. 5, 1312–1321. doi:10.1029/WR005i006p01312
Deng, Q., Liu, X., Zeng, C., He, X., Chen, F., and Zhang, S. (2021). A freezing-thawing damage characterization method for highway subgrade in seasonally frozen regions based on thermal-hydraulic-mechanical coupling model. Sensors 21 (18), 6251. doi:10.3390/s21186251
Deng, Y., He, P., Zhou, C., Li, Y., Fang, J., Huang, S., et al. (2006). Experimental study of permeability coefficient of saline soils. J. Glaciol. Geocryol. 28, 772–775.
Gardner, R. W. (1958). Some steady-state solutions of the unsaturated moisture flow equation with application to evaporation from a water table. Soil Sci. 85, 228–232. doi:10.1097/00010694-195804000-00006
Holt, J. K., Park, H. G., Wang, Y., Stadermann, M., Artyukhin, A. B., Grigoropoulos, C. P., et al. (2006). Fast mass transport through sub-2-nanometer carbon nanotubes. Science 312, 1034–1037. doi:10.1126/science.1126298
Hongwei, W., and Fan, Z. (2021). Influence of saturated permeability coefficient variation on failure probability of slope. J. South China Univ. Technol. Nat. Sci. Ed. 49, 95–102.
Hu, Z., Jianming, Z., Zhilong, Z., and Mingtang, C. (2016). Measurement of hydraulic conductivity of Qinghai-Tibet Plateau silty clay under subfreezing temperatures. Chin. J. Geotechnical Eng. 38, 1030–1035. doi:10.11779/CJGE201606008
Huang, D. M., Sendner, C., Horinek, D., Netz, R. R., and Bocquet, L. (2008). Water slippage versus contact angle: A quasiuniversal relationship. Phys. Rev. Lett. 101, 226101. doi:10.1103/PhysRevLett.101.226101
Huang, F., Cao, Z., Guo, J., Jiang, S.-H., Li, S., and Guo, Z. (2020a). Comparisons of heuristic, general statistical and machine learning models for landslide susceptibility prediction and mapping. Catena 191, 104580. doi:10.1016/j.catena.2020.104580
Huang, F., Cao, Z., Jiang, S.-H., Zhou, C., Huang, J., and Guo, Z. (2020b). Landslide susceptibility prediction based on a semi-supervised multiple-layer perceptron model. Landslides 17, 2919–2930. doi:10.1007/s10346-020-01473-9
Huang, F., Zhang, J., Zhou, C., Wang, Y., Huang, J., and Zhu, L. (2020c). A deep learning algorithm using a fully connected sparse autoencoder neural network for landslide susceptibility prediction. Landslides 17, 217–229. doi:10.1007/s10346-019-01274-9
Hui, B., and Wei, M. (2011). Experimental study on freezing point of saline soil. J. Glaciol. Geocryol. 33, 1106–1113.
Ishizaki, T., Maruyama, M., Furukawa, Y., and Dash, J. G. (1996). Premelting of ice in porous silica glass. J. Cryst. Growth 163, 455–460. doi:10.1016/0022-0248(95)00990-6
Jian, L., Chen, Z., and Huang, J. (2016). Effects of spatial variability of saturated permeability on slope stability. Eng. J. Wuhan Univ. 49, 831–837.
Lai, Y. M., You, Z. M., and Zhang, J. (2021). Constitutive models and salt migration mechanisms of saline frozen soil and the-state-of-the-practice countermeasures in cold regions. Cold Regions Sci. Technol. 13, 1–17. doi:10.3724/SP.J.1226.2021.00001
Li, X., Wang, Y., Hu, Y., Zhou, C., and Zhang, H. (2022). Numerical investigation on stratum and surface deformation in underground phosphorite mining under different mining methods. Front. Earth Sci. 10, 831856. doi:10.3389/feart.2022.831856
Liu, J., Yang, P., and Yang, Z. (2021). Water and salt migration mechanisms of saturated chloride clay during freeze-thaw in an open system. Cold Reg. Sci. Tech. 186, 103277. doi:10.1016/j.coldregions.2021.103277
Ma, M., Hui, B., and Li, G. (2016). Experimental research on unfrozen water content of sodium sulphate saline soil. J. Glaciol. Geocryol. 38, 963–969. doi:10.7522/j.issn.1000-0240.2016.0110
Ming, F., Pei, W., Zhang, M., and Chen, L. (2022). A hydraulic conductivity model of frozen soils with the consideration of water films. Eur. J Soil Sci. 73, e13210. doi:10.1111/ejss.13210
Mitchell, J., Webber, J. B. W., and Strange, J. H. (2008). Nuclear magnetic resonance cryoporometry. Phys. Rep. 461, 1–36. doi:10.1016/j.physrep.2008.02.001
Peng, E.-X., Hu, X.-Y., Sheng, Y., Wu, J.-C., Cao, W., Yang, Q.-F., et al. (2022). Thermal effect of the accumulated water with different depths on permafrost subgrade in cold regions. Adv. Clim. Change Res. S1674927822000855. doi:10.1016/j.accre.2022.08.003
Peng, E.-X., Sheng, Y., Hu, X.-Y., Wu, J.-C., and Cao, W. (2021). Thermal effect of thermokarst lake on the permafrost under embankment. Adv. Clim. Change Res. 12, 76–82. doi:10.1016/j.accre.2020.10.002
Richards, A. L. (1931). Capillary conduction of liquids through porous mediums. Physics 1, 318–333. doi:10.1063/1.1745010
Sasanian, S., and Newson, T. A. (2013). Use of mercury intrusion porosimetry for microstructural investigation of reconstituted clays at high water contents. Eng. Geol. 158, 15–22. doi:10.1016/j.enggeo.2013.03.002
Scherer, G. W. (1999). Crystallization in pores. Cem. Concr. Res. 29, 1347–1358. doi:10.1016/S0008-8846(99)00002-2
Spaans, E. J. A., and Baker, J. M. (1996). The soil freezing characteristic: Its measurement and similarity to the soil moisture characteristic. Soil Sci. Soc. Am. J. 60, 13–19. doi:10.2136/sssaj1996.03615995006000010005x
Tang, Q., Chen, Y., Jia, R., Guo, W., Chen, W., Li, X., et al. (2023). Effect of clay type and content on the mechanical properties of clayey silt hydrate sediments. J. Petroleum Sci. Eng. 220, 111203. doi:10.1016/j.petrol.2022.111203
Taylor, G. S., and Luthin, J. N. (1978). A model for coupled heat and moisture transfer during soil freezing. Rev. Can. De. Géotechnique 15, 548–555. doi:10.1139/t78-058
Thomas, H. R., and Sansom, M. R. (1995). Fully coupled analysis of heat, moisture, and air transfer in unsaturated soil. J. Eng. Mech. 121, 392–405. doi:10.1061/(asce)0733-9399(1995)121:3(392)
Thomas, J. A., and Mcgaughey, A. (2008). Reassessing fast water transport through carbon nanotubes. Nano Lett. 8, 2788–2793. doi:10.1021/nl8013617
Tokoro, T., Ishikawa, T., and Akagawa, S. (2010). A method for permeability measurement of frozen soil using an ice lens inhibition technique. Jiban Kogaku Janaru 5, 603–613. doi:10.3208/jgs.5.603
Wan, X., Lai, Y., and Wang, C. (2015). Experimental study on the freezing temperatures of saline silty soils: Study on the freezing temperatures of sulfate saline silty soils. Permafr. Periglac. Process. 26, 175–187. doi:10.1002/ppp.1837
Wang, X., Chen, R., Liu, G., Yang, Y., Song, Y., Liu, J., et al. (2019). Spatial distributions and temporal variations of the near-surface soil freeze state across China under climate change. Glob. Planet. Change 172, 150–158. doi:10.1016/j.gloplacha.2018.09.016
Watanabe, K., and Flury, M. (2008). Capillary bundle model of hydraulic conductivity for frozen soil: Capillary Bundle Model for Frozen Soil: Capillary bundle model for frozen soil. Water Resour. Res. 44, 1–9. doi:10.1029/2008WR007012
Watanabe, K., and Osada, Y. (2016). Comparison of hydraulic conductivity in frozen saturated and unfrozen unsaturated soils. Vadose Zone J. 15, 1–7. doi:10.2136/vzj2015.11.0154
Wu, K., Chen, Z., Li, J., Li, X., Xu, J., and Dong, X. (2017). Wettability effect on nanoconfined water flow. Proc. Natl. Acad. Sci. U.S.A. 114, 3358–3363. doi:10.1073/pnas.1612608114
Xiao, B., Tu, X., Ren, W., and Wang, Z. (2015). Modeling for hydraulic permeability and kozeny–carman constant of porous nanofibers using A fractal approach. Fractals 23 (3), 1550029. doi:10.1142/S0218348X15500292
Xiao, Z., Lai, Y., and Zhang, M. (2018). Study on the freezing temperature of saline soil. Acta Geotech. 13, 195–205. doi:10.1007/s11440-017-0537-1
Xu, J., Lan, W., Ren, C., Zhou, X., Wang, S., and Yuan, J. (2021). Modeling of coupled transfer of water, heat and solute in saline loess considering sodium sulfate crystallization. Cold Regions Sci. Technol. 13, 103335. doi:10.1016/j.coldregions.2021.103335
Zhang, X., Wu, Y., Zhai, E., and Ye, P. (2021a). Coupling analysis of the heat-water dynamics and frozen depth in a seasonally frozen zone. J. Hydrology 593, 125603. doi:10.1016/j.jhydrol.2020.125603
Zhang, X., Zhai, E., Wu, Y., Sun, D., and Lu, Y. (2021b). Theoretical and numerical analyses on hydro-thermal-salt-mechanical interaction of unsaturated salinized soil subjected to typical unidirectional freezing process. Int. J. Geomech. 21, 04021104. doi:10.1061/(ASCE)GM.1943-5622.0002036
Zhang, Y., Fang, J. H., Liu, J. K., Xu, A. H., Traffictransportation, S. O., University, L. J., et al. (2015). Research on the distribution of saline soil along the Chaerhan-Golmud Highway, northwestern China. Sci. Cold Arid Regions 7, 189–193. doi:10.3724/SP.J.1226.2015.00189
Keywords: permeability coefficient, unfrozen water content curve, velocity slip, unfrozen water film seepage, salinized frozen soil
Citation: Liu G, Zhang Z, Cheng Z, Hao G, Hao Y and Fu T (2023) Study on the permeability coefficient model of salinized frozen soil based on unfrozen water content curve. Front. Earth Sci. 10:1102748. doi: 10.3389/feart.2022.1102748
Received: 19 November 2022; Accepted: 12 December 2022;
Published: 04 January 2023.
Edited by:
Zizheng Guo, Hebei University of Technology, ChinaReviewed by:
Erxing Peng, Northwest Institute of Eco-Environment and Resources (CAS), ChinaMinghao Liu, Chinese Academy of Sciences (CAS), China
Copyright © 2023 Liu, Zhang, Cheng, Hao, Hao and Fu. This is an open-access article distributed under the terms of the Creative Commons Attribution License (CC BY). The use, distribution or reproduction in other forums is permitted, provided the original author(s) and the copyright owner(s) are credited and that the original publication in this journal is cited, in accordance with accepted academic practice. No use, distribution or reproduction is permitted which does not comply with these terms.
*Correspondence: Zhilong Zhang, emhhbmd6bEB4anUuZWR1LmNu