 Leizhe Ji1
 Gaofeng Ye
 Shuo Wang
- 1School of Geophysics and Information Technology China University of Geosciences, Beijing, China
- 2Beijing Research Institute of Uranium Geology, Beijing, China
- 3Tianjin Huakan Geophysical Exploration Center, Tianjin, China
To study the spatial heterogeneity of the North China Craton (NCC) destruction, this paper used a magnetotelluric sounding (MT) profile that passes through almost the entire NCC from west to east. Three-dimensional inversion is used to obtain a lithospheric resistivity model of the NCC. The results show that the upper crust of the Ordos Block is characterized by high resistivity. The lower crust to the upper mantle is characterized by low resistivity. The resistivity structure below the Trans-North China Orogen (TNCO) has stratification features; The Shanxi Graben shows high-low-high-low resistivity features from the upper crust to the asthenosphere; The lithosphere of the Lüliang and Taihang uplifts show high-resistivity features, and only some local relatively low-resistivity areas appear at the crust-mantle boundary. The upper crust on both sides of the Tan-Lu Fault Zone is characterized by high resistivity, but the resistivity structures of the lower crust and the lithospheric mantle are significantly different; The lower crust and the lithospheric mantle of the Sulu Orogenic Belt on the east are characterized by high resistivity; The Luxi Uplift on the west is represented by low resistivity. We propose that the mantle low-resistivity bodies (C1 and C4) of the Western and Eastern blocks may be related to the upwelling of partial melting materials along the ancient structurally weak zones in the lithosphere. The TNCO still has a typical Archean cratonic lithosphere, and the low-resistivity body C2 may be the remnant of the subducted oceanic crust. The Tan-Lu Fault Zone is structurally weak in the Eastern Block, while its western branch is a channel for the asthenospheric upwelling. We propose that the lithosphere of the northwestern Ordos Block and the Yinchuan-Hetao area is being destructed, and the TNCO is in the initial stage of being destructed. In contrast, the lithosphere of the Eastern Block has been severely destructed. In conclusion, affected by the subduction of the paleo-Pacific plate and the collision of the Indian and Eurasian plates, the ancient structures in the NCC were reactivated in the Mesozoic and Cenozoic, resulting in the spatial heterogeneity of the NCC destruction.
1 Introduction
Cratons are ancient and stable continental tectonic units on Earth. They usually have three characteristics: a thick lithosphere with a crustal thickness of ∼50 km and a lithospheric mantle thickness of ∼150 km (Artemieva and Mooney, 2001), structural stability where is no large-scale magmatic and seismic activity (Wu et al., 2014), and low heat flow values (Davies, 2013). These characteristics can make cratons maintain long-term stability. However, the strength of the cratons is not immutable, as the NCC is a typical representative of destruction and transformation. During the long evolution process, the NCC interacted with its surrounding blocks, forming a series of orogenic belts around it (Figure 1B), such as the Central Asian Orogenic Belt in the north, the Qinling-Dabie Orogenic Belt in the south, the Sulu Orogenic Belt in the east and the Qilian orogenic belt in the west. Compared with other stable cratons, the NCC has experienced complex and multi-stage tectonic processes, magmatism, and metamorphism, and recorded the early development of the crust and almost all major tectonic events in the Mesozoic (Zhu et al., 2011; Zhai, 2019). Especially in the Late Mesozoic and Cenozoic, the NCC underwent extensive tectonic-thermal reactivation, followed by craton destruction (Gao et al., 2004; Rudnick et al., 2004). The most significant superficial response to this deep process is the heterogeneous distribution of Mesozoic and Cenozoic magmatism activity and surface heat flow values (Zhu et al., 2011; Jiang et al., 2019). Since the Late Mesozoic, the westward subduction of the paleo-Pacific plate caused an imbalance mantle system beneath Eurasian plates, resulting in a rapid and unstable mantle convection (Zhu et al., 2011), which may have spatial heterogeneity. The inherent characteristics of the craton and the existing ancient weak zones can lead to spatially heterogeneous lithospheric destruction. Because the weak zones are more susceptible to multi-period tectonic-thermal reactivation events due to the intense heating and strain (Tommasi and Vauchez, 2001). At present, the NCC is mainly under the dual dynamic tectonic backgrounds of the subduction of the paleo-Pacific plate to the Eurasian plate in the east and the far-field effect of the continental collision between the Indian and Eurasian plates in the southwest (Ren et al., 2002; Liu et al., 2004). Therefore, the unique lithospheric tectonic evolution and structural characteristics make the NCC one of the best places to study and understand the geodynamic system.
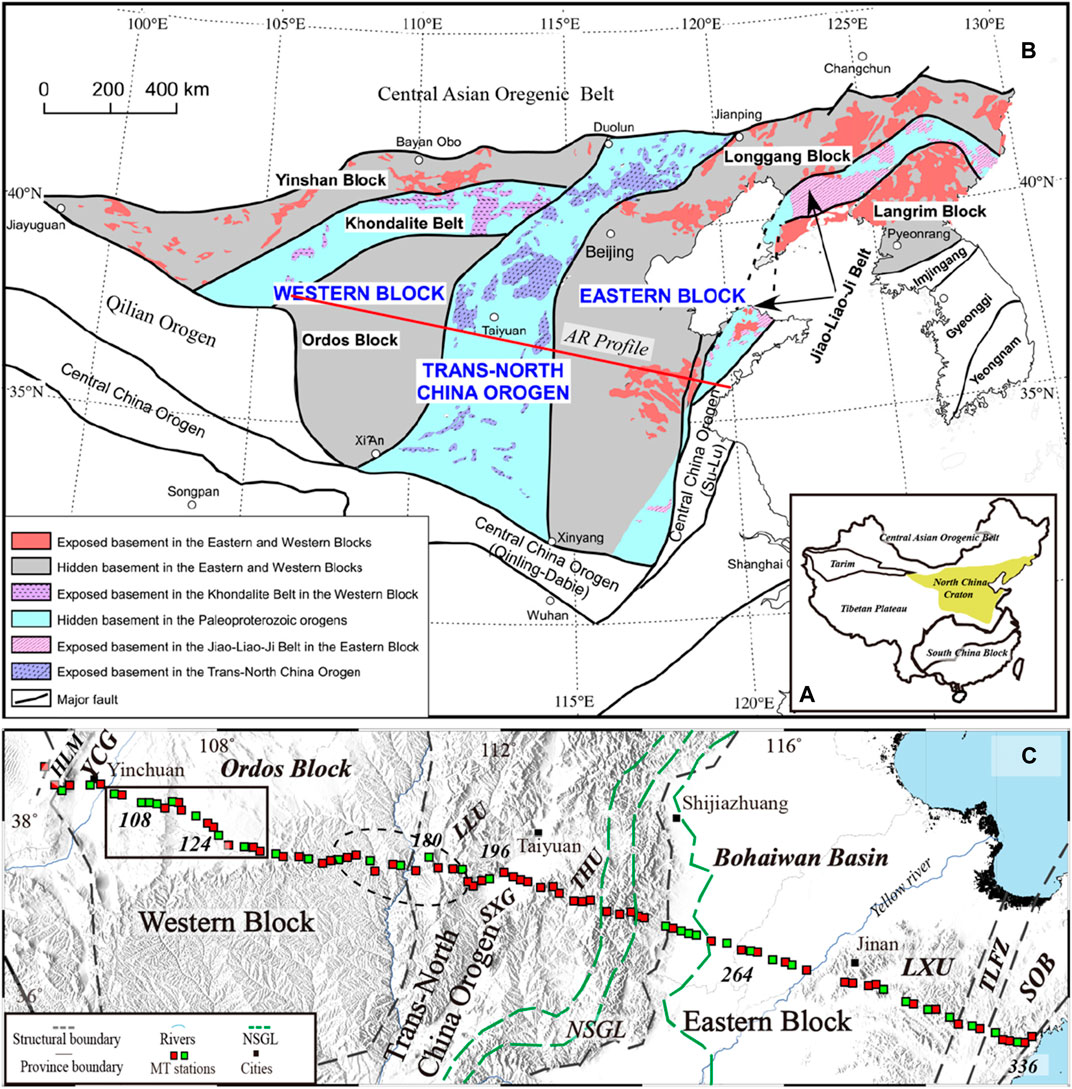
FIGURE 1. (A) Tectonic map of China showing Major units and the location of the North China Craton. (B) Tectonic subdivision of the North China Craton after (Zhao and Cawood, 2012). Red line: the MT profile (AR) used in this paper. (C) The location of MT stations of the AR profile and tectonic subdivision of the primary units of the North China Craton. Black dashed ellipse: MT stations located in the southern Ordos Block. Black rectangle: the flat terrane balanced by gravity. HLM: Helan Mountain, YCG: Yinchuan Graben, LLU: Lüliang Uplift, SXG: Shanxi Graben, THU: Taihang Uplift, LXU: Luxi Uplift, SOB: Sulu Orogenic Belt, TLFZ: Tan-Lu Fault Zone, and NSGL: North-South Gravity lineament after (Deng et al., 2021).
Geophysical methods have been widely used in the study of the deep structure of the Earth, among which MT is the only effective method to study the electrical structure of the lithosphere (Chave and Jones, 2012). It obtains a lithospheric resistivity model of the study area by measuring the natural electromagnetic field changing with time at the surface. Because the resistivity parameter is very sensitive to the temperature and water content of the material, it is often used to study plate subduction zones, lithosphere thinning, and collisional orogenic belts. Although there have been many geophysical studies in the NCC in the past, there is a lack of research on the resistivity structure in large areas. A resistivity model of the entire NCC is needed to study the west-east difference of the lithosphere of the NCC.
In this paper, the lithospheric resistivity model of the NCC is established by three-dimensional inversion using the extended MT profile across the NCC to discuss spatial heterogeneity of the destruction of the NCC.
2 Geophysical and geological background
According to geological factors such as the basement rock composition and tectonic styles, Zhao et al. (2002) divided the NCC into three parts: the Eastern Block, the TNCO, and the Western Block (Figure 1B). The current unified basement of the NCC was formed at about 1.85–1.8 Ga through the continental-continental collision between the Eastern and Western blocks along the TNCO (Zhao et al., 2005; Zhao and Zhai, 2013; Wang et al., 2018). Since the NCC cratonization, the Ordos Block, located in the Western Block of the NCC, is considered to be the most complete and stable secondary tectonic unit (Zhai et al., 2005; Deng et al., 2006; Kusky et al., 2007; Chen et al., 2009). It is adjacent to the northeastern margin of the Tibetan Plateau. It contains a widely developed Archean-Proterozoic crystalized basement. Its interior is relatively stable, surrounded by rifts such as the Fenwei, Hetao, and Yinchuan grabens (Zhao et al., 2012). The TNCO is a collisional orogenic belt cutting through the NCC in a nearly north-south direction. Its basement rocks are newly formed crusts related to the arc structures (Zhao et al., 2002; Zhao and Zhai, 2013). It is about 1000 km long and 100–300 km wide and is composed of the Shanxi Graben in the middle and the uplift areas on both sides, namely the Taihang Uplift in the east and the Lüliang Uplift in the west (Zhang et al., 2003). Unlike most of the Western Block, which still retains the ancient craton lithosphere, the westward subduction of the paleo-Pacific plate has caused unstable mantle convection beneath the Eastern Block since the Mesozoic, resulting in large-scale tectonics, metamorphism, and mineralization. The rotation of the subducting plate and the retreat of the trench have led to a large-scale thinning of the lithosphere, and the cratonic properties have been changed (Chen et al., 2008; Zheng et al., 2008; Zhu et al., 2012) and multiple depressions and uplifts have been formed, and a large number of oil and gas resources and metal deposits have been generated at the procedure (Zhu et al., 2011).
The North-South Gravity Lineament (NSGL) running through the central part of the NCC is a 4000-km long Bouguer gravity anomaly extending from Siberia, Russia, to South China (Figure 2A). The Bouguer gravity anomaly in the NSGL increases sharply from −100 mGal to −40 mGal from west to east in a narrow range (Deng et al., 2021). The topography, tectonic and magmatic activities, and crustal and lithosphere thicknesses on the east and west sides of the NSGL are noticeably different (Deng et al., 2007). This lateral difference has been attributed to the destruction of the NCC since the Mesozoic (Xu, 2007). The NSGL is also considered to be the western boundary of the lithospheric thinning of the NCC (Chen, 2010; Zhu et al., 2012), and its location may be controlled by the unstable mantle convection caused by the subduction of the paleo-Pacific plate below the Eurasian plate (Xu, 2007; Zhao et al., 2007; Zhu et al., 2011).
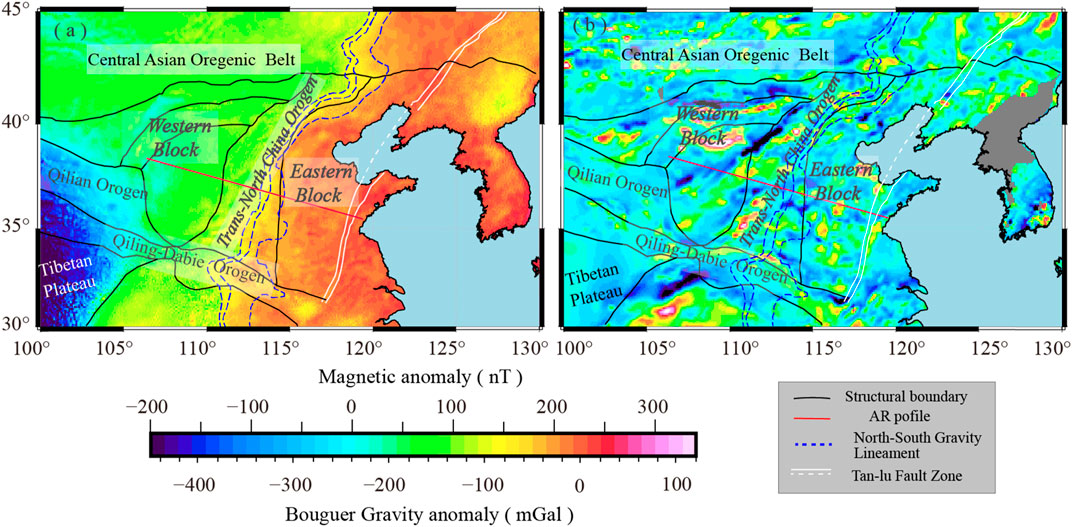
FIGURE 2. (A) The Bouguer gravity anomaly of the North China Craton and its adjacent areas based on data from EGM2008 after (Pavlis et al., 2012). (B) The magnetic anomaly of the North China Craton and its adjacent based on data from the World Digital Magnetic Anomaly Map project (Maus et al., 2007).
The magnetic anomalies of the NCC are generally strong and complex (Zhou et al., 2004) (Figure 2B). The Ordos Block in the Western Block has an east-west positive magnetic anomaly, a NE-trending negative magnetic anomaly, and a north-northeast-trending positive magnetic anomaly from south to north, and finally forms anomalies that converge from southwest to northeast. Therefore, although the Ordos Block generally has rigid and stable structural features, there is also heterogeneity in its interior (Wang et al., 2007). The magnetic characteristics of the TNCO are generally a series of discontinuous NE-trending positive and negative alternating magnetic anomalous strips. Under the action of the tensile stress in the region, the Shanxi Graben with the characteristics of left-dipping distribution was formed. The magnetic anomalies of the Eastern Block are distributed in positive and negative alternating and irregular clusters. The difference between the Eastern and Western blocks may reflect that the Eastern Block has experienced multi-stage tectonic movements (Jiang et al., 2018).
Petrological and geochemical studies have shown that the Eastern Block experienced large-scale lithospheric thinning, surface heat flow elevation, significant magmatic activities, and strong tectonic movements (Wu et al., 2008; Zheng, 2009; Zhu et al., 2011; Zhu et al., 2012; Zheng et al., 2018; Jiang et al., 2019; Wu et al., 2019). Many geophysical studies have been done in this area to study the deep structure of the NCC’s lithosphere. For the Western Block of the NCC, there are apparent differences in the thickness of the lithosphere obtained by different geophysical methods. Li et al. (2011) obtained the lithospheric velocity structure of the NCC by a seismic refraction/reflection profile from Zhucheng to Yichuan in the southern NCC. They found that there is a great difference in the lithospheric structure on both sides of the Taihang Uplift, which was supported by the subsequent E-W profiles across the entire NCC (Jia et al., 2014; Tian et al., 2014; Wang et al., 2014; Liu Z. et al., 2015). Based on the 2D velocity models, the crust and lithosphere thickness of the NCC varies from ∼35 km to 70–80 km in the Eastern Block to ∼45 km and 120–150 km in the Western Block, respectively, and a ∼30 km lithosphere-asthenosphere boundary (LAB) changing zone in the TNCO. The following studies have supported the conclusion that the NCC’s lithosphere gradually thickens from east to west. The surface wave tomography (Huang et al., 2009) found velocity gradient zones in the upper mantle at depths of 70 km, 110 km, and 160 km in the Eastern Block, the TNCO, and the Western Block, respectively, which was considered to be the LAB. Using the velocity models, the lithospheric thermal structure (Sun et al., 2013; Liu et al., 2016; Yan et al., 2019) was mapped by numerical simulation, and they gave the overall thickness of NCC about 60–120 km, with a maximum thickness of 150 km. It is believed that the Ordos Block still retains the ancient craton lithosphere. However, the P-wave anisotropy tomography studies (Wei et al., 2016) show that high-velocity lithospheric roots are revealed to a depth of ∼260 km in the Western Block, and a complex pattern of azimuthal anisotropy at 60 km depth in the Eastern Block. The S-wave receiver function (Chen et al., 2009; Chen, 2010; Zhang et al., 2019) results show significant topography on both the Moho (∼30–50 km) and the LAB (∼80–210 km), suggesting substantial structural heterogeneous in the NCC lithosphere. Note that the lithospheric thickness given by different geophysical methods for the Eastern Block and the TNCO is similar (about 80 km and 130 km, respectively). The crustal thickness of the Eastern Block is usually less than 35 km, and the lithospheric thickness of it is usually 60–80 km, which means the lithosphere is thinned. While the crustal and lithospheric thicknesses of the Western Block are traditionally 45 km and 200 km, respectively, indicating a typical cratonic lithosphere. However, the seismic anisotropy study (Liu et al., 2021) in the Ordos Block and its surroundings found that the fast-wave polarization direction is primarily NW-SE in the western Ordos Block, this is consistent with a previous study (Chang et al., 2011). They thought that the lithosphere may have experienced great modification in the western Ordos Block, which was caused by the expansion and compression of the Tibetan Plateau. In addition, the anisotropy is much weaker in the middle TNCO than in the north and south, and the thickness of the lithosphere in the middle TNCO is greater than in the northern and southern regions (Liu et al., 2021). It is supported by the joint inversion of the receiver function and surface wave dispersion data (Cai et al., 2021). Moreover, the joint inversion results identified a large-scale low-velocity anomaly extending from the northeastern Ordos Block to the northern TNCO. The lithosphere of the TNCO shows a strong lateral heterogeneity (Cai et al., 2021; Liu et al., 2021). Consequently, the spatial heterogeneity of lithospheric destruction of the NCC still remains elusive.
MT studies have found that there are low-resistivity bodies in the lithospheric mantle beneath the northwestern Ordos Block and the Hetao Graben, which may be related to the upwelling of sulfides produced by deep tectonic activities (Dong et al., 2014; Li C. et al., 2017; Xu et al., 2017; Li et al., 2022). However, there is still well-preserved cratonic lithosphere beneath the southern Ordos Block (Dong et al., 2014; Li C. et al., 2017; Xu et al., 2017; Li et al., 2022). This may indicate that the lithosphere beneath the northern Ordos Block is being destructed, and the destruction event may have begun since the late Mesozoic. There are similar low-resistivity anomalies in the lower crust and upper mantle of the northern and southern TNCO, which may be related to the asthenospheric upwelling caused by the far-field effect of the collision between the Indian and Eurasian plates in the Cenozoic (Yin et al., 2016; Zhang et al., 2016; Yin et al., 2017). A recent study on the three-dimensional resistivity structure of the lithosphere also supports that significant lithospheric thinning has occurred beneath the Eastern Block (Ye et al., 2021).
Previous MT studies have not provided a resistivity model of the lithosphere of the entire NCC. Due to the distribution of MT stations, the differences in the techniques used in each study, and the boundary effects of MT inversions, these resistivity models cannot be discussed together. In this paper, an extended MT profile (AR) is used to obtain a lithospheric resistivity model of almost the entire NCC, to discuss the spatial heterogeneity of the NCC destruction and its dynamic processes.
3 Acquisition, analysis, and inversion
3.1 Data acquisition
The AR profile starts from Alxa Zuoqi, Inner Mongolia, in the west. It passes through the Helan Mountain, the Yinchuan Graben, the Ordos Block of the Western Block, the Lüliang Uplift, the Shanxi Graben, and the Taihang Uplift of the TNCO, the Bohaiwan Basin, the Luxi Uplift, and the Tan-Lu Fault Zone of the Eastern Block, and the Sulu Orogenic Belt (Figure 1C), then ends at Rizhao city, Shandong Province, on the eastern coast of China, with a total length of ∼1360 km which crosses almost the whole NCC.
The AR profile was collected from 2005 to 2006 by the China University of Geosciences, Beijing. 136 MT stations were arranged along the profile, with an average station spacing of ∼10 km. 100 stations were collected using the MT-24 system produced by EMI, USA, and the acquisition time for each station was more than 20 h. At the other 36 stations, the MTU-5P instruments made by Phoenix-Geophysics, Canada, were used, and each station’s acquisition time was not less than 48 h. Each station recorded two orthogonal horizontal electric field components (Ex and Ey) and three pairwise orthogonal magnetic field components (Hx, Hy, and Hz), where x is true north, y is east, and z is vertically downward. The data collected by the MT-24 and the MTU-5P instruments were processed by EMTF and SSMT-2000 packages, respectively. The quality of the measured time series is quite good because of the weak electromagnetic noise level at that age. Remote reference technology and Robust estimation (Egbert and Booker, 1986) used in the processing also greatly improved the data quality. Thus, the MT stations collected by the MT-24 and the MTU-5P instruments produced period ranges of 0.003–3,000 s and 0.003–10,000 s, respectively. The data quality of the stations in the Western Block is excellent. However, some stations in mining areas in the TNCO and the Eastern Block have poor data quality because of terrible electromagnetic noise. Finally, 93 stations with good data quality participated in the subsequent data analysis and inversion (Figure 1C). Figure 3 shows some typical sounding curves of MT stations in the secondary geological units of the NCC.
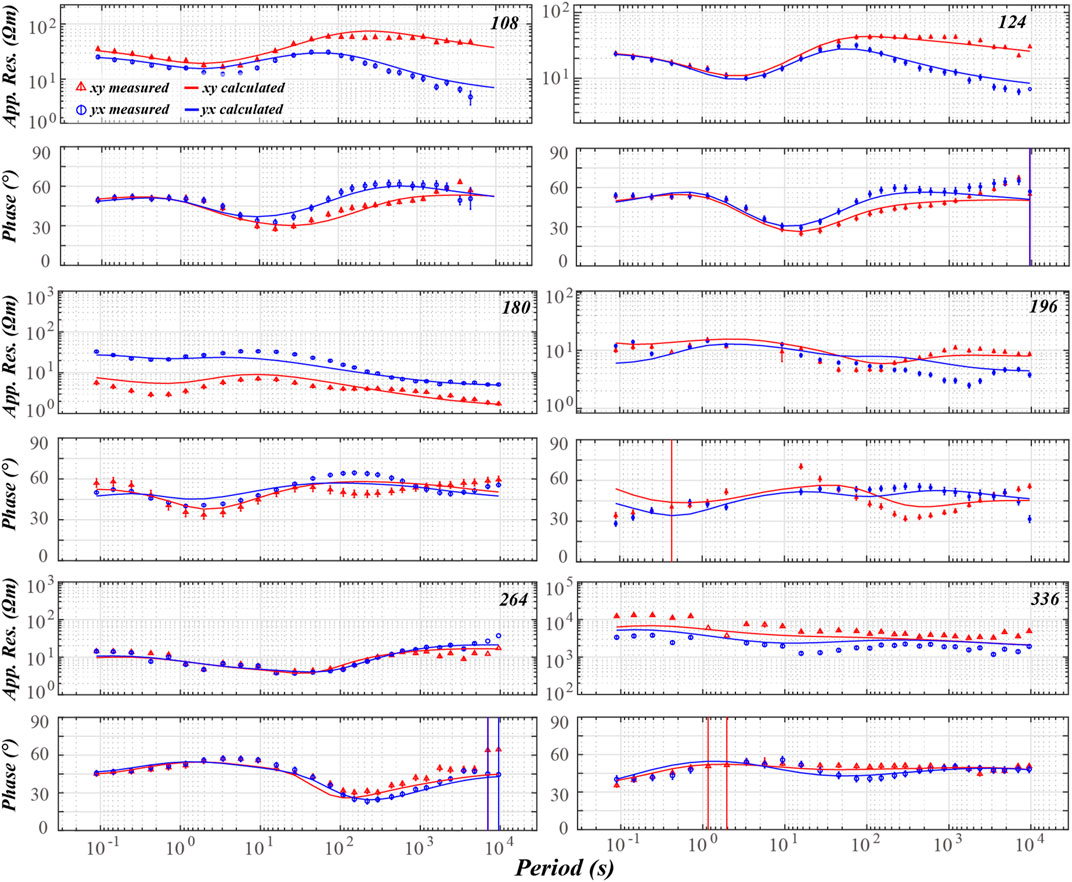
FIGURE 3. Sounding curves and model responses of xy and yx modes data at six stations with their names marked in Figure 1C.
3.2 Data analysis
Before the AR profile data can be inverted, it is necessary to analyze the dimensionality and strike directions of the data to determine whether the subsurface structure satisfies the two-dimensional assumption.
The phase tensor method (Caldwell et al., 2004) is widely used to analyze dimensionality and strike directions since no assumption of a regional strike direction needs to be made, and it is not affected by galvanic distortion. The phase tensor is defined as the product of the inverse matrix of the real part matrix and the imaginary part matrix of the impedance tensor, which three invariants can represent: the maximum phase (φmax), the minimum phase (φmin), and the skew angle (β). Therefore, an ellipse can usually be used for illustration. The long and short axes of the ellipse represent the maximum and minimum phase, respectively, and the fill color of the ellipse represents the skew angle β. A zero skew angle indicates a 2-D structure, while the strike direction occurs at the maximum (φmax) or the minimum (φmin) phase. When the absolute value of the skew angle β is greater than 3°, the structure cannot be treated as 2-D (Booker, 2014).
Figure 4B shows the phase tensor analysis results of all periods of each station along the AR profile. The IDs of the stations with the longest period reaching 10,000 s are marked at the bottom of Figure 4B. The results show that most of the stations in the TNCO and the Eastern Block, except for the Bohaiwan Basin, have absolute β values larger than 3° at most periods (red and blue ellipses), showing three-dimensional structures. The Ordos Block generally shows two-dimensional characteristics, but the Yinchuan Graben shows prominent three-dimensional features in the period range of 100–10,000 s. Although the Ordos Block and the Bohaiwan Basin are the best two-dimensional units, they also show relatively strong three-dimensionality in the period range of 100–1,000 s (light blue ellipses). Therefore, the phase tensor analysis results show that the AR profile does not satisfy the two-dimensional assumption.
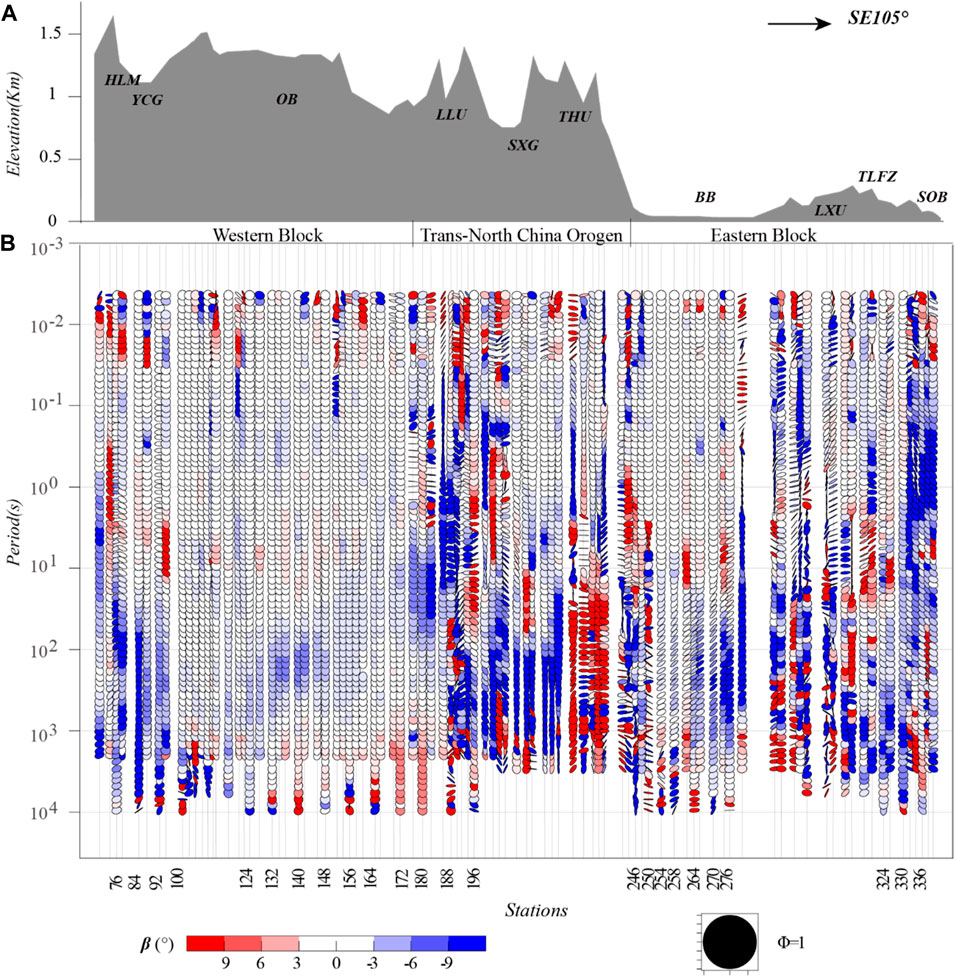
FIGURE 4. (A) The topography along the AR profile cut from ETOPO30. HLM: Helan Mountain, YCG: Yinchuan Graben, OB: Ordos Block, LLU: Lüliang Uplift, SXG: Shanxi Graben, THU: Taihang Uplift, BB: Bohaiwan Basin, LXU: Luxi Uplift, SOB: Sulu Orogenic Belt, and TLFZ: Tan-Lu Fault Zone. (B) The results of phase tensor analysis for all periods and all stations with the MTpy package (Krieger and Peacock, 2014).
To understand the strike direction of each block, we divided the MT stations into three groups: the Western Block, the TNCO, and the Eastern Block, and carried out impedance tensor decomposition respectively (McNeice and Jones, 2001), and plotted the statistical rose diagrams of strike angles of each station group at three period bands of 0.03–1 s, 1–10 s and 10–1,000 s (Figure 5). Note that the strike direction obtains by impedance tensor decomposition has an ambiguity of 90°, which can only be resolved by external information such as regional geological maps or magnetic induction vectors. Combining with regional geological data, it is shown that the strike direction of the Western Block at short period bands (0.03–1 s and 1–10 s) is nearly north-south, which may be related to the strike of the shallow uplift and depression belts of the Western Block. In contrast, the 10–1,000 s period band shows that the strike direction of it is clearly defined as NE75°, which may be related to the strike direction of deep structures of the Western Block. The strike direction of the TNCO is NE10° at all period bands, which is consistent with the secondary geological units of the TNCO and is also compatible with the stress direction, while the TNCO was formed by the collision between the Eastern and Western blocks. The strike direction of the Eastern Block at the short period bands (0.03–1 s and 1–10 s) is around NE10°, which is consistent with the directions of shallow structures of the Eastern Block, but the strike direction of the 10–1,000 s periods is NE30 ∼45°, which is inconsistent with the strike directions of secondary geological units of the Eastern Block. In general, the impedance tensor decomposition results show that the strike directions of the Western Block, the TNCO, and the Eastern Block are inconsistent, and even the strike directions of the same block (the Eastern and Western blocks) at short period and long period bands are varying. No unique strike angle can be applied to the whole profile. Therefore, for the AR profile, three-dimensional inversion is necessary. The previous two-dimensional inversion we have done shows that the data of this profile cannot be well-fitted. Because of that, we have not been able to provide a reliable model for publication with two-dimensional inversion.
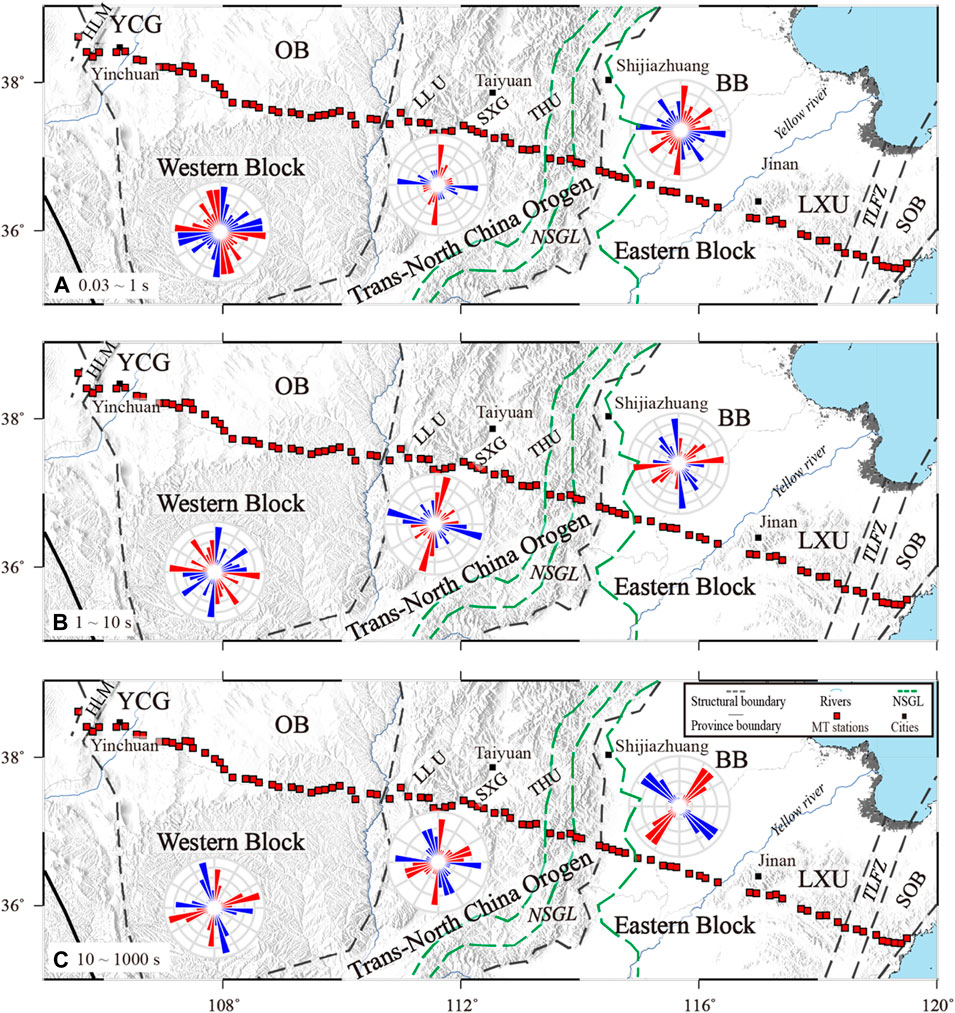
FIGURE 5. Impedance tensor decomposition results of three period bands of three groups of stations in the Western Block, the Trans-North China Orogen, and the Eastern Block, respectively. (A) .03–1 s, (B) 1–10 s, and (C) 10–1000 s. HLM: Helan Mountain, YCG: Yinchuan Graben, OB: Ordos Block, LLU: Lüliang Uplift, SXG: Shanxi Graben, THU: Taihang Uplift, BB: Bohaiwan Basin, LXU: Luxi Uplift, SOB: Sulu Orogenic Belt, TLFZ: Tan-Lu Fault Zone, and NSGL: North-South Gravity lineament after (Deng et al., 2021).
3.3 Three-dimensional inversion
According to the results of phase tensor analysis and impedance tensor decomposition, we carried out 3D inversions to the AR profile using ModEM software which integrated Non-linear Conjugate Gradient (NLCG) algorithm (Egbert and Kelbert, 2012; Kelbert et al., 2014). The full impedance tensor data of 28 periods in the period range of 0.1–10,000 s of 93 MT stations were inverted. The error floors of the diagonal and off-diagonal components of the impedance tensor were set to 10% and 5% of
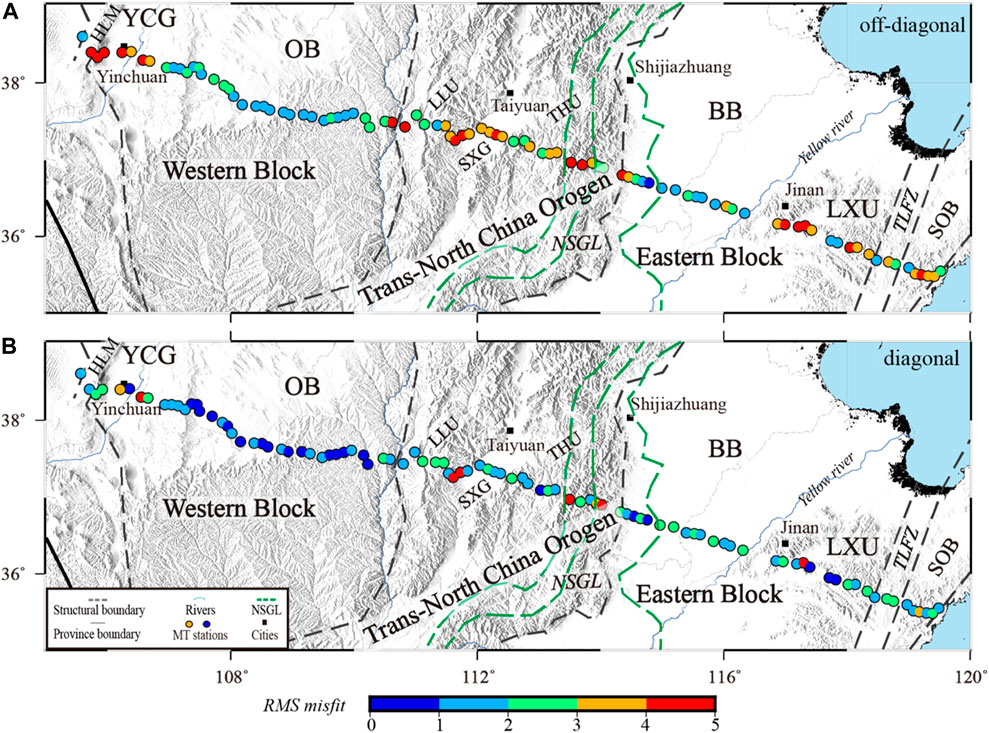
FIGURE 6. The RMS misfits of 3D inversion of off-diagonal and diagonal components of each station. (A) off-diagonal, and (B) diagonal. HLM: Helan Mountain, YCG: Yinchuan Graben, OB: Ordos Block, LLU: Lüliang Uplift, SXG: Shanxi Graben, THU: Taihang Uplift, BB: Bohaiwan Basin, LXU: Luxi Uplift, SOB: Sulu Orogenic Belt, TLFZ: Tan-Lu Fault Zone, and NSGL: North-South Gravity lineament after (Deng et al., 2021).
Based on the resistivity model produced by the 3D inversion, we plotted the resistivity section along the AR profile (Figure 7B). According to the previous studies (Deng et al., 2007; Chen et al., 2008; Chen et al., 2009; Li et al., 2011; Guo et al., 2012; Chen et al., 2014; Jia et al., 2014; Tian et al., 2014; Wang et al., 2014; Wu et al., 2014; Zhang et al., 2019; Cai et al., 2021), we plotted the approximate positions of the Moho (solid black line) and the LAB (dashed black line) on the resistivity section, which is helpful to discuss the resistivity characteristics of the crust and upper mantle. The features of the resistivity section are described as follows.
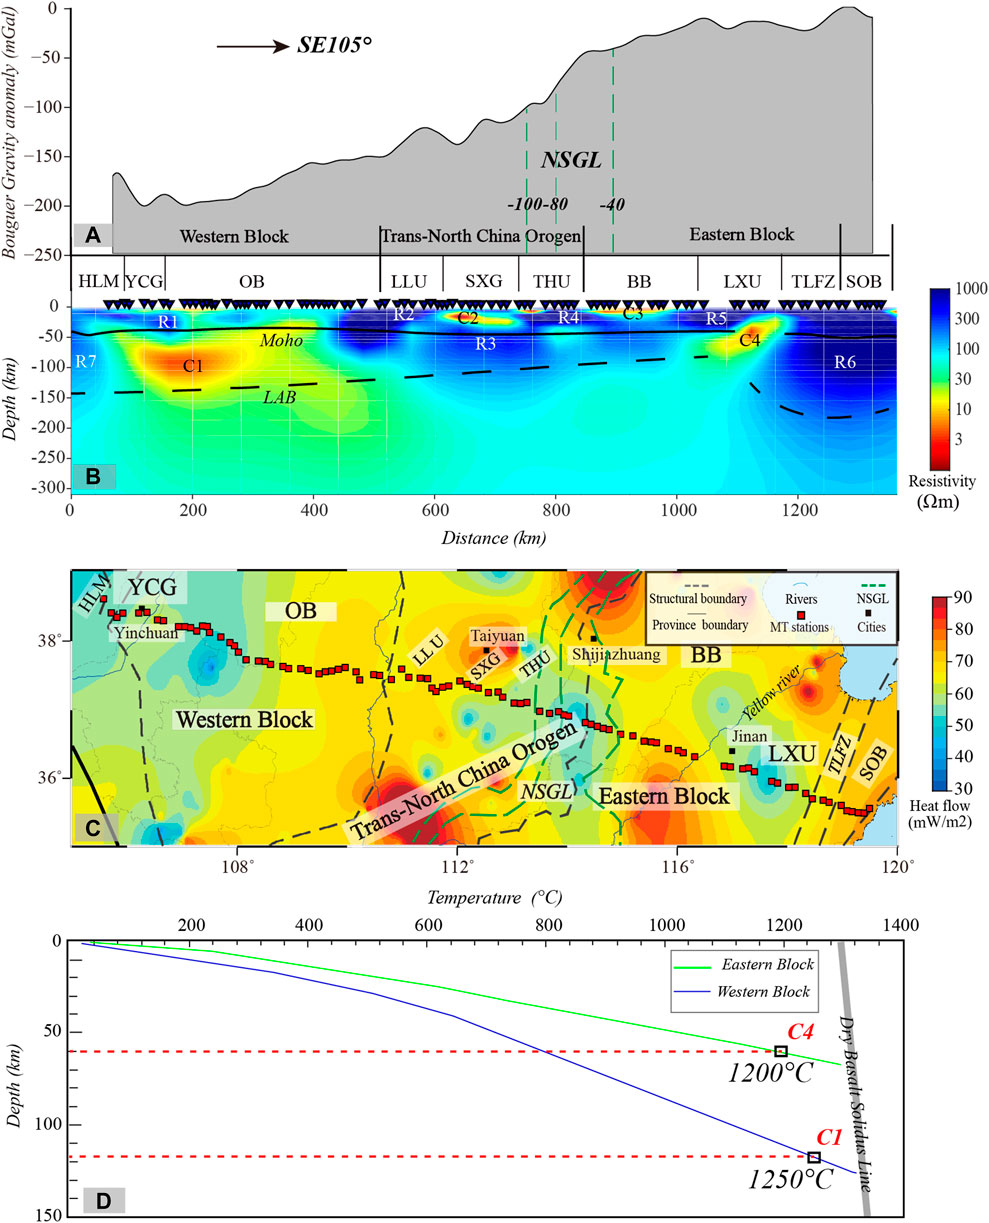
FIGURE 7. (A) The Bouguer gravity anomaly along the AR profile based on data from EGM2008 after (Pavlis et al., 2012). (B) The resistivity model along the AR profile cut from the 3D inversion model. The Moho and LAB is a combined result after (Deng et al., 2006; Chen, 2009; Chen, 2010; Li et al., 2011; Guo et al., 2012; Chen et al., 2014; Jia et al., 2014; Tian et al., 2014; Wu et al., 2014; Wang et al., 2015; Zhang et al., 2019; Cai et al., 2021). (C) Distribution of heat flow of the research area after (Jiang et al., 2019). (D) The temperature-depth curves of the Eastern and Western blocks of the North China Craton after [(Sun et al., 2013; Jiang et al., 2019; Qi et al., 2020). The dashed red lines represent the depths of the C1 and C4 conductors used to calculate melt fractions. The black squares represent the locations where the temperatures were adapted for the C1 and C4 conductors, respectively. HLM: Helan Mountain, YCG: Yinchuan Graben, OB: Ordos Block, LLU: Lüliang Uplift, SXG: Shanxi Graben, THU: Taihang Uplift, BB: Bohaiwan Basin, LXU: Luxi Uplift, SOB: Sulu Orogenic Belt, TLFZ: Tan-Lu Fault Zone, and NSGL: North-South Gravity lineament after (Deng et al., 2021).
4 Lithospheric resistivity features
4.1 The Western Block
High-resistivity anomalies characterize the lithosphere of Helan Mountain to the west of the Yinchuan Graben. The bottom depth of the high-resistivity body (R7) is ∼180 km, and its resistivity values are about 200–500 Ωm. It connects to the crustal high-resistivity body R1 of the Ordos Block and the Yinchuan Graben. The bottom depth of the high-resistivity body R1 is about 20–50 km, corresponding to the crystalline basement widely developed in the Ordos Block since the Archean-Proterozoic (Zhao et al., 2012). A layered distribution characterizes the resistivity structure of the Ordos Block. The shallow part is a low-resistivity layer with a thickness of ∼10 km, consistent with the Mesozoic and Cenozoic sedimentary layers. Below the low-resistivity layer is a high-resistivity layer with values of about 100–300 Ωm, whose bottom depth is comparable with the depth of the Moho (∼40 km). Previous studies believed that the Ordos Block retains a stable cratonic lithosphere (Chen et al., 2009; Tang et al., 2013; Zhang et al., 2019), which should be characterized by high resistivity. However, the resistivity model of the AR profile shows that the lithospheric mantle of the northwestern Ordos Block shows a noticeably low-resistivity anomaly (C1). Its average resistivity is only six Ωm. The low-resistivity body (C1) is laterally blocked by the lithospheric high-resistivity anomalies of the Helan Mountain (R7) to the west and the Lüliang Uplift (R2) to the east. It is vertically blocked by the crustal resistor (R1) of the Ordos Block. Finally, it upwells into both crusts of the Yinchuan Graben and the eastern Ordos Block, respectively. Note that our resistivity model shows that the lithosphere of the eastern Ordos Block is high resistivity (R2). However, the stations in the dashed black ellipse (Figure 1C) corresponding to this high-resistivity body are located in the southern Ordos Block. This result is consistent with the 3D resistivity model of the Ordos Block (Dong et al., 2014), that is, the lithospheric mantle of the northern Ordos Block and the Hetao Graben is characterized by low resistivity, while that of the southern Ordos Block is characterized by high resistivity.
4.2 The trans-north China orogen
The TNCO is composed of the Lüliang Uplift, the Shanxi Graben, and the Taihang Uplift from west to east, and the resistivity characteristics correspond well to these geological units. The TNCO is generally characterized by high resistivity (R2, R3, and R4). The bottom depth of the high resistivity anomalies (200–1,000 Ωm) is about 100–130 km, and it is large beneath the Shanxi Graben (R3) and small beneath the Lüliang and Taihang uplifts (R2 and R4). There is a low-resistivity anomaly (C2) surrounded by high-resistivity anomalies (R2, R3, and R4) below the Shanxi Graben at a depth of 20–40 km, and its resistivity values are about 5–30 Ωm, which is consistent with the deep seismic reflection profiles in this area, an obvious low-velocity structure is at a depth about 15–30 km in the middle and upper lower crust, which is clamped by high-velocity anomalies on both sides (Jia et al., 2014).
4.3 The Eastern Block
The Eastern Block consists of the Bohaiwan Basin, the Luxi Uplift, and the Tanlu Fault Zone. The shallow part of the Bohaiwan Basin is a low-resistivity layer (C3) with a thickness of about 5–15 km and resistivity values of about 10–30 Ωm. The lateral boundary of this low-resistivity layer is very consistent with the scope of the Bohaiwan Basin. Below the layer is a high-resistivity body with resistivity values of about 100–300 Ωm, whose maximum depth is up to ∼100 km. The high-resistivity body is connected with the high-resistivity crust of the Luxi Uplift (R5). The resistive body of the Bohaiwan Basin may be related to the ancient basement rocks of the NCC. However, the resistive crust of the Luxi Uplift may indicate the resistivity characteristics of the widely distributed granites in this area and the ancient basement rocks of the NCC. The crustal resistor of the Luxi Uplift was significantly thinned near the Tan-Lu Fault Zone due to the uplift of the mantle low-resistivity body (C4). In other words, the lower crust and upper mantle of the Luxi Uplift show noticeable low-resistivity features. The lithosphere of the eastern part of the Tan-Lu Fault Zone and the Sulu Orogenic Belt shows highly resistive features, and its bottom depth is ∼150 km. The low-resistivity anomaly (C4) in the upper mantle of the Luxi Uplift upwelled into the crust along the Tan-Lu Fault Zone from west to east, which made the western branch of the Tan-Lu Fault Zone a remarkable resistivity gradient zone. The lower crust and upper mantle to the west and the east of the western branch of the Tan-Lu Fault Zone show low and high resistivity, respectively. This resistivity structure is consistent with previous MT studies, both the 2D and 3D results show that the Tan-Lu Fault Zone is intersected by high and low resistivity in the lithospheric mantle, and the deep conductor beneath the Luxi Uplift upwelled into the western branch of the Tan-Lu Fault Zone (Ye et al., 2009; Zhang et al., 2010; Ye et al., 2021).
5 Interpretation and discussion
5.1 Origins of the NCC low-resistivity anomalies
Typically, the lithosphere of cratons should be cold, rigid, and characterized by high resistivity. However, previous MT studies suggested that large-scale low-resistivity anomalies may occur in lithospheric mantles of part of ancient cratons (Jones et al., 2003; Maier et al., 2007; Dong et al., 2014; Ye et al., 2021; Li et al., 2022; Shi et al., 2022). These low-resistivity anomalies usually extend laterally for at least tens of kilometers and are generally associated with the formation and evolution of cratons. Due to the differences in the tectonic evolution of cratons, partial melting, saline fluids, graphite films or sulfides at grain interfaces, and iron oxides have all been used to explain the origins of these high conductors (Selway, 2013). The sources of the low-resistivity anomalies of different blocks of the NCC will be discussed separately.
5.1.1 The mantle conductor in the Western Block
Our study finds the low-resistivity anomaly C1 in the lithospheric mantle of the Western Block (Figure 7B), which is connected to the crustal low-resistivity anomalies beneath the Yinchuan Graben and the eastern Ordos Block. This is consistent with the low-velocity and low-resistivity bodies found in the northwestern Ordos Block and the Hetao Graben in previous studies (Zhao et al., 2009; Tian et al., 2011; Dong et al., 2014; Li C. et al., 2017; Li Y. et al., 2017; Xu et al., 2017; Li et al., 2022; Shi et al., 2022). The origin of the layered distribution of the low-resistivity anomaly in the crust and the massive distribution of it in the mantle has not yet been determined. Zhao et al. (2010) suggested that this low-resistivity anomaly is caused by the upwelling of saline fluids, as the relatively stable Ordos Block acts as a high-resistivity impermeable “cap” that allows saline fluids to be stored for a long time. Dong et al. (2014) suggested that this phenomenon may be caused by the upwelling of the asthenosphere caused by the unstable mantle convection triggered by the subduction of the paleo-Pacific plate or/and the far-field effect of the collision of the Indian and Eurasian plates.
Paleo-thermal studies show that since the Jurassic, there has been a tectonic thermal event related to the subduction of the paleo-Pacific plate in the Ordos Block (Yuan et al., 2007). This tectonic thermal event peaked in the late Mesozoic, with a peak mantle heat flow of 62.97 mW/m2 (Ren et al., 2007; Qi et al., 2020). This peak period is consistent with the one of the NCC destruction. According to the latest high-quality heat flow data (Figure 7C), the heat flow of the Ordos Block (61.6 mW/m2 on average) (Jiang et al., 2019) is significantly higher than that of stable Archean cratons (41 mW/m2 on average) (Michaut et al., 2009), which means that there is a high temperature at the uppermost mantle of the Ordos Block. According to the results of regional heat flow data modeling and thermal history reconstruction (Sun et al., 2013; Jiang et al., 2019; Qi et al., 2020), the temperature at the uppermost mantle of our study region of the Ordos Block is close to 800°C (Figure 7D). In addition, global mantle experienced substantial warming in the Cretaceous (Humlera et al., 1999). The high temperature may have caused partial melting. Frost et al. (1989) showed that only when graphite films are stably present on the grain surface can they be interconnected to improve electrical conductivity. The Ordos Block has experienced many tectonic thermal events since the Triassic (Yuan et al., 2007; Qi et al., 2020), so the graphite film cannot remain stable for a long time (Selway, 2013). This is consistent with recent laboratory results that the graphite film has a strong temperature dependence and cannot exist stably at high temperatures (Zhang and Yoshino, 2017). Therefore, the low-resistivity body C1 below the Ordos Block may be the effect of partial melting. This partially molten body in the mantle may have balanced the gravity of the overlying lithosphere, making the terrain of the northwestern Ordos Block flatter than other parts (black rectangle in Figure 1C).
Subduction of the paleo-Pacific plate in the late Mesozoic resulted in an unbalanced, fast-flowing mantle convective system beneath the East Asian continent (Zhu et al., 2011). Hot and unstable asthenosphere upwelled along ancient structurally weak zone in the Western Block lithosphere (e.g., the Yinchuan and Hetao grabens, the Khondalite Belt), and the heat flow increased sharply. The lateral flow of the asthenosphere driven by the uplift of the Tibetan Plateau in the Cenozoic may be concentrated below these weak zones, which further promoted the upwelling of the asthenosphere below the weak zones of the Ordos Block (Ren et al., 2002; Liu et al., 2004). The upwelling asthenospheric material diffused thermally at the top of the upper mantle and caused partial melting and dehydration of the lithospheric mantle, so the saline fluids migrated upward to the middle and lower crust, forming conductors in the crust. Comparing the Bouguer gravity anomalies along the profile, it can be found that the negative anomalies in the Western Block are significant in the middle and small on both sides (Figure 7A), which indicates deep and shallow Moho, respectively. The resistivity structure shows that the crustal thinning may be caused by the upwelling of the upper mantle conductor C1 along the Yinchuan Graben and the eastern Ordos Block. The northeastward expansion of the Tibetan Plateau was blocked by rigid blocks (such as the southern Ordos Block and the Alxa Block), resulting in the deformation of the upper mantle along the NW-SE direction below the Ordos Block, which is why the low-resistivity body C1 is distributed nearly west-east (Figure 7B). Therefore, we propose that the northern Ordos Block is not an overall stable and rigid block since the Mesozoic and Cenozoic, its lithospheric mantle may have undergone multi-stage activation.
5.1.2 The crustal conductor in the TNCO
This study maps a low-resistivity layer C2 in the middle and lower crust beneath the Shanxi Graben, which corresponds to the previous studies (Figure 7B) (Wei et al., 2008; Zheng et al., 2009; Tang et al., 2013; Jia et al., 2014). Generally, low-resistivity anomalies above the lower crust can be related to tectonic activities (Zhao et al., 2010). Zheng et al. (2009) mapped a low-velocity body in the lower crust below the northern TNCO using receiver functions. They proposed that the formation of this low-velocity body may be related to the previous remnants of subducted oceanic crust.
When the depth increases, a thick high-resistivity body R3 appears in the lower crust and upper mantle of the Shanxi Graben (Figure 7B), which is consistent with the previous MT study (Wei et al., 2008) and seismic studies (Bao et al., 2013; Jiang et al., 2013; Bao et al., 2015; Cai et al., 2021). We propose that the bottom of the high-resistivity body may be the LAB since it is considered to be a typical electrical structure of stable Archean cratons when the upper, middle to lower crust, lithospheric mantle, and the asthenosphere show high-low-high-low resistivity characteristics, respectively (Hu et al., 2020). Thus, we propose that the lithosphere of the central TNCO still retains most features of ancient cratons.
The crustal low-resistivity layer we find is also consistent with the low-velocity anomaly mapped by the previous reflection/refraction profile (Jia et al., 2014). However, they did not discuss the origin of the low-velocity body. Since the lithospheric resistivity characteristics of the Shanxi Graben are consistent with that of ancient cratons, and the low-resistivity body is surrounded by high-resistivity anomalies (R2, R3, and R4) in the resistivity model, it is unlikely to be connected to deep heat sources; we believe that the low-resistivity layer (C2) may be the remnant of the subducted oceanic crust when the NCC was assembled in the Proterozoic.
5.1.3 The lower crust to upper mantle conductor in the Eastern Block
According to our resistivity model, there are significant electrical differences between the lower crust and the upper mantle on both sides of the Tan-Lu Fault Zone (Figure 7B). As mentioned above, the mantle high conductor C4 (Figure 7B) under the western Luxi Uplift extends upward from west to east to the western branch of the Tanlu Fault Zone. At the same time, there is no apparent low-resistivity anomaly beneath the eastern branch. The significant electrical differences are consistent with the previous S-wave velocity imaging and MT studies (Zheng et al., 2008; Ye et al., 2009; Ye et al., 2021). We propose that the western branch of the Tanlu Fault Zone may be a channel for mantle material to upwell from the Luxi Uplift to the east, and the lithospheric thickness of the Luxi Uplift is the smallest (∼80 km).
The latest study of heat flow (Figure 7C) showed that the Eastern Block is an area with relatively high heat flow in the NCC. The heat flow near the Tanlu Fault Zone is around 70 mW/m2, and the ratio of crust-mantle heat flow has a relatively high value of 0.8, indicating that the magnitude of heat flow is mainly contributed by deep mantle sources (Jiang et al., 2019). Previous studies suggested that at a depth of 50 km in the Eastern Block, the temperature could exceed 900°C (Figure 7D) (Sun et al., 2013; Jiang et al., 2019; Qi et al., 2020). Also, because the graphite film has a strong temperature dependence and is unstable in a high-temperature environment (Zhang and Yoshino, 2017), the high conductor C4 cannot be interpreted as graphite. Whether the cratonic lithospheric mantle can maintain its properties for a long time is closely related to the water content (Zhu et al., 2012). By comparing the characteristics of the water content of the lithospheric mantle in the Mesozoic and Cenozoic, the thinning of the lithosphere and the upwelling of the asthenosphere caused by the subduction of the paleo-Pacific plate since the Mesozoic can be explained. Because the low-water content lithospheric mantle is highly viscous, making it is resistant to asthenospheric intrusion (Xia et al., 2013). The study of ∼120 Ma high-magnesium basalt originating from the lithospheric mantle at Feixian county, Shandong Province, shows that the Mesozoic lithosphere was water-rich, and the H2O content in the basalt source area was >1,000 ppm (Xia et al., 2013). However, the lithosphere of the NCC was water-poor in the Cenozoic (Xia et al., 2013). The water-rich characteristics of the Mesozoic upper mantle were related to the subduction of the paleo-Pacific plate. The dehydration of the rapidly subducted oceanic crust of the paleo-Pacific plate promoted fluid metasomatism and magmatic activity, resulting in unstable mantle convection beneath the Eastern Block and its adjacent regions (Zhu et al., 2011). The subducted paleo-Pacific plate retreated under gravity, and the asthenosphere upwelled along the structurally weak zones in the Eastern Block lithosphere (such as the Tan-Lu Fault Zone) under the tensile stress environment, resulting in the thermal erosion from the bottom of the lithosphere and then partially melted. This slow process continued for a long time during the thinning of the lithosphere of the eastern NCC; the Cenozoic lithosphere was depleted of water due to the partial melting (Zhu et al., 2012). Thus, the high conductor C4 (Figure 7B) is interpreted as partial melting.
According to our lithospheric resistivity model, it can be inferred that the Tanlu Fault Zone is structurally weak in the Eastern Block. Since the Late Mesozoic, the dehydration of the subducted plate has weakened the lithospheric mantle of the Eastern Block, and the asthenospheric material has upwelled along the western branch of the Tan-Lu Fault Zone under the extensional environment in the retreat stage. Upwelling mantle material caused partial melting or thermal erosion of the lithosphere (Zhu et al., 2011), resulting in a vast thinning of the lithosphere of the Eastern Block west to the Tanlu Fault Zone. This means that the Tan-Lu Fault Zone was a channel for asthenospheric upwelling in the eastern NCC and played an essential role in the lithospheric thinning (Xu, 2001; Zheng et al., 2008; Chen, 2010; Ye et al., 2021).
5.1.4 Melt fraction
When the C1 and C4 conductors are interpreted as partial melting, their bulk conductivity can be considered a solid-liquid two-phase system. If the melt conductivity, the Archie Cement Index, and the Archie constant are known, the melt fraction can be calculated from the bulk conductivity of the conductors (Eq. 1) (Archie, 1942). (Glover et al., 2000) improved the Archie formula by considering the solid-phase conductivity, eliminated the Archie constant, and introduced the conductivity of the solid phase involved in conduction (Eq. 2).
Here,
The conductivity of the solid and melt phases must be determined to calculate the melt fraction. The conductivity of the solid phase in the mantle is taken as the experimental result of Yoshino et al. (2006) (0.01 S/m). At the same time, the melt phase conductivity (
where T is the Kelvin temperature, and w is the water content (wt%). According to Eq. 3, we calculated the relationship between
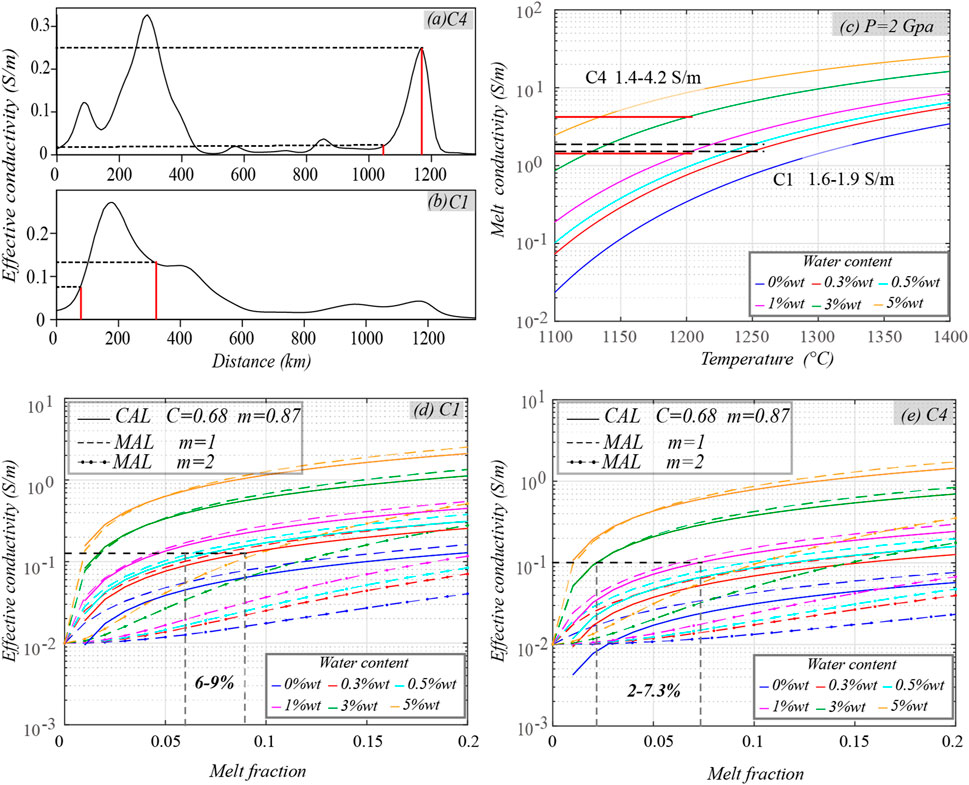
FIGURE 8. (A) and (B) The effective conductivity curves of the C4 and C1 conductors within the depth range of 30–70 km and 60–140 km, respectively. The red lines indicate the horizontal fields of the C4 and C1 conductors that calculated the average effective conductivities. (C) The relationship between conductivity and temperature of basalt melts with different water content according to (Ni et al., 2011). (D) and (E) The relationship between effective conductivity and melt fraction calculated using the traditional (CAL)(Archie, 1942) and modified (MAL) (Glover et al., 2000)Archie’s laws with different water contents. The dashed gray vertical lines in (D) and (E) represent the ranges of melt fractions of the C1 and C4 conductors, respectively.
Previous studies have shown that the water content of Cenozoic lithospheric basalts in Shandong Province is 0.6–3.9 wt% (Liu et al., 2015b), while the water content of the parental magmas in the Taihang Uplift is 0.2%–1.07% (Liu et al., 2015b), the difference in water content of different blocks may indicate that the water content of basalt in the eastern region near the Pacific trench is higher than that in part far from the trench (Xia et al., 2019). Combined with the relationship between temperature and depth in the study area (Sun et al., 2013; Jiang et al., 2019; Qi et al., 2020), the temperatures of high conductors C1 and C4 are 1250°C (1473.15 K, at 118 km depth) and 1200°C (1523.15K, at 60 km depth), respectively (red dashed lines in Figure 7D). The water content is set to 0.3–0.5 wt% and 1–3 wt% for C1 and C4, respectively, the calculated melt conductivity ranges (Figure 8C) are 1.6–1.9 S/m (black dashed lines in Figure 8C) and 1.4–4.2 S/m (solid red line in Figure 8C) for C1 and C4 as well.
The average effective conductivities of high conductors C1 (depth range 60–140 km) and C4 (depth range 30–70 km) are 0.14 S/m (Figure 8B) and 0.1 S/m (Figure 8A), respectively, which is obtained by dividing the longitudinal conductance by the thickness, respectively. Under the above temperature conditions, when the water contents are 0.3–0.5wt% and 1–3wt%, the basalt melt fractions of the lithospheric mantle high conductors C1 in the Ordos Block and C4 in the eastern Block are 6%–9% (Figure 8D) and 2%–7.3% (Figure 8E), respectively.
Note that due to the high conductivity of carbonate melts, typically, only a 0.1% melt fraction is required to induce high conductor at the top of the upper mantle (Sifre et al., 2014). Experimental results (Yoshino et al., 2010) show that under the same bulk conductivity, the basalt melt fraction is 3–10 times higher than the carbonate melt fraction. Assuming that the high conductors C1 and C4 are caused by carbonate melts, the required carbonate melt fractions for C1 and C4 are only 0.6%–3% and 0.2%–2.43%, respectively.
5.2 Lithospheric heterogeneity of the NCC and its dynamics
Below the Western Block, our model shows the mantle low-resistivity body C1, which upwells into the crust along the Yinchuan Graben and the eastern Ordos Block. Previous MT studies in these areas have found similar anomalies. The three-dimensional resistivity model of the Ordos Block showed that there is a crust-mantle “mushroom-like” high conductor in the northern Ordos Block and the Hetao Graben. In contrast, the southern Ordos Block showed a high resistivity (Dong et al., 2014). Two south-north MT profiles across the Ordos Block also confirmed the existence of this high conductor (Li C. et al., 2017; Xu et al., 2017). Dong et al. (2014) proposed that this phenomenon may be caused by the upwelling of the asthenosphere caused by the unstable mantle convection triggered by the subduction of the paleo-Pacific plate or the far-field effect of the collision of the Indian and Eurasian plates. Xu et al. (2017) and Li C. et al. (2017) supported this conclusion. The results of the Yinchuan-Jilaitai profile also showed that there are similar crust-mantle high conductors in the Yinchuan rift and the western margin of the Ordos Block (Li et al., 2022), and this high conductor is interpreted as possible partial melting caused by fluid metasomatism in the mantle, reflecting the extension of the lithospheric destruction. Almost all previous MT results indicate that the northern Ordos Block’s lithospheric mantle may be transformed (Dong et al., 2014; Li C. et al., 2017; Xu et al., 2017; Li et al., 2022). Therefore, the northern Ordos Block is not stable as previously proposed.
Wei et al. (2008) found a near-vertical low-resistivity anomaly in the middle to lower crust and upper mantle beneath the northern TNCO based on an MT profile, and they interpreted it as a thinned lithosphere. This anomaly was also confirmed by later resistivity models (Yin et al., 2016; Zhang et al., 2016). Zhang et al. (2016) proposed that the vertical conductor provided a channel for magma upwelling and played an essential role in the Cenozoic basalt volcanism, which may be related to the material escape of the mantle flow of the Tibetan Plateau. Yin et al. (2017) found a prominent lithospheric-scale high conductor under the eastern edge of the Linfen Basin of the southern TNCO and a large-scale high resistor under the southern Ordos Block. They proposed that this lateral inhomogeneity is controlled by the far-field effects of the collision of Indian and Eurasian plates in the Cenozoic. According to our lithospheric resistivity model, the central TNCO only has a low-resistivity layer in the middle to upper lower crust and the lower crust to the upper mantle exhibit significantly high resistivity characteristics. Thus, we infer that the destruction of the lithosphere may only occur at the northern and southern TNCO. The middle part is still a cratonic lithosphere or is in the early stage of destruction, and the lithospheric mantle below it retains most features of a cold and stable craton. This may support that the formation process of the Shanxi Graben developed from the south and north to the center (Cai et al., 2021).
In the eastern NCC, it has been inferred that the Tan-Lu Fault Zone is the east boundary of the NCC. The western branch provided a channel for the asthenospheric upwelling and may control the eastern NCC destruction, resulting in the lithospheric thinning below the Luxi Uplift according to MT studies (Ye et al., 2021; Ye et al., 2009). This is because the lithosphere of the Tan-Lu Fault Zone is not as rigid as the one of the Archean cratonic core of the NCC (Zheng et al., 2008; Zhu and Zheng, 2009). However, the lithosphere of its eastern branch and the Sulu Orogenic Belt has not been thinned since our result and previous MT studies mapped a high-resistivity lithosphere (Ye et al., 2009; Ye et al., 2021). This can only be interpreted as the cold and stable cratonic lithosphere and may indicate that the Sulu Orogenic Belt keeps the mountain root.
The westward subduction of the paleo-Pacific plate and its deep dynamic process have been the primary dynamic factors for the destruction of the eastern NCC since the Mesozoic, which is supported by most researchers (Wu et al., 2008; Zhu et al., 2012; Zheng et al., 2018; Tang et al., 2021). However, there is still controversy over whether the collision of the Indian and Eurasian plates was involved in the tectonic evolution of the NCC (Wu et al., 2008; Zhu et al., 2011; Zhu et al., 2012). Previous studies believed that the destruction only occurred in the Eastern Block. While the collision of the Indian and Eurasian plates happened in the southwest, far away from the NCC, and the spatial relationship between the two did not match (Wu et al., 2008). Therefore, the debate is whether the lithospheric thinning of the TNCO and the Western Block has occurred.
Our resistivity model and previous MT studies support that unstable mantle convection occurred below the northern Ordos Block, leading to the mantle upwelling along the ancient structurally weak zones in the lithosphere (Dong et al., 2014), resulting in the lithosphere of the Yinchuan and Hetao grabens and the northern Ordos Block partially transformed. Recent GPS measurements (Wang and Shen, 2020) showed that the Ordos Block and the NCC have different degrees of counterclockwise rotation, and the rotation speed of the Ordos Block is about twice that of the NCC. This behavior may be because the NCC is under dual tectonic settings of the subduction of the paleo-Pacific plate in the east and the collision of India and Eurasia plates to the southwest (Ren et al., 2002; Liu et al., 2004). Since the Cenozoic, the Pacific and Indian plates have moved in the directions of NNW and NNE, respectively, resulting in the NW-SE-directed extensional stress continuing to act on the existing weak zones of the lithosphere (e.g., the Yinchuan, Hetao, and Shanxi grabens). The continuous lithospheric extension may cause lithospheric thinning and asthenospheric upwelling. In addition, the collision of the Indian and Eurasian plates northeastward pushed the northeastern margin of the Tibetan Plateau, and the asthenospheric material was laterally squeezed into the ancient structurally weak zones of the TNCO and the Western Block lithosphere (Clark and Royden, 2000; Tommasi and Vauchez, 2001; Liu et al., 2004; Chang et al., 2011), which further promoted the extension (Ren et al., 2002), the upwelling of asthenosphere material causes partial melting of the lithospheric mechanical boundary layers. As a result, thermochemical erosion occurred (Menzies et al., 2007), and the cratonic lithosphere of some areas of the TNCO and the Western Block was gradually destructed.
We can conclude that the lithospheric destruction of the NCC is spatially heterogeneous, and all three blocks have undergone different degrees of destruction. The lithosphere of the northwestern Ordos Block and the Yinchuan and Hetao grabens, and the southern and northern TNCO are in the stage of being destructed. In contrast, the southern Ordos Block still retains ancient cratonic lithosphere. The central TNCO is in the initial stage of being destructed or remains the cratonic lithosphere, the lithosphere of the Eastern Block west to the Tan-Lu Fault Zone is the most severely destructed one, and the thinnest lithosphere is below the Luxi Uplift.
Therefore, the lithospheric thinning of the NCC is not bounded by the North-South Gravity Lineament, and its deep deformation is more complex than previously understood. At least since the Cenozoic, the spatial heterogeneity of the NCC destruction may have been jointly affected by the subduction of the Pacific plate and the collision of the Indian and Eurasian plates, resulting in mantle upwelling (red arrows in Figure 9) along the structurally weak zones (yellow belts in Figure 9). In other words, ancient structures were reactivated in the Mesozoic and Cenozoic, resulting in the spatial heterogeneity of the destruction of the NCC.
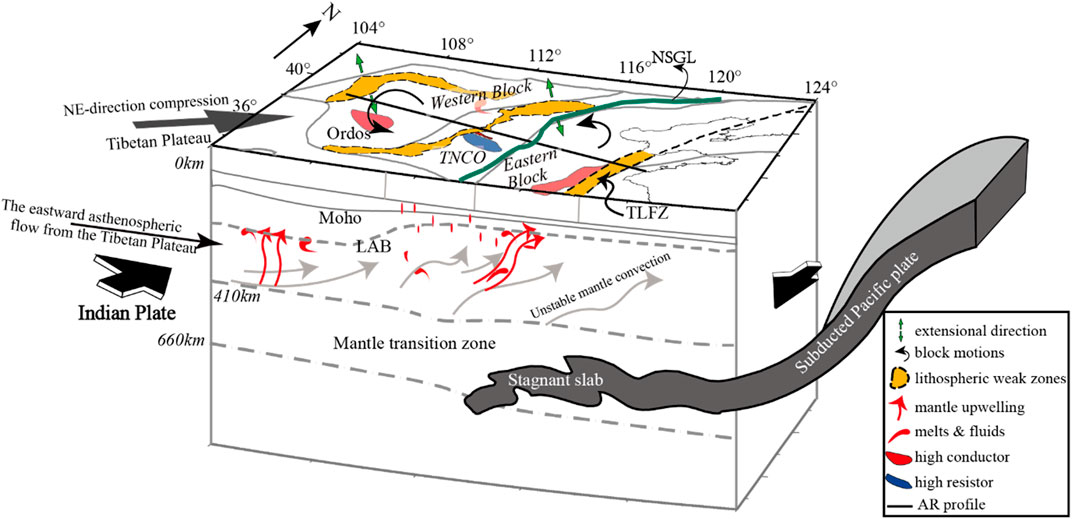
FIGURE 9. A cartoon diagram of the deep process of the destruction of the North China Craton modified from (Xu et al., 2018). TNCO: Trans-North China Orogen, TLFZ: Tan-Lu Fault Zone, and NSGL: North-South Gravity lineament after (Deng et al., 2021).
6 Conclusion
In this study, we performed a 3D inversion of an extended MT profile across the NCC and obtained a resistivity model along the profile. The model shows an upper mantle high conductor under the Ordos Block (C1) and the Luxi Uplift (C4). The lithosphere of the Lüliang and Taihang uplifts is characterized by high resistivity (R2 and R4). There is a high conductor (C2) in the middle to the upper lower crust of the Shanxi Graben, and its upper mantle is characterized by significantly high resistivity (R3). According to the electrical characteristics, the following conclusions are drawn.
1) The high conductors in the upper mantle (C1 and C4) of the Eastern and Western blocks of the NCC are interpreted as partial melting caused by the upwelling of the asthenosphere along the structurally weak zones in the ancient lithosphere (the Yinchuan and Hetao grabens, and the Tan-Lu Fault Zone) during the Mesozoic and Cenozoic. If the melt is basaltic, the melt fractions are 6%–9% (C1) and 2%–7.3% (C4), respectively, and if it is carbonate, the melt fractions are 0.6%–3% (C1) and 0.2%–2.43% (C4), respectively.
2) According to the resistivity model, we propose that the lithosphere of the Yinchuan and Hetao grabens and the northern Ordos Block may be in the stage of being destructed, the lithosphere of the TNCO is in the initial stage of being destructed, and the lithosphere of the Eastern Block is severely destructed.
3) The resistivity structure shows evident spatial heterogeneity in the lithospheric destruction of the NCC, which may indicate the combined effect of the subduction of the paleo-Pacific plate and the collision of the Indian and Eurasian plates. The asthenosphere upwelled along the structurally weak zone in the lithosphere, and the ancient structures were reactivated in the Mesozoic and Cenozoic, resulting in the spatial heterogeneity of the destruction of NCC.
Data availability satement
The original contributions presented in the study are included in the article/Supplementary Material, further inquiries can be directed to the corresponding author.
Author contributions
LJ and GY conducted data analysis, three-dimensional inversion, figure-making, and manuscript writing. SJ and XM assisted in data analysis, three-dimensional inversion, and manuscript writing. WW participated in the interpretation. JQ, QL, and SW participated in the model interpretation work. JG participated in the melt fraction calculation.
Funding
This work was supported by National Key R and D Program of China (2022YFF0800702), National Natural Science Foundation of China (Grants 41974112 and 40434010) and project SINOPROBE on sub-project SINOPROBE-01.
Acknowledgments
We thank Alan Jones and Gary McNeice for their tensor decomposition code. We also thank Gary Egbert for making the ModEM code publicly available. The MTpy package was used to generate Figure 4B.
Conflict of interest
The authors declare that the research was conducted in the absence of any commercial or financial relationships that could be construed as a potential conflict of interest.
Publisher’s note
All claims expressed in this article are solely those of the authors and do not necessarily represent those of their affiliated organizations, or those of the publisher, the editors and the reviewers. Any product that may be evaluated in this article, or claim that may be made by its manufacturer, is not guaranteed or endorsed by the publisher.
Supplementary material
The Supplementary Material for this article can be found online at: https://www.frontiersin.org/articles/10.3389/feart.2022.1105274/full#supplementary-material
References
Archie, G. E. (1942). The electrical resistivity log as an aid in determining some reservoir characteristics. Trans. AIME 146 (01), 54–62. doi:10.2118/942054-g
Artemieva, I. M., and Mooney, W. D. (2001). Thermal thickness and evolution of precambrian lithosphere: A global study. J. Geophys. Res. Solid Earth 106 (B8), 16387–16414. doi:10.1029/2000jb900439
Bao, X., Song, X., Xu, M., Wang, L., Sun, X., Mi, N., et al. (2013). Crust and upper mantle structure of the North China Craton and the NE Tibetan Plateau and its tectonic implications. Earth Planet. Sci. Lett. 369-370, 129–137. doi:10.1016/j.epsl.2013.03.015
Bao, X., Song, X., and Li, J. (2015). High-resolution lithospheric structure beneath Mainland China from ambient noise and earthquake surface-wave tomography. Earth Planet. Sci. Lett. 417, 132–141. doi:10.1016/j.epsl.2015.02.024
Booker, J. R. (2014). The magnetotelluric phase tensor: A critical review. Surv. Geophys. 35 (1), 7–40. doi:10.1007/s10712-013-9234-2
Cai, Y., Wu, J., Rietbrock, A., Wang, W., Fang, L., Yi, S., et al. (2021). S wave velocity structure of the crust and upper mantle beneath Shanxi rift, central north China craton and its tectonic implications. Tectonics 40 (4). doi:10.1029/2020tc006239
Caldwell, T. G., Bibby, H. M., and Brown, C. (2004). The magnetotelluric phase tensor. Geophys. J. Int. 158 (2), 457–469. doi:10.1111/j.1365-246X.2004.02281.x
Chang, L., Wang, C., and Ding, Z. (2011). Upper mantle anisotropy in the Ordos Block and its margins. Sci. China Earth Sci. 54 (6), 888–900. doi:10.1007/s11430-010-4137-2
Chave, A. D., and Jones, A. G. (2012). The magnetotelluric method: Theory and practice. New York, NY: Cambridge University Press.
Chen, L., Tao, W., Zhao, L., and Zheng, T. (2008). Distinct lateral variation of lithospheric thickness in the Northeastern North China Craton. Earth Planet. Sci. Lett. 267 (1-2), 56–68. doi:10.1016/j.epsl.2007.11.024
Chen, L., Cheng, C., and Wei, Z. (2009). Seismic evidence for significant lateral variations in lithospheric thickness beneath the central and Western North China Craton. Earth Planet. Sci. Lett. 286 (1-2), 171–183. doi:10.1016/j.epsl.2009.06.022
Chen, L., Jiang, M., Yang, J., Wei, Z., Liu, C., and Ling, Y. (2014). Presence of an intralithospheric discontinuity in the central and Western North China Craton: Implications for destruction of the craton. Geology 42 (3), 223–226. doi:10.1130/g35010.1
Chen, L. (2009). Lithospheric structure variations between the eastern and central North China Craton from S- and P-receiver function migration. Phys. Earth Planet. Interiors 173 (3-4), 216–227. doi:10.1016/j.pepi.2008.11.011
Chen, L. (2010). Concordant structural variations from the surface to the base of the upper mantle in the North China Craton and its tectonic implications. Lithos 120 (1-2), 96–115. doi:10.1016/j.lithos.2009.12.007
Clark, M. K., and Royden, L. H. (2000). Topographic ooze: Building the eastern margin of Tibet by lower crustal flow. Geology 28 (8), 703. doi:10.1130/0091-7613(2000)28<703:tobtem>2.0.co;2
Davies, J. H. (2013). Global map of solid Earth surface heat flow. Geochem. Geophys. Geosyst. 14 (10), 4608–4622. doi:10.1002/ggge.20271
Deng, J., Xiao, Q., Qiu, R., Liu, C., Zhao, G., Yu, B., et al. (2006). Cenozoic lithospheric extension and thinning of North China: Mechanism and process. Geol. China 33, 751–761.
Deng, J., Wei, W., Qiu, R., Ye, G., Yao, C., Yu, B., et al. (2007). The three dimensional structure of lithosphere and its evolution in north China. Beijing: Geological Publication House, 1–276.
Deng, Y., Xu, Y., and Chen, Y. (2021). Formation mechanism of the North–South Gravity lineament in eastern China. Tectonophysics 818, 229074. doi:10.1016/j.tecto.2021.229074
Dong, H., Wei, W., Ye, G., Jin, S., Jones, A. G., Jing, J., et al. (2014). Three-dimensional electrical structure of the crust and upper mantle in Ordos Block and adjacent area: Evidence of regional lithospheric modification. Geochem. Geophys. Geosyst. 15 (6), 2414–2425. doi:10.1002/2014gc005270
Egbert, G. D., and Booker, J. R. (1986). Robust estimation of geomagnetic transfer functions. Geophys. J. Int. 87 (1), 173–194. doi:10.1111/j.1365-246x.1986.tb04552.x
Egbert, G. D., and Kelbert, A. (2012). Computational recipes for electromagnetic inverse problems. Geophys. J. Int. 189 (1), 251–267. doi:10.1111/j.1365-246X.2011.05347.x
Frost, B. R., Fyfe, W. S., Tazaki, K., and Chan, T. (1989). Grain-boundary graphite in rocks and implications for high electrical conductivity in the lower crust. Nature 340 (6229), 134–136. doi:10.1038/340134a0
Gao, S., Rudnick, R. L., Yuan, H.-L., Liu, X.-M., Liu, Y.-S., Xu, W.-L., et al. (2004). Recycling lower continental crust in the North China craton. Nature 432 (7019), 892–897. doi:10.1038/nature03162
Gardés, E., Gaillard, F., and Tarits, P. (2014). Toward a unified hydrous olivine electrical conductivity law. Geochem. Geophys. Geosyst. 15 (12), 4984–5000. doi:10.1002/2014gc005496
Glover, P. W., Hole, M. J., and Pous, J. (2000). A modified Archie's law for two conducting phases. Earth Planet. Sci. Lett. 180 (3-4), 369–383. doi:10.1016/s0012-821x(00)00168-0
Guo, Z., Tang, Y.-C., Chen, J., Ning, J.-Y., Feng, Y.-G., and Yue, H. (2012). A study on crustal and upper mantle structures in east part of North China Craton using receiver functions. Chin. J. Geophys. 55 (11), 3591–3600. doi:10.6038/j.issn.0001-5733.2012.11.008
Hu, X., Lin, W., Yang, W., and Yang, B. (2020). A review on developments in the electrical structure of craton lithosphere. Sci. China Earth Sci. 63 (11), 1661–1677. doi:10.1007/s11430-019-9653-2
Huang, Z., Li, H., Zheng, Y., and Peng, Y. (2009). The lithosphere of North China Craton from surface wave tomography. Earth Planet. Sci. Lett. 288 (1-2), 164–173. doi:10.1016/j.epsl.2009.09.019
Humlera, E., Langmuirb, C., and Dauxc, V. (1999). Depth versus age: new perspectives from the chemical compositions of ancient crust. Earth Planet. Sci. Lett. 173 (1-2), 7–23. doi:10.1016/s0012-821x(99)00218-6
Jia, S., Wang, F., Tian, X., Duan, Y., Zhang, J., Liu, B., et al. (2014). Crustal structure and tectonic study of North China Craton from a long deep seismic sounding profile. Tectonophysics 627, 48–56. doi:10.1016/j.tecto.2014.04.013
Jiang, M., Ai, Y., Chen, L., and Yang, Y. (2013). Local modification of the lithosphere beneath the central and Western north China craton: 3-D constraints from Rayleigh wave tomography. Gondwana Res. 24 (3-4), 849–864. doi:10.1016/j.gr.2012.06.018
Jiang, S., Cao, W., Li, S., Wang, G., Somerville, I., Zhang, W., et al. (2018). Tectonic units of the early precambrian basement within the North China craton: Constraints from gravitational and magnetic anomalies. Precambrian Res. 318, 122–132. doi:10.1016/j.precamres.2018.10.002
Jiang, G., Hu, S., Shi, Y., Zhang, C., Wang, Z., and Hu, D. (2019). Terrestrial heat flow of continental China: Updated dataset and tectonic implications. Tectonophysics 753, 36–48. doi:10.1016/j.tecto.2019.01.006
Jones, A. G., Lezaeta, P., Ferguson, I. J., Chave, A. D., Evans, R. L., Garcia, X., et al. (2003). The electrical structure of the Slave craton. Lithos 71 (2-4), 505–527. doi:10.1016/j.lithos.2003.08.001
Kelbert, A., Meqbel, N., Egbert, G. D., and Tandon, K. (2014). ModEM: A modular system for inversion of electromagnetic geophysical data. Comput. Geosci. 66, 40–53. doi:10.1016/j.cageo.2014.01.010
Krieger, L., and Peacock, J. R. (2014). MTpy: A Python toolbox for magnetotellurics. Comput. Geosci. 72, 167–175. doi:10.1016/j.cageo.2014.07.013
Kusky, T. M., Windley, B. F., and Zhai, M. G. (2007). Tectonic evolution of the North China block: from orogen to craton to orogen. Geol. Soc. Lond. Spec. Publ. 280 (1), 1–34. doi:10.1144/sp280.1
Li, S., Lai, X., Liu, B., Wang, Z., He, J., and Sun, y. (2011). Differences in lithospheric structures between two sides of Taihang Mountain obtained from the Zhucheng-Yichuan deep seismic sounding profile. Sci. China Earth Sci. 54 (6), 871–880. doi:10.1007/s11430-011-4191-4
Li, C., Bai, D., Xue, S., Li, X., Ma, X., Yan, Y., et al. (2017). A magnetotelluric study of the deep electric structure beneath the Ordos Block. Chin. J. Geophys. 60 (5), 1788–1799.
Li, Y., Pan, J., Wu, Q., and Ding, Z. (2017). Lithospheric structure beneath the northeastern Tibetan Plateau and the Western Sino-Korea Craton revealed by Rayleigh wave tomography. Geophys. J. Int. 210 (2), 570–584. doi:10.1093/gji/ggx181
Li, X., Chen, Y., Tian, X., and Liu, S. (2022). Magnetotelluric evidence for distributed lithospheric modification beneath the yinchuan-jilantai rift system and its implications for late cenozoic rifting in Western north China. J. Geophys. Res. Solid Earth 127 (3), 1–20. doi:10.1029/2021jb022585
Liu, M., Cui, X., and Liu, F. (2004). Cenozoic rifting and volcanism in eastern China: a mantle dynamic link to the indo–asian collision? Tectonophysics 393 (1-4), 29–42. doi:10.1016/j.tecto.2004.07.029
Liu, Q., Zhang, L., Zhang, C., and He, L. (2016). Lithospheric thermal structure of the North China Craton and its geodynamic implications. J. Geodyn. 102, 139–150. doi:10.1016/j.jog.2016.09.005
Liu, J., Wu, J., Wang, W., Cai, Y., and Fang, L. (2021). Seismic anisotropy and implications for lithospheric deformation beneath the Ordos Block and surrounding regions. Geophys. J. Int. 226 (3), 1885–1896. doi:10.1093/gji/ggab154
Liu, J., Xia, Q., Deloule, E., Ingrin, J., Chen, H., and Feng, M. (2015b). Water Content and Oxygen Isotopic Composition of Alkali Basalts from the Taihang Mountains, China: Recycled Oceanic Components in the Mantle Source. Journal of Petrology 56 (4), 681–702. doi:10.1093/petrology/egv013
Liu, Z., Wang, F., Zhang, X., Duan, Y., Yang, Z., and Lin, J. (2015). Seismic structure of the lithosphere beneath eastern north China craton: results from long distance deep seismic sounding. Chin. J. Geophys. 58 (4), 1145–1157. doi:10.6038/cjg20150405
Maier, R., Heinson, G., Thiel, S., Selway, K., Gill, R., and Scroggs, M. (2007). A 3D lithospheric electrical resistivity model of the Gawler Craton, Southern Australia. Appl. Earth Sci. 116 (1), 13–21. doi:10.1179/174327507x167037
Maus, S., Sazonova, T., Hemant, K., Fairhead, J. D., and Ravat, D. (2007). National geophysical data center candidate for the World digital magnetic anomaly map. Geochem. Geophys. Geosyst. 8 (6), 1–10. doi:10.1029/2007gc001643
McNeice, G. W., and Jones, A. G. (2001). Multisite, multifrequency tensor decomposition of magnetotelluric data. Geophysics 66 (1), 158–173. doi:10.1190/1.1444891
Menzies, M., Xu, Y., Zhang, H., and Fan, W. (2007). Integration of geology, geophysics and geochemistry: A key to understanding the North China craton. Lithos 96 (1-2), 1–21. doi:10.1016/j.lithos.2006.09.008
Michaut, C., Jaupart, C., and Mareschal, J.-C. (2009). Thermal evolution of cratonic roots. Lithos 109 (1-2), 47–60. doi:10.1016/j.lithos.2008.05.008
Ni, H., Keppler, H., and Behrens, H. (2011). Electrical conductivity of hydrous basaltic melts: implications for partial melting in the upper mantle. Contrib. Mineral. Petrol. 162 (3), 637–650. doi:10.1007/s00410-011-0617-4
Pavlis, N. K., Holmes, S. A., Kenyon, S. C., and Factor, J. K. (2012). The development and evaluation of the earth gravitational model 2008 (EGM2008). J. Geophys. Res. Solid Earth 117 (B4), 1–38. doi:10.1029/2011jb008916
Qi, K., Ren, Z., Cui, J., and Yu, Q. (2020). Meso-Cenozoic lithospheric thermal structure and its significance in the evolution of the lithosphere in the Ordos Basin, WNCC, China. Int. Geol. Rev. 63 (17), 2146–2165. doi:10.1080/00206814.2020.1827459
Ren, J., Tamaki, K., Li, S., and Junxia, Z. (2002). Late Mesozoic and Cenozoic rifting and its dynamic setting in Eastern China and adjacent areas. Tectonophysics 344 (3-4), 175–205. doi:10.1016/s0040-1951(01)00271-2
Ren, Z., Zhang, S., Gao, S., Cui, J., Xiao, Y., and Xiao, H. (2007). Tectonic thermal history and its significance on the formation of oil and gas accumulation and mineral deposit in Ordos Basin. Sci. China Ser. D Earth Sci. 50 (2), 27–38. doi:10.1007/s11430-007-6022-1
Rudnick, R. L., Gao, S., Ling, W.-l., Liu, Y.-s., and McDonough, W. F. (2004). Petrology and geochemistry of spinel peridotite xenoliths from Hannuoba and Qixia, North China craton. Lithos 77 (1-4), 609–637. doi:10.1016/j.lithos.2004.03.033
Selway, K. (2013). On the causes of electrical conductivity anomalies in tectonically stable lithosphere. Surv. Geophys. 35 (1), 219–257. doi:10.1007/s10712-013-9235-1
Shi, Y., Xu, Y., Yang, B., and Liu, S. (2022). Lithospheric conductors shed light on the non-uniform destruction of north China craton. J. Geophys. Res. Solid Earth 127 (3), 1–16. doi:10.1029/2021jb022587
Sifre, D., Gardes, E., Massuyeau, M., Hashim, L., Hier-Majumder, S., and Gaillard, F. (2014). Electrical conductivity during incipient melting in the oceanic low-velocity zone. Nature 509 (7498), 81–85. doi:10.1038/nature13245
Sun, Y., Dong, S., Zhang, H., Li, H., and Shi, Y. (2013). 3D thermal structure of the continental lithosphere beneath China and adjacent regions. J. Asian Earth Sci. 62, 697–704. doi:10.1016/j.jseaes.2012.11.020
Tang, Y., Chen, Y. J., Zhou, S., Ning, J., and Ding, Z. (2013). Lithosphere structure and thickness beneath the North China Craton from joint inversion of ambient noise and surface wave tomography. J. Geophys. Res. Solid Earth 118 (5), 2333–2346. doi:10.1002/jgrb.50191
Tang, Y., Ying, J., Zhao, Y., and Xu, X. (2021). Nature and secular evolution of the lithospheric mantle beneath the North China Craton. Sci. China Earth Sci. 64 (9), 1492–1503. doi:10.1007/s11430-020-9737-4
Tian, X., Teng, J., Zhang, H., Zhang, Z., Zhang, Y., Yang, H., et al. (2011). Structure of crust and upper mantle beneath the Ordos Block and the Yinshan Mountains revealed by receiver function analysis. Phys. Earth Planet. Inter. 184 (3-4), 186–193. doi:10.1016/j.pepi.2010.11.007
Tian, X., Zelt, C. A., Wang, F., Jia, S., and Liu, Q. (2014). Crust structure of the North China Craton from a long-range seismic wide-angle-reflection/refraction data. Tectonophysics 634, 237–245. doi:10.1016/j.tecto.2014.07.008
Tommasi, A., and Vauchez, A. A. (2001). Continental rifting parallel to ancient collisional belts: an effect of the mechanical anisotropy of the lithospheric mantle. Earth Planet. Sci. Lett. 182, 199–210. doi:10.1016/s0012-821x(00)00350-2
Tyburczy, J. A., and Waff, H. S. (1983). Electrical conductivity of molten basalt and andesite to 25 kilobars pressure: Geophysical significance and implications for charge transport and melt structure. J. Geophys. Res. 88 (B3), 2413. doi:10.1029/JB088iB03p02413
Wang, M., and Shen, Z. (2020). Present-day crustal deformation of continental China derived from GPS and its tectonic implications. J. Geophys. Res. Solid Earth 125 (2), 1–22. doi:10.1029/2019jb018774
Wang, T., Xu, M., Wang, L., Liu, S., and Hu, X. (2007). Aeromagnetic anomaly analysis of Ordos and adjacent regions and its tectonic implications. Chin. J. Geophys. 50 (1), 158–166. doi:10.1002/cjg2.1022
Wang, S., Wang, F., Zhang, J., Jia, S., Zhang, C., Zhao, J., et al. (2014). The P-wave velocity structure of the lithosphere of the North China craton—results from the wendeng-alxa left banner deep seismic sounding profile. Sci. China Earth Sci. 57 (9), 2053–2063. doi:10.1007/s11430-014-4903-7
Wang, X., Zhang, J., Fu, P., and Gao, M. (2015). Deep structures of Yishu Fault Zone derived from gravity data. Seismol. Geol. 37 (3), 731–747.
Wang, Y., Zhou, L., Liu, S., Li, J., and Yang, T. (2018). Post-cratonization deformation processes and tectonic evolution of the North China Craton. Earth-Sci. Rev. 177, 320–365. doi:10.1016/j.earscirev.2017.11.017
Wei, W., Ye, G., Jin, S., Deng, M., Jing, J. e., Peng, Z., et al. (2008). Geoelectric structure of lithosphere beneath eastern north China: features of thinned lithosphere from magnetotelluric soundings. Earth Sci. Front. 15 (4), 204–216. doi:10.1016/s1872-5791(08)60055-x
Wei, W., Zhao, D., Xu, J., Zhou, B., and Shi, Y. (2016). Depth variations of P-wave azimuthal anisotropy beneath Mainland China. Sci. Rep. 6, 29614. doi:10.1038/srep29614
Wu, F.-Y., Xu, Y. G., Gao, S., and Zheng, J. (2008). Lithospheric thinning and destruction of the North China craton. Acta Petrol. Sin. 24 (6), 1145–1174.
Wu, F., Xu, Y., Zhu, R., and Zhang, G. (2014). Thinning and destruction of the cratonic lithosphere: A global perspective. Sci. China Earth Sci. 57 (12), 2878–2890. doi:10.1007/s11430-014-4995-0
Wu, F.-Y., Yang, J.-H., Xu, Y.-G., Wilde, S. A., and Walker, R. J. (2019). Destruction of the North China craton in the mesozoic. Annu. Rev. Earth Planet. Sci. 47 (1), 173–195. doi:10.1146/annurev-earth-053018-060342
Xia, Q., Hao, Y., Liu, S., Gu, X., and Feng, m. (2013). Water contents of the Cenozoic lithospheric mantle beneath the Western part of the North China Craton: Peridotite xenolith constraints. Gondwana Res. 23 (1), 108–118. doi:10.1016/j.gr.2012.01.010
Xia, Q., Liu, J., Kovacs, I., Hao, Y., Li, P., Yang, X., et al. (2019). Water in the upper mantle and deep crust of eastern China: concentration, distribution and implications. Natl. Sci. Rev. 6 (1), 125–144. doi:10.1093/nsr/nwx016
Xu, L., Wei, W., Jin, S., Ye, G., Liang, H., Jia, C., et al. (2017). Study of deep electrical structure along a profile from northern Ordos block to Yinshan orogenic belt. Chin. J. Geophys. 60 (2), 575–584. doi:10.6038/cig20170212
Xu, X., Zhao, L., Wang, K., and Yang, J. (2018). Indication from finite-frequency tomography beneath the North China Craton: The heterogeneity of craton destruction. Sci. China Earth Sci. 48 (9), 1238–1260. doi:10.1007/s11430-017-9201-y
Xu, Y. (2001). Thermo-tectonic destruction of the archaean lithospheric keel beneath the sino-Korean craton in china: evidence, timing and mechanism. Phys. Chem. Earth 26 (9-10), 747–757. doi:10.1016/s1464-1895(01)00124-7
Xu, Y. (2007). Diachronous lithospheric thinning of the North China Craton and formation of the Daxin'anling–Taihangshan gravity lineament. Lithos 96 (1-2), 281–298. doi:10.1016/j.lithos.2006.09.013
Yan, D., Tian, Y., Zhao, D., Liu, C., Zhu, H., and Li, H. (2019). Upper mantle temperature structure of the North China Craton. Phys. Earth Planet. Inter. 293, 106269. doi:10.1016/j.pepi.2019.106269
Ye, G., Wei, W., Jin, S., and Jing, J. e. (2009). Study of the electrical structure and its geological meanings of the middle part of Tancheng-Lujiang fault zone. Chin. J. Geophys. 52 (11), 2818–2825. doi:10.2969/j.issn.0001-5733.2009.11.016
Ye, G., Liu, C., Luo, X., Jin, S., Wei, W., Dong, H., et al. (2021). Dynamical significance of the Tanlu Fault Zone in the destruction of the North China craton: The evidence provided by the three-dimensional magnetotelluric array study. Tectonophysics 813, 228910. doi:10.1016/j.tecto.2021.228910
Yin, Y., Jin, S., Wei, W., Santosh, M., Dong, H., and Xie, C. (2016). Construction and destruction of the North China craton with implications for metallogeny: Magnetotelluric evidence from the hengshan–wutai–fuping region within Trans-North China orogen. Gondwana Res. 40, 21–42. doi:10.1016/j.gr.2016.08.001
Yin, Y., Jin, S., Wei, W., Ye, G., Jing, J. e., Zhang, L., et al. (2017). Lithospheric rheological heterogeneity across an intraplate rift basin (Linfen Basin, North China) constrained from magnetotelluric data: Implications for seismicity and rift evolution. Tectonophysics 717, 1–15. doi:10.1016/j.tecto.2017.07.014
Yoshino, T., Matsuzaki, T., Yamashita, S., and Katsura, T. (2006). Hydrous olivine unable to account for conductivity anomaly at the top of the asthenosphere. Nature 443 (7114), 973–976. doi:10.1038/nature05223
Yoshino, T., Laumonier, M., McIsaac, E., and Katsura, T. (2010). Electrical conductivity of basaltic and carbonatite melt-bearing peridotites at high pressures: Implications for melt distribution and melt fraction in the upper mantle. Earth Planet. Sci. Lett. 295 (3-4), 593–602. doi:10.1016/j.epsl.2010.04.050
Yuan, Y., Hu, S., Wang, H., and Sun, F. (2007). Meso-Cenozoic tectonothermal evolution of Ordos basin, central China: Insights from newly acquired vitrinite reflectance data and a revision of existing paleothermal indicator data. J. Geodyn. 44 (1-2), 33–46. doi:10.1016/j.jog.2006.12.002
Zhai, M., Guo, J., and Liu, W. (2005). Neoarchean to paleoproterozoic continental evolution and tectonic history of the North China craton: a review. J. Asian Earth Sci. 24 (5), 547–561. doi:10.1016/j.jseaes.2004.01.018
Zhai, M. (2019). Tectonic evolution of the North China craton. J. Geomech. 25 (5), 722–745. doi:10.12090/j.issn.1006-6616.2019.25.05.063
Zhang, B., and Yoshino, T. (2017). Effect of graphite on the electrical conductivity of the lithospheric mantle. Geochem. Geophys. Geosyst. 18 (1), 23–40. doi:10.1002/2016gc006530
Zhang, Y., Ma, Y., Yang, N., Shi, W., and Dong, S. (2003). Cenozoic extensional stress evolution in North China. J. Geodyn. 36 (5), 591–613. doi:10.1016/j.jog.2003.08.001
Zhang, J., Zhao, G., Xiao, Q., and Tang, J. (2010). Analysis of electric structure of the central Tan-Lu fault zone (Yi-Shu fault zone, 36 N) and seismogenic condition. Chin. J. Geophys. 53 (3), 605–611. doi:10.3969/j.issn.0001-5733.2010.03.014
Zhang, H., Huang, Q., Zhao, G., Guo, Z., and Chen, Y. J. (2016). Three-dimensional conductivity model of crust and uppermost mantle at the northern Trans North China Orogen: Evidence for a mantle source of Datong volcanoes. Earth Planet. Sci. Lett. 453, 182–192. doi:10.1016/j.epsl.2016.08.025
Zhang, Y., Chen, L., Ai, Y., and Jiang, M. (2019). Lithospheric structure beneath the central and Western North China Craton and adjacent regions from S-receiver function imaging. Geophys. J. Int. 219 (1), 619–632. doi:10.1093/gji/ggz322
Zhao, G., and Cawood, P. A. (2012). Precambrian geology of China. Precambrian Res. 222-223, 13–54. doi:10.1016/j.precamres.2012.09.017
Zhao, G., and Zhai, M. (2013). Lithotectonic elements of precambrian basement in the North China craton: Review and tectonic implications. Gondwana Res. 23 (4), 1207–1240. doi:10.1016/j.gr.2012.08.016
Zhao, G., Sun, M., and Wilde, S. A. (2002). Major tectonic units of the North China Craton and their Paleoproterozoic assembly. Sci. China, Ser. D Earth Sci. 46 (7), 23–38. doi:10.1360/03yd9003
Zhao, G., Sun, M., Wilde, S. A., and Li, S. (2005). Late archean to paleoproterozoic evolution of the North China craton: Key issues revisited. Precambrian Res. 136 (2), 177–202. doi:10.1016/j.precamres.2004.10.002
Zhao, D., Maruyama, S., and Omori, S. (2007). Mantle dynamics of Western pacific and east asia: Insight from seismic tomography and mineral physics. Gondwana Res. 11 (1-2), 120–131. doi:10.1016/j.gr.2006.06.006
Zhao, L., Allen, R. M., Zheng, T., and Hung, S.-H. (2009). Reactivation of an archean craton: Constraints from P- and S-wave tomography in north China. Geophys. Res. Lett. 36 (17), L17306. doi:10.1029/2009gl039781
Zhao, G., Zhan, Y., Wang, L., Wang, J., Tang, J., Chen, X., et al. (2010). Electrical structure of the crust beneath the Ordos block. Earthq. Res. China 25 (2), 121–134.
Zhao, G., Cawood, P. A., Li, S., Wilde, S. A., Sun, M., Zhang, J., et al. (2012). Amalgamation of the North China craton: Key issues and discussion. Precambrian Res. 222-223, 55–76. doi:10.1016/j.precamres.2012.09.016
Zheng, T., Zhao, L., Xu, W., and Zhu, R. (2008). Insight into modification of north China craton from seismological study in the Shandong Province. Geophys. Res. Lett. 35 (22), L22305. doi:10.1029/2008gl035661
Zheng, T., Zhao, L., and Zhu, R. (2009). New evidence from seismic imaging for subduction during assembly of the North China craton. Geology 37 (5), 395–398. doi:10.1130/g25600a.1
Zheng, Y., Xu, Z., Zhao, Z., and Dai, L. (2018). Mesozoic mafic magmatism in North China: Implications for thinning and destruction of cratonic lithosphere. Sci. China Earth Sci. 61 (4), 353–385. doi:10.1007/s11430-017-9160-3
Zheng, J. (2009). Comparison of mantle-derived matierals from different spatiotemporal settings: Implications for destructive and accretional processes of the North China Craton. Sci. Bull. 54 (19), 3397–3416. doi:10.1007/s11434-009-0308-y
Zhou, L., Li, S., Zhao, G., Liu, Z., Guo, X., and Wang, J. (2004). Gravity and magnetic features of crystalline basement in the central and Eastern North China Craton. Prog. Geophys. 19 (1), 91–100.
Zhu, R., and Zheng, T. (2009). Destruction geodynamics of the North China craton and its Paleoproterozoic plate tectonics. Sci. Bull. 54 (19), 3354–3366. doi:10.1007/s11434-009-0451-5
Zhu, R., Chen, L., Wu, F., and Liu, J. (2011). Timing, scale and mechanism of the destruction of the North China Craton. Sci. China Earth Sci. 54 (6), 789–797. doi:10.1007/s11430-011-4203-4
Keywords: magnetotelluric sounding, North China Craton, lithospheric resistivity model, lithospheric destruction, spatial heterogeneity
Citation: Ji L, Ye G, Jin S, Ma X, Wei W, Wang S, Qi J, Lei Q and Gu J (2023) Spatial heterogeneity of the lithospheric destruction of the North China Craton: Evidence from an extended magnetotelluric sounding profile. Front. Earth Sci. 10:1105274. doi: 10.3389/feart.2022.1105274
Received: 22 November 2022; Accepted: 28 December 2022;
Published: 13 January 2023.
Edited by:
Zhanwu Lu, Chinese Academy of Geological Sciences, ChinaCopyright © 2023 Ji, Ye, Jin, Ma, Wei, Wang, Qi, Lei and Gu. This is an open-access article distributed under the terms of the Creative Commons Attribution License (CC BY). The use, distribution or reproduction in other forums is permitted, provided the original author(s) and the copyright owner(s) are credited and that the original publication in this journal is cited, in accordance with accepted academic practice. No use, distribution or reproduction is permitted which does not comply with these terms.
*Correspondence: Gaofeng Ye, eWdmQGN1Z2IuZWR1LmNu