 Haomin Ji
 An Li
An Li Shimin Zhang
 Ji Zhang3
- 1National Institute of Natural Hazards, Ministry of Emergency Management of China, Beijing, China
- 2State Key Laboratory of Earthquake Dynamics, Institute of Geology, China Earthquake Administration, Beijing, China
- 3The Third Railway Survey and Design Institute Group Corporation, Tianjin, China
The Northern Anqiu–Juxian Fault (NAJF) is one of the most active faults in the Tan-Lu Fault Zone (TLFZ), which produced the Anqiu M 7 earthquake in 70 BC. However, there is no clear understanding of the surface rupture caused by this historical earthquake. In this study, we determined the earthquake rupture characteristics of the NAJF based on high-precision surveying, geophysical exploration and drilling profiles. Based on an analysis of 87 horizontal offsets of gullies, we estimated a characteristic offset of ∼ 5 m along the NAJF for a rupture length about 130 km. Geophysical exploration results revealed a shallow geometric distribution of stepovers in the NAJF. We concluded that the ∼ 5 m offset and the rupture length of about 130 km are both in agreement with an empirical relationship among the magnitude, offset, and rupture length and imply that the ∼ 1 km wide stepover could not have terminated ruptures in the Anqiu M 7 earthquake. The relationship among the coseismic offset, magnitude, and surface rupture length of a strike-slip fault show that the 70 BC Anqiu earthquake was more likely to have had a magnitude of M ∼ 7.5.
Introduction
The Tan-Lu Fault Zone (TLFZ) is about 2,400 km long and the largest active strike-slip fault zone cutting through the lithosphere in Eastern China (Zhang and Tang, 1988; Zhang et al., 2010) (Figure 1A) The Anqiu–Juxian Fault (AJF) is a significant branch of the TLFZ from Anqiu to Tancheng in Shandong Province (Figure 1B). The AJF is part of the TLFZ but is ∼ 340 km long and divided into two segments by the Juxian Basin: the Northern Anqiu–Juxian Fault (NAJF) from Anqiu to Juxian and the Southern Anqiu–Juxian fault (SAJF) from Juxian to Tancheng (Zheng et al., 1988). The 1668 AD Tancheng M 8.5 earthquake occurred on the SAJF and was one of the largest paleoearthquakes in China (Department of Earthquake Damage and Defense, CEA., 1999). The surface rupture length, coseismic offset, and recurrence interval of the SAJF have been analyzed in previous studies. Jiang et al. (2017) analyzed the horizontal offsets of gullies and inferred that the surface rupture of the Tancheng M 8.5 earthquake was more than 200 km long and the maximum coseismic dextral slip displacement was ∼ 9 m. Paleoseismic results have suggested that earthquakes occurred in the SAJF at 3,000- to 3500-years intervals with similar magnitudes (Lin and Gao, 1987; Huang, 1993; Wang, 1996; Chao et al., 1997). In comparison with the SAJF, two historical earthquakes of the NAJF (the 70 BC and 1668 AD Anqiu earthquakes) were recorded in ancient texts, and a magnitude of M ∼7 has been estimated for these earthquakes (Department of Earthquake Damage and Defense, CEA., 1999). The latest seismic (Li, 2014) and global positioning system (GPS) (Li et al., 2020) data have both indicated that the NAJF has been at a late stage of fault locking and at a considerably higher risk of large earthquakes than the SAJF. However, considerable controversy surrounds earthquake recurrence in the NAJF (He et al., 2005; Song et al., 2005; Wang et al., 2015). The characteristic displacement of the paleoearthquake was determined in a previous study, but only a few dislocations were surveyed because of total station technology limitations (Huang, 1988). An additional challenge to the low dislocation record is that several rivers flow across the NAJF and bury the trace of the fault. Consequently, there are many short fault segments (with lengths of only ∼ 20 km), such that only the exposure regions of the fault have been mapped and are not matched the magnitude of two historical events. Thus, the geometry and coseismic displacement of the NAJF needs to be determined to establish the earthquake recurrence law of the NAJF.
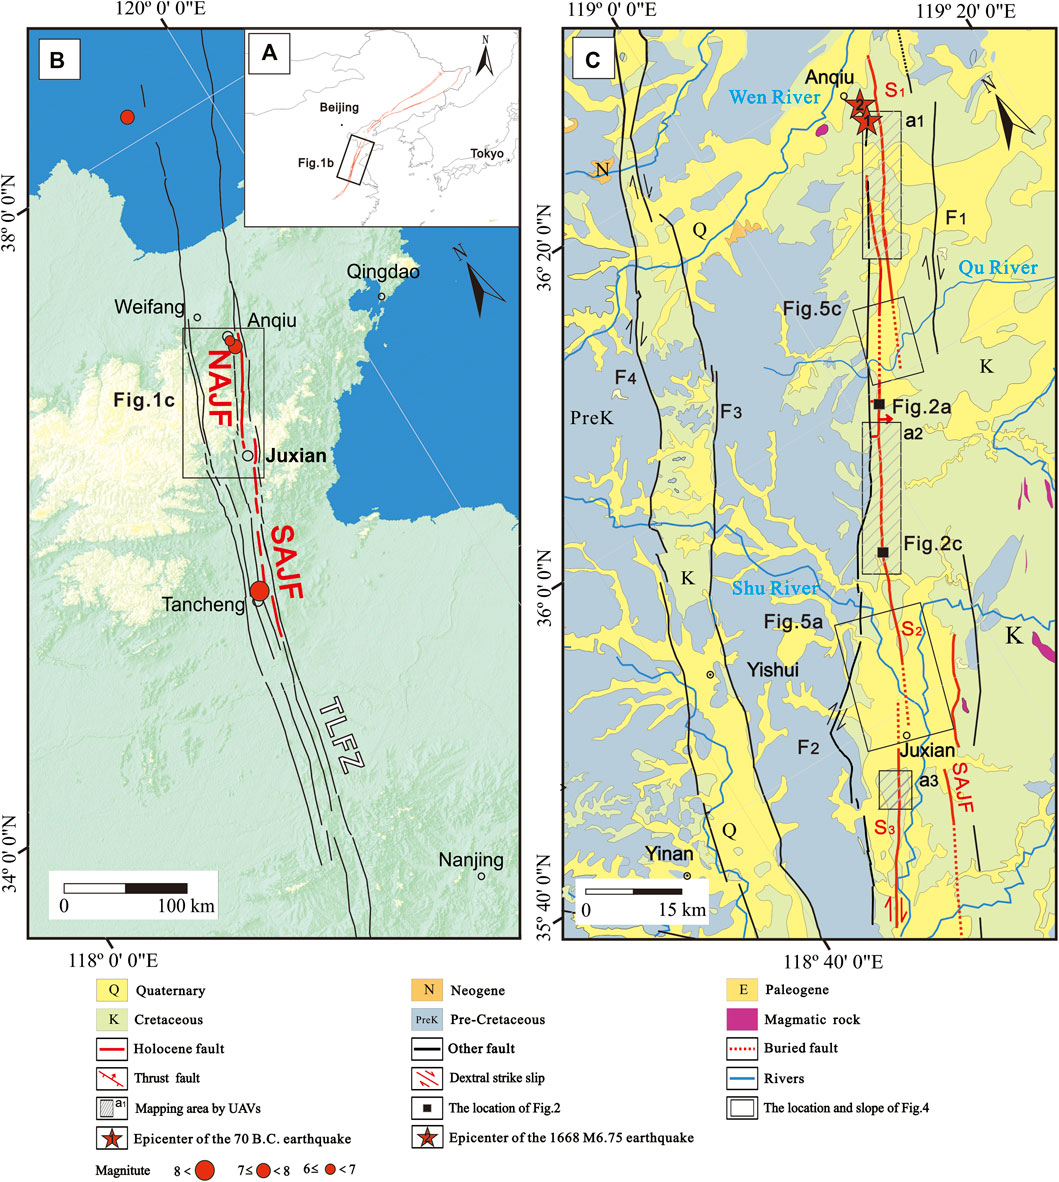
FIGURE 1. (A): Geographical location map of the Tan–Lu Fault Zone. The black rectangle shows the location of (B). (B): Geological map of the Anqiu–Juxian Fault. The black rectangle shows the location of the geological map in (C). (C): Geological map of the northern segment of the Anqiu–Juxian Fault. The black boxes show the locations of Figures 5A,C. Abbreviations for fault names: TLFZ, Tan–Lu Fault Zone; NAJF, Northern Anqiu–Juxian Fault; SAJF, Southern Anqiu–Juxian Fault; F1, Changyi–Dadian Fault; F2, Baifenzi–Fulaishan Fault; F3, Yishui–Tangtou Fault; F4, Tangwu–Gegou Fault; S1-S3: three subsegments of the NAJF, which are divided by the Wen River, the Shu River and the Qu River plain.
The geometry and earthquake characteristics of a fault are important for assessing the seismic hazard involved (Zielke et al., 2015) and predicting future earthquakes (Wells and Coppersmith, 1994; Manighetti et al., 2015; Haddon et al., 2016). A survey of the offset of geomorphic markers, e.g., mountain ridges, terrace risers, and stream channels, can be used to determine the fault kinematics (Haeussler et al., 2004; Liu-Zeng et al., 2009; Elliott et al., 2012; Rockwell and Klinger, 2013) and thereby analyze the coseismic displacement and rupture history along the fault (Klinger et al., 2011; Ren et al., 2015; Jiang et al., 2017). Geophysical exploration and drilling can reveal the geometry of faults in depth. In particular, stepover positions of faults on the surface, e.g., pull-apart basins, pressure ridges and fault bending zones, can help elucidate the propagation process or rupture termination of faults (Wesnousky, 2006; Wesnousky, 2008; Wesnousky and Biasi, 2016). The latest high-resolution surveying technology, e.g., light detection and ranging (LiDAR) (Zielke and Arrowsmith, 2012), structure from motion (SfM) (Rao et al., 2017; Guo et al., 2018), and ground penetrating radar (GPR) (Liberty et al., 2003; Li and Zhang, 2015; Zhang et al., 2019), can be employed to accurately identify the NAJF dislocation that could not be determined in the previous study and provide a new perspective on the data. Consequently, we focused on the kinematics of NAJF and used high-resolution surveying and geophysical exploration to determine the earthquake characteristics of the NAJF. The characteristic displacement was estimated from the statistics of the horizontal offsets of gullies using SfM with unmanned aerial vehicles (UAVs). The NAJF geometry was determined by shallow seismic exploration and GPR and verified using a drilling profile for buried areas.
Background
The TLFZ strikes NNE from South China to Northeast China, with a total length of over 2,400 km (Figure 1A). The TLFZ is generally believed to have originated from the collision of the North and South China blocks (Xu and Ma, 1992; Yin and Nie, 1993) and undergone two stages of sinistral strike-slip ductile shear motion in the Mesozoic and dextral strike-slip motion in the Cenozoic (Zhu et al., 2010). Multiphase activities caused the TLFZ to form five parallel faults, which trended NNE in the Shandong and Jiangsu provinces in East China in the Early Cretaceous (Wang et al., 2015) (Figure 1B) and controlled geomorphologic development (Lin et al., 1998; Zhu et al., 2011) (Figure 1B).
The trace of the AJF is composed of a series of discontinuously exposed faults, which developed at the boundary of the Late Quaternary basins. Fault contact with a high dip angle between the Late Cretaceous strata and Late Pleistocene–Holocene sediments is evident (Wang et al., 2015). The AJF is divided into two segments by the Juxian Basin: the NAJF from Anqiu to Juxian and the SAJF from Juxian to Tancheng (Figure 1B). (Zheng et al., 1988).
The M 8.5 Tancheng earthquake in the SAJF ruptured with a maximum offset of ∼ 9 m in 1668 AD (Jiang et al., 2017). Subsequently, three more paleoearthquakes recurred with similar magnitudes at a recurrence interval of 3,000–3,500 years (Lin and Gao, 1987; Huang, 1993; Wang, 1996; Chao et al., 1997). The interval and offset are consistent with an approximately 2.2–2.3 mm/a slip rate in the SAJF determined by geological and GPS methods (Wang et al., 1988; Wang and Wang, 2008; Jiang et al., 2017). The NAJF trends NNE with a total length of approximately 135 km, and some parts of the NAJF are buried in two river deposit plains (Figure 1B) (Wang et al., 2015). Trenching did not reveal surface rupture of the M 7 Anqiu earthquake but did provide evidence of two paleoearthquakes that occurred at 2–10 ka BP (He et al., 2005; Song et al., 2005).
Methods
Offset Surveying
Linear geomorphic markers (e.g., rivers, mountain ridges, and terrace risers) crossing a fault are effective records of the cumulative offset of a fault, from which the offset history can be reasonably inferred (Klinger et al., 2011; Korjenkov et al., 2012; Ren et al., 2015; Tibaldi et al., 2015; Jiang et al., 2017). We analyzed Google Earth images to determine the surficial fault traces in the study area and used a DJI Phantom 4 RTK UAV to map areas with offset gullies in the field. The UAV is connected to a continuous operational reference system (CORS) station by a 4G communication system. The UAV is equipped with a 20-million-pixel camera with a complementary metal oxide semiconductor (CMOS) sensor and a GPS that captures photographs with a 3-cm/pixel accuracy at 120 m above the ground. Each photograph provides a high-precision geographic position (vertical 1.5 cm + 1 ppm and horizontal 1 cm + 1 ppm, where 1 ppm indicates an error of 1 mm over 1 km of movement) via real-time kinematic (RTK) technology. Orthoimages and a digital elevation model (DEM) of these areas were derived using Pix4Dmapper photogrammetry software based on SfM survey photographs with a vertical and horizontal accuracy of ∼ 6 cm. Subsequently, gully offsets were measured using LaDiCao_v2, a professional analysis software program developed by Zielke (Zielke et al., 2010; Zielke and Arrowsmith, 2012; Zielke et al., 2015) on the MATLAB platform. Considering the offset measured in the field, the measurement error range of LaDiCao_v2 was within the 95% confidence interval.
Geophysical Exploration
Seismic waves can be produced by an artificial seismic source and propagated in media, such as strata and rocks. Differences in the elasticity of media cause changes in the characteristics (e.g., the speed, path, frequency, and strength) of the seismic waves as they propagate. An analysis of these differences can be used to estimate the parameters (e.g., properties, structure, and geometric locations) of the subsurface strata or rocks. The seismic reflection method was adopted in this study to ascertain traces of buried faults. The main equipment used consisted of an Aries 2.66 digital seismograph and a 20-ton controllable vehicle-mounted vibrator. The observation system used 66 times coverage and was equipped with 400 receiver channels, with a 2-m channel spacing and a 6-m shot spacing. The seismic source was triggered in the middle of the study area.
Ground penetrating radar imagery (GPR) was also a kind of high-resolution geophysical method (Daniels, 1996) and mainly used to investigate the locations and activities of the buried fault in recently studies (McClymont et al., 2009; Roberts and Raithatha, 2010; Beauprêtre et al., 2012). Electromagnetic waves were transmitted by GPR to penetrate subsurface media. They will penetrate to different depths in different media because of variations in the dielectric constants and electrical conductivities of media. Therefore, the characteristics of the subsurface rock-soil masses can be indirectly inferred from the reflection times of electromagnetic waves recorded by a receiver (Daniels, 1996). A third-generation MALA Professional Exploration digital radar system with MALA RTA25 antennas (25 MHz) was used in this study. This system can image a subsurface area within 50 m of the surface in detail. The point measurement method was adopted with a 50-m spacing between survey points.
Borehole Drilling
The dip slip between two walls of a fault could result in the vertical offset of existing stratums along the fault and then an unequal thickness layer on each side of the fault due to the rapid deposit in the negative terrain (Schwartz and Coppersmith, 1984; McCalpin, 1996). Thus, seven boreholes were dug across the S3 fault to obtain the joint-drilling geologic section and analyse the vertical displacement of the fault from the difference in the depths of layers. The uppermost point was determined based on the age of the latest strata, which is dislocated. An organic carbon sample was extracted from borehole D2 and was dated using 14C at the Beta Analytic test laboratory (USA). The radiocarbon age was calibrated using BetaCal 3.21 with the IntCal 13 atmospheric model.
Results
Dislocation of the Exposed Fault
Fault scarps and offset gullies along the fault are visible in Google Earth (Figures 2A,B). Field geological survey results show that the NAJF trends 20–30° N and begins at Juxian in the south, extending approximately 135 km to Anqiu in the north. There are several distinct outcrops along the fault (e.g., Figure 2C). Our survey showed that the NAJF consists of three discontinuously exposed fault segments that form right-stepping faults (Figure 1B). Between the exposed fault segments, the NAJF is buried in river deposit plains with relatively thick sediments.
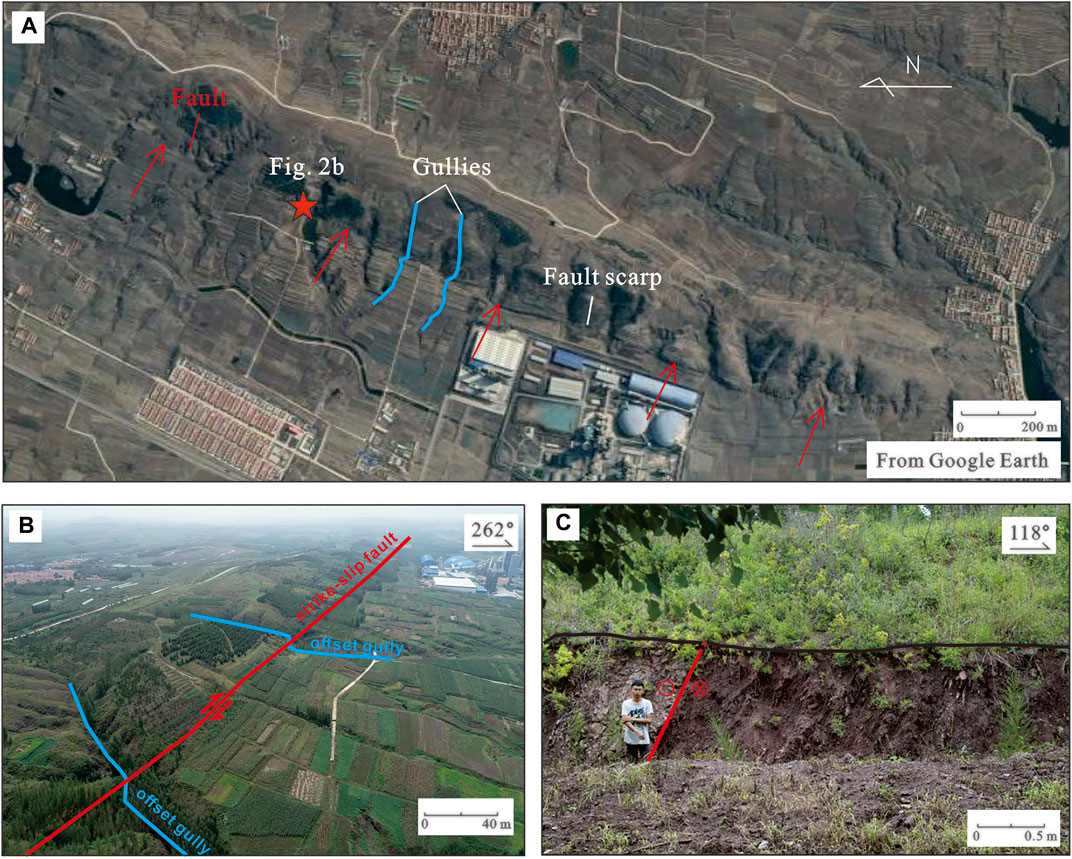
FIGURE 2. (A): Seismic geomorphology (e.g., fault scarp and offset gullies). along the NAJF; (B): Offset gullies along the NAJF; (C): Outcrop of the NAJF. The locations of Figures 2A,C are shown in Figure 1C.
High-resolution images of the offset streams in representative areas of the NAJF were captured by the UAV. Then high-accuracy orthoimages and DEM (Figure 3) data were obtained from these images. All the gully offsets were interpreted in a high-resolution DEM (Figure 3), verified through orthoimages, and measured by LaDiCao_v2 software. Along the fault traces, almost every offset gully was identified on both sides of the fault scarps with dextral strike-slip. Finally, 87 dextral strike-slip offsets of gullies were collected, including five data points from a previous study (Wang et al., 2015) (see Appendix Supplementary Table SA), ranging from 4.0 (−0.9/+0.1) to 50 (+2/−0.5) m (Figure 4).
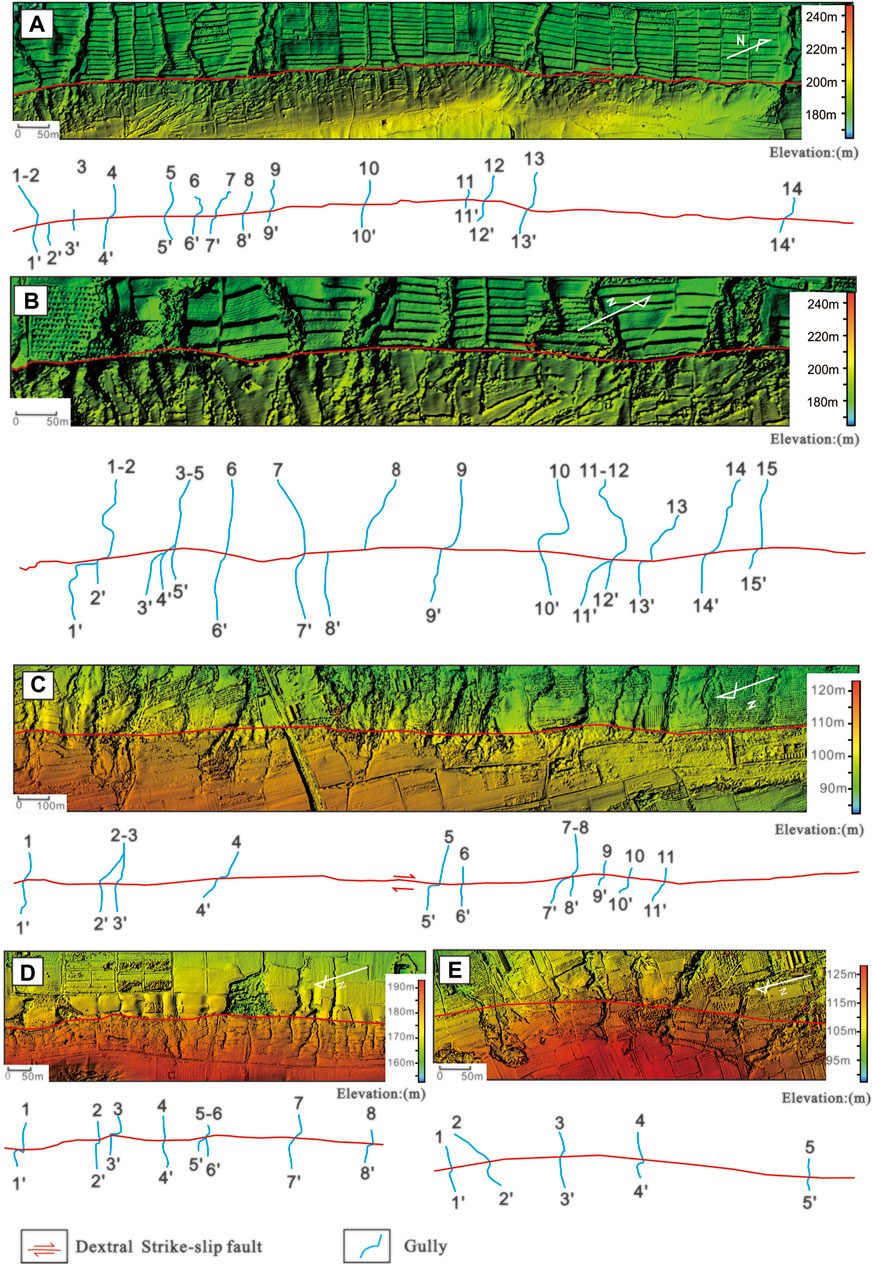
FIGURE 3. The measured topography and interpretation of the gully dislocations on the NAJF (partial): (A,B) correspond to Figure 1C (a2), and (C–E) correspond to Figure 1C (a1).
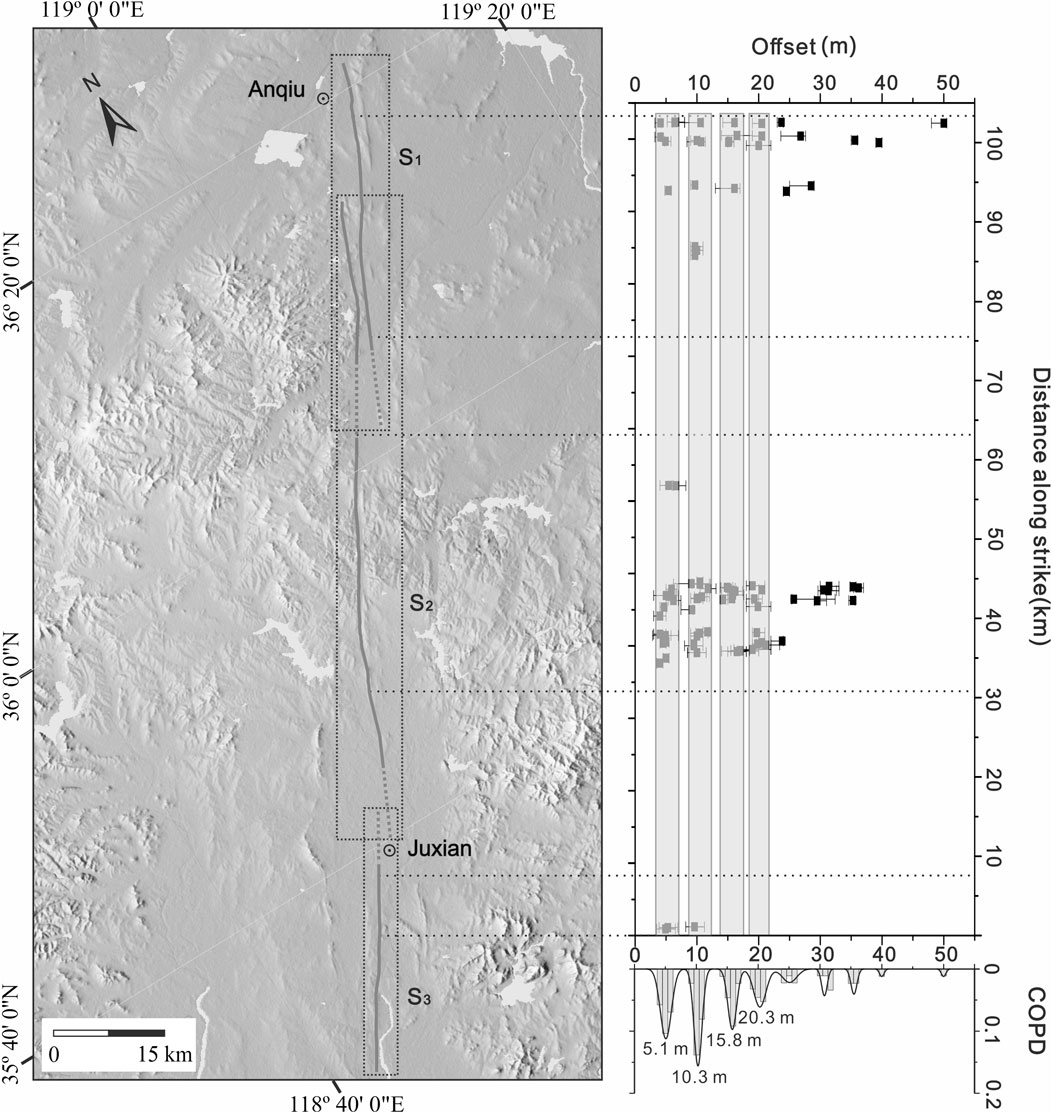
FIGURE 4. Statistics and distribution of the gully dislocations. The dotted boxes show segmentation of the NAJF by Wang et al. (2015). The scatter diagram in the upper right corner shows the projection of the offset gullies onto the NAJF. The line graph in the lower right corner shows the statistical frequency distribution of the gully offset datapoints. The figure has the same scope as Figure 1C.
Geometrical Exploration of the Buried Fault
The southern stepover is located between S2 and S3 and north of Juxian (Figure 1B). Few paleoearthquake relics have been preserved in this area because of human activities. Thus, two seismic sections, I-I’ (1700-m long) and II-II’ (3326-m long), were placed in the survey area to locate the buried fault (Figure 5A).
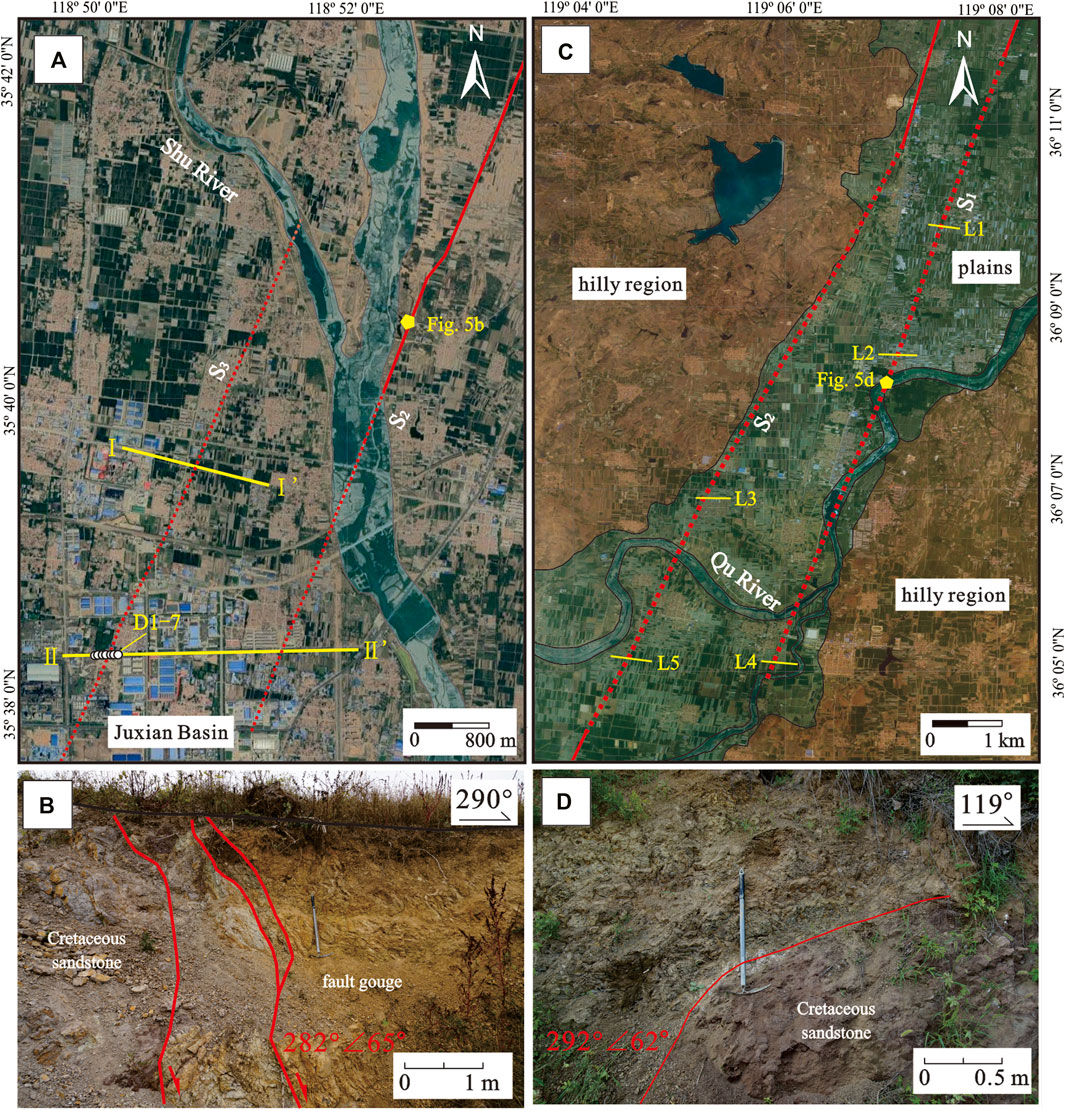
FIGURE 5. (A): The locations of the shallow seismic exploration and drilling sites. I-I′ and II-II′ indicate shallow seismic test lines. The black circles in section II-II’ represent boreholes D1-7 (the borehole locations are shown in Figure 6E). (B): A fault outcrop next to the shallow seismic survey lines. (C): Locations of GPR survey lines. (D): A fault outcrop next to the GPR survey lines. The locations of S1, S2 and S3 are shown in Figure 4.
These two seismic sections reveal unequivocal signs of the fault (Figures 6A,B): in both sections, there is a high-energy reflection layer at depths of 20–150 m (T1), which is vertically offset at a site at approximately 800 m in section I-I′ and at sites at 425 and 2,325 m in section II-II’. These phenomena were inferred to result from fault activities. The fault in section I-I′ and the left-branch fault in section II-II′ are S3, dipping to the west at ∼ 65°; the right-branch fault in section II-II’ was inferred to be S2 and dips to the east at approximately 70°. Previous geological data (Wang et al., 2015) show that T1 is the boundary between Quaternary sediments and bedrock. In addition, a fault outcrop was found at approximately 14 km from the survey line (Figure 5B), where there is clear fault contact between the Cretaceous amaranth sandstone and Cretaceous yellow sandstone with a high dip angle (65°), further demonstrating the reliability of the sections.
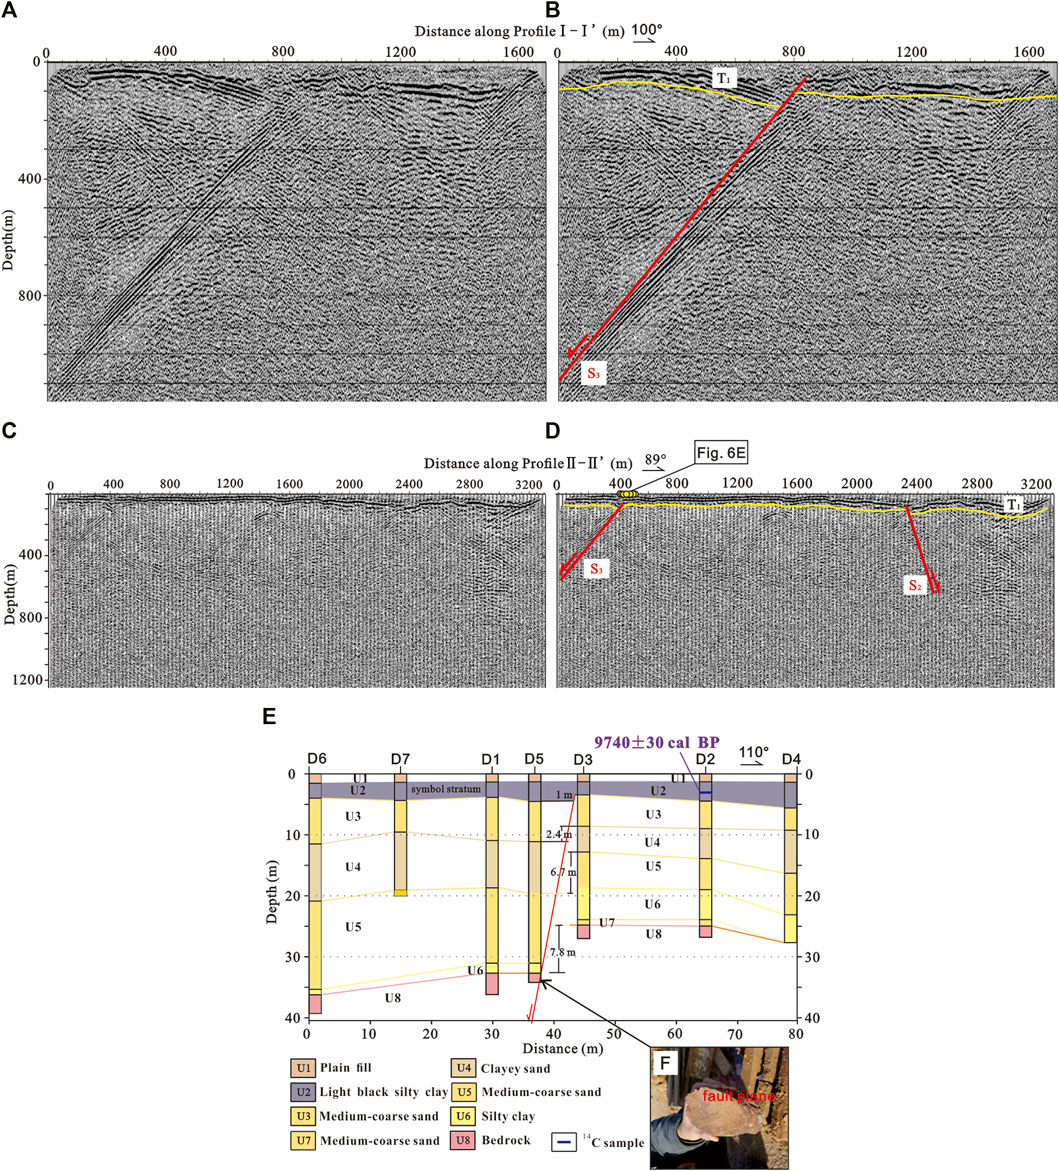
FIGURE 6. The results from shallow seismic exploration and drilling in northern Juxian. (A,B): section I-I’ of shallow seismic exploration; (C,D): Section II-II’ of shallow seismic exploration The yellow circles in Figure 6D indicate the locations of boreholes D1–7 (the detailed distribution of the boreholes is shown in Figure 6E). (E): Composite drilling section to the north of Juxian; (F): The fault plane in the broken rock obtained by drilling.
Seven boreholes were drilled to reveal the uppermost point of S3 (Figure 4E). Based on the deposit thicknesses above the bed rock, the borehole drilling depths varied from 20 to 39 m. First, the fault plane was found in the core of borehole D5 at a depth of ∼ 32 m (Figure 6F). The joint-drilling geologic section showed that all strata at the borehole D3 site are higher than those at the borehole D5 site by 1–7.8 m and that the offset of the strata increases gradually from top to bottom, suggesting that the main fault is located between boreholes D3 and D5 and that older strata may have recorded more paleoearthquake events. The light-black clay stratum U2 is the latest offset stratum at the borehole sites and is a Holocene stratum formed at approximately 9,740 ± 30 cal BP according to 14C dating (see Appendix Supplementary Figure SA). Combined with the previous paleoearthquake research (He et al., 2005), S3 was thus inferred to be active during the Holocene.
Five GPR survey lines (L1-L5) were placed along the Qu River plain (Figure 5C). Survey lines L3 and L5 were placed along the line extending from the northern end of S2, and survey lines L1, L2 and L4 were placed along the line extending from the southern end of S1 (Figure 5C).
The two GPR sections in S2 both yielded relatively good stratification information (Figure 7), including two clear stratigraphic boundaries (T0 and T1). Based on a previous study (Wang et al., 2015), T0, at a depth of 2–4 m, represents the bottom of the Holocene sediment and corresponds to U2 in the drilling section (Figure 6E), and T1, at a depth of 10–20 m, represents the bottom of the Quaternary deposits above the bedrock. The signals of T1 reflected by the upper media are relatively disordered compared with those of T0, and there are marked differences across the depth of T1—the west side of T0 is ∼ 10 m higher than the east side, from which the sudden changes in T1 (at the 100-m site on L3 and the 200–300-m site on L5 in horizon) were inferred to be fault locations. In addition, the top surface of bedrock gradually lowers from west to east, consistent with the topography for a transition from hills to plains. Moreover, T0 breaks at the fault locations on L3 and L5, which suggests that the uppermost point of the fault may be located ∼ 2 m underneath the surface and that S2 of the NAJF dislocated the Holocene strata.
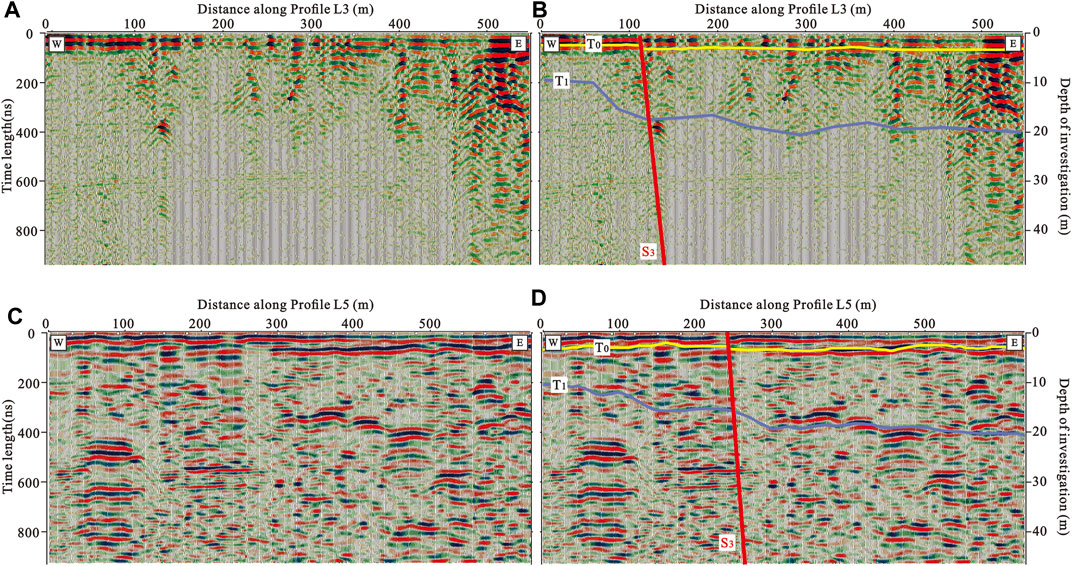
FIGURE 7. GPR sections on the line extending from the northern end of S2. (A,B): Section L3 of GPR; (C,D): Section L5 of GPR; T0: The bottom of the Holocene deposits; T1: The bottom of the Quaternary sedimentary deposits. The locations of the two test lines are shown in Figure 5C.
The GPR sections in S1 (Figure 8) show two similar reflection layers, T0 and T1, representing the bottom of the Holocene sediment and the bottom of the Quaternary deposits above the bedrock, respectively. The fault is also located where there are clear changes in the layer depth (the 240–260-m site on L1, 290–360-m site on L2 and 200–250-m site on L4 in horizon). In addition, the burial depths of the Quaternary sediment on both sides of the fault of 17 and 21 m, respectively, the height of 4 m is significantly larger than that of the Holocene sediment, indicating that the fault has been continuously active since the Quaternary. These results were corroborated by the discovery of a fault outcrop (the fault plane dips to 292° at ∼ 62°) in S1 within the basin (Figure 5D).
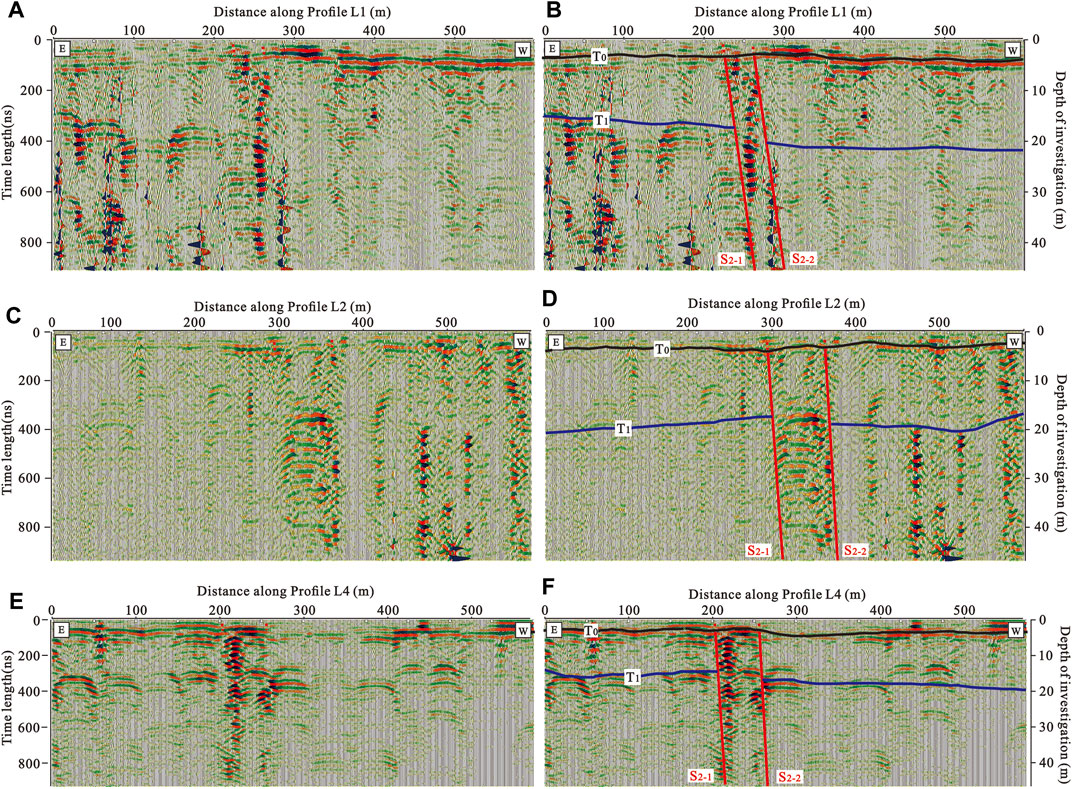
FIGURE 8. GPR sections on the line extending from the southern end of S1. (A,B): Section L1 of GPR; (C,D): Section L2 of GPR; (E,F): Section L4 of GPR; T0: The bottom of the Holocene deposits; T1: The bottom of the Quaternary sedimentary deposits. The locations of the three test lines are shown in Figure 5C.
Discussion
Characteristic Displacement of the NAJF
Characteristic earthquakes refer to multiple earthquakes that are similar in rupture length, offset distribution and magnitude and occur periodically on a fault during its long-term active period (Schwartz and Coppersmith, 1984). The seismic activity of the AJF has been characterized by primarily strong earthquakes with similar magnitudes and a lack of moderate and small earthquakes, where a linear relation with a low-b-value between high-magnitude earthquakes has been found (Chao et al., 1994). In studies on the SAJF, a characteristic displacement of approximately 9 m has been obtained (Jiang et al., 2017), with a recurrence interval of 3,000–4,000 a and a magnitude of ∼ 8.5 (Lin and Gao, 1987; Huang, 1993; Wang, 1996; Chao et al., 1997). Therefore, the earthquake events of the SAJF may obey the characteristic earthquake model.
In this study, we obtained 87 offset values, all of which were projected onto the NAJF based on distance and statistically analyzed to determine the cumulative offset probability distribution (COPD) (Figure 4). Large offsets tend to correspond to a long activity history, and offsets >25 m do not have statistical significance because of the large time error involved. The coseismic displacement of the NAJF has similar features to that of the SAJF. The horizontal offsets are mostly concentrated in four intervals, for which the COPD peaks are 5.1, 10.3, 15.8, and 20.3 m along the NAJF (Figure 4), i.e., multiples of ∼ 5 m. Despite the relatively few data points, the COPD in S3 exhibits two similar offset peaks at ∼ 5 and ∼ 10 m. These data are consistent with previous research showing that the gully offsets on the AJF are concentrated at 4–9, 14–20, and 28–34 m (Huang, 1988). Among these offsets, the largest density distribution corresponds to the 5 m offset, and the number of gullies gradually decreases as the gully offset increases, suggesting that the smallest offset of 5 m represents the latest earthquake of the NAJF and that 5 m may be the coseismic displacement of this event. Moreover, the larger offsets represent cumulative displacements associated with the relatively early earthquake events of the NAJF. Thus, similar to the SAJF, the NAJF may also have a characteristic offset of ∼ 5 m.
Rupture Length of the NAJF
The rupture segmentation of a fault can be used to evaluate its future seismic risk to serve as an important reference (Ding, 1992; Ding, 1993; Ding, 1995). The NAJF has previously been separated into S1–S3 segments based on the spatial distribution of the exposed faults (Wang et al., 2015). The geophysical detection results show that S1, S2, and S3 spatially form right-stepping faults, and relatively small widths (approximately 1 km) were found for the stepovers among these faults in this study. It is generally believed that stepovers wider than 3–5 km (Wesnousky, 2006; Wesnousky, 2008; Wesnousky and Biasi, 2016), and even those over 8 km (Wang et al., 2018), obstruct surface rupture propagation. Thus, the stepovers of the NAJF theoretically will not affect the overall rupture segmentation. This conclusion is also corroborated by our results. The coseismic offset and cumulative offset values for the three secondary faults are similar and are all multiples of approximately 5 m, suggesting similar rupture behavior for these segments.
The following empirical equations for the magnitude, coseismic displacement (Dco), and surface rupture length (SRL) have been established from the previous study (Wells and Coppersmith, 1994) on strike-slip faults:
where M is the magnitude, SRL is the surface rupture length, Dco is the coseismic displacement caused by a single seismic event, and a and b are parameters.
The possible SRLs calculated using a Dco of 5 m for a single seismic event (Table 1) range from 93.5 to 115 km, averaging 103.3 km. The data in Figure 4 show that the SRLs in S1, S2, and S3 are 45, 73, and 42 km, respectively, which are all far shorter than 103.3 km. However, the combined length of these three segments of 130 km is relatively consistent with the calculated value. Thus, we infer that the earthquake that led to a Dco of 5 m was caused by a cascade rupture of the three faults. The rupture segmentation method (Ding, 1992; Ding, 1993; Ding, 1995) shows that the three secondary faults are combined into one segment.
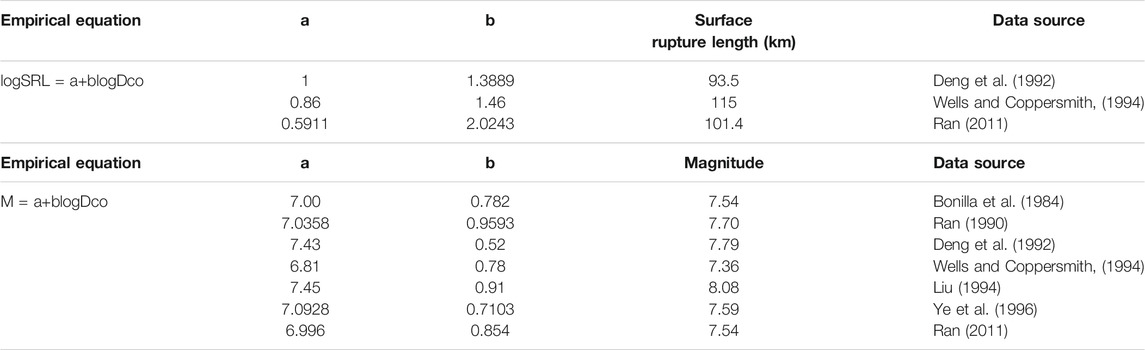
TABLE 1. Estimates of the earthquake magnitude and surface rupture length.
Magnitude of the Anqiu Earthquake in 70 BC
Some debate remains regarding the seismogenic fault and magnitude of the Anqiu earthquake in 70 BC (Li, 2014; Wang et al., 2015). The epicenter of the Anqiu earthquake was located near the NAJF based on the earthquake intensity and the disaster distribution estimated from the “History of the Han Dynasty” records (Li, 1981; Zhu and Sun, 1991) (Figure 1B). Therefore, although no geological evidence has been found to verify the seismogenic fault of this earthquake in the NAJF, most researchers consider that this earthquake probably ruptured the NAJF. In this study, the Dco on the NAJF was found to be approximately 5 m and used to calculate the magnitude of the Anqiu earthquake (Table 1). Most results show that the magnitude of the Anqiu earthquake was above 7.5, which is far higher than the historical record of M7 (Department of Earthquake Damage and Defense, CEA., 1999). In addition, historical records (Li, 2014) show that the Anqiu earthquake was felt sufficiently strongly in Xi’an City, the capital of the Han Dynasty, located ∼960 km to the west of Anqiu, that the emperor had to leave the royal palace. By consulting the earthquake intensity scale developed by the China National Standardization Management Committee (The China National Standardization Management Committee & General Administration of Quality Supervision, Inspection and Quarantine of the People’s Republic of China, 2008), the intensity of the Anqiu earthquake in Xi’an City is inferred to have been IV–V. To verify the calculated results, the intensity distributions of several recent earthquakes with magnitudes ≥7.0 in North China, including the 1976 Tangshan M7.8 earthquake, the 1966 Xingtai M7.2 earthquake, the 1975 Haicheng M7.1 earthquake, and the 1937 Heze M7 earthquake, were compared with that of the Anqiu earthquake (Table 2). The results show that the intensity distribution of the Anqiu earthquake was far higher than that of the Heze M7 earthquake and close to that of the Tangshan M7.8 earthquake. Thus, we propose that the magnitude of the 70 BC Anqiu earthquake has been underestimated and was above M7.5. As the seismogenic structure of the Anqiu earthquake remains in dispute (Li, 2014; Wang et al., 2015), we have only presented one possible deduction based on empirical formulas for the magnitude, Dco and SRL, and more data are needed to verify this inference.
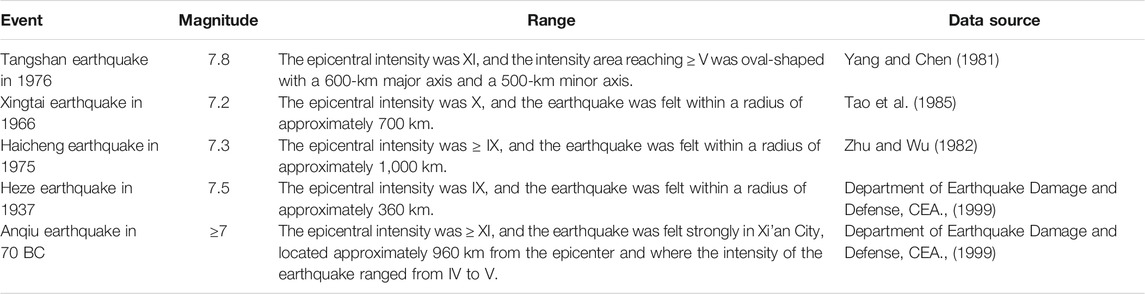
TABLE 2. A comparison of historical earthquakes.
Fault Segmentation of the Anqiu–Juxian Fault
Based on previous research (Lin and Gao, 1987; Huang, 1993; Wang, 1996; Chao et al., 1997; Jiang et al., 2017), the SAJF has a recurrence interval of 3,000–4,000 a and a characteristic displacement of ∼ 9 m, suggesting that the SAJF follows the characteristic earthquake model. The results of this study show that the NAJF likewise has a Dco of ∼ 5 m. Although the recurrence interval remains unclear because of insufficient research, the latest earthquake on the NAJF may have occurred in 70 BC with a magnitude >7.5. Obviously, there are large characteristic differences between these two AJF segments. Moreover, both the fault structure and numerical simulation results indicate that the Juxian Basin between the NAJF and the SAJF is the permanent termination point for rupture propagation. The stepover between the NAJF and SAJF is approximately 8 km wide, which exceeds the general width (5 km) that allows rupture propagation (Wesnousky, 2006, Wesnousky, 2008; Wesnousky and Biasi, 2016), and the surface rupture of the Tancheng M8.5 earthquake in 1,668 also did not break through this stepover (Jiang et al., 2017). The simulation results of GPS data (Li et al., 2020) show a low probability of simultaneous rupture of both faults because the NAJF and the SAJF have different fault slip deficit rates and are in different locking states. This result indicates that the Anqiu–Juxian fault can be reliably divided into two permanent segments for earthquake rupture: the NAJF and the SAJF.
Conclusion
A microlandform offset analysis was used to statistically analyze the gully offsets on the NAJF. The results show that the minimum dextral horizontal displacements of gullies are mostly 5 m and that large offsets are multiples of 5 m, suggesting that the dextral strike-slip offsets of approximately 5 m correspond to the characteristic displacement of the NAJF and the NAJF has undergone multiple seismic events of comparable scales. The results from a combination of geophysical exploration and borehole drilling show two stepovers with ∼ 1 km widths in the buried parts of the NAJF and probably unlimited rupture propagation in the magnitude >7 earthquake. The relation between the Dco and SRL of the strike-slip faults was used to infer that the entire NAJF was simultaneous ruptured during the latest earthquake. Moreover, according to the intensity distribution patterns of historical earthquakes with magnitudes >7 in North China and the relation between the magnitude and Dco, the magnitude of the 70 BC Anqiu earthquake was probably above 7.5. Therefore, considering that the NAJF and SAJF have different earthquake characteristics, it is reliable to divide the AJF into these two permanent segments for earthquake rupture.
Data Availability Statement
The original contributions presented in the study are included in the article/Supplementary Material, further inquiries can be directed to the corresponding author.
Author Contributions
Methodology: HJ, AL, SZ, JZ, and QL; field investigation: HJ, AL, SZ, and QL; analyse: HJ, AL, and SZ; writing—original draft preparation: HJ and AL; funding acquisition: SZ and AL.
Funding
This study was financially supported by the National Key Research and Development Program of China under Grant 2018YFC1504201, the National Institute of Natural Hazards, MEMC (ZDJ2019-16), and the National Natural Science Foundation of China (41402185).
Conflict of Interest
JZ was employed by the company The Third Railway Survey and Design Institute Group Corporation.
The remaining authors declare that the research was conducted in the absence of any commercial or financial relationships that could be construed as a potential conflict of interest.
Publisher’s Note
All claims expressed in this article are solely those of the authors and do not necessarily represent those of their affiliated organizations, or those of the publisher, the editors and the reviewers. Any product that may be evaluated in this article, orclaim that may be made by its manufacturer, is not guaranteed or endorsed by the publisher.
Acknowledgments
We are very grateful to the predecessors for the large body of work on structural characteristics and deformation and the Beta Analytic test laboratory for assistance with 14C data. We also thank our editor, professor Mario Aurelio and two reviewers for their fruitful comments.
Supplementary Material
The Supplementary Material for this article can be found online at: https://www.frontiersin.org/articles/10.3389/feart.2022.766222/full#supplementary-material
References
Beauprêtre, S., Garambois, S., Manighetti, I., Malavieillie, J., Sénéchal, G., et al. (2012). Finding the Buried Record of Past Earthquakes with GPR – Based Palaeoseismology: a Case Study on the Hope Fault, New Zealand. Geophys. J. Int. 189, 73–100. doi:10.1111/j.1365-246X.2012.05366.x
Bonilla, M. G., Mark, R. K., and Lienkaemper, J. J. (1984). Statistical Relations Among Earthquake Magnitude, Surface Length and Surface Fault Displacements. Bull. Seismological Soc. America 74 (6), 2379–2411. doi:10.1785/BSSA0740062379
Chao, H. T., Li, J. L., Cui, Z. W., and Zhao, Q. Y. (1997). Discussion on Several Problems Related to the Seismic Fault of the 1668 Tancheng Earthquake (M = 8.5). North China Earthquake Sci. 15 (4), 18–25. (in Chinese with English abstract).
Chao, H. T., Li, J. L., Cui, Z. W., and Zhao, Q. Y. (1994). Characteristic Slip Behavior of the Holocene Fault in the central Section of the Tanlu Fault Zone and the Characteristic Earthquakes. Inland Earthquake 8 (4), 297–304. (in Chinese with English abstract). doi:10.16256/j.issn.1001-8956.1994.04.002
Deng, Q. D., Yu, G. H., and Ye, W. H. (1992). “Study on the Relations between Parameters of Surface Rupture and Magnitude,”. Research on Active Fault( 2) in Institute of Geology (Beijing: Seismological Press), 247–264. (in Chinese with English abstract).
Department of Earthquake Damage and Defense, CEA (1999). Catalogue of Historical Strong Earthquakes in China(in Chinese). Beijing: Seismological Press.
Ding, G. Y. (1993). Earthquake Prediction and Active Fault Segmentation. J. Seimology 1993 (1), 8–10. (in Chinese with English abstract).
Ding, G. Y. (1992). Some Diseussions on Fault Segmentation. Earthquake Res. China 8 (2), 3–12. (in Chinese with English abstract).
Ding, G. Y. (1995). The Segmentation Model of Active Fault. Earth Sci. Front. 1995 (02), 195–202. (in Chinese with English abstract).
Elliott, J. R., Nissen, E. K., England, P. C., Jackson, J. A., Lamb, S., Li, Z., et al. (2012). Slip in the 2010-2011 Canterbury Earthquakes, New Zealand. J. Geophys. Res. 117, B03401. doi:10.1029/2011JB008868
Guo, C. H., Li, A., Liu, R., and Zhang, S. M. (2018). A Preliminary Research on the Right-Lateral Strike-Slip Characteristics and the Structural Significance of the Northern Kuantanshan Faults, Hexi Corrider, Based on High-Resolution Imagery. Seismology Geology. 40 (4), 784–800. (in Chinese with English abstract).
Haddon, E. K., Amos, C. B., Zielke, O., Jayko, A. S., and Bürgmann, R. (2016). Surface Slip during Large Owens Valley Earthquakes. Geochem. Geophys. Geosyst. 17 (6), 2239–2269. doi:10.1002/2015GC006033
Haeussler, P. J. (2004). Surface Rupture and Slip Distribution of the Denali and Totschunda Faults in the 3 November 2002 M 7.9 Earthquake, Alaska. Bull. Seismological Soc. America 94 (6B), S23. doi:10.1785/0120040626
He, H. L., Song, F. M., Li, C. Y., and Yang, X. P. (2005). Hujiamengyan Surface Rupture in Juxian County, Shandong Province: A New Discovery on the Tanlu Fault Zone. Seismology Geology. 26 (4), 630–637. (in Chinese with English abstract). doi:10.3969/j.issn.0253-4967.2004.04.009
Huang, W. (1993). Morphologic Patterns of Stream Channels on the Active Yishi Fault, Southern Shandong Province, Eastern China: Implications for Repeated Great Earthquakes in the Holocene. Tectonophysics 219 (4), 283–304. doi:10.1016/0040-1951(93)90179-N
Huang, W. S. (1988). A Study on the Neotectonic Activity Characteristics of the Yishu Fault Zone from Geological and Geomorphic Markers. Earthquake Res. China 4 (3), 143–150. (in Chinese).
Jiang, W., Zhang, J., Han, Z., Tian, T., Jiao, Q., Wang, X., et al. (2017). Characteristic Slip of Strong Earthquakes along the Yishu Fault Zone in East China Evidenced by Offset Landforms. Tectonics 36, 1947–1965. doi:10.1002/2016TC004363
Klinger, Y., Etchebes, M., Tapponnier, P., and Narteau, C. (2011). Characteristic Slip for Five Great Earthquakes along the Fuyun Fault in China. Nat. Geosci 4 (6), 389–392. doi:10.1038/ngeo1158
Korjenkov, A. M., Rust, D., Tibaldi, A., and Abdieva, S. V. (2012). “Parameters of the strong Paleoearthquakes along the Talas-Fergana Fault, the Kyrgyz Tien Shan,” in Earthquake Research and Analysis - Seismology, Seismotectonic and Earthquake Geology. London, United Kingdom: IntechOpen. doi:10.5772/27352
Li, J. J., and Zhang, J. L. (2015). Application of GPR in Surveying Underlied Active Faults. Earthquake 35 (4), 83–89. (in Chinese with English abstract). doi:10.3969/j.issn.1000-3274.2015.04.009
Li, K.China Earthquake Administration (2014). Research on the Segmentation of Earthquake Rupture (South of Zhangjiakou-Bohai Tectonic belt) along the Tan-Lu Fault Zone. Beijing: Institute of Geology. (in Chinese with English abstract).
Li, L. Y., Li, Y. J., Zhang, F. S., Chen, C. Y., Yin, H. Q., and Jia, Y. (2020). Fault Blocking Characteristics and Seismic hazard Analysis in the Middle and Southern Segments of the Tanlu Fault Zone. Acta Geol. Sinica 94 (2), 467–479. (in Chinese with English abstract). doi:10.19762/j.cnki.dizhixuebao.2020026
Liberty, L. M., Hemphill-haley, M. A., and Madin, I. P. (2003). The Portland Hills Fault: Uncovering a Hidden Fault in Portland, Oregon Using High-Resolution Geophysical Methods. Tectonophysics 368 (1-4), 89–103. doi:10.1016/S0040-1951(03)00152-5
Lin, A., Miyata, T., and Wan, T. (1998). Tectonic Characteristics of the central Segment of the Tancheng–Lujiang Fault Zone, Shandong Peninsula, Eastern China. Tectonophysics 293 (1–2), 85–104. doi:10.1016/S0040-1951(98)00087-0
Lin, W. F., and Gao, W. M. (1987). The Occurrence Intervals of Large Earthquake in the Yishu Fault Zone. Earthquake Res. China 3 (3), 34–40. (in Chinese with English abstract). doi:10.1193/1.1585430
Liu, J. (1994). The Evaluation of the Risk of Medium and Long Term Strong Earthquakes in Fen-Wei Seismic Zone by Active Fault Data. Beijing: Institute of Administration. (in Chinese with English abstract).
Liu-Zeng, J., Zhang, Z., Wen, L., Tapponier, P., Sun, J., Xing, X., et al. (2009). Co-seismic Ruptures of the 12 May 2008, Ms 8.0 Wenchuan Earthquake, Sichuan: East-West Crustal Shortening on Oblique, Parallel Thrusts along the Eastern Edge of Tibet. Earth Planet. Sci. Lett. 286 (3–4), 355–370. doi:10.1016/j.epsl.-2009.07.01710.1016/j.epsl.2009.07.017
Manighetti, I., Perrin, C., Dominguez, S., Garambois, S., Gaudemer, Y., Malavieille, J., et al. (2015). Recovering Paleoearthquake Slip Record in a Highly Dynamic Alluvial and Tectonic Region (Hope Fault, New Zealand) from Airborne Lidar. J. Geophys. Res. Solid Earth 120 (6), 4484–4509. doi:10.1002/2014JB011787
McClymont, A. F., Villamor, P., and Green, A. G. (2009). Fault Displacement Accumulation and Slip Rate Variability within the Taupo Rift (New Zealand) Based on Trench and 3-D Ground Penetrating Radar Data. Tectonics 28. doi:10.1029/2008TC002334
Priyanks, R. S., Pandey, A., Mishra, R. L., Singh, I., Bhushan, R., Srivatsava, P., et al. (2017). Primary Surface Rupture of the 1950 Tibet-Assam Great Earthquake along the Eastern Himalayan Front, India. Scientific Rep. 7 (5433), 1–12. doi:10.1038/s41598-017-05644-y
Ran, H. L. (2011). Empirical Relations between Earthquake Magnitude and Parameters of Strike-Slip Seismogenic Active Faults Associated with Historical Earthquakes in Western China. Seismology Geology. 33 (3), 577–585. (in Chinese with English abstract). doi:10.3969/j.issn.0253-4967.2011.03.008
Ran, Y. K. (1990). “Paleo earthquake and its Recurrence Interval,” in Active Faults in North- Western Yunnan (Beijing, China: Institute of Geology, China Earthquake Administration, Yunnan Earthquake Agency), 259–289. (in Chinese with English abstract).
Ren, Z., Zhang, Z., and Chen, T. (2015). Clustering of Offsets on the Haiyuan Fault and Their Relationship to Paleoearthquakes. Geol. Soc. America Bull. 128 (1), 3–18. doi:10.1130/B31155.1
Roberts, G. P., Raithatha, B., Sileo, G., Pizzi, A., Pucci, S., Walker, J. F., et al. (2010). Shallow Subsurface Structure of the 2009 April 6 Mw 6.3 L'Aquila Earthquake Surface Rupture at Paganica, Investigated with Ground-Penetrating Radar. Geophys. J. Int. 183, 774–790. doi:10.1111/j.1365-246X.2010.04713.x
Rockwell, T. K., and Klinger, Y. (2013). Surface Rupture and Slip Distribution of the 1940 Imperial valley Earthquake, Imperial Fault, Southern California: Implications for Rupture Segmentation and Dynamics. Bull. Seismological Soc. America 103 (2A), 629–640. doi:10.1785/01-2012019210.1785/0120120192
Schwartz, D. P., and Coppersmith, K. J. (1984). Fault Behavior and Characteristic Earthquakes: Examples from the Wasatch and San Andreas Fault Zones. J. Geophys. Research-Solid Earth 89 (B7), 5681–5698. doi:10.1029/JB089iB07p05681
Song, F. M., Yang, X. P., He, H. L., Li, C. Y., and Zhang, L. F. (2005). Quantitative Analysis of Recent Activity of the Xiaodianzi-Maobu Segment of the Anqiu-Juxian Fault, Shandong Province. Seismology Geology. 27 (2), 200–211. (in Chinese with English abstract). doi:10.3969/j.issn.0253-4967.2005.02.003
Tao, R. Q., Lin, L. Z., and Wang, J. Y. (1985). Abridged Versions of Chapters in the Book “ Earthquake Countermeasures ” (Part VIII) — Sections One, Two and Three of the Third Chapter “ Examples of Countermeasures against Great Earthquakes and Significant Earthquakes in China ” Section One: The Xingtai Earthquakes. Recent Dev. World Seismology 1985 (09), 4–7. ( in Chinese with English abstract).
The China National Standardization Management Committee & General Administration of Quality Supervision, Inspection and Quarantine of the People's Republic of China (2008). The Chinese Seismic Intensity Scale. (in Chinese).
Tibaldi, A., Corazzato, C., Rust, D., Bonali, F. L., Pasquarè Mariotto, F. A., Korzhenkov, A. M., et al. (2015). Tectonic and Gravity-Induced Deformation along the Active Talas - Fergana Fault, Tien Shan, Kyrgyzstan. Tectonophysics 657, 38–62. doi:10.1016/j.tecto.2015.06.020
Wang, H. L. (1996). Holocene Slip Rate, Paleoearthquakes, and Recurrence Interval of strong Earthquakes on the Fault where 1668 Earthquake M = 8.5 Earthquake Occurred, Shandong Province. J. Seismology Res. 19 (2), 206–224. (in Chinese with English abstract).
Wang, H. L., Jia, Z. L., and Su, M. G. (1988). Present Dynamic Monitor and Analysis of the Active Fault in Lunan Areas. Earthquake Res. China 4, 137–142. (in Chinese with English abstract). doi:10.1016/0011-9164(88)85049-5
Wang, T., Wei, S. J., Shi, X. H., Qiu, Q., Li, L. L., Peng, D. J., et al. (2018). The 2016 Kaikōura Earthquake: Simultaneous Rupture of the Subduction Interface and Overlying Faults. Earth Planet. Sci. Lett. 482, 44–51. doi:10.1016/j.epsl.2017.10.056
Wang, W., and Wang, Q. (2008). Present-day Crustal Deformation in China Continent Revealed by GPS Measurements. J. Geodesy Geodynamics 28 (4), 75–82. (in Chinese with English abstract).
Wang, Z. C., Wang, D. L., Xu, H. T., Ge, F.-G., Yang, C.-C., and Li, J.-H. (2015). Geometric Features and Latest Activities of the North Segment of the Anqiu-Juxian Fault. Seismology Geology. 37 (1), 176–191. (in Chinese with English abstract). doi:10.3969/j.issn.0253-4967.2015.01.014
Wells, D. L., and Coppersmith, K. J. (1994). New Empirical Relationships Among Magnitude, Rupture Length,Rupture Width, Rupture Area, and Surface Displacement. Bull. Seismological Soc. America 84 (4), 974–1002. doi:10.1007/BF00808290
Wesnousky, S. G., and Biasi, G. P. (2016). Steps and Gaps in Ground Ruptures: Empirical Bounds on Rupture Propagation. Bull. Seismological Soc. America 106 (3), 1110–1124. doi:10.1785/0120150175
Wesnousky, S. G. (2008). Displacement and Geometrical Characteristics of Earthquake Surface Ruptures: Issues and Implications for Seismic-Hazard Analysis and the Process of Earthquake Rupture. Bull. Seismological Soc. America 98 (4), 1609–1632. doi:10.1785/0120070111
Wesnousky, S. G. (2006). Predicting the Endpoints of Earthquake Ruptures. Nature 444, 358–360. doi:10.1038/nature05275
Xu, J. W., and Ma, G. F. (1992). Review of Ten Years (1981-1991) of Research on the Tan-Lu Fault Zone. Geol. Rev. 1992 (04), 316–324. (in Chinese with English abstract).
Yang, L. H., and Chen, G. L. (1981). Intensity Distribution of the Tangshan Earthquake. Earthquake Eng. Eng. Vibration 1 (1), 1–8. (in Chinese with English abstract).
Ye, W. H., Xu, X. W., and Wang, L. M. (1996). Quantitative Relationship between Surface Rupture Parameter, Earthquake Magnitude and Recurrence Interval for Surface- Rupturing-Earthquakes in West China. Seimology Geology. 18 (1), 37–44. (in Chinese with English abstract).
Yin, A., and Nie, S. Y. (1993). An Indentation Model for the north and south China Collision and the Development of the Tan-Lu and Honam Fault Systems, Eastern Asia. Tectonics 12 (4), 801–813. doi:10.1029/93TC00313
Zhang, B. X., and Tang, Y. A. (1988). Features of the Crust Structure of the Yishu Fault Zone. Earthquake Res. China 4 (3), 16–22. (in Chinese with English abstract).
Zhang, D., Wu, Z. H., Li, J. C., Liu, S. T., and Wang, G. (2019). The Application of Multi-Frequency GPR Antenna for Imaging the Shallow Subsurface Features in the Yushu Active Fault. Joumal of Geomechanics 25 (6), 1138–1149. (in Chinese with English abstract). doi:10.12090/j.issn.1006-6616.2019.25.06.097
Zhang, J. H., Zhao, G. Z., Xiao, Q. B., Dong, Z. Y., Wang, L. F., Han, B., et al. (2010). Analysis of Electric Structure of the central Tan-Lu Fault Zone( the Yishu Fault Zone) and Seismogenic Condition. Chin. J Geophys 53 (3), 605–611. (in Chinese with English abstract).
Zheng, L. S., Gao, W. M., and Zheng, C. B. (1988). The Segmentation of Tanlu Fault and the Activity of Yishu Fault. Earthquake Res. China 4 (3), 129–135. (in Chinese with English abstract).
Zhu, F. M., Wu, G., et al. (1982). Haicheng Earthquake in 1975. Beijing: Seismological Press. (in Chinese).
Zhu, G., Niu, M. L., Xie, C. L., and Wang, Y. (2010). Sinistral to normal Faulting along the Tan-Lu Fault Zone: Evidence for Geodynamic Switching of the east China continental Margin. J. Geology. 118 (3), 277–293. doi:10.1086/651540
Zhu, G., Jiang, D. Z., Zhang, B. L., and Chen, Y. (2011). Destruction of the Eastern North China Craton in a Backarc Setting: Evidence from Crustal Deformation Kinematics. Gondwana Res. 22 (1), 86–103. doi:10.1016/j.gr.2011.08.005
Zhu, S. J., and Sun, S. C. (1991). Reviews on Researches of the 1668 Juxian-Tancheng Great Earthquake. J. Seismology 1991 (4), 19–24. (in Chinese).
Zielke, O., Arrowsmith, J. R., Grant, L. L., and Akçiz, S. O. (2010). Slip in the 1857 and Earlier Large Earthquakes along the Carrizo Plain, San Andreas Fault. Science 327, 1119–1122. doi:10.1126/science.1182781
Zielke, O., and Arrowsmith, J. R. (2012). LaDiCaoz and LiDAR Imager—MATLAB GUIs for LiDAR Data Handling and Lateral Displacement Measurement. Geosphere 8 (1), 206. doi:10.1130/GES00686.1
Keywords: the tanlu fault zone, the anqiu-juxian fault, the characteristic displacement, geometric distribution, the anqiu M 7 earthquake in 70 BC
Citation: Ji H, Li A, Zhang S, Zhang J and Liu Q (2022) Geometric Distribution and Earthquake Rupture Characteristics of the Northern Anqiu–Juxian Fault in the Tan–Lu Fault Zone, Eastern China. Front. Earth Sci. 10:766222. doi: 10.3389/feart.2022.766222
Received: 28 August 2021; Accepted: 26 January 2022;
Published: 17 February 2022.
Edited by:
Mario Aurelio, University of the Philippines Diliman, PhilippinesReviewed by:
R. Jayangonda Perumal, Wadia Institute of Himalayan Geology, IndiaFabio Luca Bonali, University of Milano-Bicocca, Italy
Copyright © 2022 Ji, Li, Zhang, Zhang and Liu. This is an open-access article distributed under the terms of the Creative Commons Attribution License (CC BY). The use, distribution or reproduction in other forums is permitted, provided the original author(s) and the copyright owner(s) are credited and that the original publication in this journal is cited, in accordance with accepted academic practice. No use, distribution or reproduction is permitted which does not comply with these terms.
*Correspondence: An Li, bGlhbkBpZXMuYWMuY24=