 Hui Shang
 Hui-Zhu Zhan
 Wan-Kui Ni2
 Yang Liu
- 1College of Geology and Environment, Xi’an University of Science and Technology, Xi’an, China
- 2College of Geology Engineering and Geomatics, Chang’an University, Xi’an, China
The exploitation of mineral resources is crucial for cost-effective construction but has also led to severe damage to the ecological environment in mining areas. Therefore, it is particularly important to effectively monitor surface environmental problems in the mining subsidence area caused by the exploitation of mineral resources. Herein, the Huinong coal mining subsidence area, Shizuishan city, Ningxia, China, was taken as the study area. The remote sensing image features of various environmental elements were investigated through field investigations, the measured spectra, and image spectrum contrast analysis. On this basis, an object-oriented random forest classification method was used to classify images from different time phases and sources in coal mining subsidence areas. Next, the man–machine interactive interpretation was confirmed by referring to the pre-classification results. By overlaying the interpretation result map and analyzing the land-use class changes, the spatial–temporal evolution monitoring of the surface environment in the coal mining subsidence area from 1979 to 2018 was carried out. The results show that the surface environment in the coal mining subsidence area has undergone significant changes over the past 40 years, among which—from 1979 to 2003—the environment of the coal mining area was severely damaged by the intensive mining activities. The area of cultivated land and vegetation coverage decreased sharply, while the area of other land-use classes, such as coal heaps, water bodies, and coal gangue, exhibited a trend of rapid growth. From 2003 to 2018, after more than 10 years of mine geological environment renovation and management, the surface environment of the coal mining subsidence area greatly improved, among which the vegetation coverage has shown the fastest growth rate, while the area of coal gangue, badlands, and other land-use classes have significantly reduced. The hidden dangers of geological disasters have been drastically mitigated. In addition, the residential area continued to decrease in the early stages and then rebounded to a certain extent, indicating that urbanization was carried out at the same time as the ecological environment began to improve. The surface environment before and after the renovation is consistent with the results from remote sensing monitoring.
1 Introduction
Coal resources are important for energy needs of human civilization. With recent developments in industrial and agricultural production, the significant increase in the world population, and improvements in living standards, society’s demand for coal resources is increasing (Xinhua et al., 2011; Xiao et al., 2018). However, as large quantities of coal resources are extracted from the ground, geological hazards caused by surface subsidence are becoming increasingly apparent (Marschalko et al., 2012; Darmody et al., 2014; Morrison et al., 2018). According to recent studies, the phenomena caused by coal mining subsidence—including facility damage, road damage, landslides, ground fissures, ground collapses, farming difficulties, and damage to buildings—seriously threaten the safety of personnel, travel, and infrastructure (Chugh, 2018; He et al., 2020). Furthermore, owing to the impact of underground mining, the surface water system is damaged, and the surface water quality reduces, dries up, or is cut off, which affects the ecological safety of the region. The renovation of coal mining subsidence areas directly affects the economic and social stability of mining areas, along with their sustainable development. The comprehensive renovation of coal mining subsidence areas involves relocation of residents, repair of infrastructure and public service facilities, management of the mining environment, geological disaster prevention and control, land reclamation and reuse, and ecological environmental protection.
In the management of the surface environment of coal mining subsidence areas, the primary task is to analyze the spatial and temporal evolution law of the surface environment. Remote sensing (RS) techniques and geographic information systems (GISs) provide an effective approach to monitoring the surface environmental changes in mining areas. In comparison with traditional field and laboratory monitoring, they have the advantages of low time consumption, low costs, and a wide range of monitoring capabilities, especially in larger areas (Crósta et al., 2003; Sato et al., 2007; Mi et al., 2019; Wu et al., 2020). Previous studies have applied RS and GIS techniques to monitor moderate-scale categories, mining footprints, the extent of changes caused by mining, environmental pollution, coal fires, mining geological hazards, land-use classes, and slope stability. For example, DeWitt et al. (2017) produced the moderate-scale categories of land use in the Tortiya mining area within 46 years via a supervised classification method (DeWitt et al., 2017). Soulard et al. (2016) developed a semiautomated procedure to detect the mining footprint and mine extent change (Soulard et al., 2016). Lobo et al. (2017) mapped the mining areas in the Brazilian Amazon on Sentinel-2 images (Lobo et al., 2018). Saedpanah et al. (2019) integrated the RS, GIS, and analytical hierarchy process (AHP) methods to assess environmental pollution and geo-ecological (EPGE) risk in the Qhorveh mining area (Saedpanah and Amanollahi, 2019). By using radiant temperature images, such as Landsat-7 Enhanced Thematic Mapper Plus (ETM+) band 6, ASTER band 13, and Landsat-8 band ten thermal data, Mishra et al. (2011) and Roy et al. (2015) detected the surface coal fires (Mishra et al., 2011; Roy et al., 2015). Carlà et al. (2018) assessed the slope failure size and temporal evolution in a copper open-pit mine (Carlà et al., 2018). Wang et al. (2018) proposed a semiautomatically geological mining hazard extraction method to identify and predict geological hazards in the Shijiaying coal mine in Beijing (Wang et al., 2013). Beyond the widespread use in general landscape dynamics monitoring, some researchers have also used RS and GIS techniques to assess ecosystem health and monitor the sustainability of afforestation in semiarid and arid regions. For example, Jafary et al. (2018) and Nadia Abbaszadeh Tehrani et al. (2021) used remote sensing data to monitor or assess the ecosystem health level successfully (Jafary et al., 2018; Abbaszadeh Tehrani et al., 2021). Feghhi, J et al. (2017) investigated the effects of homogeneous units of natural and human factors on the sustainability of the ecosystem by using the GIS technology (Feghhi et al., 2017). However, research on the impact of mining on the surface environment and associated causes is still limited. In addition, the ground objects in mining areas are characterized by high complexity and rapid change, and different ground objects have similar spectral characteristics, leading to difficulties in data acquisition and image classification in mining areas (Cloutis, 1996; Demirel et al., 2011; He et al., 2019). Although some researchers have studied different classification methods to improve classification accuracy (Janalipour and Mohammadzadeh, 2017; Khanbani et al., 2020) and the use of interferometric synthetic aperture radar (InSAR), light amplification by stimulated emission of radiation (LASER), and light detection and ranging (LiDAR) to monitor small-scale mines in recent years (Prakash and Gupta, 1998; Perski et al., 2009; Isidro et al., 2017; Carlà et al., 2018; Chen et al., 2018), there are few studies on the spatial and temporal evolution of the surface environment in large-scale coal mining subsidence areas.
This research aimed to monitor the surface environmental temporal and spatial evolution in a coal mining subsidence area with more than 60 years of mining history through the use of the object-oriented random forest classification method to assist man-machine interactive interpretation. We adopted field surveys, along with measured spectrum and image spectrum contrast analyses, to establish interpretation signs. The specific objectives were 1) to establish interpretation signs in terms of surface environmental elements in coal mining subsidence areas via field surveys and measured/image spectra contrast analysis; 2) to monitor the surface environmental temporal and spatial evolution in the Huinong coal mining subsidence area from 1979 to 2018; and 3) to analyze the causes of surface environmental changes in coal mining subsidence areas.
2 Study Area
The Huinong coal mining subsidence area is located in Shizuishan city, Ningxia Hui Autonomous Region, and comprises 4,000 ha of land between latitudes 39°13′50″ and 39°15′44″ and longitudes 106°45′39″ and 106°47′21″E. It was formed because of underground coal mining in the Shizuishan mining area, including the No. 1 and No. 2 mines (Figure 1). Its strata include the Great Wall system, Jixian System, Cambrian, Carboniferous, Permian, Triassic, Neogene, and Quaternary. The coal-bearing strata are the Taiyuan Formation of the Upper Carboniferous and the Shanxi Formation of the Lower Permian, with a total thickness of 28.75 m. The coal-bearing rock group consists of soft and hard clastic rocks, and the lithology is thick grayish-white sandstone, black shale, and mudstone interbedded with coal seams of Carboniferous and Permian origin. After more than 60 years of coal mining in this area, the primary environmental problems that have arisen include the occupation and destruction of land resources and landscapes, secondary mining geological hazards, and the pollution caused by solid mining waste. Among them, the most serious geological hazards are ground subsidence and ground fissures (Hui and Wankui, 2013). There are seven large collapse pits in the subsidence area. The maximum subsidence value of the collapse pit is more than 26 m, and the depth is generally 8–10 m. The total area of the collapse pit is 9.1 km2. Furthermore, there are another 22 small ground collapses caused by mining in the area, with an area of about 1.3 km2; more than 140 ground fissures, with a total length of 15,462 m; and an affected area of 0.8 km2. In the subsidence area, the surface is broken, the vegetation is sparse, the sand is scattered, the sewage flows across, and some areas have even become urban garbage patches, with severe environmental pollution. With the further expansion of the city, the coal mining subsidence area is nearing the center of the city. It is in stark contrast with the beautiful Huinong urban area and is significantly detrimental to the productivity and life of local residents. Since 2004, the Huinong coal mining subsidence area has been renovated for nearly 11 years. At present, the environment and quality of life of residents in the mining area have greatly improved.
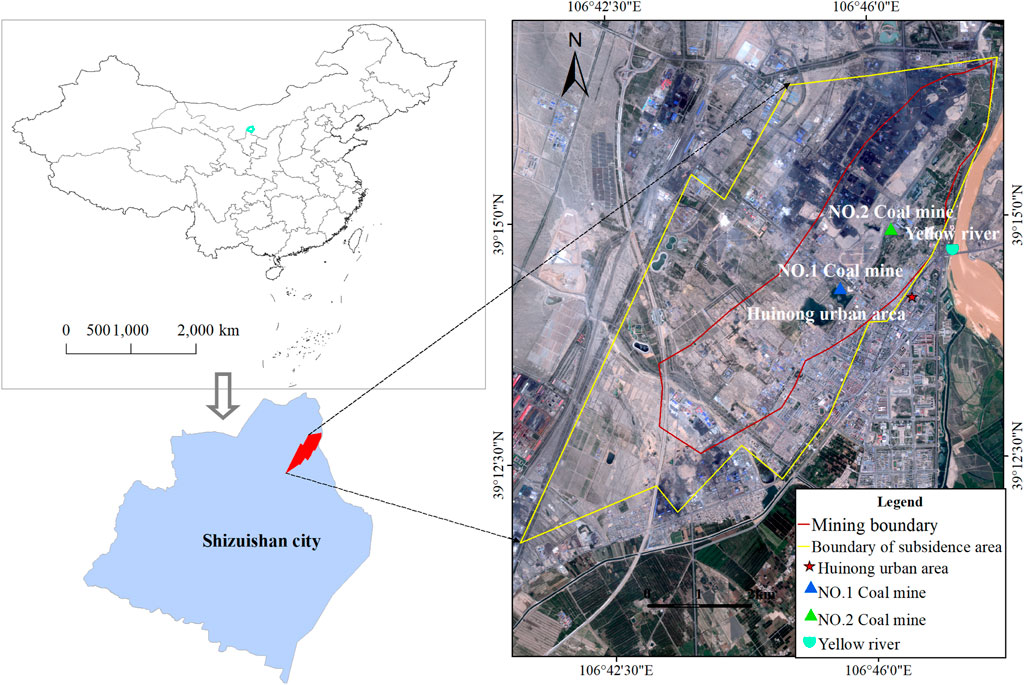
FIGURE 1. Location of the study area.
3 Data and Processing
3.1 Satellite Data
The environmental monitoring of coal mining subsidence areas primarily involves the extraction of information regarding destroyed and occupied land (represented by coal gangue and coal pile areas), along with other ground objects (cultivated land, badlands, vegetation, residential areas, etc.). These objects can be ascertained well only through high-resolution remote sensing images, which must be used to achieve good monitoring results (DeWitt et al., 2017; Carlà et al., 2018; Wu et al., 2020).
This study used aerial images from 1979 (early mining), QuickBird satellite image from 2003 (before renovation of the mine geological environment), WorldView-2 satellite image from 2011 (during mine geological environment renovation), and Gaofen-2 image from 2018 (after mine geological environment renovation) for land-class interpretation. The projection method used for the remote sensing data in four phases is Universal Transverse Mercator (UTM) projection. The spatial resolution of the aerial image is 1 m. The QuickBird satellite includes panchromatic images with 0.61 m of resolution and a multispectral image with 2.44 m resolution. The WorldView-2 satellite includes a panchromatic image with 0.46 m resolution and a multispectral image with 1.8 m of resolution. Finally, the spatial resolutions of the Gaofen-2 panchromatic and multispectral images are 0.80 and 3.24 m, respectively. All of these resolutions meet the requirements for monitoring the evolution of the surface environment in coal mining subsidence areas.
3.2 Image Processing
In comparison to medium- and low-resolution images, high-resolution images contain more complex spatial information within the same area (Liu et al., 2013); therefore, issues regarding the same object with different spectra or the same spectral foreign object on the image are more severe. Thus, in this study, the original multispectral and panchromatic images are preprocessed by geometric correction, resampling, and image fusion with the help of ENVI software before interpretation. Approximately 25 ground control points (GCPs) were uniformly selected from feature points with the same name present on the wrap image and base maps for the geometric correction process, such as the building corner points and road intersections. Finally, the registration error of aerial image is 0.329 pixels, that of QuickBird image is 0.215 pixels, that of WorldView-2 image is 0.273 pixels, and that of GF-2 image is 0.238 pixels, which meets the accuracy requirements for image overlay. For image fusion, an interface description language (IDL) program was written to calculate the index values of the principal component analysis (PCA) algorithm, nearest neighbor diffusion (NNDiffuse) pan sharpening algorithm, Gram–Schmidt algorithm, and Brovey algorithm, in terms of the spatial information integration degree and spectral information fidelity (Ji and Gallo, 2006; Yang and Gong, 2012; Shahdoosti, 2015; Zhao et al., 2017; Yilmaz et al., 2020). The image fusion results show that the Gram–Schmidt fusion algorithm performs the best for QuickBird image data, while the PCA fusion algorithm works best for Worldview-2 and GF-2 image data.
4 Methods
4.1 Establishment of Interpretation Signs
The interpretation signs of remote sensing images are image features that can directly reflect and discriminate the feature information in a remote sensing image, including the shape, size, shading, hue, color, texture, pattern, location, and layout (Zhang et al., 2014). These signs can be used to identify the nature, type, and condition of the objects or phenomena directly through the image, or to make inferences regarding the relationships between identified objects or phenomena. Mining activities in the Shizuishan mining area have severely damaged the surrounding ecology. To understand the influence of mining activities on the evolution of the surface environment in the coal mining subsidence area, we first collected samples of coal gangue, water, vegetation, bare soil, and other objects from the study area and then measured the spectral curves of these samples (Chen et al., 2018). For satellite data, we collected the image spectrum after removing the interference information and compared it with the measured spectrum. For example, the distribution characteristics of badlands and vegetation measured spectra are consistent with the image spectra; the measured and imaged spectra of the badlands show intense reflection peaks between the wavelengths of 650–1,300 μm and 1,500–1800 μm, and the measured and imaged vegetation spectra show intense absorption features at wavelengths of 1400 μm and 1800–1950 μm (Figure 2). Finally, in combination with a field survey, the interpretation signs of eight kinds of ground objects—badlands, coal gangue, coal heaps, cultivated land, other construction, residential areas, vegetation, and water bodies—were established (Figures 3–(6). The image characteristics of different remote sensing data are as follows:
1) Badlands: This class mainly includes bare land and abandoned cultivated land with no vegetation cover. In remote sensing images, it appears as a piece of distribution, irregular shape, rough texture, uneven tone, and light gray or grayish-brown in color, and has clear boundaries with other features (Figure 3A, Figure 4A, Figure 5A, and Figure 6A).
2) Coal gangue: The coal gangue is generally gray in color, similar in shape to a cone, and has different sizes. The edges of the image are round, and the three-dimensional effect is strong. The texture radiates from the center of the circle to the surroundings, making it easy to identify. In addition, coal gangue is generally near coal mines, surrounded by badlands and sparse vegetation. It is easier to identify using aerial or QuickBird image. The WorldView-2 and Gaofen-2 image can be combined with field surveys to interpret that the color of coal gangue is dark gray or brown, and the boundary between it and the surrounding badlands is obvious (Figure 3B, Figure 4B, Figure 5B, and Figure 6B).
3) Coal heap: The color of these heaps is natural black, and the texture is singular, which is generally higher than the ground, and has a good three-dimensional effect. Most heaps are distributed near the mine or scattered in the badlands. The large coal heaps are more regular in shape, round, or square and have special pile sites. Small coal heaps are relatively complex to identify, with irregular boundaries and a dark gray color, which can be distinguished from the surrounding objects by their three-dimensional characteristics (Figure 3C, Figure 4C, Figure 5C, and Figure 6C).
4) Cultivated land: According to the field survey, the cultivated land in the study area mainly comprises dryland crops such as wheat. Generally, cultivated land has a deep and rough texture, and is gray or gray white in aerial image, dark green or grayish-yellow in QuickBird image, and dark green or light yellow in WorldView-2 and GF-2 image. These areas have clear boundaries with surrounding residential areas or badlands (Figure 3D, Figure 4D, Figure 5D, and Figure 6D).
5) Other construction: This class comprises square coal mine industrial buildings and other factory buildings. The square coal mine industrial buildings are neatly arranged and distributed in rows, rectangular in shape, and delicate in texture. The middle of the square is empty, and there are coal gangue or coal heap around it. The other factory buildings are also rectangular in shape, and their sizes are significantly larger than those of the surrounding residential buildings. The roof generally appears blue or red in the images. The border is grayish-white in aerial image, and gray or brown in other images (Figure 3E, Figure 4E, Figure 5E, and Figure 6E).
6) Residential areas: Residential areas mostly appear as squares or clusters in the images, with obvious geometric features and a rough structure. The residential areas in the urban area are arranged neatly and in a concentrated manner, while residential areas in the subsidence area are scattered. Both have clear boundaries with other surroundings and are easy to distinguish (Figure 3F, Figure 4F, Figure 5F, and Figure 6F).
7) Vegetation: The main vegetation types in the study area are trees and grass. Trees are generally grown on both sides of the main road, distributed in strips or blocks, with a three-dimensional effect and clear boundaries. Grass is often distributed in patches with uniform color and finer texture than the area covered by trees. Generally, they are surrounded by badlands or residential areas and appear grayish-black in aerial image and dark green in other source images (Figure 3G, Figure 4G, Figure 5G, and Figure 6G).
8) Water bodies: This class comprises mine wastewater and naturally formed water holes. In remote sensing images, the water bodies have smooth boundaries, fine textures, irregular shapes, uniform colors, and generally appear black or dark green. Mine wastewater is distributed near mines with large areas, and can be clearly distinguished from the surrounding ground objects according to its color. Naturally formed water holes are mainly scattered in badlands, with small areas, and are dark green in color (Figure 3H, Figure 4H, Figure 5H, and Figure 6H).
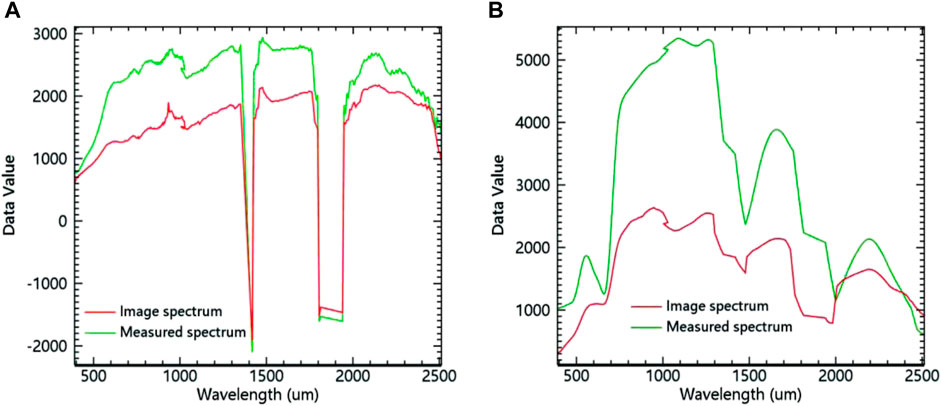
FIGURE 2. Field measured spectra and image spectra of ground objects. (A) Badlands and (B) vegetation.
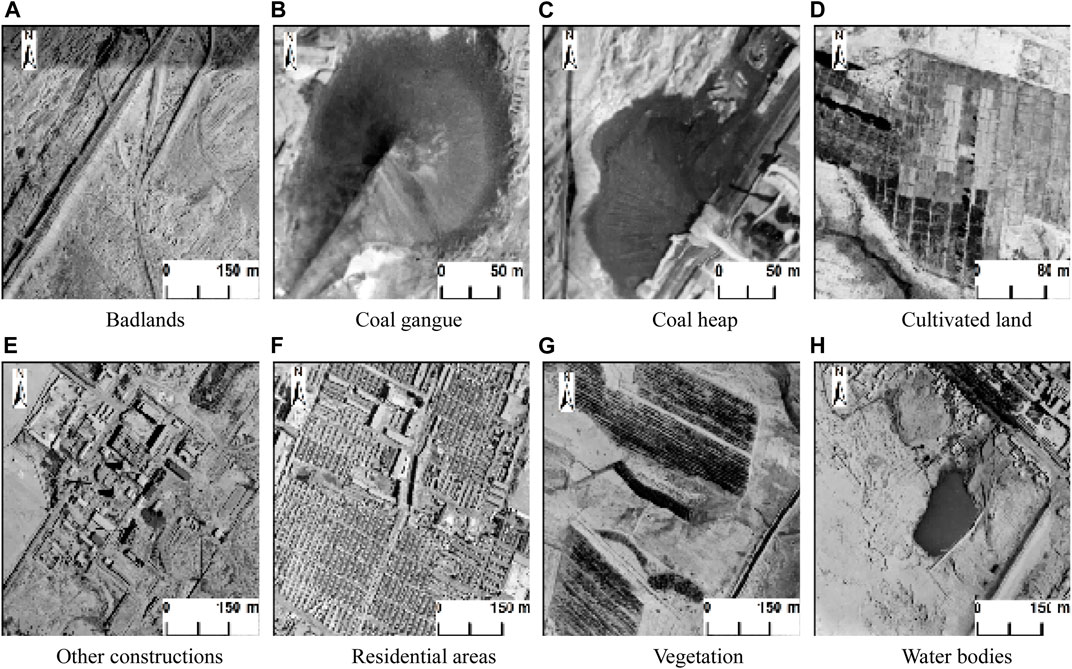
FIGURE 3. Interpretation signs in aerial image. (A) Badlands, (B) coal gangue, (C) coal heap, (D) cultivated land, (E) other construction, (F) residential areas, (G) vegetation, and (H) water bodies.
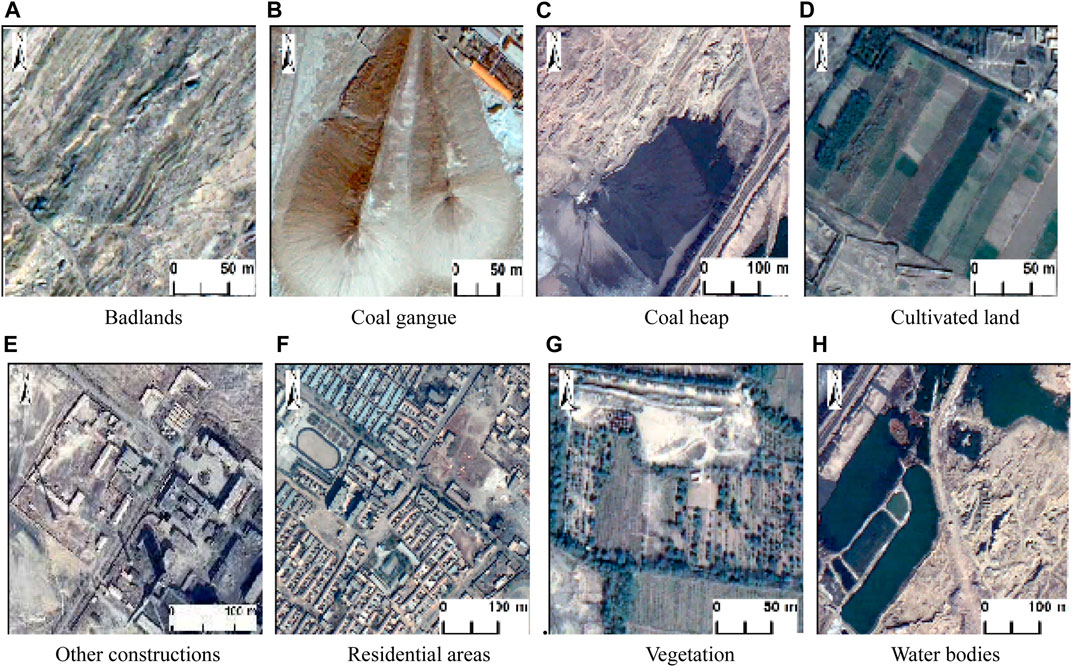
FIGURE 4. Interpretation signs in QuickBird image. (A) Badlands, (B) coal gangue, (C) coal heap, (D) cultivated land, (E) other construction, (F) residential areas, (G) vegetation, and (H) water bodies.
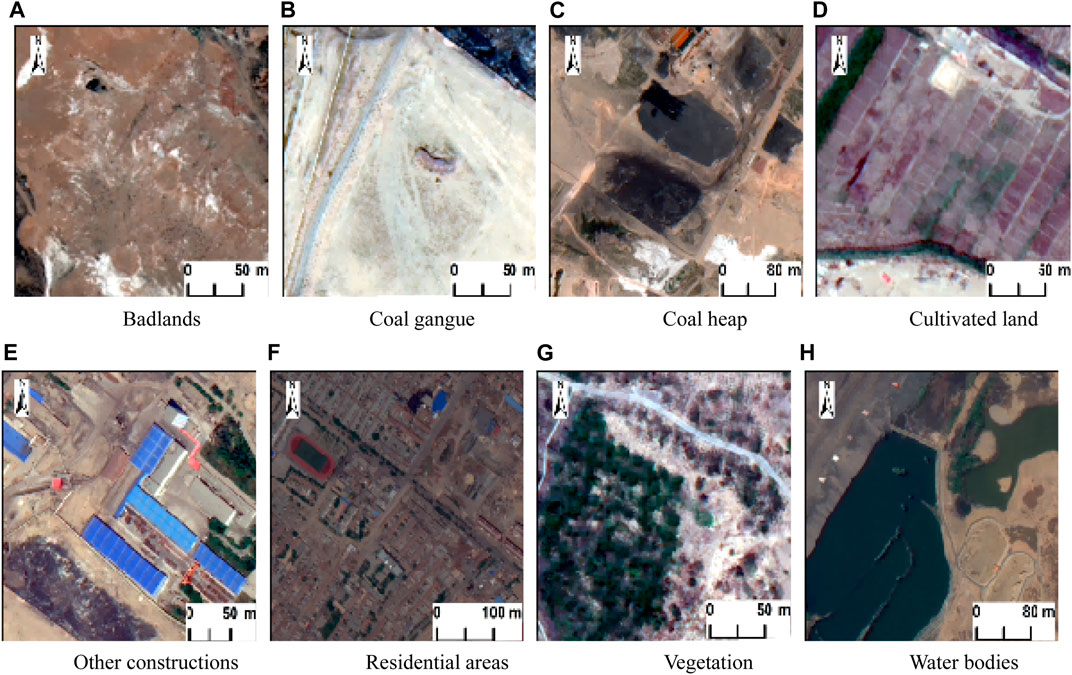
FIGURE 5. Interpretation signs in WorldView-2 image. (A) Badlands, (B) coal gangue, (C) coal heap, (D) cultivated land, (E) other construction, (F) residential areas, (G) vegetation, and (H) water bodies.
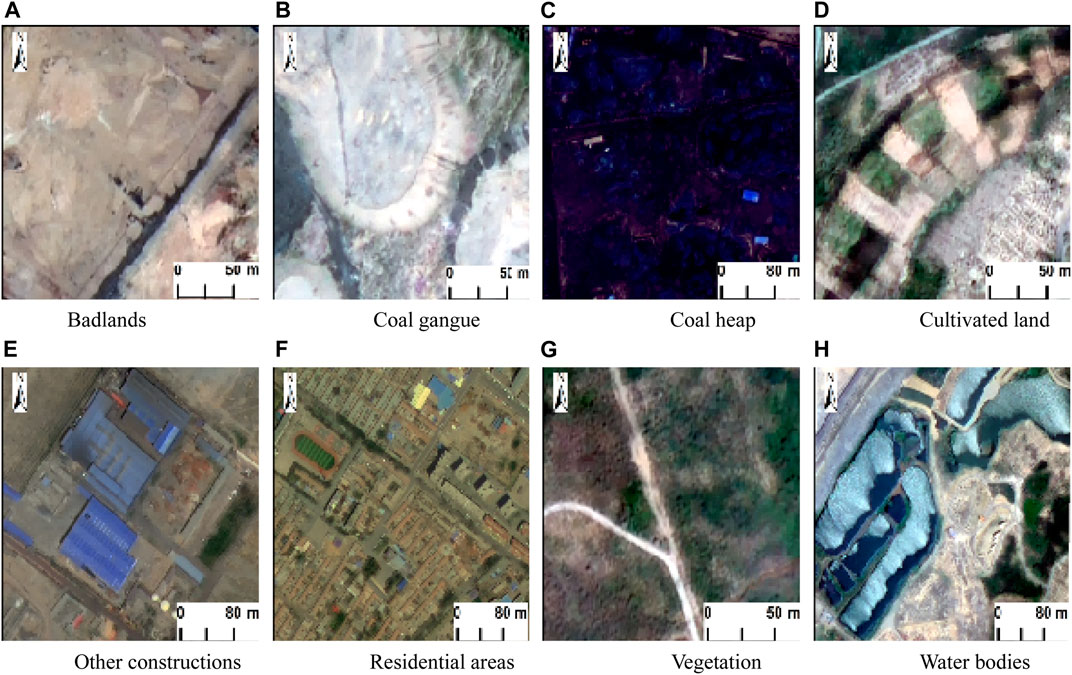
FIGURE 6. Interpretation signs in GF-2 image. (A) Badlands, (B) coal gangue, (C) coal heap, (D) cultivated land, (E) other construction, (F) residential areas, (G) vegetation, and (H) water bodies.
4.2 Remote Sensing Interpretation Method
Owing to the lack of spatial information data on various surface objects in the study area, the interpretation accuracy obtained by simply using an automatic classification method is far lower than that of manual visual interpretation, which cannot meet the research requirements (Kundu et al., 2020; Yuling et al., 2020; Aune-Lundberg and Strand, 2021). Therefore, the object-oriented classification method (Lawrence et al., 2006; Watts et al., 2009; Stumpf and Kerle, 2011; Dornik et al., 2018) was used to assist man-machine interactive interpretation in obtaining the surface environmental information of coal mining subsidence areas to ensure interpretation accuracy. The main processing is described in Sections 4.2.1–4.2.3.
4.2.1 Image Segmentation
Image segmentation can generate different scale layers to distinguish different object types using the multi-scale segmentation method accurately. In this study, multi-scale image segmentation is based on the bottom-up method. Furthermore, the estimation of the scale parameter (ESP) evaluation algorithm (Drǎguţ et al., 2010; Drăguţ and Eisank, 2012; Drăguţ et al., 2014; Louw and van Niekerk, 2019) was used to select the optimal scale for segmenting surface environmental objects in coal mining subsidence areas. Take QuickBird image in 2003 as an example. The local variance of the image (Figure 7) changes the most when the segmentation scale is 190,205,275,350,460,545, which may be the best scale for each object. In combination with visual discrimination, the optimal scale of water bodies, coal gangue, and coal heap is 190. Furthermore, the optimal vegetation and cultivated land segmentation scale is 275, and the optimal segmentation scale of other construction, residential areas, and badlands is 460 (Figure 8). Similarly, the optimal segmentation scale for water bodies, coal gangue, and coal heaps is 150 for aerial images and WorldView-2 images but 160 for GF-2 images. The optimal segmentation scale for vegetation and cultivated land is 250 for aerial images, 270 for WorldView-2 images, and 275 for GF-2 images. The optimal segmentation scale for other construction, residential areas, and badlands is 440 for aerial images, 360 for WorldView-2 images, and 370 for GF-2 images.
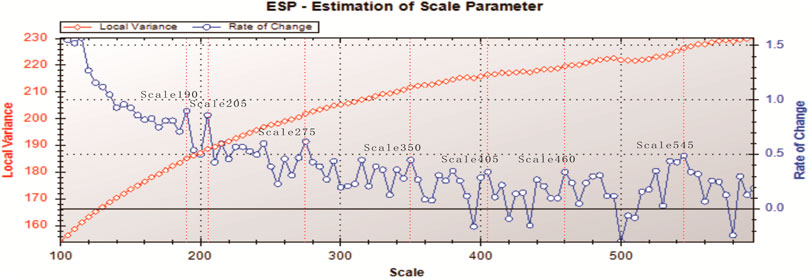
FIGURE 7. Optimal segmentation scale of the QuickBird image obtained by ESP.
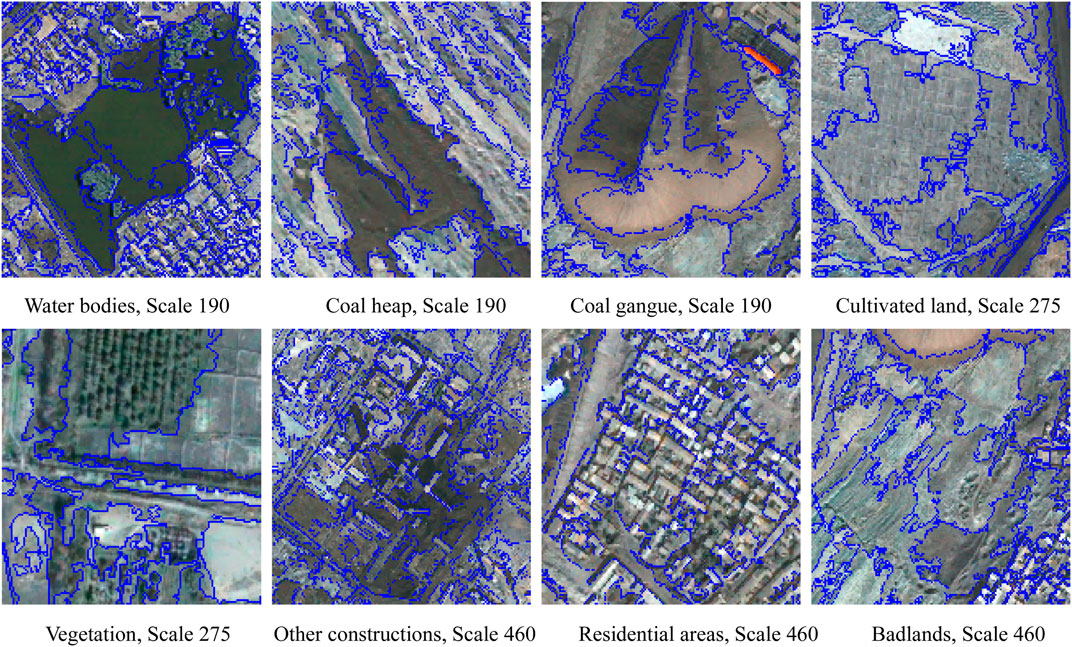
FIGURE 8. Optimal segmentation scale of the objects in QuickBird image. Water bodies scale 190, coal heap scale 190, coal gangue scale 190, Cultivated land scale 275, vegetation scale 275, other construction scale 460, residential areas scale 460 and badlands scale 460.
4.2.2 Object Feature Space Establishment and Selection
Given the phenomenon that there are many of “the same object with different spectra” and “the same spectral foreign object” on the high-resolution remote sensing images of typical ground objects in the mining environment, this article extracted 44 features from the QuickBird image, WorldView-2 image, and Gaofen-2 image. This was done to establish the initial feature space, including 14 spectral features, 13 geometric features, 11 texture features, and six custom index features (Table 1). Meanwhile, only 29 features are extracted from the aerial image to construct the initial feature space due to the aerial image used in this article being a single-band image (Table 2). The established initial feature space is optimized by recursive feature elimination (RFE) (Bahl et al., 2019), which measures the importance of features by calculating out-of-pocket errors. Following this, the feature space with the highest prediction accuracy is selected by recursively eliminating the features with lower importance.

TABLE 1. Object initial feature space for QuickBird image, WorldView-2 image, and Gaofen-2 image.

TABLE 2. Object initial feature space for aerial image.
From the order of importance of the initial feature space of the QuickBird image in 2003 (Figure 9A), the contribution of spectral features, such as mean R (band red) and mean G (band green), in the surface environment classification of the coal mining subsidence area, is higher. The geometric features, such as compactness and the Stddev of the length of the edges (polygon), contribute less. When the number of features is 36, the classifier has the highest prediction accuracy (Figure 9B), excluding the eight features of the border length, asymmetric, length/width, compactness, shape index, border index, Density, and width. Similar to the QuickBird image in 2003, we finally selected 20 features of the aerial image in 1979, 36 features of the QuickBird image in 2003, 38 features of the WorldView-2 image in 2011, and 39 features of Gaofen-2 image for random forest classification.
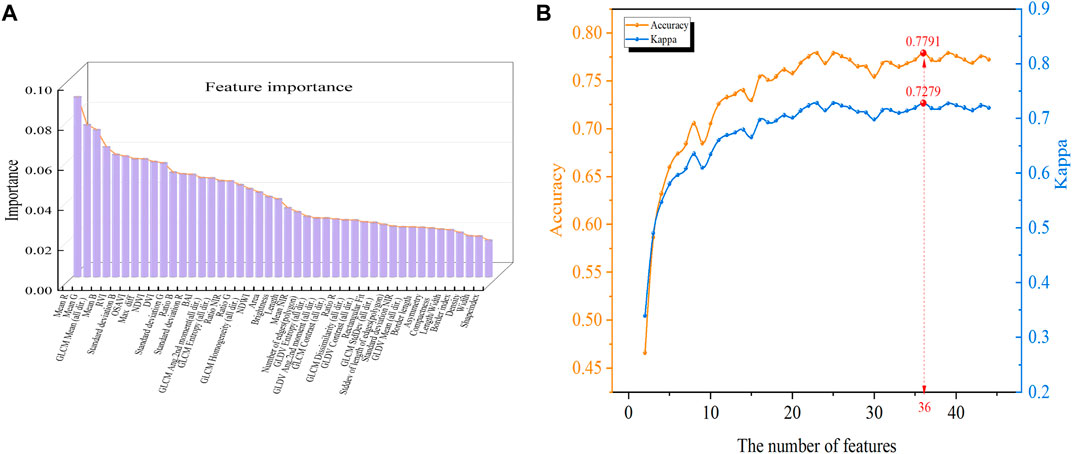
FIGURE 9. (A) Order of the importance of the initial features in the QuickBird image and (B) the relationship between the prediction accuracy and the number of features in the QuickBird image.
4.2.3 Extraction of Surface Environment Information in Coal Mining Subsidence Area
In comparison to other classification methods, random forest classification can make full use of the differences among training samples and has strong high-dimensional data processing ability. Therefore, we selected the random forest classifier to pre-classify surface environmental elements in the Huinong coal mining subsidence area. The accuracy of the samples directly affects the random forest classification accuracy. We first selected training samples of various objects based on the established interpretation signs for surface environmental elements in the coal mining subsidence area. Following this, we conducted multi-level random forest classification based on the obtained optimal segmentation scale object and the optimized feature space. Finally, the random forest classification results were used as reference data to assist the man-machine interactive interpretation and obtain the surface environment status maps from 1979, 2003, 2011, and 2018 (Figure 10).
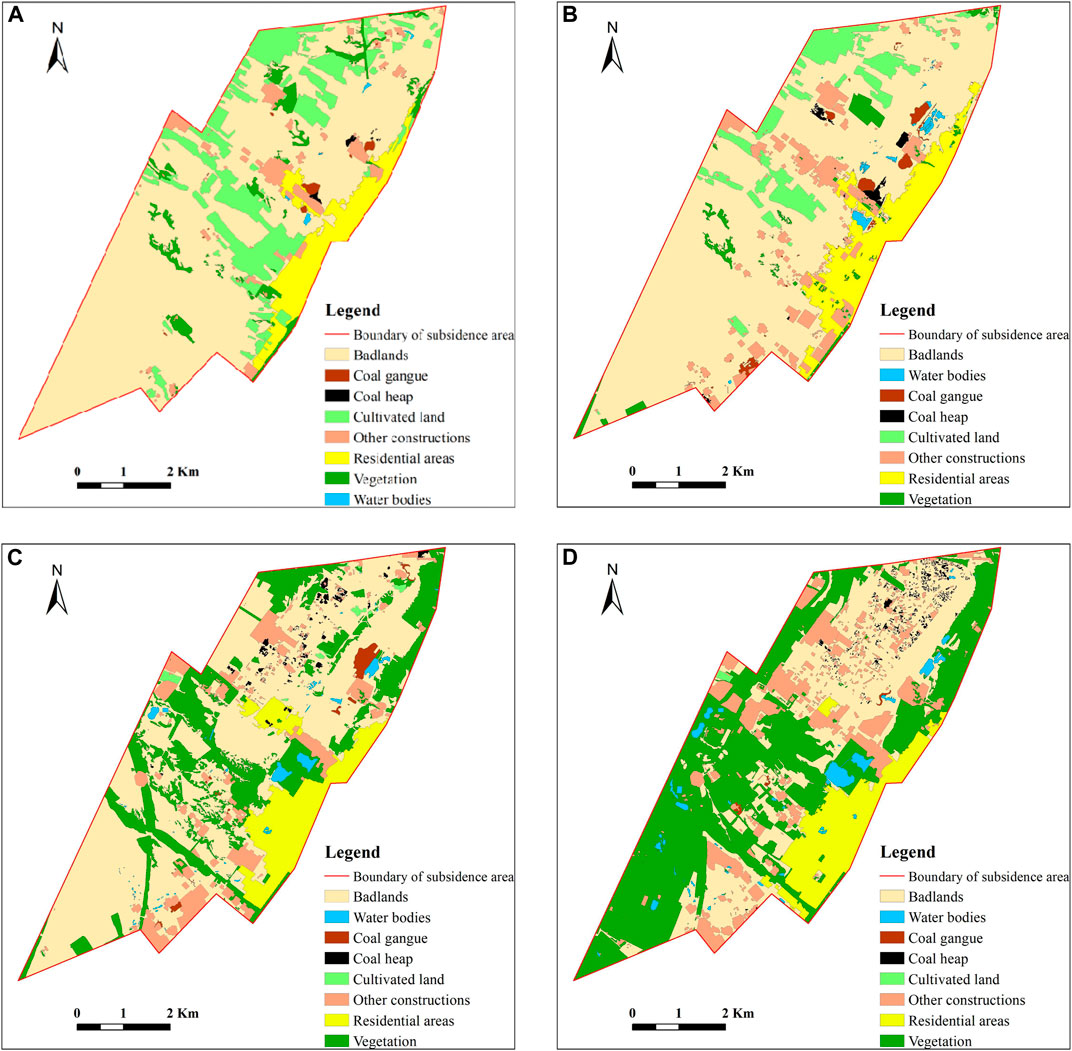
FIGURE 10. Interpretation map of surface environmental elements in coal mining subsidence area. (A) 1979, (B) 2003, (C) 2011, and (D) 2018.
4.3 Remote Sensing Interpretation Accuracy Assessment
The interpretation accuracy was evaluated by comparing the interpretation maps with Google Earth images and historical data (referring to land survey data and field investigations of typical areas) of the study area from 1979 to 2018 acquired from the Google Earth Engine (GEE) platform and national land survey in China (Assal et al., 2015; Padmanaban et al., 2017a; Cao et al., 2018; Luo et al., 2020). We generated a set of 265 random points and extracted those values for four different study periods. Then, the selected random point values were recognized from Google Earth images or historical data and compared to the interpretation maps. We used the kappa coefficient to quantify the interpretation accuracy (Walston et al., 2009), which ranges from 0 to 1, and can be divided into five groups to represent different levels of consistency: 0.0–0.20 (slight), 0.21–0.40 (fair), 0.41–0.60 (moderate), 0.61–0.80 (substantial), and 0.81–1 (almost perfect) (Masek et al., 2006; Dubovyk et al., 2013; Assal et al., 2014; Moradi et al., 2020). The user and producer accuracies were also calculated (Padmanaban et al., 2017b).
5 Results and Discussion
5.1 Remote Sensing Interpretation Accuracy Analysis
The high complexity of the surface environment in the coal mining subsidence area made object-oriented random forest classification unreliable. From Table 3, it can be seen that the overall accuracy is about 75%, and the kappa coefficient is lower than 0.7. There are mainly objects, such as coal gangue, residential land, and vegetation, being missed. Furthermore, coal heap and coal gangue are being misclassified. However, the classification accuracy of water bodies and badlands is higher. After the modification of man-machine interactive interpretation, We acquired an overall accuracy value of more than 84% for the interpretation maps of all years, with kappa coefficient values of more than 0.84 (Table 4). These statistics show a satisfactory accuracy of the interpretation maps.
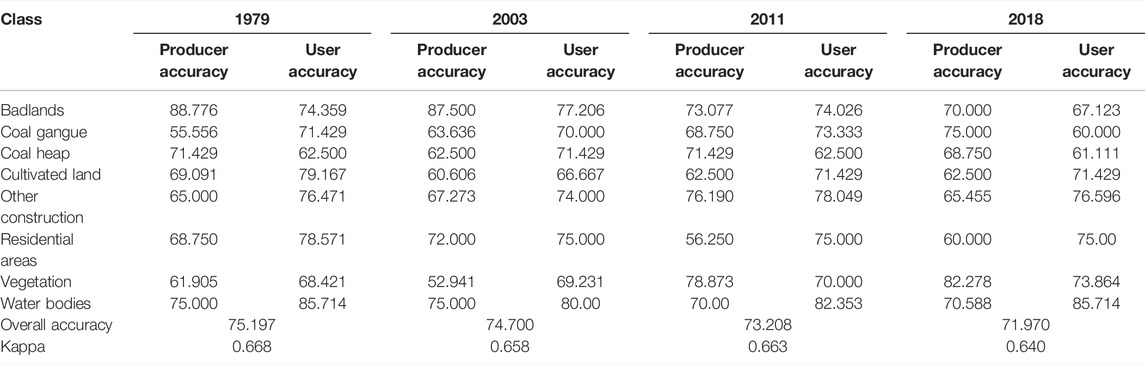
TABLE 3. Accuracy assessment for the random forest classification results from 1979 to 2018 (unit: %).
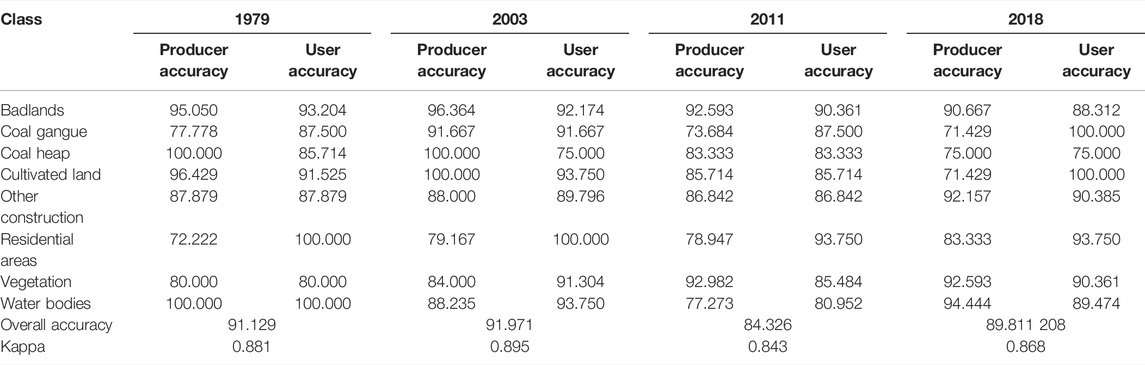
TABLE 4. Accuracy assessment for the interpretation maps from 1979 to 2018 (unit: %).
5.2 Statistical Analysis of the Surface Environment Changes in Coal Mining Subsidence Areas
Statistical analysis was conducted on the change of land-use classes within the four time phases to ascertain the change in surface environment in the coal mining subsidence area from 1979–2003, 2003–2011, and 2011–2018. Table 5 shows that the largest change in the area between 1979 and 2003 was in cultivated land, which decreased by 2.663 km2, followed by other construction and residential areas, which increased by 1.430 and 0.981 km2, respectively, indicating a rapid expansion of the urban area. In addition, the area changes in coal heap and water bodies were relatively large, increasing by 0.168 and 0.189 km2, respectively, with change rates as high as 279.432 and 353.795%, indicating that coal mining activities in the study area had a significant impact on the ecological environment during this period. The change rates, in the descending order, were as follows: coal gangue, vegetation, and wasteland. The area of vegetation coverage decreased by 34.599%, while the area of coal gangue and badlands increased (182.277 and 0.766%, respectively), which also indirectly reflected the impact of mining on the ecological environment.

TABLE 5. Statistical table regarding land-use classes changes, 1979–2003 (unit: 10–2 km2).
Table 6 shows that the largest change in area from 2003 to 2011 was in vegetation, with an increase of 7.719 km2 and a change rate of 710.794%, followed by badlands, with a decrease of 5.082 km2. In combination with field surveys, it can be seen that in 2011, the second phase of the geological environment renovation project in the mining area was completed, and the surface environment of the coal mining subsidence area improved. In addition, the area changes in cultivated land and water bodies are relatively large, among which, the area of cultivated land decreased by 3.068 km2, with a change rate of −93.967%, primarily caused by abandonment or idleness. Furthermore, the area of water bodies increased by 0.195 km2, with a change rate of 80.579%, primarily caused by the construction of many landscape lakes (mostly from the treatment of wastewater from former mine pits) in the process of mine geological environment renovation. Although the increase in the area of the coal pile is small, the change rate is large, at 31.034%, and the increased area is mainly distributed outside the scope of the first phase of renovation, and there are fences on the periphery of the coal pile, indicating that the pile of coal received standardized management at this time. The area of coal gangue decreased by 0.0832 km2 during this period, and the rate of change was −20.006%. This was mainly due to the removal of the coal gangue from the No. 1 and No. 2 mines after the mine’s geological environment renovation began in 2004. Only a very small amount of coal gangue remains. The rate of change in other construction and residential areas is relatively small, with a slight decrease in residential areas, which could be caused by the demolition of old residential buildings.

TABLE 6. Land-use classes changes from 2003 to 2011 (unit: 10–2 km2).
The third stage of mine geological environment renovation began in 2010 and was completed in 2015. From Table 7, it can be seen that the largest area of change from 2011 to 2018 is in the badlands, with an area decrease of 9.311 km2; followed by the vegetation, with an area increase of 7.49.3 km2, indicating that the geological environment renovation of the mine was effective. The area of other construction increased by 1.720 km2, with an increase rate of 50.449%, which was mainly caused by the areas of landscapes and geological museums supporting the mine geological park, in addition to the factory buildings. The area of coal gangue and cultivated land reduced; the reduction rate in the coal gangue area was 83.131%, indicating that the mining intensity of the mining area reduced from 2011 to 2018 and that the stacking of coal gangue became more standardized. The area of cultivated land decreased by 0.634 km2, with a reduction rate of 74.868%, mainly due to the re-greening of some cultivated land during the third stage of mine geological renovation. The change rate of water bodies is second only to that of coal gangue, at 72.781%. This is mainly contributed by the changes in landscape lakes after the treatment of mine wastewater, whose size increases year by year after renovation. After the area of urban residents continued to decrease in the early stages, it rose again from 2011 to 2018, with an increase rate of 4.371%, indicating that urbanization was carried out, while the ecological environment in the mining area was improving.

TABLE 7. Land-use classes changes from 2011 to 2018 (unit: 10–2 km2).
5.3 Analysis of the Surface Environment Transformation in Coal Mining Subsidence Areas
5.3.1 Dynamic Change Map of the Surface Environment
By overlaying the interpretation map of surface environmental elements in coal mining subsidence areas from 1979 to 2018 and sketching the change map, the dynamic change maps of the surface environment in the study area from 1979 to 2003, 2003 to 2011, and 2011 to 2018 are generated (Figures 11A–C).
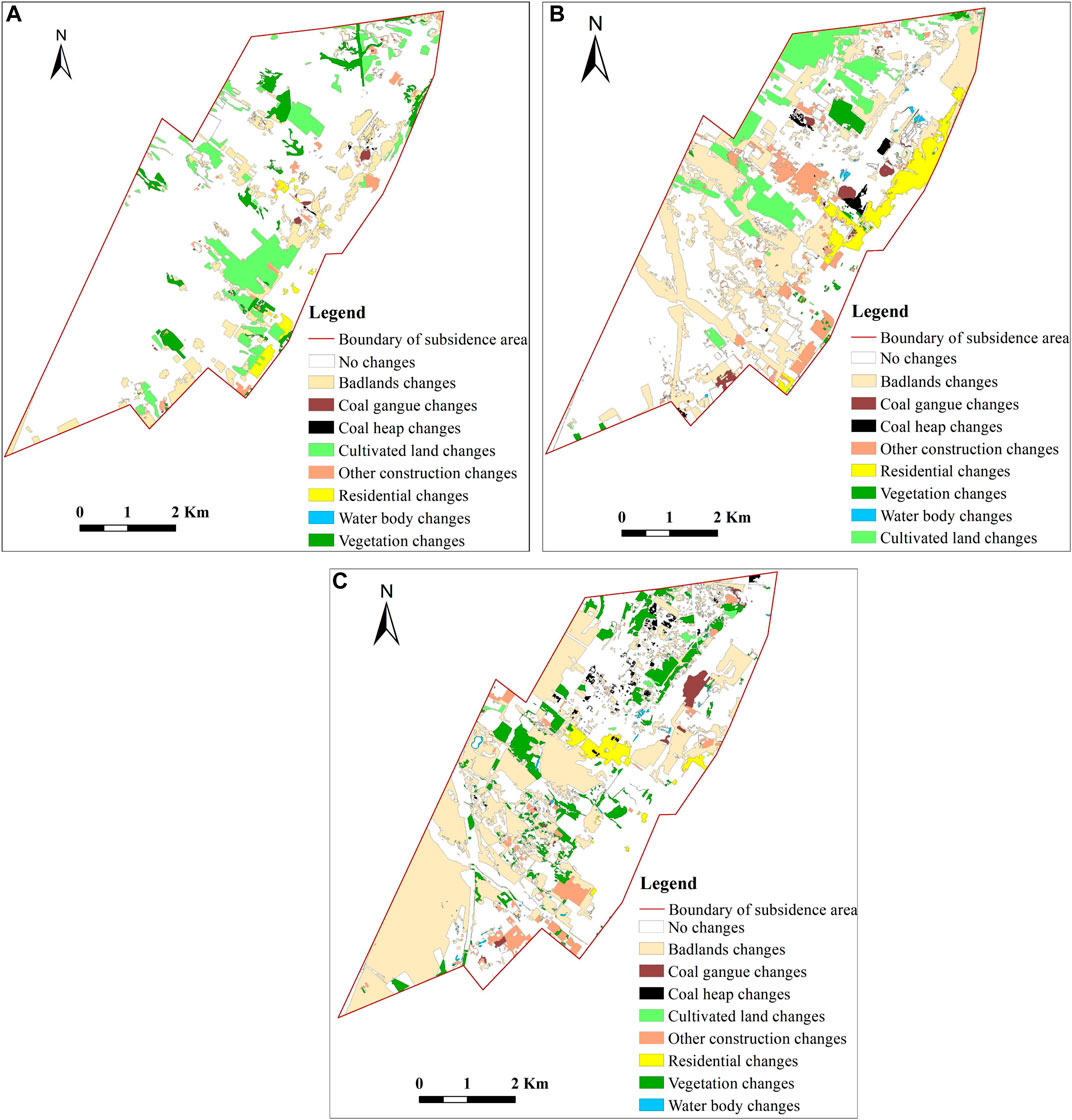
FIGURE 11. Maps on surface environment changes in the Huinong coal mining subsidence area. (A) 1979 to 2003, (B) 2003 to 2011, and (C) 2011 to 2018.
5.3.2 Analysis of the Land-Use Class Change Matrix
To further analyze the evolution law and the cause of the existing land-use pattern in the mining area, we calculated the interconversion of various types of surface objects and obtained the land-use class change matrix from the dynamic change maps by the use of overlay analysis function based on GIS software (Tables 8–10).
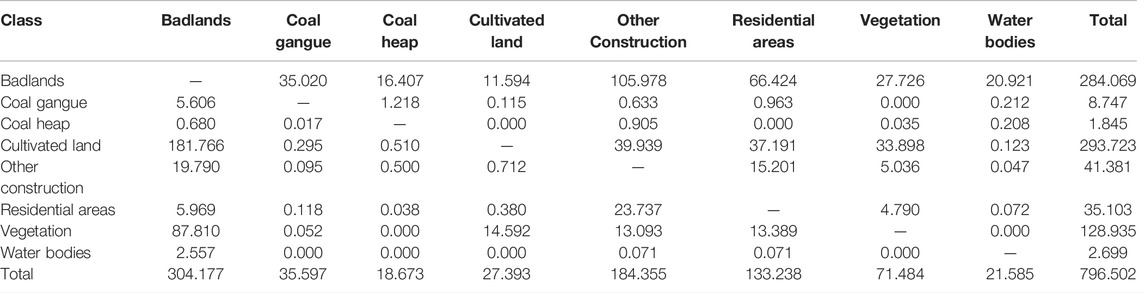
TABLE 8. Land-use class change matrix from 1979 to 2003 (unit: 10–2 km2).
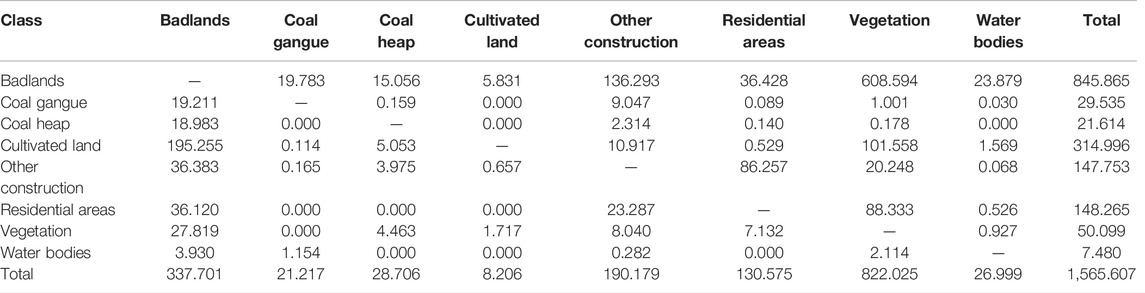
TABLE 9. Land-use class change matrix from 2003 to 2011 (unit: 10–2 km2).
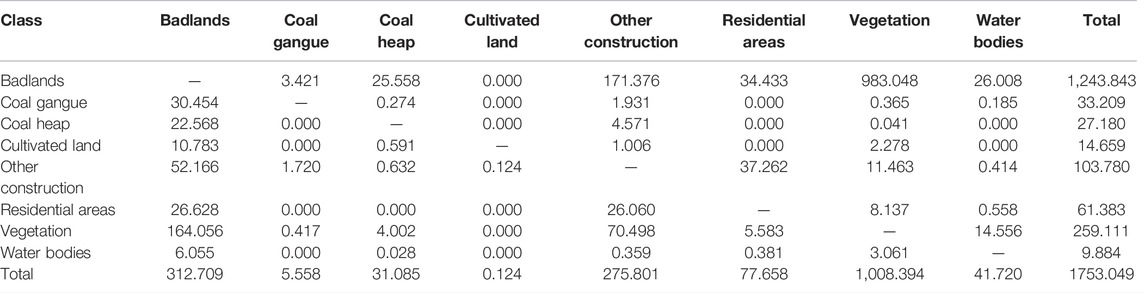
TABLE 10. Land-use class change matrix from 2011 to 2018 (unit: 10–2 km2).
The land-use class change matrix exhibits the interconversion of various types of ground objects. From 1979 to 2003, the total area of all land-use class changes was 7.965 km2; from 2003 to 2011, the total area of land-use class changes was 15.656 km2; and from 2011 to 2018, the total area of land-use class change was 17.530 km2. The transformation and causes of various land-class changes are analyzed as follows.
1) Badlands: From 1979 to 2003, the area of badlands exhibited an increasing trend (Figure 12A), mainly owing to the conversion of cultivated land and vegetation caused by soil erosion, land desertification, and idle cultivated land. From 2003 to 2018, the area of badlands decreased significantly, primarily being converted into residential areas, other construction, and coal gangue. This is owing to urban construction, the increase in factory buildings, and new coal gangue stacking points. Furthermore, some idle cultivated land and the demolition of residential areas in the collapse pit led to the conversion of cultivated land, other construction, and residential areas into badlands.
2) Coal gangue: The area of coal gangue exhibited an increasing trend from 1979 to 2003 (Figure 12B), primarily converted from badlands, accounting for 98% of the total converted area. It is mainly distributed near the coal mine industrial square. Since the gangue has never been cleaned during this time, it can be seen from the remote sensing images that the plane area and height of the gangue hill have increased, and the ecological environment of the mining area has been severely damaged. From 2003 to 2011, the area of coal gangue exhibited a rapidly decreasing trend, being primarily converted into badlands. The main reason for this is that the coal gangue was cleared and transported from the mining area, and only a small part of the gangue was left near the industrial square. The ecological environment of the mining area has greatly improved.
3) Coal heap: From 1979 to 2009, coal heaps exhibited an increasing trend (Figure 12C). The area increase rate from 1979 to 2003 ranked first among all land-use classes, reaching 279.43%, which was mainly owing to conversion from badlands. This shows that the mining intensity of the mining area is large in this period, and the coal mined mainly accumulates around the industrial square and the mine. From 2003 to 2018, a partial coal heap was converted from cultivated land and vegetation. The increase was significantly less than that from 1979 to 2003. In addition, some coal heap areas were converted into badlands, vegetation, and other construction, indicating that coal mining efforts during this period lessened. During the renovation of the geological environment in the mining area, a unified plan for coal storage was carried out.
4) Cultivated land: From 1979 to 2018, the cultivated land exhibited a decreasing trend, where the area decreased the most from 2003 to 2011, being primarily converted into badlands (61.987%) and vegetation (32.241%), followed by other construction and coal heaps (Figure 12D). This is primarily because most of the cultivated land was abandoned or idle in this period and was occupied by other infrastructure under construction during the process of urban expansion. From 1979 to 2003, cultivated land was mainly converted into badlands and other construction areas, accounting for 75.481% of the total converted area. In addition to the fact that most cultivated lands were abandoned and idle, some were still occupied by coal heaps or coal gangue. Furthermore, some vegetation, other construction, and badlands were also converted into cultivated land; however, this area was much smaller than the reduction. From 2011 to 2018, the cultivated land area decreased slightly, which was mainly converted into badlands and vegetation, caused by the re-greening of part of the cultivated land after being abandoned and idle.
5) Other construction: Other buildings exhibited a continuous increase from 1979 to 2018 (Figure 12E), with the highest change rate of 50.449%. This area was mainly converted from badlands, vegetation, residential areas, and coal heaps, accounting for 98.805% of the converted area. The area that increased mainly comprises factory buildings and brick factories built during wasteland development and occupied vegetation-covered areas.
6) Residential areas: The growth rate of residential areas was the largest between 1979 and 2003, indicating that urban expansion was rapid during this period (Figure 12F). From 2003 to 2011, the residential area decreased slightly. Then, from 2011 to 2018, the area rebounded, but the increase was less than that from 1979 to 2003, indicating that the pace of urban expansion has slowed in recent years. The changes in the residential area have the following two characteristics: ① Most of the residential area is converted from cultivated land and badlands, followed by other construction and vegetation. This indicates that in the process of urban expansion, the most severely affected land-use classes are surrounding cultivated land and badlands, mainly because this type of land is relatively flat and close to the built area of the city, making distance costs relatively low; ② while residential areas are increasing, they are partly converted into other construction, badlands, and vegetation coverage areas. Among them, other construction and badlands are formed by the demolition of old houses in the subsidence area, and the vegetation coverage area is formed by the re-greening of vegetation after demolition.
7) Vegetation: From 1979 to 2003, the vegetation area exhibited a decreasing trend (Figure 12G), mainly being converted into badlands, cultivated land, and residential areas, accounting for 89.806% of the total converted area. This indicates that the ecological environment of the mining area has been severely damaged during this period. From 2003 to 2018, the vegetation area exhibited a significantly increasing trend, mainly converted from badlands and residential areas, followed by other construction and water bodies. In 2004, the geological environment underwent renovation. The measures taken included demolishing residential houses in the main collapse pits, backfilling part of the collapse pits with coal gangue and construction waste, and re-greening according to the terrain. These measures have greatly increased the vegetation coverage in the mining area and reduced soil erosion. The significant increase in the vegetation area found in the statistical results is consistent with the effectiveness of geological environment governance in the mining area.
8) Water bodies: The water areas in the mining region exhibited a gradually increasing trend (Figure 12H), mainly reflecting conversion from badlands. Most of the water is mine wastewater, with small amounts of natural water formation. Through the process of governing the mine geological environment, the natural landscape is directly formed after the treatment of mine wastewater. Some water bodies are converted into badlands, primarily natural puddles, whose area is generally small.
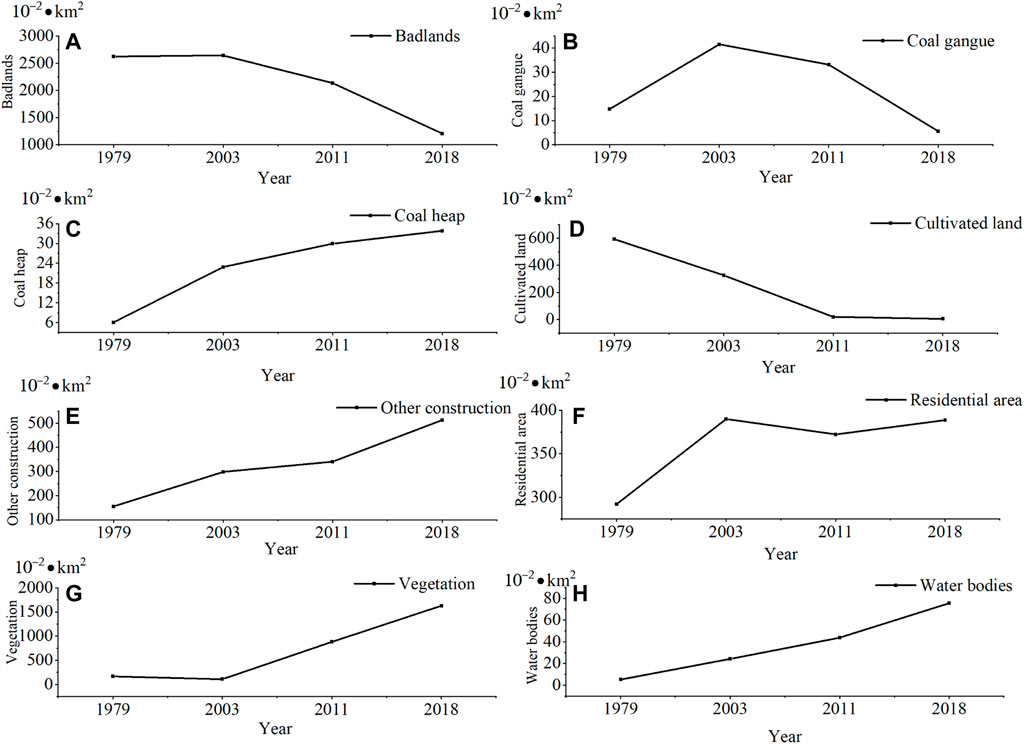
FIGURE 12. Statistical chart of the area change of various land-use classes. (A) Changes in the badlands, (B) changes in the coal gangue, (C) changes in the coal heaps, (D) changes in the cultivated land, (E) changes in the other construction, (F) changes in the residential area, (G) changes in the vegetation, and (H) changes in the water bodies.
6 Conclusion
Based on the results of this study, the following conclusions can be drawn:
1) The original multispectral and panchromatic images are preprocessed by geometric correction, resampling, and image fusion with the help of ENVI software (version 5.3) before interpretation. All the registration errors meet the accuracy requirements for image overlay. For image fusion, the Gram–Schmidt fusion algorithm performs the best for QuickBird image, while the PCA fusion algorithm works best for Worldview-2 and GF-2 images.
2) Through the field investigation and measured/image spectrum contrast analysis, the remote sensing image features of various environmental elements were analyzed, and the interpretation signs of surface environmental elements in coal mining subsidence areas were established. These include badlands, coal gangue, coal heaps, cultivated land, other construction, residential areas, vegetation, and water bodies.
3) Using the object-oriented random forest classification method to assist man-machine interactive interpretation had a satisfactory classification accuracy. The interpretation maps of all years acquired an overall accuracy value of more than 85%, with kappa coefficient values of more than 0.84.
4) The surface environment in the coal mining subsidence area has undergone significant changes over the past 40 years. From 1979 to 2003, the area of cultivated land and vegetation cover decreased sharply, and the conversion to badlands and residential areas was particularly obvious, which was mainly caused by the infrastructure construction and soil erosion in the process of urbanization. The other land-use class areas, such as coal heaps, water bodies, and coal gangue, exhibited a trend of rapid growth, mainly converted from badlands. Mining activities have caused severe damage to the environment of the mining area.
5) From 2003 to 2018, the vegetation-covered area exhibited the fastest growth rate, while the area of coal gangue, badlands, and other land-use classes significantly reduced. This change coincides with the period of geological environment renovation in the mining area, reflecting its effectiveness. In addition, the residential area continued to decrease in the early stages and then rebounded to some extent, indicating that urbanization was carried out at the same time as the ecological environment in the mining area improved.
6) After more than 10 years of mine geological environment renovation, the surface environment of the coal mining subsidence area greatly improved, practically eliminating the hidden dangers of geological disasters. Furthermore, the quality of life of the residents in the mining area has also been improved. The surface environment before and after the renovation of the mine geological environment in the study area is consistent with the results of remote sensing monitoring.
Therefore, remote sensing–GIS techniques are very useful for monitoring surface environmental evolution in the coal mining subsidence area. This study was based on data from aerial image, QuickBird, WorldView-2, and GF-2 imaging. However, inputs from other sources (e.g., Spot data, HJ-A data, and ZY-3-01/02 data) should be used to improve the comparison and further verify the reliability of this method. Moreover, there are many remote sensing image classifiers. Only the widely used and effective random forest classifier is selected in this study for the automatic classification of the surface environment in the coal mining subsidence area. However, some other classification methods also work well, such as developing a semiautomated fuzzy decision-making system using the genetic algorithm (GA), constructing a classification model by combining the tree root algorithm with the extreme learning machine method, and the like. Further studies are necessary to consider these models for comparison with random forest classifiers to analyze their effectiveness for application in the surface environment of coal mining subsidence areas.
Data Availability Statement
The original contributions presented in the study are included in the article/Supplementary Material, further inquiries can be directed to the corresponding author.
Author Contributions
HS conceived and designed the experiments; H-ZZ processed the remote sensing data and analyzed the results; W-KN, Z-HG, YL, and S-HL conducted the field investigations and data curation; and HS and H-ZZ wrote and revised the manuscript. All authors have read and agreed to publish the manuscript.
Funding
This study was supported by the Natural Science Foundation of China (Grant No. 41702377), the Natural Science Basic Research Program of the Shaanxi Provincial Science and Technology Department (Grant No. 2017JQ4008), and China Postdoctoral Science Foundation (Grant No. 2017M623208).
Conflict of Interest
The authors declare that the research was conducted in the absence of any commercial or financial relationships that could be construed as a potential conflict of interest.
Publisher’s Note
All claims expressed in this article are solely those of the authors and do not necessarily represent those of their affiliated organizations, or those of the publisher, the editors, and the reviewers. Any product that may be evaluated in this article, or claim that may be made by its manufacturer, is not guaranteed or endorsed by the publisher.
References
Abbaszadeh Tehrani, N., Mohd Shafri, H. Z., Salehi, S., Chanussot, J., and Janalipour, M. (2021). Remotely-Sensed Ecosystem Health Assessment (RSEHA) Model for Assessing the Changes of Ecosystem Health of Lake Urmia Basin. Int. J. Image Data Fusion 12, 1–26. doi:10.1080/19479832.2021.1924880
Assal, T. J., Anderson, P. J., and Sibold, J. (2015). Mapping forest Functional Type in a forest-shrubland Ecotone Using SPOT Imagery and Predictive Habitat Distribution Modelling. Remote Sensing Lett. 6 (10), 755–764. doi:10.1080/2150704X.2015.1072289
Assal, T. J., Sibold, J., and Reich, R. (2014). Modeling a Historical Mountain Pine Beetle Outbreak Using Landsat MSS and Multiple Lines of Evidence. Remote Sensing Environ. 155, 275–288. doi:10.1016/j.rse.2014.09.002
Aune-Lundberg, L., and Strand, G.-H. (2021). The Content and Accuracy of the CORINE Land Cover Dataset for Norway. Int. J. Appl. Earth Observation Geoinformation 96, 102266. doi:10.1016/j.jag.2020.102266
Bahl, A., Hellack, B., Balas, M., Dinischiotu, A., Wiemann, M., Brinkmann, J., et al. (2019). Recursive Feature Elimination in Random forest Classification Supports Nanomaterial Grouping. NANOIMPACT 15, 100179. doi:10.1016/j.impact.2019.100179
Cao, R.-f., Zhang, A.-l., and Wen, L.-j. (2018). Trans-regional Compensation Mechanism under Imbalanced Land Development: From the Local Government Economic Welfare Perspective. Habitat Int. 77, 56–63. doi:10.1016/j.habitatint.2018.04.001
Carlà, T., Farina, P., Intrieri, E., Ketizmen, H., and Casagli, N. (2018). Integration of Ground-Based Radar and Satellite InSAR Data for the Analysis of an Unexpected Slope Failure in an Open-Pit Mine. Eng. Geology. 235, 39–52. doi:10.1016/j.enggeo.2018.01.021
Chen, W., Li, X., He, H., and Wang, L. (2018). A Review of Fine-Scale Land Use and Land Cover Classification in Open-Pit Mining Areas by Remote Sensing Techniques. Remote Sensing 10 (2), 15. doi:10.3390/rs10010015
Chugh, Y. P. (2018). Concurrent Mining and Reclamation for Underground Coal Mining Subsidence Impacts in China. Int. J. Coal Sci. Technol. 5 (1), 18–35. doi:10.1007/s40789-018-0189-2
Cloutis, E. A. (1996). Review Article Hyperspectral Geological Remote Sensing: Evaluation of Analytical Techniques. Int. J. Remote Sensing 17 (12), 2215–2242. doi:10.1080/01431169608948770
Crósta, A. P., De Souza Filho, C. R., Azevedo, F., and Brodie, C. (2003). Targeting Key Alteration Minerals in Epithermal Deposits in Patagonia, Argentina, Using ASTER Imagery and Principal Component Analysis. Int. J. Remote Sensing 24 (21), 4233–4240. doi:10.1080/0143116031000152291
Darmody, R. G., Bauer, R., Barkley, D., Clarke, S., and Hamilton, D. (2014). Agricultural Impacts of Longwall Mine Subsidence: the Experience in Illinois, USA and Queensland, Australia. Int. J. Coal Sci. Technol. 1 (2), 207–212. doi:10.1007/s40789-014-0026-1
Demirel, N., Emil, M. K., and Duzgun, H. S. (2011). Surface Coal Mine Area Monitoring Using Multi-Temporal High-Resolution Satellite Imagery. Int. J. Coal Geology. 86 (1), 3–11. doi:10.1016/j.coal.2010.11.010
DeWitt, J. D., Chirico, P. G., Bergstresser, S. E., and Warner, T. A. (2017). Multi-scale 46-year Remote Sensing Change Detection of diamond Mining and Land Cover in a Conflict and post-conflict Setting. Remote Sensing Appl. Soc. Environ. 8, 126–139. doi:10.1016/j.rsase.2017.08.002
Dornik, A., Drăguţ, L., and Urdea, P. (2018). Classification of Soil Types Using Geographic Object-Based Image Analysis and Random Forests. Pedosphere 28 (6), 913–925. doi:10.1016/S1002-0160(17)60377-1
Drăguţ, L., Csillik, O., Eisank, C., and Tiede, D. (2014). Automated Parameterisation for Multi-Scale Image Segmentation on Multiple Layers. ISPRS J. Photogrammetry Remote Sensing 88, 119–127. doi:10.1016/j.isprsjprs.2013.11.018
Drăguţ, L., and Eisank, C. (2012). Automated Object-Based Classification of Topography from SRTM Data. Geomorphology 141-142, 21–33. doi:10.1016/j.geomorph.2011.12.001
Drǎguţ, L., Tiede, D., and Levick, S. R. (2010). ESP: A Tool to Estimate Scale Parameter for Multiresolution Image Segmentation of Remotely Sensed Data. Int. J. geographical Inf. Sci. : IJGIS 24 (6), 859–871. doi:10.1080/13658810903174803
Dubovyk, O., Menz, G., Conrad, C., Kan, E., Machwitz, M., and Khamzina, A. (2013). Spatio-temporal Analyses of Cropland Degradation in the Irrigated Lowlands of Uzbekistan Using Remote-Sensing and Logistic Regression Modeling. Environ. Monit. Assess. 185 (6), 4775–4790. doi:10.1007/s10661-012-2904-6
Feghhi, J., Teimouri, S., Makhdoum, M. F., Erfanifard, Y., and Abbaszadeh Tehrani, N. (2017). The Assessment of Degradation to Sustainability in an Urban forest Ecosystem by GIS. Urban For. Urban Green. 27, 383–389. doi:10.1016/j.ufug.2017.06.009
He, D., Le, B. T., Xiao, D., Mao, Y., Shan, F., and Ha, T. T. L. (2019). Coal Mine Area Monitoring Method by Machine Learning and Multispectral Remote Sensing Images. Infrared Phys. Technol. 103, 103070. doi:10.1016/j.infrared.2019.103070
He, T., Xiao, W., Zhao, Y., Deng, X., and Hu, Z. (2020). Identification of Waterlogging in Eastern China Induced by Mining Subsidence: A Case Study of Google Earth Engine Time-Series Analysis Applied to the Huainan Coal Field. Remote Sensing Environ. 242, 111742. doi:10.1016/j.rse.2020.111742
Hui, S., and Wankui, N. (2013). Remote Sensing Monitoring of Dynamic Changes of Surface Environment in Shizuishan Mining Area. Remote Sensing Land Resour. 25 (2), 113–120. doi:10.6046/gtzyyg.2013.02.20
Isidro, C., McIntyre, N., Lechner, A., and Callow, I. (2017). Applicability of Earth Observation for Identifying Small-Scale Mining Footprints in a Wet Tropical Region. Remote Sensing 9 (9), 945. doi:10.3390/rs9090945
Jafary, P., Sarab, A. A., and Tehrani, N. A. (2018). Ecosystem Health Assessment Using a Fuzzy Spatial Decision Support System in Taleghan Watershed before and after Dam Construction. Environ. Process. 5 (4), 807–831. doi:10.1007/s40710-018-0341-4
Janalipour, M., and Mohammadzadeh, A. (2017). A Fuzzy-GA Based Decision Making System for Detecting Damaged Buildings from High-Spatial Resolution Optical Images. Remote Sensing 9 (4), 349. doi:10.3390/rs9040349
Ji, L., and Gallo, K. (2006). An Agreement Coefficient for Image Comparison. Photogramm Eng. Remote Sensing 72 (7), 823–833. doi:10.14358/PERS.72.7.823
Khanbani, S., Mohammadzadeh, A., and Janalipour, M. (2020). Unsupervised Change Detection of Remotely Sensed Images from Rural Areas Based on Using the Hybrid of Improved Thresholding Techniques and Particle Swarm Optimization. Earth Sci. Inform. 13 (3), 681–694. doi:10.1007/s12145-020-00455-8
Kundu, K., Halder, P., and Mandal, J. K. (2020). Urban Change Detection Analysis during 1978-2017 at Kolkata, India, Using Multi-Temporal Satellite Data. J. Indian Soc. Remote Sens 48 (11), 1535–1554. doi:10.1007/s12524-020-01177-6
Lawrence, R. L., Wood, S. D., and Sheley, R. L. (2006). Mapping Invasive Plants Using Hyperspectral Imagery and Breiman Cutler Classifications (randomForest). Remote Sensing Environ. 100 (3), 356–362. doi:10.1016/j.rse.2005.10.014
Liu, G., Zhou, H., Zhang, X., and Liu, J. (2013). Semantic Segmentation Based on Multi-Stage Region-Level Clustering. Multispectral Image Acquisition, Process. Anal. 8917, 1–6. doi:10.1117/12.2031227
Lobo, F. d. L., Souza-Filho, P. W. M., Novo, E. M. L. d. M., Carlos, F. M., and Barbosa, C. C. F. (2018). Mapping Mining Areas in the Brazilian Amazon Using MSI/Sentinel-2 Imagery (2017). Remote Sensing 10 (8), 1178. doi:10.3390/rs10081178
Louw, G., and van Niekerk, A. (2019). Object-based Land Surface Segmentation Scale Optimisation: An Ill-Structured Problem. Geomorphology 327, 377–384. doi:10.1016/j.geomorph.2018.11.021
Luo, F., Li, C., and Yan, Y. (2020). Quality Inspection and Evaluation of Satellite Orthophotos in China's Third National Land Survey. Int. Arch. Photogramm. Remote Sens. Spat. Inf. Sci. XLIII-B3-2020, 1359–1363. doi:10.5194/isprs-archives-XLIII-B3-2020-1359-2020
Marschalko, M., Bednárik, M., Yilmaz, I., Bouchal, T., and Kubečka, K. (2012). Evaluation of Subsidence Due to Underground Coal Mining: an Example from the Czech Republic. Bull. Eng. Geol. Environ. 71 (1), 105–111. doi:10.1007/s10064-011-0401-8
Masek, J. G., Vermote, E. F., Saleous, N. E., Wolfe, R., Hall, F. G., Huemmrich, K. F., et al. (2006). A Landsat Surface Reflectance Dataset for North America, 1990-2000. IEEE Geosci. Remote Sensing Lett. 3 (1), 68–72. doi:10.1109/LGRS.2005.857030
Mi, J., Yang, Y., Zhang, S., An, S., Hou, H., Hua, Y., et al. (2019). Tracking the Land Use/Land Cover Change in an Area with Underground Mining and Reforestation via Continuous Landsat Classification. Remote Sensing 11 (14), 1719. doi:10.3390/rs11141719
Mishra, R. K., Bahuguna, P. P., and Singh, V. K. (2011). Detection of Coal Mine Fire in Jharia Coal Field Using Landsat-7 ETM+ Data. Int. J. Coal Geology. 86 (1), 73–78. doi:10.1016/j.coal.2010.12.010
Moradi, F., Kaboli, H. S., and Lashkarara, B. (2020). Projection of Future Land Use/cover Change in the Izeh-Pyon Plain of Iran Using CA-Markov Model. Arab J. Geosci. 13 (19). doi:10.1007/s12517-020-05984-6
Morrison, K. G., Reynolds, J. K., and Wright, I. A. (2018). “Underground Coal Mining and Subsidence, Channel Fracturing and Water Pollution: A Five-Year Investigation,” in Proceedings of the 9th Australian Stream Management Conference, August 2018, Hobart, Tasmania, 689–396
Padmanaban, R., Bhowmik, A., and Cabral, P. (2017). A Remote Sensing Approach to Environmental Monitoring in a Reclaimed Mine Area. Ijgi 6 (12), 401. doi:10.3390/ijgi6120401
Padmanaban, R., Bhowmik, A. K., Cabral, P., Zamyatin, A., Almegdadi, O., and Wang, S. (2017). Modelling Urban Sprawl Using Remotely Sensed Data: A Case Study of Chennai City, Tamilnadu. Entropy 19 (4), 163. doi:10.3390/e19040163
Perski, Z., Hanssen, R., Wojcik, A., and Wojciechowski, T. (2009). InSAR Analyses of Terrain Deformation Near the Wieliczka Salt Mine, Poland. Eng. Geology. 106 (1-2), 58–67. doi:10.1016/j.enggeo.2009.02.014
Prakash, A., and Gupta, R. P. (1998). Land-use Mapping and Change Detection in a Coal Mining Area - a Case Study in the Jharia coalfield, India. Int. J. Remote Sensing 19 (3), 391–410. doi:10.1080/014311698216053
Roy, P., Guha, A., and Kumar, K. V. (2015). An Approach of Surface Coal Fire Detection from ASTER and Landsat-8 thermal Data: Jharia Coal Field, India. Int. J. Appl. Earth Observation Geoinformation 39, 120–127. doi:10.1016/j.jag.2015.03.009
Saedpanah, S., and Amanollahi, J. (2019). Environmental Pollution and Geo-Ecological Risk Assessment of the Qhorveh Mining Area in Western Iran. Environ. Pollut. 253, 811–820. doi:10.1016/j.envpol.2019.07.049
Sato, H. P., Hasegawa, H., Fujiwara, S., Tobita, M., Koarai, M., Une, H., et al. (2007). Interpretation of Landslide Distribution Triggered by the 2005 Northern Pakistan Earthquake Using SPOT 5 Imagery. Landslides 4 (2), 113–122. doi:10.1007/s10346-006-0069-5
Shahdoosti, H. R. (2015). “MS and PAN Image Fusion by Combining Brovey and Wavelet Method,” in International Conference on Information Technology, November 19th, 2015 (Computer & Communication), 1–6. doi:10.48550/ARXIV.1701.01996 https://www.researchgate.net/profile/Hamid-Shahdoosti/publication/308791384_MS_and_PAN_image_fusion_using_multipilicative_methods_in_the_wavelet_Domain/links/57f253fd08ae91deaa58c51d/MS-and-PAN-image-fusion-using-multipilicative-methods-in-the-wavelet-Domain.pdf
Soulard, C. E., Acevedo, W., Stehman, S. V., and Parker, O. P. (2016). Mapping Extent and Change in Surface Mines within the United States for 2001 to 2006. Land Degrad. Develop. 27 (2), 248–257. doi:10.1002/ldr.2412
Stumpf, A., and Kerle, N. (2011). Object-oriented Mapping of Landslides Using Random Forests. Remote Sensing Environ. 115 (10), 2564–2577. doi:10.1016/j.rse.2011.05.013
Walston, L. J., Cantwell, B. L., and Krummel, J. R. (2009). Quantifying Spatiotemporal Changes in a Sagebrush Ecosystem in Relation to Energy Development. Ecography 32 (6), 943–952. doi:10.1111/j.1600-0587.2009.05852.x
Wang, Q., Guo, H., Chen, Y., Lin, Q., and Li, H. (2013). Application of Remote Sensing for Investigating Mining Geological Hazards. Int. J. Digital Earth 6 (5), 449–468. doi:10.1080/17538947.2011.629009
Watts, J. D., Lawrence, R. L., Miller, P. R., and Montagne, C. (2009). Monitoring of Cropland Practices for Carbon Sequestration Purposes in north central Montana by Landsat Remote Sensing. Remote Sensing Environ. 113 (9), 1843–1852. doi:10.1016/j.rse.2009.04.015
Wu, C., Li, X., Chen, W., and Li, X. (2020). A Review of Geological Applications of High-Spatial-Resolution Remote Sensing Data. J. Circuit Syst. Comp. 29 (06), 2030006. doi:10.1142/s0218126620300068
Xiao, W., Fu, Y., Wang, T., and Lv, X. (2018). Effects of Land Use Transitions Due to Underground Coal Mining on Ecosystem Services in High Groundwater Table Areas: A Case Study in the Yanzhou coalfield. Land Use Policy 71, 213–221. doi:10.1016/j.landusepol.2017.11.059
Xinhua, Z., Shuzhong, G., Xingjie, W., Hong, W., Hong, Z., and Yongjun, H. (2011). Examination of Resource Curse Hypothesis: Mineral Resources Exploitation and Economic Growth in Xinjiang Autonomous Region. Chin. J. Popul. Resour. Environ. 9 (1), 63–70. doi:10.1080/10042857.2011.10685020
Yang, W., and Gong, Y. (2012). Multi-spectral and Panchromatic Images Fusion Based on PCA and Fractional Spline Wavelet. Int. J. Remote Sensing 33 (22), 7060–7074. doi:10.1080/01431161.2012.698322
Yilmaz, V., Serifoglu Yilmaz, C., Güngör, O., and Shan, J. (2020). A Genetic Algorithm Solution to the Gram-Schmidt Image Fusion. Int. J. Remote Sensing 41 (4), 1458–1485. doi:10.1080/01431161.2019.1667553
Yuling, Z., Jinzhong, Y., and Zhi, Z. (2020). A Preliminary Study on Remote Sensing Monitoring Method for Oil and Gas Resources- A Case Study in Ordos Basin. E3s Web Conf. 194, 01003. doi:10.1051/e3sconf/202019401003
Zhang, Q., Zhang, J., Jiang, L., Liu, X., and Tong, Z. (2014). Flood Disaster Risk Assessment of Rural Housings - A Case Study of Kouqian Town in China. Ijerph 11 (4), 3787–3802. doi:10.3390/ijerph110403787
Keywords: coal mining subsidence, interpretation signs, spatial–temporal evolution monitoring, remote sensing, Huinong
Citation: Shang H, Zhan H-Z, Ni W-K, Liu Y, Gan Z-H and Liu S-H (2022) Surface Environmental Evolution Monitoring in Coal Mining Subsidence Area Based on Multi-Source Remote Sensing Data. Front. Earth Sci. 10:790737. doi: 10.3389/feart.2022.790737
Received: 07 October 2021; Accepted: 11 April 2022;
Published: 13 May 2022.
Edited by:
Juergen Pilz, University of Klagenfurt, AustriaReviewed by:
Milad Janalipour, K.N.Toosi University of Technology, IranTianzuo Wang, Shaoxing University, China
Huang Xiaohu, China Three Gorges University, China
Copyright © 2022 Shang, Zhan, Ni, Liu, Gan and Liu. This is an open-access article distributed under the terms of the Creative Commons Attribution License (CC BY). The use, distribution or reproduction in other forums is permitted, provided the original author(s) and the copyright owner(s) are credited and that the original publication in this journal is cited, in accordance with accepted academic practice. No use, distribution or reproduction is permitted which does not comply with these terms.
*Correspondence: Hui-Zhu Zhan, MTkyMDkyMTIwNTZAc3R1Lnh1c3QuZWR1LmNu