 Chang Chang
 Haiyan Wang1*
- 1Chinese Academy of Geological Sciences Institute of Geology, Beijing, China
- 2China University of Geosciences, Beijing, China
- 3School of Earth Sciences and Engineering, Sun Yat-Sen University, Guangzhou, China
- 4China Aero Geophysical Survey and Remote Sensing Center for Natural Resources, China Geological Survey, Beijing, China
- 5College of Geo-Exploration Science and Technology, Jilin University, Changchun, China
The Central Asian Orogenic Belt (CAOB) is a globally magnificent accretionary orogenic belt that has been formed since the Phanerozoic as a result of the Paleozoic closing of the Paleo-Asian Ocean (PAO). The transition zone between the North China Craton (NCC) and the Siberia Plate is located in the eastern CAOB and has been thoroughly investigated by various seismic investigations. However, other types of geophysical approaches lag behind, especially integrated magnetic-gravity surveying, which could provide regional continent-scale constraints on the deep crustal structure. Here, the high-resolution ground gravity and airborne magnetic data covering the study region are newly processed by upward continuation, an improved potential field normalization differential algorithm, an analytical signal approach, and correlation analysis. The processed gravity and magnetic anomalies reveal dominant differences between the CAOB and the northern margin of the NCC; these regions are tectonically divided by the upper crustal Chifeng-Baiyan Obo fault, which is expressed by an important geological boundary. In the middle and lower crust, this tectonic boundary extends northward to the Xar Moron fault. Unexposed Mesozoic granites may be distributed extensively in the mid-lower crust along the Solonker suture zone. The local negative correlation characteristics of gravity and magnetic anomalies may be related to the structural fabrics derived from the convergence of the two terrains.
1 Introduction
As the most representative region of Phanerozoic crustal accretion and transformation, the Central Asian Orogenic Belt (CAOB) is an ideal laboratory to decipher continental growth, tectonics, and geodynamics (Xiao et al., 2003; Windley et al., 2007; Xiao et al., 2009; Xu et al., 2013; Han et al., 2017b). The CAOB extends from Kazakhstan in the west to eastern Siberia in the east, and is interpreted as the tectonic boundary between the Siberian plate in the north and the Tarim-North China Craton (NCC) in the south (Zonenshain, 1973; Zorin et al., 1993). As an accretionary collage of microcontinents, island arcs, seamounts, ophiolites, and accretionary wedges (Windley et al., 2007; Xu et al., 2013), it originated from the subduction, closure, convergence, and post-collisional extension of the Paleo-Asian Ocean (Şengör et al., 1993; Xiao et al., 2003) (Figure 1). The NCC is bounded to the south and covers the intersection zone of the Tethys, PAO, and Pacific Ocean tectonic domains, which are extensively destroyed by the Mesozoic subduction of the western Pacific slab (Gao et al., 2008).
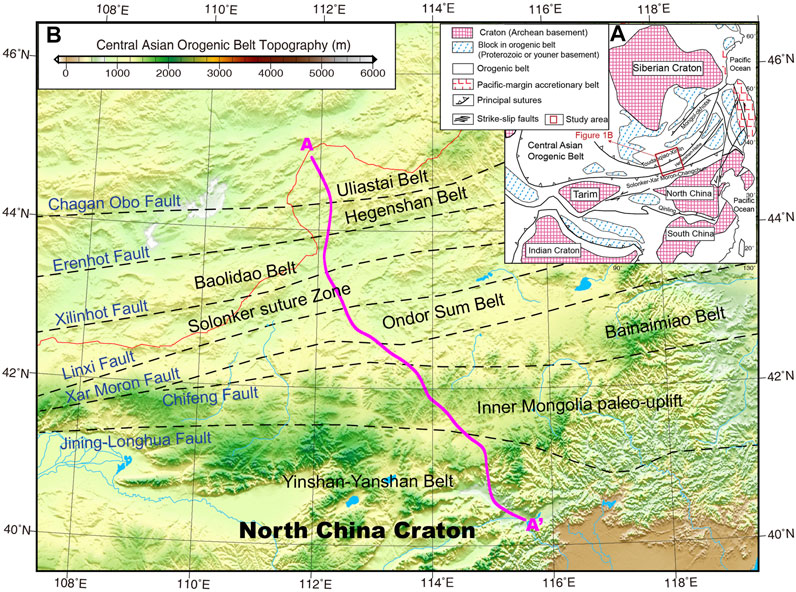
FIGURE 1. (A) Location map of the study area and sketch map of the tectonic framework, which is modified from Zhou and Wilde (2013), Zhou et al. (2014). (B) Topographic map of the eastern CAOB. The pink solid line from A to A′ is the deep seismic reflection profile location (Zhang et al., 2014), and the geological structure is modified from Xiao et al. (2003); Zhang et al. (2014).
As an ideal natural laboratory to decipher the tectonic evolution of the CAOB, there is still controversy regarding the tectonic origin of the geological transitional zone between the CAOB and NCC; therefore, various integrated geophysical profiles have been conducted to reveal its crustal lithospheric structure over the past few decades, including a deep seismic reflection profile (Zhang et al., 2014), a wide-angle reflection profile (Wen-Hui Li et al., 2014; Ying-Kang Li et al., 2014), a broadband seismic profile (Wei and Chen, 2012; Gong et al., 2016; Zhang et al., 2018), and a magnetotelluric sounding profile (Liang et al., 2015; Han et al., 2019). Moreover, owing to the long-lived and complex tectonic process, the closure mode and suturing location of the PAO are still debated (Tang, 1990; Chen et al., 2000; Jin Yi Li, 2006; Jian et al., 2008; Han et al., 2015; Han et al., 2017a; Zhou et al., 2018). As an effective tectonic interpretation approach, gravity and magnetic exploration are extensively conducted across northeast China to outline the fault and tectonic domains. Dominated by Izanagi-Pacific subduction, NE-NEE-striking tectonic lineaments are widely distributed across northeast China, and the Xar Moron fault is mostly interpreted as the northmost tectonic boundary between the NCC and northeast China terrain (Zhang et al., 2010; Sun, 2013; Suo et al., 2015). However, little attention has been given to the lithospheric gravity-magnetic structure of the transition zone between such blocks, which tectonically corresponds to the eastern portion of the CAOB. In this study, we use newly processed high-resolution magnetic-gravity data to image the deep structure of the eastern CAOB, which provides upgraded geophysical constraints for deciphering the tectonic origin and evolution of the northern margin of the NCC and the eastern part of the CAOB.
2 Regional Geological and Geophysical Settings
2.1 Geological Setting
Tectonically, the study area is located in the eastern part of the CAOB and crosses the northern margin of the NCC and the southern margin of the Siberian Craton. The Solonker suture in the northern part of the study area, named by Şengör et al. (1993), is an important structural component of the CAOB. It separates the CAOB into two coeval orogenic systems with different subduction polarities and these two orogenic belts close along the Solonker suture (Şengör et al., 1993; Şengör, 1996; Chen et al., 2000; Xiao et al., 2003; Jian et al., 2008; Xiao et al., 2009; Zhang et al., 2014). The northern orogenic belt is divided into three substructural units from north to south by the Chagan Obo fault and Erenhot fault, namely, the Uliastai belt, the Hegenshan belt, and the Baolidao belt. The southern orogenic belt is divided into the Ondor Sum belt and Bainaimiao belt by the Xar Moron fault (Xiao et al., 2003; Zhang et al., 2014). In the southern part of the study area, the Chifeng-Baiyan Obo fault is considered the boundary between the NCC and the CAOB (BGMRIM, 1991; Chen et al., 2000; Xiao et al., 2003; Zhang et al., 2014). The NCC is also divided into two substructural units by the Jining-Longhua fault (or Shangyi-Gubeikou-Pingquan fault), namely, the Inner Mongolia paleo-uplift and the Yinshan–Yanshan belt.
The NCC, which formed at 1.85 Ga (Zhao et al., 2011; Zhang et al., 2014), is one of the oldest Precambrian cratons in the world. It has an Archean to Paleoproterozoic basement and is covered by unmetamorphosed Mesoproterozoic to Cenozoic overlying strata (Zhao et al., 2011). The northern NCC basement rocks are largely exposed and are intruded by igneous rocks derived from multiple magmatic events (Zhang et al., 2014). The basement rocks are mainly in south of the Baiyan Obo-Chifeng fault in our study area. Li et al. (2019) suggested that the northern margin of the NCC was located from Baiyan Obo to northern Huade during the early Paleozoic, and migrated southward to the Guyang-Shangyi-Longhua fault during the late Paleozoic.
In the northern orogenic belt region, the Hegenshan belt has numerous outcrops of mafic-ultramafic complexes, which are usually interpreted as ophiolitic rocks (Nozaka and Liu, 2002; Xiao et al., 2003; Miao et al., 2008; Zhou et al., 2015; Pei et al., 2016). However, Jian et al. (2012) suggested that the mafic-ultramafic magmas all formed in the mantle and were emplaced at crustal levels during the extension period. In the western part of the belt, the Paleozoic strata were intruded by Permian and Mesozoic granites which were largely exposed and there was north-vergent thrusting and folding across the Erenhot fault (Zhang et al., 2014). The Baolidao belt is located between Sonid Zuoqi and Xilinhot, and its structure is dominated by a north-dipping thrust system (Xiao et al., 2003; Xu et al., 2013). It consists of variably deformed, metaluminous to weakly peraluminous, hornblende-bearing gabbroic diorite, quartz diorite, tonalite, and granodiorite (Chen et al., 2000).
The southern orogenic belt region reflects the Paleozoic growth of the NCC (Jian et al., 2008). The Bainaimiao arc is located between the Baiyan Obo fault and Xar Moron fault, and formed from the Mid-Ordovician to early Silurian. The formation of the Bainaimiao arc was derived from the subduction polarity flip in Inner Mongolia; and the arc is interpreted as an active continental margin formed by the mixture of mantle-derived and crustal rocks. The Ondor Sum belt to the north of the Bainaimiao arc contains remnants of multiple subduction-accretion complexes that range in age from the late Precambrian to the mid-Paleozoic. During tectonic processes and accretion, the original rocks were intensely shredded (Xiao et al., 2003).
2.2 Regional Physical Properties
Gravity and magnetic explorations are based on the density and magnetism differences in rocks and ores, which yield relative variations in anomalies on the observation surface. Therefore, it is necessary to understand the magnetic and density characteristics of rocks in this study area for the interpretation and inference of potential field anomalies (Xiong et al., 2016). By collecting data and measuring the physical properties of outcrop specimens, Jiang et al. (2006) and Sun (2013) reported that the rock densities in NE China were approximately
In our study area, the sedimentary strata have either no or weak magnetism (with a susceptibility less than
3 Data and Method
3.1 Aerial Magnetic and Ground Gravity Data
The gravity anomaly dataset, collected from the China Ministry of Natural Resources Regional Gravity Survey Technology Center, includes ground Bouguer gravity anomalies with a scale of 1:1,000,000, which is meshed with a gridding interval of
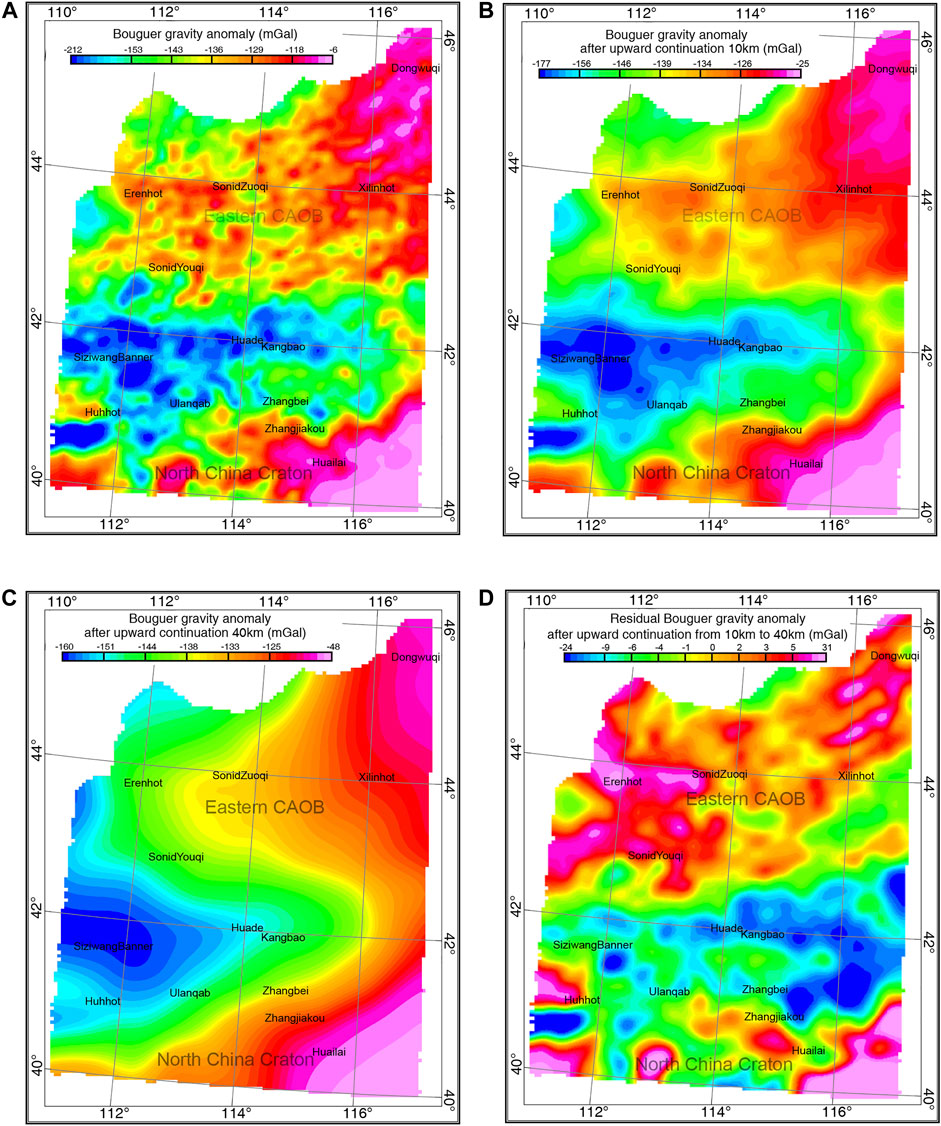
FIGURE 2. (A) Map of ground Bouguer gravity anomalies in this study. The warm red and cool blue colors depict gravity highs and lows, respectively. Map of gravity anomalies after an upward continuation of 10 km (B) and 40 km (C). (D) Map of the residual gravity anomaly after upward continuation from 10 to 40 km.
With the increase in the upward continuation height (Figures 2B,C), the gravity anomaly variation tends to be gentle, resulting from the high-frequency anomalies in the shallow crust being stripped off; however, the regional anomaly characteristics are in accordance with the features of the original gravity anomalies, indicating that the gravity anomalies in this region are mainly controlled by deep structures. As shown in the difference between the upward continuation of the 10 and 40 km anomalies (Figure 2D), after stripping off the anomalies in the shallow and lower crust, this difference can be approximately interpreted as a local gravity anomaly caused by the nonuniform distribution of the density of the mid-lower crust. It is obvious that there is a demarcation line of relative gravity highs and lows near latitudes
The magnetic anomaly dataset with a scale of 1:1,000,000 was collected from the China Aero Geophysical Survey and Remote Center for Natural Resources (AGRS) and was meshed with the gridding interval of
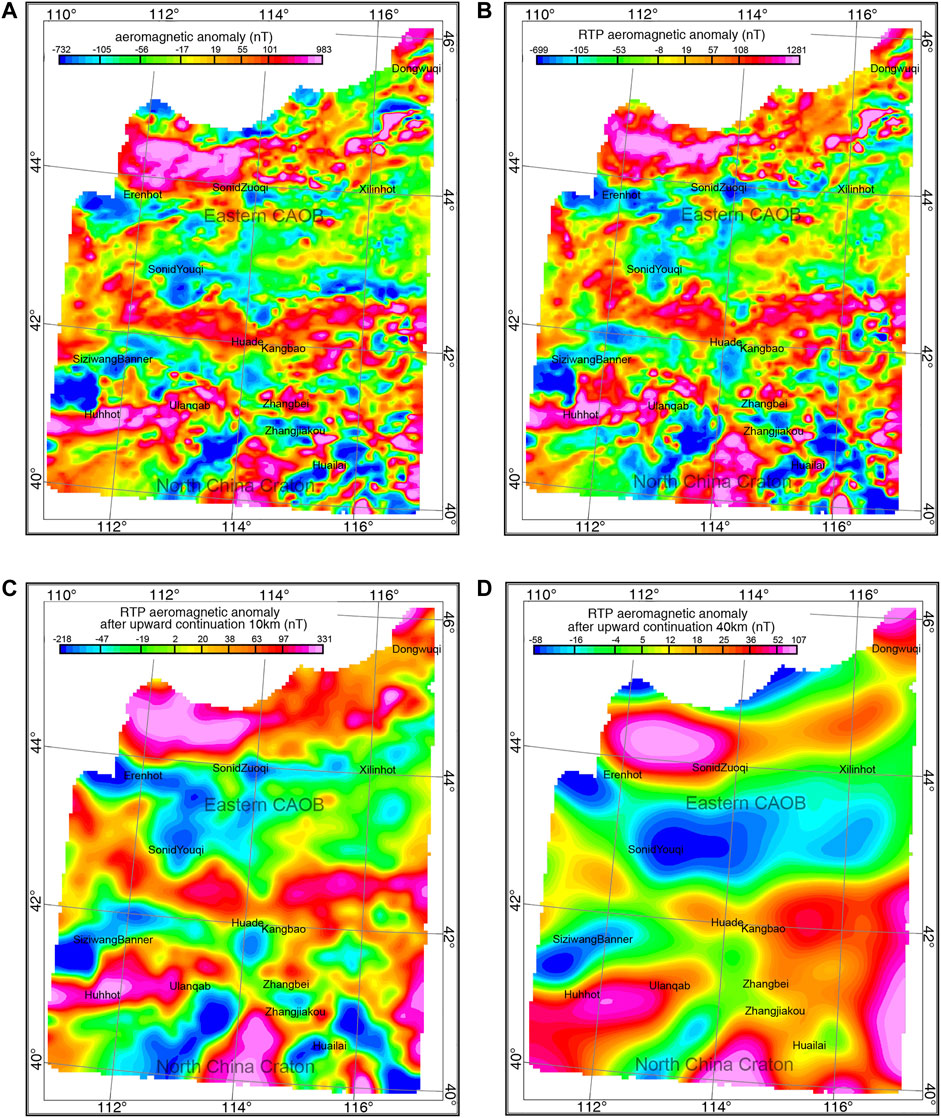
FIGURE 3. (A) Map of the aeromagnetic anomalies in this study. The warm red and cool blue colors depict magnetic highs and lows, respectively. (B) Aeromagnetic anomalies of reduction to the pole (RTP). Map of aeromagnetic anomalies after an upward continuation of 10 km (C) and 40 km (D).
The reduction to the pole (RTP) aeromagnetic anomaly contour (Figure 3B) shifts northward overall, reducing the influence of the oblique magnetization of the geomagnetic field. Moreover, the contour also shows obvious zoning characteristics. North of latitude
3.2 Aerial Magnetic and Ground Gravity Data Processing
3.2.1 Improved Potential Field Normalized Differential Method
Identification of boundaries in gravity and magnetic data is of great importance for potential field data processing and can fully develop the advantages of the high lateral resolution of potential field data and provide an important basis for regional geological structure inference and interpretation. Wang et al. (2013) proposed the potential field normalized differential edge detection method to improve the boundary recognition accuracy of potential field sources. The anomaly gradient belts of the second-order normalized differential method are in good accordance with the boundaries of the model bodies and the known fault structures via model testing and field data processing. Moreover, this processing approach with a smaller differential radius has a high resolution for structural boundary detection, while with a larger, it can effectively robust noise and identify large-scale geological structures.
It is assumed that the potential field anomaly
where,
We intercepted some gravity and magnetic anomaly data in this study area, adopted the improved second-order potential field normalized differential approach on the field dataset, and let
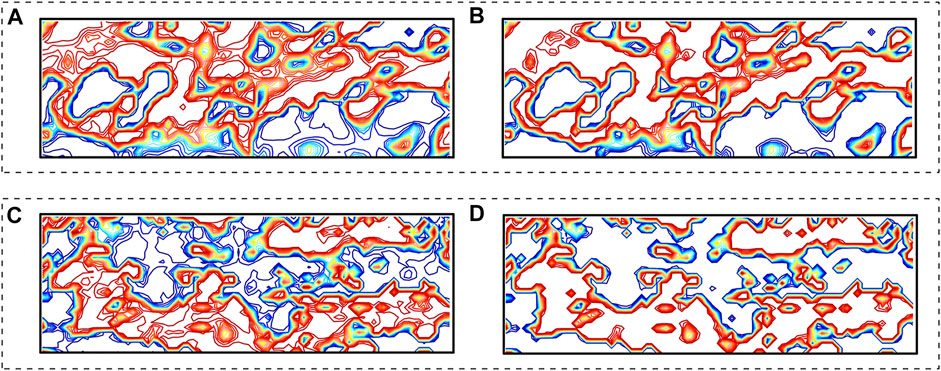
FIGURE 4. Comparison of the effects of the second-order potential field normalized differential method before (A) and after (B) improvement on the local Bouguer gravity anomaly in the study area. The warm red and cool blue lines depict highs and lows, respectively. Application effects of the method before (C) and after (D) improvement on the local magnetic anomaly.
3.2.2 Analytical Signal Amplitude Method
To obtain more abundant anomaly information and enhance the credibility of the interpretation results, we processed the gravity and magnetic anomaly data by the analytical signal amplitude (ASA) method (Nabighian, 1972; Nabighian, 1984; Roest et al., 1992). The three-dimensional ASA of the potential field data
The ASA method detects the edge of the geological body or structure by using the maxima position of the contours, which is suitable for the edge detection of gravity and magnetic anomaly data processing. This approach is independent of magnetization directions for two-dimensional anomalies (Nabighian, 1972; Li et al., 2006).
3.2.3 Correlation Analysis of Gravity and Magnetic Anomalies
The gravity and magnetic internal correspondence analysis (ICA) method based on Poisson’s theorem (Chandler, et al., 1981; Liu, 1985), using a moving window to calculate the correlation coefficient between the vertical first derivative of the gravity anomaly and the RTP magnetic anomaly, is a qualitative and semiquantitative research method for the inference and interpretation of potential field sources. Generally, the contour transition belts of the correlation coefficients correspond to the boundaries of geotectonic divisions, and the areas with gentle variation contours correspond to tectonic units. The area with a stable crustal structure usually presents a negative correlation of regional long-wavelength gravity and magnetic anomalies. The gravity lows and magnetic highs indicate crustal thickening and the deep burial depth of the Curie surface. In contrast, the gravity highs and magnetic lows manifest as crustal thinning and shallow burial depth of Curie surface. A positive correlation occurs when the crust contains low-speed, low-density, and low-resistivity bodies (or high-speed, high-density, and high-resistivity bodies). A gravity anomaly is irrelevant with a magnetic anomaly on the condition that they are derived from different potential field sources (Yin et al., 1999). In this study, the correlation coefficients of gravity and magnetic anomalies with different upward continuation heights of 5, 30, and 50 km are calculated to obtain the structural characteristics at the crustal scale in the study area.
4 Results
The improved potential field normalized differential edge detection method has a high resolution of lineament structure identification, while the ASA method locates the position of the potential field source effectively. Therefore, it is helpful to obtain reliable tectonic structure information by comprehensively analyzing the interpretation results of these two approaches. Figures 5A,B illustrate the edge detection results of the gravity anomaly, which show that the fault structures also have significant zoning and directional characteristics. The Jining-Longhua fault in the southern region, which acts as a dividing line, separates different types of lineament structures and different scales of anomaly sources. On the southern side, the Yinshan–Yanshan belt presents long-wavelength anomaly characteristics with no obvious direction and massive distribution where the Archean basement rocks are largely exposed. On the northern side, there is a series of bead-shaped anomalies that are nearly E-W-trending and distributed in the Inner Mongolia paleo-uplift (Figure 5A), which may be related to Permian granites with weak magnetism. The anomaly contours of these structures are divergent, indicating their relatively small scale and shallow burial depth. The part of the Chifeng-Huade deep major fault in this region is the middle segment and its influence depth reaches only into the basement, which is a property of a major fault (BGMRIM, 1991). Therefore, in the processing results of the two methods, the location of the Chifeng fault in the literature (Xiao et al., 2003) is not clear. In general, there are similar anomaly characteristics of the Bainaiiao arc and the Inner Mongolia paleo-uplift, which is situated between the Jining-Longhua fault and the Xar Moron fault. In the northern region, the lineament structures of the Eren Basin have a significant NE-trending distribution, which is controlled by deep tectonic structures in the NE direction. Due to the large range of basalts exposed between Sonid Zuoqi and Xilinhot, the continuity of the faults in this region is destroyed, but the overall tracking and identification results for the Xar Moron fault, Xilinhot fault, and Erenhot fault are effectual.
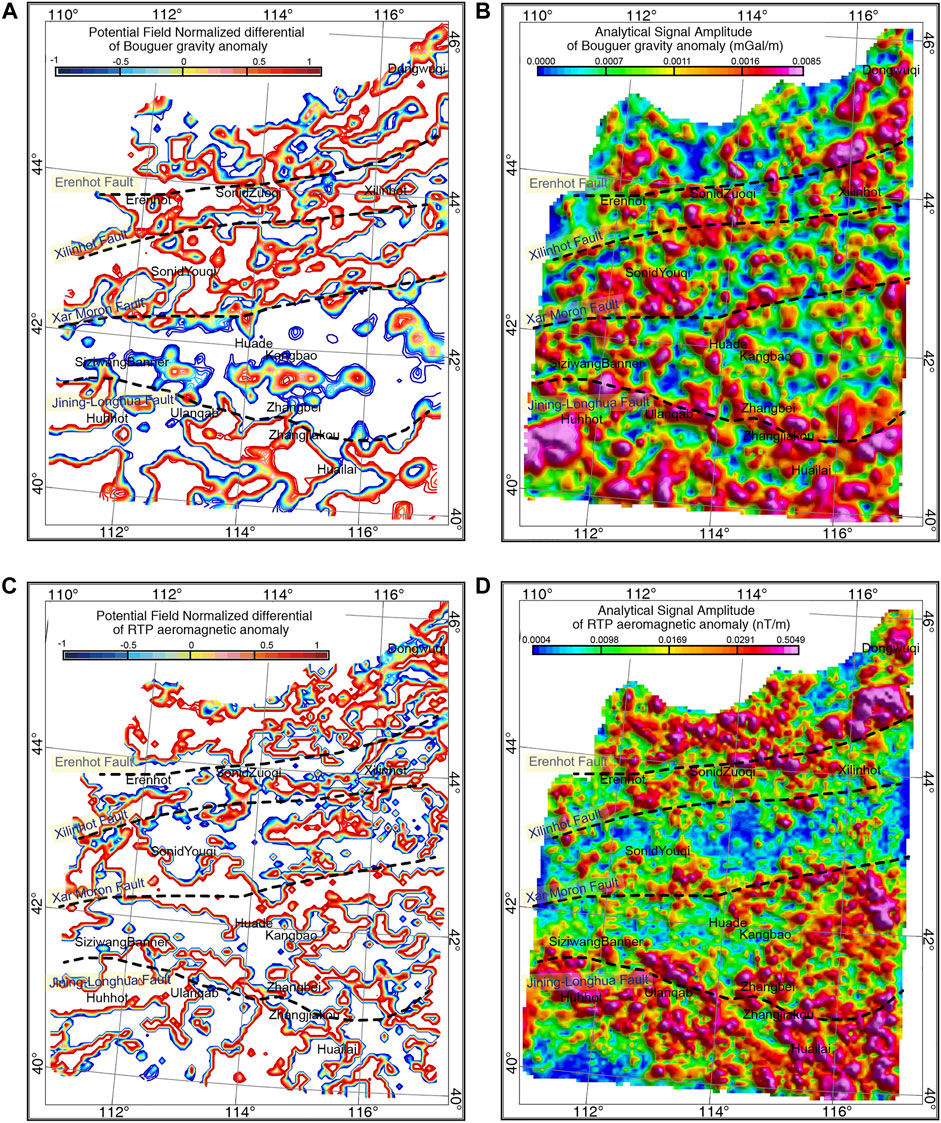
FIGURE 5. Processing results of the Bouguer gravity anomaly (A) and RTP aeromagnetic anomaly (C) via the improved potential field normalized differential method (with a differential radius of 30 km). The warm red and cool blue colors indicate the highs and lows, respectively. Processing results of the Bouguer gravity anomaly (B) and RTP aeromagnetic anomaly (D) via the ASA method. The black dashed lines are the faults in this area.
In the edge detection results of the magnetic anomaly (Figures 5C,D), there is also an anomaly zoning feature similar to the gravity anomaly. A large range of magnetic highs are distributed south of the Jining-Longhua fault without obvious directions, caused by the large amount of exposed Archean basement rocks. In contrast, there are short-wavelength anomalies situated in the eastern part of the Bainaimiao arc and the Inner Mongolia paleo-uplift. In the central part, a magnetic high belt is located near the Xar Moron fault and Chifeng fault and is approximately 35 km in width. From west to east, the trend of this belt changes from NWW to NEE, which may be related to the exposed granodiorite, and igneous rock, etc. In the Eren Basin, it is partly covered by a desert in which a large number of magnetic lows are distributed. In Figure 5D, there is almost no obvious anomaly information in the Eren Basin, while in Figure 5C a series of small-scale NE-trending anomalies appear in the Baolidao belt and Solonker belt. The Hegenshan complex belt between the Erenhot fault and Chagan Obo fault shows a large range of magnetic highs, which may be caused by the complex rock composition in this region and the exposed ophiolite (Miao et al., 2008; Zhou et al., 2015; Pei et al., 2016).
Figure 6 is the correlation coefficient between the Bouguer gravity anomaly and the RTP magnetic anomaly with upward continuation heights of 5, 30, and 50 km, of which the calculation window width is
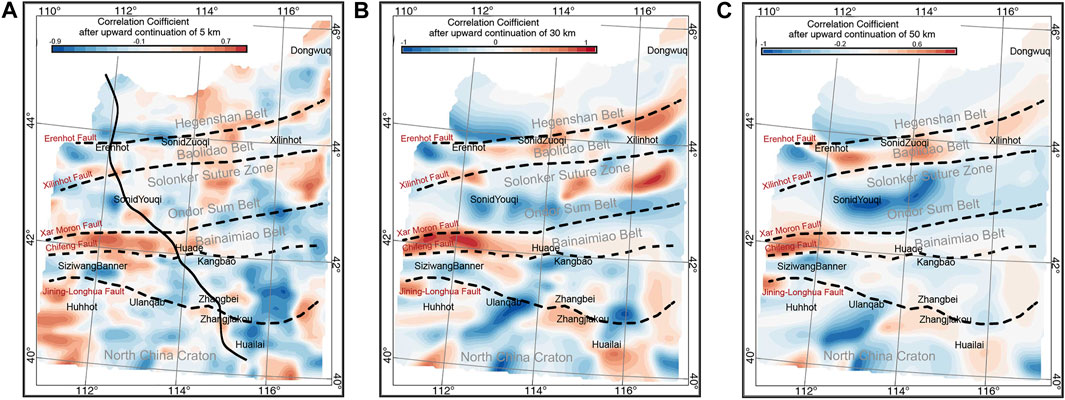
FIGURE 6. Contour maps of the ICA correlation coefficient of gravity and RTP magnetic anomalies with upward continuation heights of (A) 5 km, (B) 30 km, and (C) 50 km. The black solid line is the deep seismic reflection profile position of the SinoProbe project (Zhang et al., 2014). Warm red and cool blue indicate correlation highs and lows, respectively. The black dashed lines are the faults in this area.
5 Interpretation
To conduct a comprehensive interpretation of the potential field anomaly of the profile, we analyzed the results of the deep seismic reflection and the magnetotelluric sounding explorations of the same survey line. Figure 7A illustrates the correlation coefficient of the gravity and RTP magnetic anomalies along the profile with different upward continuation heights. The correlation coefficient curves of the Uliastai belt, Bainaimiao arc, Inner Mongolia paleo-uplift, and Yinshan–Yanshan belt are relatively simple, showing the same variation in the anomaly curves at different depths. In the CAOB region between the Chagan Obo fault and Xar Moron fault, the curve changes substantially, indicating that this area has complex rock compositions and has experienced multistage tectonic evolution processes.
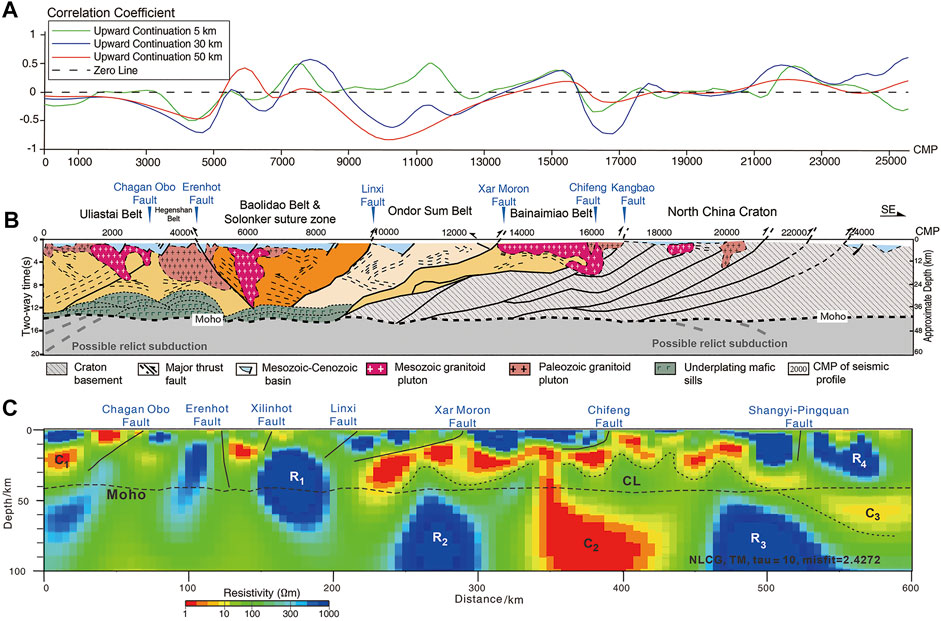
FIGURE 7. (A) Profile of the ICA correlation coefficients of gravity and the RTP magnetic anomalies along the deep seismic reflection profile, with different upward continuation heights of 5 km (green line), 30 km (blue line), and 50 km (red line). The black dashed line is the zero line. (B) Major crustal structures revealed from the SinoProbe deep seismic reflection profile (Zhang et al., 2014). (C) Interpretation of the electrical structural model of the same profile (Liang et al., 2015). The numbers along the horizontal axis in maps (A) and (B) are CMPs, and those in map (C) are distances.
There is a correlation coefficient curve mutation belt near CMP15500 that is interpreted as the position of the Chifeng fault, which is not exposed in the seismic profile and is characterized as the gradient belt of the high- and low-resistivity bodies in the magnetotelluric sounding results (Figures 7B,C). In the shallow crust, the anomaly features north of the Chifeng fault are similar to those in the southern margin of the CAOB and the anomaly characteristics south of the Chifeng fault are similar to those in the northern margin of the NCC. In the CAOB range, there are three regions with anomalous features of concave negative correlations, namely, the Erenhot fault, the Ondor Sum belt, and the area between the Chifeng fault, and Kangbao ductile shear zone. The negative correlations of gravity highs and magnetic lows in these three regions are all interpreted as high conductors in the electrical structure profile. Moreover, the correlation of the shallow crust in the Ondor Sum belt between the Xar Moron fault and the northern area of the Linxi fault is opposite to that of the mid-lower crust, indicating that there is a vertical crustal layered structure at the crustal scale of the Ondor Sum belt. There are two local convex positive correlation regions of gravity and magnetic highs along the profile corresponding to the Solonker suture zone and the Bainaimiao belt; and both have electrical features of high resistivity.
6 Discussion
The gravity and magnetic anomalies in this study area have obvious zoning and directional features. The anomaly morphology is dominated by deep structures and the anomalies have crustal-scale anomaly characteristics. The northern margin of the NCC and the southern margin of the CAOB have different gravity and magnetic anomaly features and the Bainaimiao belt is an important boundary region of different anomalies. In the northern part of this belt, the anomalies are mainly NE and NEE-trending distributions, which may be related to the NW directed compression caused by the subduction of the Pacific plate (Tu et al., 2006). In the south, the anomalies are nearly EW-trending or have no fixed directional distribution, which may be related to the northern margin of the NCC experiencing intensive tectonic deformation, magmatic and volcanic activities, and synorogenic sedimentation during the Yanshanian tectonic movement (Song, 1999). The Chifeng-Baiyan Obo fault in the shallow crust is the boundary between different potential field anomaly features and it is also the transition belt of the gravity and magnetic correlation coefficient contours. The fault developed significantly in the mid-late Proterozoic and Paleozoic and the tectonic activity was strong. The influence depth of this fault segment reached only the basement (BGMRIM, 1991). The upper crustal Chifeng-Baiyan Obo fault is the tectonic boundary, which is consistent with the crustal velocity structure revealed by the seismic wide-angle reflection profile (Wen-Hui Li et al., 2014), the deep electrical structure revealed by magnetotelluric sounding (Liang et al., 2015), and the tectonic boundary obtained by the distribution of Archean-early Proterozoic rocks (Xiao et al., 2003). In the mid-lower crust, there are some differences in the features of gravity and magnetic anomalies between the north and south sides of the Xar Moron fault and it is also the transition belt of the correlation coefficient contours. The gravity and magnetic anomaly features in the eastern part of the Bainaimiao arc in the mid-lower crust are different from those in the CAOB but are more similar to those along the southern margin of the NCC. Moreover, the residual gravity anomaly of the middle-lower crust (Figure 2D) and the magnetic anomaly upward continuation results (Figures 3C,D) show that the anomaly characteristics south of the Xar Moron fault are similar to those of the northern margin of the NCC. Therefore, we infer that the northern margin of the NCC may extend northward to the Xar Moron fault in the deep crust, which is comparable with the deep seismic reflection profile results (Zhang et al., 2014).
The gravity and magnetic anomaly features of the Mesozoic granitoid pluton outcrops exposed in the Bainaimiao belt are characterized by regional positive correlations and show gravity and magnetic highs, corresponding to the large scale of high-resistivity bodies on the surface in the electrical structure profile of the same survey line (Liang et al., 2015). There are also massive high-resistivity bodies in the middle-lower crust of the Solonker suture belt (Liang et al., 2015), and its gravity and magnetic correlation also show a positive correlation between gravity and magnetic highs. Therefore, we speculate that the strong positive correlation of the gravity and magnetic anomalies in the middle-lower crust of the Solonker suture belt is caused by the concealed large-range Mesozoic granitoid pluton.
The gravity and magnetic anomaly correlation in the upper crust and deep crust of the Ondor Sum complex belt has opposite positive and negative properties and opposite trends, indicating that there is an anomalous stratified structure between the upper crust and the deep crust. The result of the first arrival tomographic imaging of the upper crust and the whole crustal velocity structure along the same survey line show that the velocity of the upper-middle crust changes substantially and the overall velocity of the middle-lower crust is low (Wen-Hui Li et al., 2014), indicating that there is also a stratified feature of the velocity structure. The influence range of this feature is from the Xar Moron fault to the northern Linxi fault, which is consistent with the structure revealed by the deep seismic reflection profile, in which the middle-lower crust of the Ondor Sum complex belt is inserted northward under the Solonker suture belt. The magnetotelluric sounding results show that there is a high conductivity layer in the middle-lower crust (Liang et al., 2015), and there are crocodile reflections in the middle crust of the Ondor Sum belt in the deep seismic reflection profile, indicating that crustal shortening exists in this area (Zhang et al., 2014). Therefore, we infer that the negative correlation anomalies caused by gravity highs and magnetic lows in the middle and lower crust of the Ondor Sum belt may be related to the compressional structure caused by plate convergence. The Ondor Sum complex belt is mainly composed of ophiolites, accretionary complexes, and high-pressure metamorphic rock belts, which contain multiple remnants of subduction accretionary complexes. The complex belt has experienced a complex tectonic evolution process of accretion, convergence, and extension since the early Paleozoic (Xiao et al., 2003), which causes this region to have complex material compositions and structural characteristics.
The Erenhot fault and the reflection structures near it are approximately parallel to each other, forming a south-dipping thrust structure. There are also high conductors in the middle-lower crust in this area (Liang et al., 2015). The local concave feature of the correlation curve is characterized by gravity highs and magnetic lows, which may be caused by the rocks in the fracture zone accompanying the fracture. The correlation curve between the Chifeng fault and Kangbao ductile shear zone is also negatively correlated with the local concave feature, which shows gravity highs and magnetic lows. The high conductor in the lower crust also has a certain scale, and the strong reflective boundaries in the deep seismic reflection profile are characterized by concave compression in this region. These physical and structural features reflect the structural characteristics generated by the convergence of the northern margin of the NCC and the southern margin of the CAOB.
7 Conclusion
Using the potential field processing of the conventional method and the improved method for the magnetic-gravity anomaly, we obtained the features of the gravity and magnetic anomalies at different scales, lineament structure characteristics, and gravity and magnetic correlation coefficients at the crustal scale in the northern margin of the NCC and the southern margin of the CAOB, and compared and analyzed the key crust-scale structures previously revealed by the deep seismic reflection profile. The gravity and magnetic anomalies across the eastern CAOB have obvious zoning and directional features. The gravity and magnetic anomalies in the southern margin of the CAOB are mainly oriented to the northeast, while the gravity and magnetic anomalies in the northern margin of the NCC are mainly east–west-striking or without fixed directions. The gravity-magnetic correlation analysis shows that the anomalous curve of the CAOB is more intense than that of the northern margin of the NCC, which indicates that the CAOB has experienced a complex tectonic evolution process. The geophysical lineaments are revealed by using the improved potential field normalized differential method, which effectively improves the detection accuracy, and depiction ability of the potential field boundary. It is inferred that the Chifeng-Baiyan Obo fault in the upper-middle crust is an important tectonic boundary between the CAOB and the NCC, and the boundary in the middle-lower crust may skew northward to the Xar Moron fault region. The local uplift and concavity of the correlation curve corresponds well to the location of the granitoid pluton distributed along the profile. Speculatively, there may be a large unexposed Mesozoic granitoid pluton distributed in the middle-lower crust of the Solonker suture belt. The negative correlation of the gravity and magnetic anomalies may be related to the tectonic fabrics derived from the N-S convergence of the CAOB and NCC.
Data Availability Statement
The raw data supporting the conclusion of this article will be made available by the authors, without undue reservation.
Author Contributions
CC performed the data processing and analyses and wrote the article. HW contributed significantly to geological analysis. HG and SH helped to modified the manuscript. YW helped to process the data. RG oversaw this study.
Funding
This study is financially supported by the National Natural Science Foundation of China (42074115 and 41574094) and National Key Research and Development Program of China (2017YFC0601301).
Conflict of Interest
The authors declare that the research was conducted in the absence of any commercial or financial relationships that could be construed as a potential conflict of interest.
Publisher’s Note
All claims expressed in this article are solely those of the authors and do not necessarily represent those of their affiliated organizations, or those of the publisher, the editors and the reviewers. Any product that may be evaluated in this article, or claim that may be made by its manufacturer, is not guaranteed or endorsed by the publisher.
Acknowledgments
We greatly thank Xi Xu of AGRS for his inspiration and suggestions for this study. We appreciate the valuable comments of the reviewers, which improved this work.
References
Arkani‐Hamed, J. (1988). Differential Reduction‐to‐the‐pole of Regional Magnetic Anomalies. Geophysics 53 (12), 1592–1600. doi:10.1190/1.1442441
BGMRIM (1991). Regional Geology of Nei Mongol (Inner Mongolia) Autonomous Region. (in Chinese). Beijing: Geological Publishing House.
Chandler, V. W., Koski, J. S., Hinze, W. J., and Braile, L. W. (1981). Analysis of Multisource Gravity and Magnetic Anomaly Data Sets by Moving‐window Application of Poisson's Theorem. Geophysics 46 (1), 30–39. doi:10.1190/1.1441136
Chen, B., Jahn, B., Wilde, S., and Xu, B. (2000). Two Contrasting Paleozoic Magmatic Belts in Northern Inner Mongolia, China: Petrogenesis and Tectonic Implications. Tectonophysics 328 (1-2), 157–182. doi:10.1016/s0040-1951(00)00182-7
Gao, S., Rudnick, R. L., Xu, W.-L., Yuan, H.-L., Liu, Y.-S., Walker, R. J., et al. (2008). Recycling Deep Cratonic Lithosphere and Generation of Intraplate Magmatism in the North China Craton. Earth Planet. Sci. Lett. 270 (1-2), 41–53. doi:10.1016/j.epsl.2008.03.008
Gong, C., Li, Q. S., Ye, Z., Zhang, H. S., Li, W. H., He, C. S., et al. (2016). Crustal Thickness and Poisson Ratio beneath the Huailai-Bayinonder Profile Derived from Teleseismic Receiver Functions. Chin. J. Geophys. 59 (3), 897–911. (in Chinese with English abstract). doi:10.6038/cjg20160312
Guo, H. Y., and Yang, C. B. (2018). Characteristics of Aeromagnetic Anomalies in Igneous Rocks in Northeast China. Glob. Geology. 37 (1), 243–249. (in Chinese with English abstract). doi:10.3969/j.issn.1004-5589.2018.01.022
Han, J., Zhou, J.-B., Wang, B., and Cao, J.-L. (2015). The Final Collision of the CAOB: Constraint from the Zircon U-Pb Dating of the Linxi Formation, Inner Mongolia. Geosci. Front. 6 (2), 211–225. doi:10.1016/j.gsf.2014.06.003
Han, J., Zhou, J.-B., Wilde, S. A., and Song, M.-C. (2017a). Provenance Analysis of the Late Paleozoic Sedimentary Rocks in the Xilinhot Terrane, NE China, and Their Tectonic Implications. J. Asian Earth Sci. 144, 69–81. doi:10.1016/j.jseaes.2016.12.003
Han, J., Zhou, J.-B., Li, L., and Song, M.-C. (2017b). Mesoproterozoic (∼1.4 Ga) A-type Gneissic Granites in the Xilinhot Terrane, NE China: First Evidence for the Break-Up of Columbia in the Eastern CAOB. Precambrian Res. 296, 20–38. doi:10.1016/j.precamres.2017.04.043
Han, J. T., Yuan, T. M., Liu, W. Y., Liu, L. J., Liu, G. X., Hou, H. S., et al. (2019). Geoelectric Structure of the Collision Zone between the Siberia Plate and the North China Craton and Discussion on the Deep Suture Boundary. Chin. J. Geophys. 62 (3), 1159–1171. (in Chinese with English abstract). doi:10.6038/cjg2019M0052
Jian, P., Liu, D., Kröner, A., Windley, B. F., Shi, Y., Zhang, F., et al. (2008). Time Scale of an Early to Mid-paleozoic Orogenic Cycle of the Long-Lived Central Asian Orogenic Belt, Inner Mongolia of China: Implications for continental Growth. Lithos 101 (3-4), 233–259. doi:10.1016/j.lithos.2007.07.005
Jian, P., Kröner, A., Windley, B. F., Shi, Y., Zhang, W., Zhang, L., et al. (2012). Carboniferous and Cretaceous Mafic-Ultramafic Massifs in Inner Mongolia (China): A SHRIMP Zircon and Geochemical Study of the Previously Presumed Integral "Hegenshan Ophiolite". Lithos 142-143, 48–66. doi:10.1016/j.lithos.2012.03.007
Jiang, W. W., Zhou, L. H., Xiao, D. Q., Gao, J. R., Yuan, S. Q., Tu, G. H., et al. (2006). The Characteristics of Crust Structure and the Gravity and Magnetic fields in Northeast Region of China. Prog. Geophys. 21 (3), 730–738. (in Chinese with English abstract). doi:10.3969/j.issn.1004-2903.2006.03.008
Li, J.-Y. (2006). Permian Geodynamic Setting of Northeast China and Adjacent Regions: Closure of the Paleo-Asian Ocean and Subduction of the Paleo-Pacific Plate. J. Asian Earth Sci. 26 (3-4), 207–224. doi:10.1016/j.jseaes.2005.09.001
Li, J.-Y., Liu, J. F., JianFeng, L., JunFeng, Q., RongGuo, Z., Shuo, Z., et al. (2019). Major Geological Features and Crustal Tectonic Framework of Northeast China. Acta Petrol. Sin. 35 (10), 2989–3016. (in Chinese with English abstract). doi:10.18654/1000-0569/2019.10.04
Li, W. H., Gao, R., Keller, R., Li, Q. S., Hou, H. S., Li, Y. K., et al. (2014). Crustal Structure of the Southern Margin of north China Craton from Huailai to Sonid Youqi Profile. Chines J. Geophys. 57 (2), 472–483. (in Chinese with English abstract). doi:10.6038/cjg20140213
Li, X. (2006). Understanding 3D Analytic Signal Amplitude. Geophysics 71 (2), L13–L16. doi:10.1190/1.2184367
Li, Y. K., Gao, R., Yao, Y. T., Mi, S. X., Li, W. H., Xiong, X. S., et al. (2014). Crustal Velocity Structure from the Northern Margin of the North China Craton to the Southern Margin of the Siberian Plate. Chin. J. Geophys. 57 (2), 484–497. (in Chinese with English abstract). doi:10.6038/cjg20140214
Liang, H. D., Gao, R., Hou, H. S., Li, W. H., Han, J. T., Liu, G. X., et al. (2015). Post-collisional Extend Record at Crustal Scale: Revealed by the Deep Electrical Structure from the Southern Margin of the central Asian Orogenic belt to the Northern Margin of the North China Craton. Chin. J. Geol. 50 (2), 643–652. (in Chinese with English abstract). doi:10.3969/j.issn.0563-5020.2015.02.019
Liu, X. Z. (1985). Correspondence Analysis of Gravity and Magnetic Anomaly - Introduction of Studying Gravity and Magnetic Anomaly in America. Foreign Geoexplor. Techn. 03, 3–10. (in Chinese).
Miao, L., Fan, W., Liu, D., Zhang, F., Shi, Y., and Guo, F. (2008). Geochronology and Geochemistry of the Hegenshan Ophiolitic Complex: Implications for Late-Stage Tectonic Evolution of the Inner Mongolia-Daxinganling Orogenic Belt, China. J. Asian Earth Sci. 32 (5-6), 348–370. doi:10.1016/j.jseaes.2007.11.005
Nabighian, M. N. (1972). The Analytical Signal of Two-Dimensional Magnetic Bodies with Polygonal Cross-Section, its Properties and Use for Automated Interpretation. Geophysics 37, 780–786. doi:10.1190/1.1440276
Nabighian, M. N. (1984). Toward a Three-Dimensional Automatic Interpretation of Potential Field Data via Generalized Hilbert Transforms: Fundamental Relations. Geophysics 49 (6), 44–48. doi:10.1190/1.144170610.1190/1.1441706
Nozaka, T., and Liu, Y. (2002). Petrology of the Hegenshan Ophiolite and its Implication for the Tectonic Evolution of Northern China. Earth Planet. Sci. Lett. 202 (1), 89–104. doi:10.1016/s0012-821x(02)00774-4
Pei, S.-H., Zhou, J.-B., and Li, L. (2016). U-pb Ages of Detrital Zircon of the Paleozoic Sedimentary Rocks: New Constraints on the Emplacement Time of the Hegenshan Ophiolite, NE China. J. Asian Earth Sci. 130 (1), 75–87. doi:10.1016/j.jseaes.2016.05.022
Roest, W. R., Verhoef, J., and Pilkington, M. (1992). Magnetic Interpretation Using the 3-D Analytic Signal. Geophysics 57 (1), 116–125. doi:10.1190/1.1443174
Şengör, A. M. C., Natal'in, B. A., and Burtman, V. S. (1993). Evolution of the Altaid Tectonic Collage and Palaeozoic Crustal Growth in Eurasia. Nature 364 (6435), 299–307. doi:10.1038/364299a0
Şengör, A. M. C. (1996). “Paleotectonics of Asia: Fragments of a Synthesis,” in Tectonic Evolution of Asia. Editors A. Yin, and T. M. Harrison, 486–640. New York: Cambridge Univ. Press
Song, H. L. (1999). Characteristics of Yanshan Type Intraplate Orogenic Belts and A Discussion on its Dynamics. Earth Sci. Front. 6 (4), 8. (in Chinese with English abstract).
Sun, B. (2013). A Study of Gravity-Magnetic Features and Deep Tectonics of the NE China basin Groups. Nanjing: The Nanjing University. (in Chinese with English abstract).
Suo, K., Zhang, G. B., Jiang, G. M., and Xu, Y. (2015). 3-D Density Distribution of the Crust and Upper Mantle beneath Northeast China by Joint Inversion of Gravity and Seismic Data. Chin. J. Geophys 58 (7), 2436–2444. (in Chinese with English abstract). doi:10.6038/cjg20150720
Tang, K. (1990). Tectonic Development of Paleozoic Foldbelts at the north Margin of the Sino-Korean Craton. Tectonics 9 (2), 249–260. doi:10.1029/tc009i002p00249
Tong, Y., Hong, D. W., Wang, T., Shi, X. J., Zhang, J. J., and Zeng, T. (2010). Spatial and Temporal Distribution of Granitoids in the Middle Segment of the Sino-Mongolian Border and its Tectonic and Metallogenic Implications. Acta Geosci. Sin. 31 (3), 395–412. (in Chinese with English abstract). doi:10.3975/cagsb.2010.03.13
Tu, G. H., Jiang, W. W., Zhu, D. Y., Zhou, L. H., Xiao, D. Q., Gao, J. R., et al. (2006). The Relationships between the Characteristics of Northeast China Residual Gravity and Magnetic Anomalies and Geological Tectonic and Metallogenic belt. Prog. Geophys. 21 (3), 746–755. (in Chinese with English abstract). doi:10.3969/j.issn.1004-2903.2006.03.010
Wang, Y. G., Zhang, F. X., Wang, Z. W., Meng, L. S., and Zhang, J. (2013). Edge Detection of Potential Field Using Normalized Differential. J. Jilin Univ. (Earth Sci. Edition) 43 (2), 592–602. (in Chinese with English abstract). doi:10.13278/j.cnki.jjuese.2013.02.011
Wei, Z. G., and Chen, L. (2012). Regional Differences in Crustal Structure beneath Northeastern China and Northern North China Craton:constrains from Crustal Thickness and Vp/Vs Ratio. Chin. J. Geophys. 55 (11), 3601–3614. (in Chinese with English abstract). doi:10.6038/j.issn.0001-5733.2012.11.009
Windley, B. F., Alexeiev, D., Xiao, W., Kröner, A., and Badarch, G. (2007). Tectonic Models for Accretion of the Central Asian Orogenic Belt. J. Geol. Soc. 164 (1), 31–47. doi:10.1144/0016-76492006-022
Xiao, W., Windley, B. F., Hao, J., and Zhai, M. (2003). Accretion Leading to Collision and the Permian Solonker Suture, Inner Mongolia, China: Termination of the central Asian Orogenic belt. Tectonics 22 (6), 1–8. doi:10.1029/2002TC001484
Xiao, W., Kröner, A., and Windley, B. (2009). Geodynamic Evolution of Central Asia in the Paleozoic and Mesozoic. Int. J. Earth Sci. (Geol. Rundsch) 98, 1185–1188. doi:10.1007/s00531-009-0418-4
Xiong, S., Yang, H., Ding, Y., Li, Z., and Li, W. (2016). Distribution of Igneous Rocks in China Revealed by Aeromagnetic Data. J. Asian Earth Sci. 129, 231–242. doi:10.1016/j.jseaes.2016.08.016
Xu, B., Charvet, J., Chen, Y., Zhao, P., and Shi, G. (2013). Middle Paleozoic Convergent Orogenic Belts in Western Inner Mongolia (China): Framework, Kinematics, Geochronology and Implications for Tectonic Evolution of the Central Asian Orogenic Belt. Gondwana Res. 23 (4), 1342–1364. doi:10.1016/j.gr.2012.05.015
Yin, X. H., Li, Y. S., and Liu, Z. P. (1999). Internal Correspondence Analysis of Gravimetric and Magnetic Data for the Northern Part of South-North Tectonic Zone. Seismol. Geol. 21 (4), 370–376. (in Chinese with English abstract).
Zhang, F. X., Zhang, X. Z., Zhang, F. Q., Meng, L. S., and Xue, J. (2010). Study of Gravity Field in Northeastern China Area: Classification of Main Structure Lines and Tectonic Units Using the Improved Three-Directional Small Subdomain Filtering. Chin. J. Geophys 56 (6), 1475–1485. (in Chinese with English abstract). doi:10.3969/j.issn.0001-5733.2010.06.025
Zhang, S., Gao, R., Li, H., Hou, H., Wu, H., Li, Q., et al. (2014). Crustal Structures Revealed from a Deep Seismic Reflection Profile across the Solonker Suture Zone of the Central Asian Orogenic Belt, Northern China: An Integrated Interpretation. Tectonophysics 612-613, 26–39. doi:10.1016/j.tecto.2013.11.035
Zhang, H., Li, Q., Ye, Z., Gong, C., and Wang, X. (2018). New Seismic Evidence for Continental Collision during the Assembly of the Central Asian Orogenic Belt. J. Geophys. Res. Solid Earth 123 (8), 6687–6702. doi:10.1029/2017JB015061
Zhao, G., Li, S., Sun, M., and Wilde, S. A. (2011). Assembly, Accretion, and Break-Up of the Palaeo-Mesoproterozoic Columbia Supercontinent: Record in the North China Craton Revisited. Int. Geol. Rev. 53 (11-12), 1331–1356. doi:10.1080/00206814.2010.527631
Zhou, J.-B., and Wilde, S. A. (2013). The Crustal Accretion History and Tectonic Evolution of the NE China Segment of the Central Asian Orogenic Belt. Gondwana Res. 23 (4), 1365–1377. doi:10.1016/j.gr.2012.05.012
Zhou, J.-B., Cao, J.-L., Wilde, S. A., Zhao, G.-C., Zhang, J.-J., and Wang, B. (2014). Paleo-Pacific Subduction-Accretion: Evidence from Geochemical and U-Pb Zircon Dating of the Nadanhada Accretionary Complex, NE China. Tectonics 33 (12), 2444–2466. doi:10.1002/2014TC003637
Zhou, J.-B., Han, J., Zhao, G.-C., Zhang, X.-Z., Cao, J.-L., Wang, B., et al. (2015). The Emplacement Time of the Hegenshan Ophiolite: Constraints from the Unconformably Overlying Paleozoic Strata. Tectonophysics 662, 398–415. doi:10.1016/j.tecto.2015.03.008
Zhou, J.-B., Wilde, S. A., Zhao, G.-C., and Han, J. (2018). Nature and Assembly of Microcontinental Blocks within the Paleo-Asian Ocean. Earth Sci. Rev. 186, 76–93. doi:10.1016/j.earscirev.2017.01.012
Zonenshain, L. P. (1973). The Evolution of Central Asiatic Geosynclines through Sea-Floor Spreading. Tectonophysics 19 (3), 213–232. doi:10.1016/0040-1951(73)90020-6
Keywords: Central Asian Orogenic Belt, potential field data, tectonic boundary, deep structure, correlation coefficient
Citation: Chang C, Wang H, Gao R, Guo H, Han S and Wu Y (2022) Deep Crustal Structure of the Eastern Central Asian Orogenic Belt Revealed by Integrated Magnetic-Gravity Imaging. Front. Earth Sci. 10:843499. doi: 10.3389/feart.2022.843499
Received: 26 December 2021; Accepted: 31 January 2022;
Published: 24 March 2022.
Edited by:
Xiubin Lin, Zhejiang University, ChinaCopyright © 2022 Chang, Wang, Gao, Guo, Han and Wu. This is an open-access article distributed under the terms of the Creative Commons Attribution License (CC BY). The use, distribution or reproduction in other forums is permitted, provided the original author(s) and the copyright owner(s) are credited and that the original publication in this journal is cited, in accordance with accepted academic practice. No use, distribution or reproduction is permitted which does not comply with these terms.
*Correspondence: Rui Gao, cnVpZ2FvMTI2QDEyNi5jb20=; Haiyan Wang, aHlhbndoeUAxMjYuY29t