 Yao-Ping Wang
 Xin Zhan
 Xun Zhou
 Yuan Gao
 Sibo Wang
 Jia Xia
 Zhiguang Song
- 1Faculty of Chemistry and Environmental Science, Guangdong Ocean University, Zhanjiang, China
- 2Shenzhen Research Institute of Guangdong Ocean University, Shenzhen, China
- 3CNOOC International Limited, Beijing, China
Chemometrics has been widely used to cope with the problems of oil-oil and oil-source correlations because of its unique advantages in the comprehensive consideration of multiple parameters and the classification of samples or variables. In this paper, three chemometric methods, especially multidimensional scaling, were used to revisit the genetic oil family and the relationship between the crude oil and the source rock, because the oil source in the Wushi Sag, a significant petroliferous sag in the Beibu Gulf Basin of South China Sea, is still controversial. Two genetic families of crude oils, namely group A and group B, have been identified based on chemometric results. Group A oils are characterized by relatively higher Pr/Ph ratios and a high abundance of C27 ααα 20R steranes and C30-methylsteranes than those of group B oils, suggesting that this group of oils was deposited under a more oxic condition with more contribution of algae organic matter. Group A oils have been interpreted to be a mixture derived from the member 2 and member 3 of the Liushagang Formation (LS-2 and LS-3), whereas group B oils can be ascribed to the LS-2 member. The contribution of LS-3 mudstone member to the Wushi oils in previous studies may have been underestimated to some extent, which was inferred from the chemometric oil-source correlation results. The results of oil-source rock correlation may be used to guide future petroleum exploration activities with the incorporation of geological evidence. The spatial distribution of oil and gas reservoirs varies with burial depth. Taking into consideration other geological evidence, we may infer that the reservoir in eastern Wushi Sag was mainly distributed in the deep of Liushagang Formation, whereas the reservoir in southeast Wushi Sag was likely located in the shallow Liushagang Formation.
Introduction
Chemometrics is a useful tool for recognizing patterns and extracting useful information from measure data (Peters et al., 2005; Kumar et al., 2014). The method is use of multivariate statistics to identify and remove noise from the data, and show affinities among samples or variables (Peters et al., 2005). Chemometric methods have been used to evaluate data in many disciplines (Dong et al., 2021; Oliveira et al., 2021; Panseriya et al., 2021), including multivariate geochemical data (Zhan et al., 2019; Wang et al., 2020a). The application of chemometric method in geochemical correlation has been paid more and more attention due to the complexity of petroleum exploration and geological background. Therefore, many chemometric methods have been used to cope with the problem of oil-gas sources in petroleum systems according to practical demands (Peters et al., 2013; Wang et al., 2019; Wang et al., 2020b). Among them, hierarchical clustering analysis (HCA) and principal component analysis (PCA) are the two commonly used methods (Peters et al., 2005; Asemani and Rabbani, 2021). Additionally, the method for oil-oil and oil-source rock correlations also includes factor analysis (Zumberge, 1987; Chakhmakhchev et al., 1996), star diagram (Justwan et al., 2006; Mashhadi and Rabbani, 2015), K-nearest neighbor (Peters et al., 2007; Peters et al., 2008), multidimensional scaling (Wang et al., 2016; Wang et al., 2020a), discriminant analysis (Zhang et al., 2019; Shi et al., 2020), t-distributed stochastic neighbor embedding (Tao et al., 2020). Meanwhile, geochemists try to introduce new methods (Asemani and Rabbani, 2021), indicating that chemometrics has great potential in coping with the problem of geochemical correlation. Multidimensional scaling (MDS) is a newly introduced chemometric method (Wang et al., 2016), which is a nonlinear dimensionality reduction technique (Sumithra and Subu, 2015), especially suitable for studying oil-gas sources in complex areas (Wang et al., 2018a; Wang et al., 2020b). Therefore, this paper intends to use the chemometrics method (e.g., MDS) to revisit the oil source in the Wushi Sag of the Beibu Gulf Basin of the South China Sea.
The Wushi sags of the Beibu Gulf Basin were confirmed to be hydrocarbon-rich sag by drilling data (Gong and Li, 1998; He et al., 2010). As of 2009, six commercial oil wells have been drilled in the Wushi Sag (Yang et al., 2011). Multiple studies have confirmed that three sets of source rocks exist in the Wushi Sag, namely, the LS-1 member (the first member of the Liushagang Formation), LS-2 member (the second member of the Liushagang Formation), and LS-3 member (the third member of the Liushagang Formation) (Yang et al., 2016; Gan et al., 2017; Huang et al., 2017). Controversies still remain about crude oil sources and hydrocarbon potential for each member of the Liushagang Formation in the Wushi Sag, although previous research has confirmed that the discovered oils in Beibu Gulf Basin may have been mainly derived from the second member of the Liushagang Formation (LS-2) (Zhao et al., 2013; Fu and Liu, 2018). Some investigators suggested that the Wushi oils are divided into three groups, and were primarily derived from the LS-2 member (Yang et al., 2016), whereas others believed that there are two categories of crude oils (I and II), in which group I oils were generated from the LS-2 member and group II oils representing mixtures generated from the second and third members of the Liushagang Formation (Gan et al., 2017). Therefore, this paper intends to revisit the oil source of the Wushi oils using hierarchical clustering analysis (HCA), principal component analysis (PCA), and multidimensional scaling (MDS) of multivariate biomarkers. On the one hand, oil source rock correlation between oils and source rocks usually become more reliable when a composite analysis of multiple biomarker parameters are compared (Seifert and Moldowan, 1978; Peters et al., 2005). On the other hand, the result will help better understand the petroleum system in the Wushi Sag and reduce the exploration risk in this area. HCA calculates the distance matrices of the studied data objects, and organize objects with similar features into clusters (Cheong et al., 2016). Both PCA and MDS transform multiple correlated variables (i.e., biomarker ratios) into a small number of new uncorrelated variables (principal component). PCA is based on linear projection, whereas MDS is via non-linear dimensionality transformation (Sumithra and Subu, 2015).
Geological Background
The Wushi Sag, as an important petroliferous sag, is located in the south of the Beibu Gulf Basin (Figure 1A). The sag is bounded by the Weixinan Sag in the north, the Haitoubei Sag in the west, the Maichen Sag in the south, and the Leidong Sag in the east (Figure 1A), and the wells distribution in the study area are shown in Figure 1B. It is approximately 2,680 km2 in area. The sag has undergone three stages of tectonic evolution, including the initial fault-depression stage, intense fault-depression stage, and late depression stage (Liu et al., 2008; Yang et al., 2009; Yuan et al., 2020).
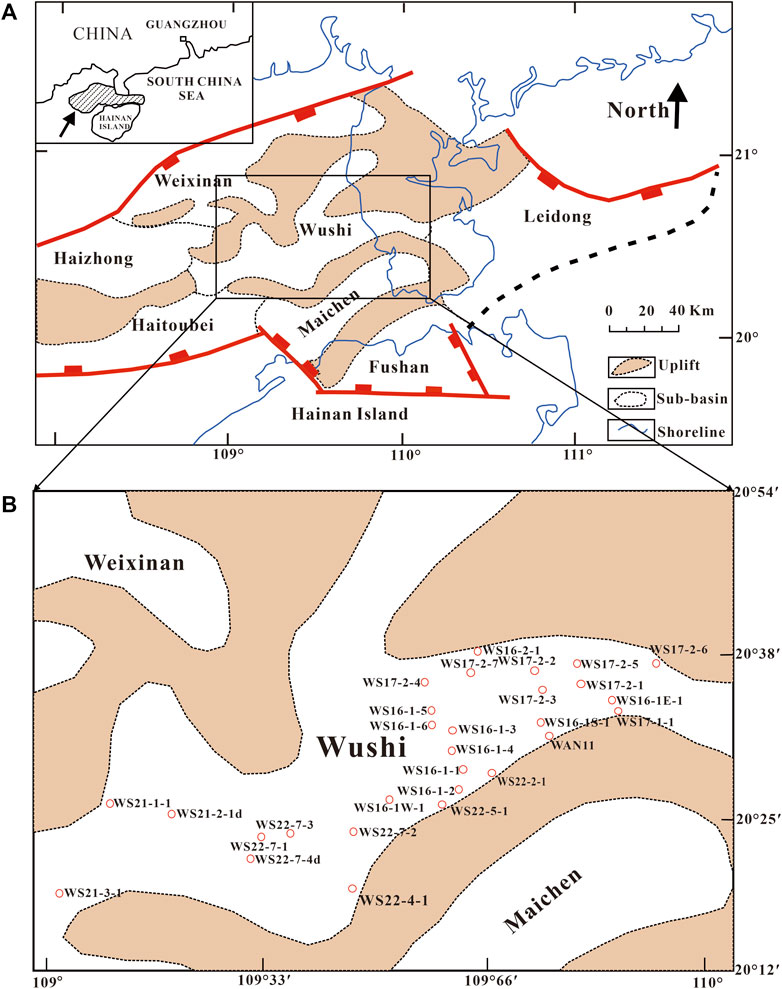
FIGURE 1. Geological maps showing: (A) tectonic units of the Beibuwan Basin and location of the Wushi Sag, and (B) well location in the study area [modified after (Huang et al., 2017)].
The bedrock in the Wushi Sag is a pre-Paleogene metamorphic rock, with a sedimentary cover of Cenozoic sediment. The Paleogene Changliu Formation, Eocene Liushagang Formation, Oligocene Weizhou Formation, Miocene Xiayang, Jiaowei, and Dengloujiao Formations, and Pliocene Wangliugang Formation were subsequently developed in the Cenozoic deposit from bottom to top (Figure 2). The Liushagang Formation was developed during the maximum expansion of the lake basin, in a lake system of alternating expansion and contraction and forming predominantly lacustrine and deltaic deposits (Li et al., 2021). The lithological composition of this formation is mainly oil shale, argillaceous shale intercalated with thin layers of siltstone, fine sandstone, and medium sandstone. The Liushagang Formation is further divided into the first, second, and third members, i.e., Liushagang-1 (LS-1), Liushagang-2 (LS-2), and Liushagang-3 (LS-3), based on different lithology and fossil assemblages (Li, 1994).
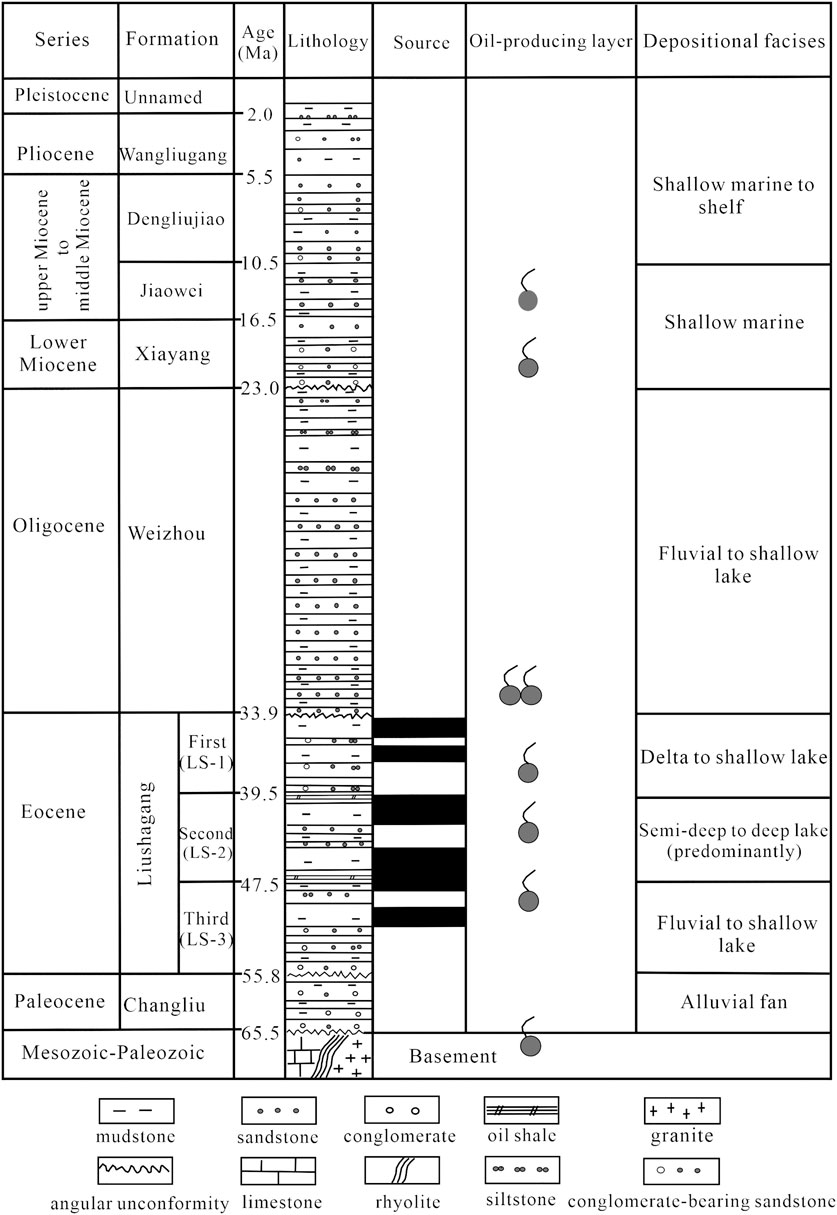
FIGURE 2. General stratigraphic column of the Wushi Sag in the Beibu Gulf Basin (modified after (Huang et al., 2017)).
The LS-3 member was deposited during lake expansion. The lithology of this member is interbedded sandstones and shales (Huang et al., 2017). The LS-2 member was formed in a deep water body during the maximum of lake expansion, with a set of high-quality source rock developed (Li et al., 2021). This member is composed of interbedded fine-grained sandstones and shales (Liu, 2004). During the deposition of LS-1 member, the lake basin was gradually contracted, with the water body becoming shallower. The LS-1 member contains interbedded mudstone and sandstone, in addition to the presence of a small number of coal seams (Li et al., 2021).
Samples and Methods
Samples
Five core samples of mudstone have been collected from potential Eocene source rocks, including the LS-1, LS-2, and LS-3 members from the WZ22-3-1, WZ10-7-1, and WZ10-3-30 wells in the study area (Table 1). In addition, four oil samples collected from the WS22-9-3D, WS16-1-HD, and WS16-1W-7 wells have been analyzed using gas chromatography-mass spectrometry. Additionally, twenty-two published samples, including source rocks and oils, have been used for chemometric analysis (Huang et al., 2017), and the selected parameters are present in Table 2.
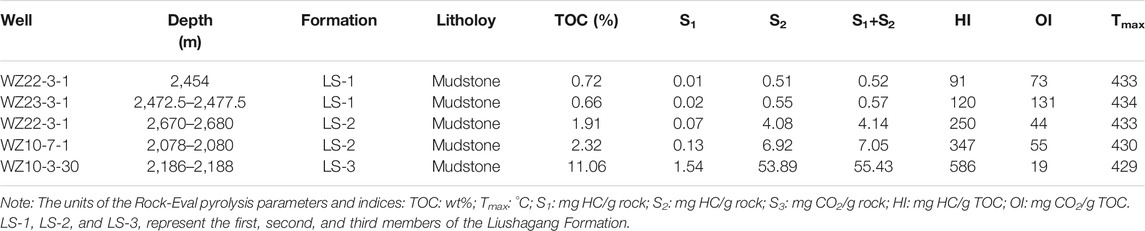
TABLE 1. Rock-Eval data of core samples from the Liushagang Formation in the study area.
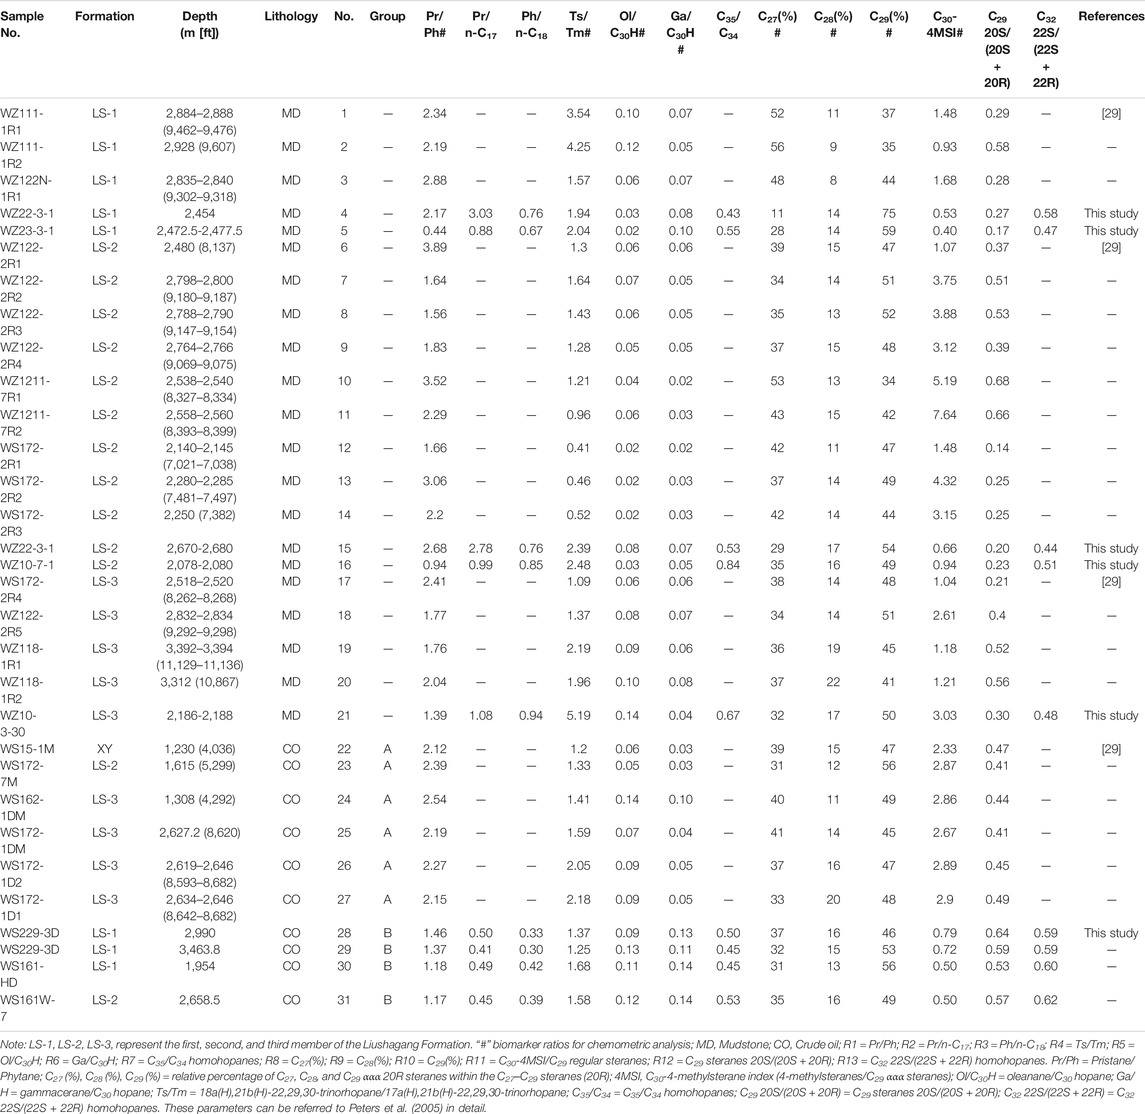
TABLE 2. Selected geochemical parameters for the source rocks and crude oils in the Wushi Sag.
Rock-Eval Pyrolysis and Bitumen Extraction
The core samples were cleaned first with distilled water and then crushed into powder. The powdered samples were subjected to IFP Rock-Eval 6 analyzer to obtain geochemical parameters such as total organic matter (TOC), hydrogen index (HI) and hydrocarbon generation potential (S1 + S2), following the same protocols described previously (Wang et al., 2018b). Initially, power samples were heated for 300°C for 3 min to yield the Rock-Eval S1 that stands for the amount of free hydrocarbon, and subsequently heated to 650°C at a heating rate of 25°C/min to obtain the Rock-Eval S2 that stands for the hydrocarbons generated from pyrolytic degradation of the kerogen. Tmax is the temperature at which maximum kerogen pyrolysis occurs. Finally, the powders were further heated from 300 to 850°C at a rate of 20°C/min to produce the residual organic and inorganic carbon content. ∼20 g of dry rock powder were extracted with 9:1 of Dichloromethane: Methanol (DCM: MeOH) through Accelerated Solvent Extraction. All extracts and crude oils were separated into saturated, aromatic, and resin fractions using silica gel column chromatography.
Gas Chromatography-Mass Spectrometry
Gas chromatography-mass spectrometry (GC-MS) analysis of oils and source rock extracts were analyzed using a Thermo Fisher Trace 1,300 gas chromatography coupled to an ISQ 7000 mass spectrometer equipped with a DB-5 capillary column (30 m × 0.25 mm × 0.25 μm). Pure helium gas (99.999%) was used as the carrier gas. The GC oven temperature was initially held at 50°C for 2 min, programmed to 120°C at a rate of 20°C/min, then to 250°C at 4°C/min and to 310°C at 3°C/min, and held at 310°C for 30 min. The mass spectrometer ionization energy was 70 eV and the ion source temperature was 230°C. Full-scan and selected ion recording were used for analysis, with the full-scan detection range of 50–550 (m/z). The peak area was integrated by Xcalibur software (Thermo Scientific). The biomarker compounds were identified in the studied rock and oil samples in accordance with the relative retention time, mass spectral feature, peak sequence, and identification standards from prior studies (Huang et al., 2017; Wang et al., 2018a; Gan et al., 2019).
Chemometric Analysis
In this paper, three chemometric methods (e.g., HCA, PCA and MDS) were applied to yield a detailed oil-oil and oil-source rock correlations in the Wushi Sag using eight biomarker ratios (labelled by “#” in Table 2), similar to previous studies (Peters et al., 2013; Wang et al., 2018a; Wang et al., 2018b). The selected biomarker parameters, including Pr/Ph, Ts/Tm, Ol/C30H, Ga/C30 hopane, C27(%), C28(%), C29(%), and C30-4MSI index (Table 2), are generally suffered less from secondary processes, such as biodegradation, maturity, and migration. The HCA and PCA were performed using Pirouette® software (Infometrix, Inc.), whereas MDS was computed through in-house software (Wang et al., 2016).
Results and Discussion
Source Rock Characteristics
Three sets of source rocks are present in the Wushi Sag: the first, second, and third members of the Liushagang Formation, i.e., LS-1, LS-2, and LS-3 (Liu et al., 2018; Li et al., 2021). The detailed source rock geochemistry can be referred to as Huang et al. (2017) and Li et al. (2021). In this paper, five-rock samples have also been analyzed using Rock-Eval pyrolysis (Table 1), in addition to published data collected from an open-source database. As depicted in Figure 3A, the studied rock sample from the LS-1 member is a fair source rock, whereas rock samples from the LS-2 and LS-3 members show very good to excellent hydrocarbon generation potential. A plot of hydrogen index versus Tmax for the LS-1 samples demonstrates that the organic matter of studied source rocks is mainly Type II2 kerogen, whereas the LS-2 and LS-3 samples primarily contain Type II1 and Type I kerogens, respectively (Figure 3B).
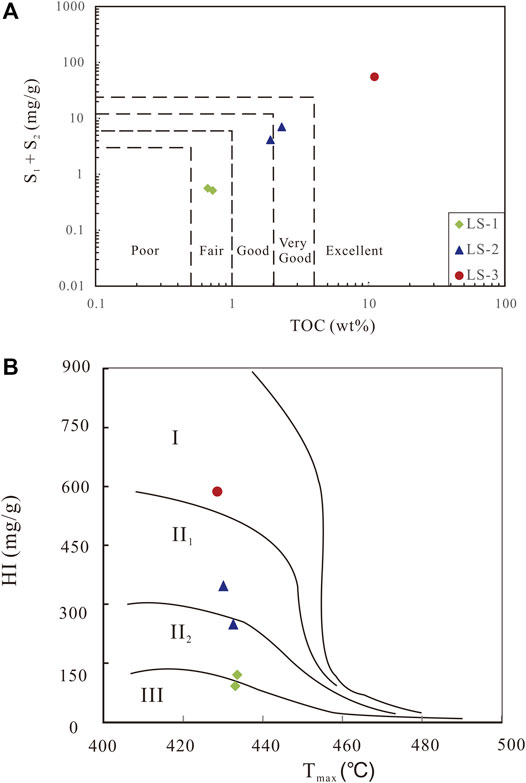
FIGURE 3. Crossplots of (A) Rock-Eval S1 + S2 vs. total organic carbon (TOC) and (B) hydrogen index vs. Tmax for the studied potential source rocks in the Liushagang Formation. LS-1 = first member of the Liushagang Formation; LS-2 = second member of the Liushagang Formation; LS-3 = third member of the Liushagang Formation. The criteria distinguish poor, fair, good, very good and excellent source rock are from (Peters and Cassa, 1994).
The thermal maturity of the studied rock samples was evaluated based on Rock-Eval Tmax and biomarker parameters. Tmax values for the Wushi samples range from 429 to 434°C, which indicates immature to early mature organic matter (Tissot and Welte, 1984). This is also supported by the maturity-related biomarker ratios. The ratios of C32 22S/(22S + 22R) homohopanes and C29 20S/(20R + 20S) steranes of the studied samples are 0.44–0.58 and 0.17–0.30, respectively (Table 2), suggesting that the samples have entered the oil generation stage (Seifert and Moldowan, 1980; 1986).
The distribution characteristics of n-alkanes and isoprenoid hydrocarbons in the Liushagang Formation can be used to interpret sources and depositional conditions of organic matter. The distribution of n-alkanes for the studied mudstone samples typically ranges from n-C15 to n-C31 (Figure 4). All three samples have bimodal distribution, suggesting a mixture of one mature source and one immature source in different proportions. The pristane/phytane (Pr/Ph) ratio is commonly used as an index of the depositional environment (Peters et al., 2005). Generally, low Pr/Ph ratios (<1) indicate the anoxic condition (Didyk et al., 1978), medium Pr/Ph ratios varied between 1 and 3 are likely related to suboxic conditions (Hunt, 1995), and high Pr/Ph ratios (>3) suggest oxic condition (Hunt, 1995; Harris et al., 2004). The Pr/Ph ratios of the Liushagang mudstone samples are in the range of 0.44–2.68, suggesting that samples from the Liushagang Formation may be deposited under anoxic to suboxic conditions.
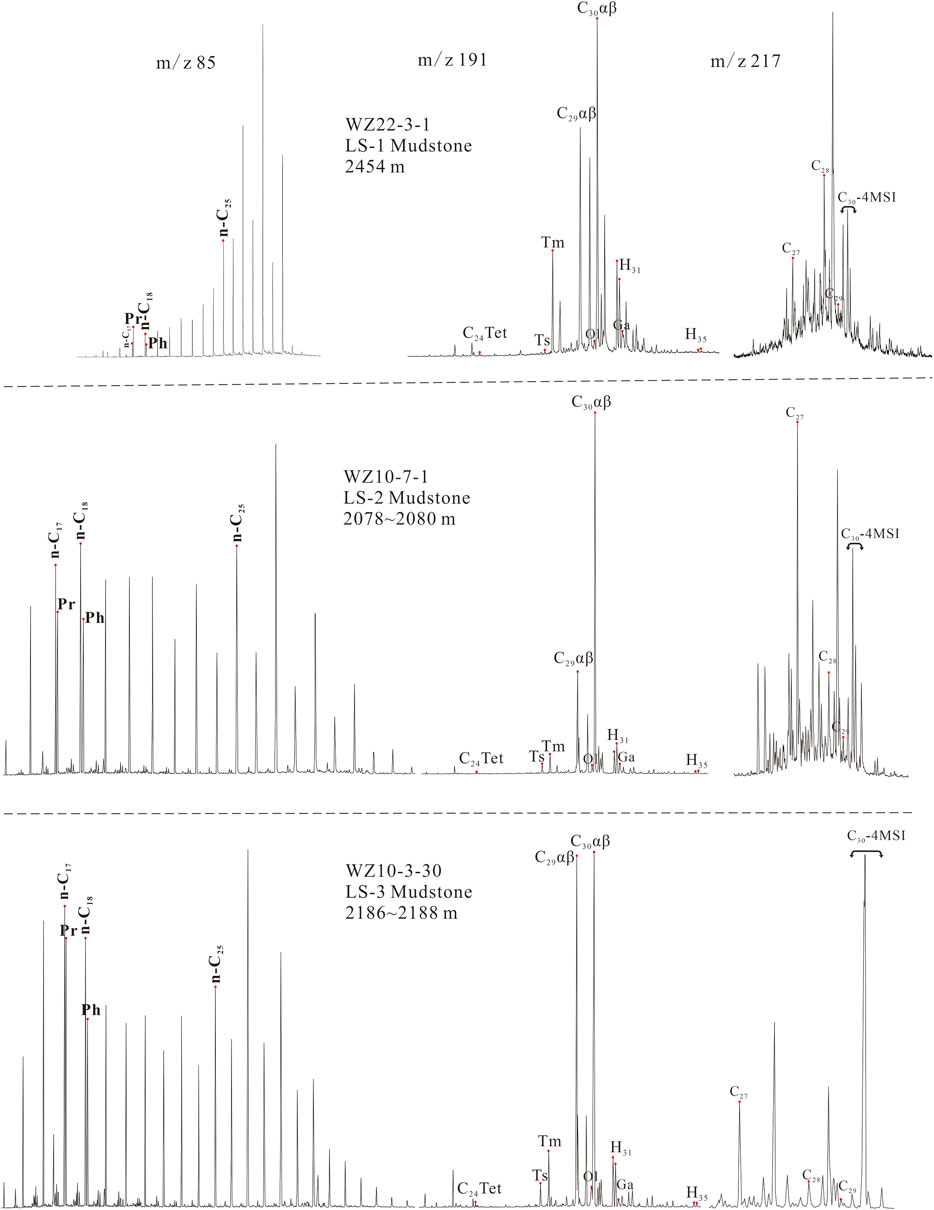
FIGURE 4. Representative n-alkane (m/z 85), hopane (m/z 191), and sterane (m/z 217) mass chromatograms for the source rocks from the first (LS-1), second (LS-2) and third (LS-3) member of the Liushagang Formation. C27, C28 and C29 = C27, C28 and C29 ααα 20R steranes; C30-4MSI = C30 4-methylsteranes. The symbolic meanings of other compounds can be found in Table 2.
The representative sterane chromatograms (m/z 217) for studied rock samples are illustrated in Figure 4. The relative content of C27, C28, and C29 ααα 20R steranes of the studied samples are in the range of 11–35%, 14–17%, and 49–75%, respectively (Table 2). This high C29 steranes contents may imply a strong contribution of terrigenous organic matter input (Huang and Meinschein, 1979). In addition, the relative abundance of C27 steranes for samples of the LS-1 member is lower than those of the LS-2 and LS-3 members, suggesting they may be less algal organic matter input to LS-1 member compared to the LS-2 and LS-3 members. This is also confirmed by the C30 4-methylsteranes to C29 regular steranes ratios (C30-4MSI index) that is widely used as an indicator for certain dinoflagellates blooming in freshwater lakes (Brassell et al., 1988; Goodwin et al., 1988; Peters et al., 2005). The C30-4MSI ratios of samples from the LS-1 member range from 0.40 to 0.53, whereas those of the LS-2 and LS-3 samples range from 0.66 to 3.03. These results may suggest a higher contribution of dinoflagellates to the organic matter in the deposition of the LS-2 and LS-3 members than that to the LS-1 member. This is also consistent with previous studies (Huang et al., 2013; Huang et al., 2017).
Terpane mass chromatograms (m/z 191) of the representative source rocks are characterized by a dominant C30 hopane with a higher abundance of pentacyclic terpanes relative to tricyclic terpanes (Figure 4). The C35/C34 ratios of the studied source rocks range from 0.43-0.84, probably suggesting anoxic to suboxic depositional conditions (Peters and Moldowan, 1991). A high Ga/C30 hopane ratio is commonly associated with a stratified and reducing water column (Fu et al., 1986; Sinninghe Damsté et al., 1995). Ga/C30 hopane ratios of the samples are very low, ranging from 0.04-0.10, indicating a lack of water column stratification.
Crude Oil Geochemistry
A complete set of acyclic isoprenoids (e.g., Pr and Ph) and low molecular weight n-alkanes are present in the analyzed oils, probably indicating no distinct signs of biodegradation (Peters and Moldowan, 1993). Additionally, low Pr/n-C17 and Ph/n-C18 ratios of all oils also show that the studied oil samples were not biodegraded (Volkman et al., 1983). The mass chromatogram of the representative oil sample is shown in Figure 5A. The Pr/Ph ratios of the studied oils range from 1.17 to 1.46, likely suggesting suboxic conditions (Hunt, 1995).
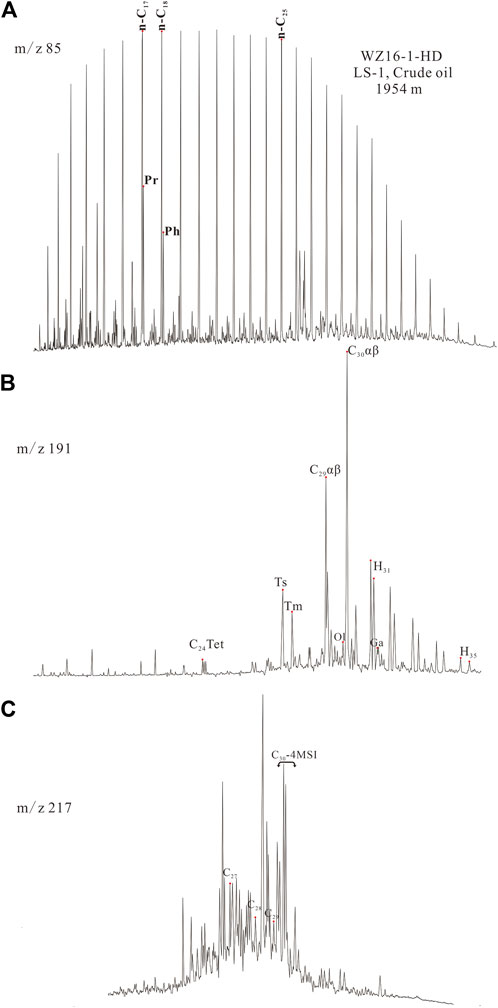
FIGURE 5. Mass chromatograms of m/z 85 (A), 191 (B), and 217 (C) for the representative Wushi oil. C27, C28 and C29 = C27, C28 and C29 ααα 20R steranes; C30-4MSI = C30 4-methylsteranes; LS-1 = first member of the Liushagang Formation; LS-2 = second member of the Liushagang Formation; LS-3 = third member of the Liushagang Formation. The symbolic meanings of other compounds can be found in Table 2.
The m/z 217 mass chromatogram for the representative oil is shown in Figure 5B. The relative contents of C27, C28, and C29 ααα 20R steranes for the oils range from 31–37%, 13–16%, and 46–56%, respectively (Table 2). These data may indicate a substantial contribution of terrigenous organic matter input (Huang and Meinschein, 1979).
The m/z 191 mass chromatogram for the representative oil is shown in Figure 5C. These studied oils have C35/C34 ratios ranging from 0.45 to 0.53, indicating that oxidation is mainly occurring on the source (Peters and Moldowan, 1991). The Ga/C30 hopane ratios of the oil samples are in the range of 0.11–0.14, probably indicating a lack of water column stratification (Sinninghe Damsté et al., 1995).
Oil-Oil and Oil-Source Rock Correlations
Hierarchical cluster analysis (HCA) and principal component analysis (PCA) are valuable tools to identify genetic relationships among crude oils and source rocks based on age- and source-related biomarker ratios (Peters et al., 2007; Peters et al., 2013; Wang et al., 2018b). Similarly, multidimensional scaling (MDS) is also a reliable method for a detailed oil-oil and oil-source rock correlation (Wang et al., 2016; Wang et al., 2018a; Wang et al., 2020a). The Wushi oil samples were divided into two groups, as shown in Figure 6.
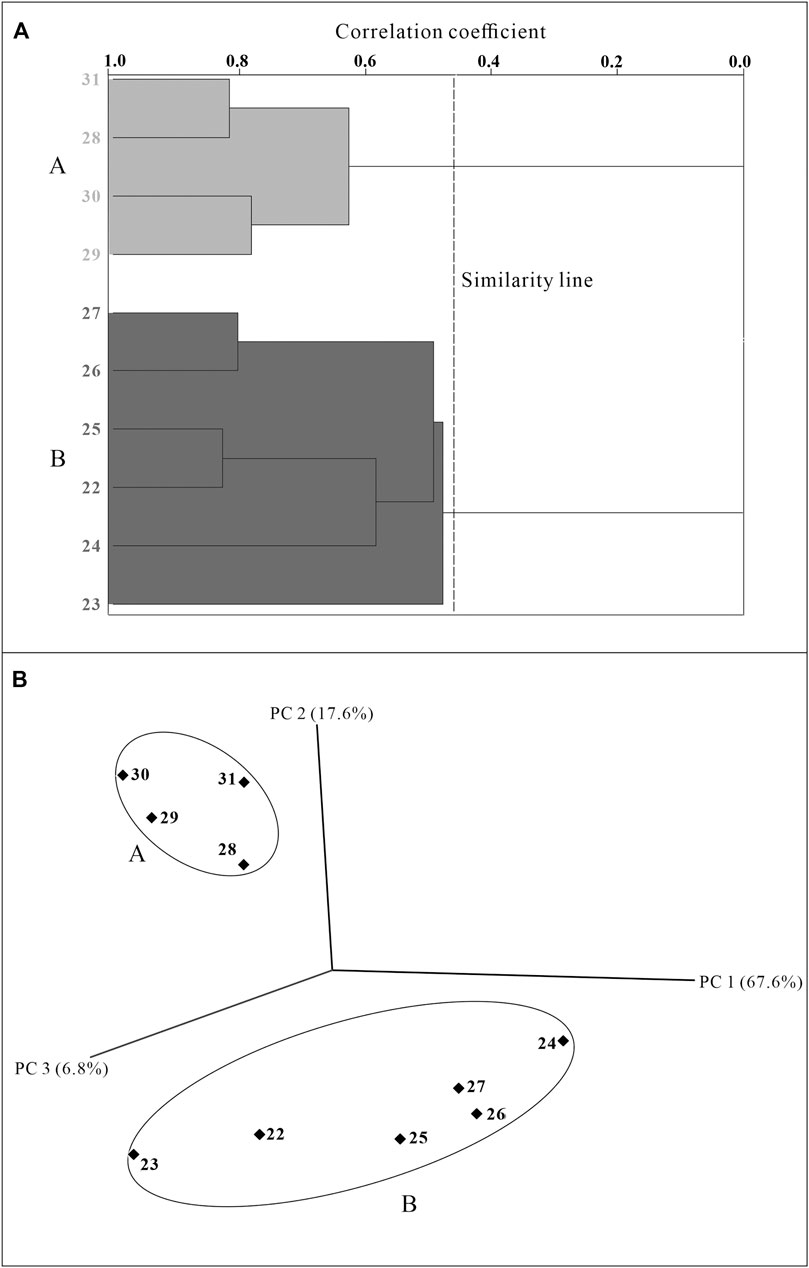
FIGURE 6. Chemometric analysis of oil genetic families for the Wushi Sag of the Beibu Gulf Basin based on (A) hierarchical cluster analysis (HCA) and (B) principal component analysis (PCA). The first three components of PCA, including PC1, PC2, and PC3, account for 92% of the total variance in the original dataset.
Group A oils are primarily produced from the LS-3 reservoirs (Table 2). This group of oils have relatively high Pr/Ph ratios, ranging from 2.12-2.54, and low Ga/C30 hopane ratios of 0.03–0.09, indicating the source rocks of Group B oils were probably deposited in more oxic condition (Table 2). The relative abundance of C29 ααα (20R) steranes and C30-4MSI ratios are in the range of 45–56% and 2.33–2.90%, respectively (Table 2). These data may indicate source rocks of Group B oils may have received more contribution of marine organic matter when compared to the source rocks of Group B oils. The ratios of C29 20S/(20S + 20R) range from 0.41 to 0.49 (Table 2), indicating that Group A oils are mature and have relatively lower maturity than that of Group B oils.
Group B oils principally consist of oils from the LS-1 member. The Pr/Ph ratios are relatively low, ranging from 1.16 to 1.46 (Table 2) and suggesting that the source rocks of Group A oils were deposited under more anoxic depositional environments. Group A oils have a relatively low abundance of C27 ααα (20R) steranes and a high abundance of C29 ααα (20R) steranes. Relatively low C30-4MSI ratios range from 0.50–0.79 (Table 2), probably indicating that the source rocks may have received more contributions from terrigenous organic matter. The maturity parameter of C29 20S/(20S + 20R) has relatively high values, ranging from 0.53–0.64 (Table 2), which is indicative of relatively high maturity.
Similarly, we have also identified genetic affinities between oils and source rocks using chemometric methods. Figures 7, 8 show the PCA and MDS scenario of multi-parameter oil-source rock correlation for the Wushi Sag. The biomarker parameters used for chemometric methods are the same as those in the HCA and PCA of Figure 6, marked by stars in Table 2. The three-dimensional view of PCA indicates two genetic oil families (Figure 7), inconsistent with the results discussed above. Group A oils have a strong affinity to the LS-2 and LS-3 members. The LS-2 mudstone member is related to group B oils. This conclusion is also confirmed by the MDS plot (Figure 8).
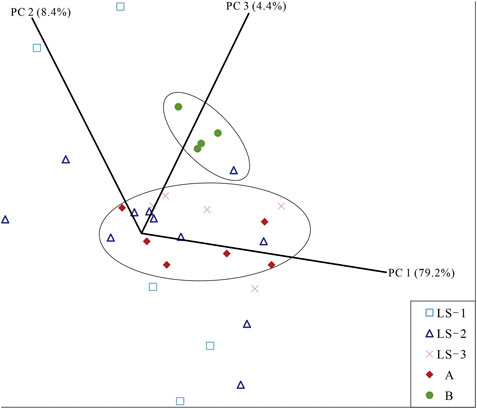
FIGURE 7. Chemometric results of oil-source rock correlation from the Wushi Sag of the Beibuwan Basin based on principal component analysis. The first three components of PCA, including PC1, PC2, and PC3, account for 92% of the total variance in the original dataset.
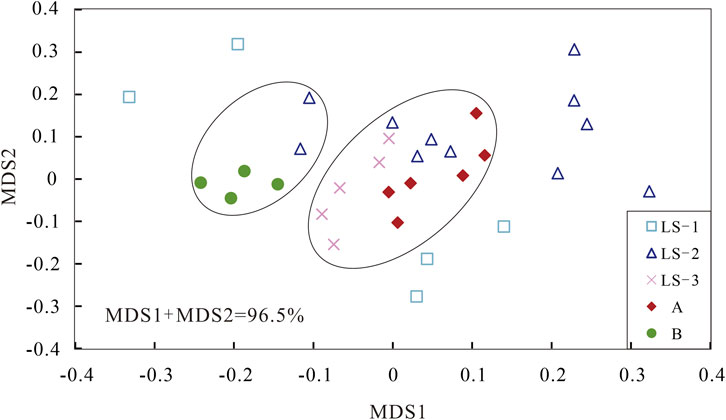
FIGURE 8. Chemometric analysis of oil-source rock correlation for the Wushi Sag of the Beibu Gulf Basin based on multidimensional scaling (MDS). The first two components of MDS, including MDS1 and MDS2, account for 96.5% of the total variance in the original dataset.
Implications for Petroleum Exploration
Oil and gas exploration activities have been primarily in oils derived from the second member of the Liushagang Formation (LS-2) and structure traps in the Wushi Sag over the last three decades (Liu et al., 2008). Recently discovered oil-bearing structures have stimulated a strong interest in the central of the sag (Yang et al., 2016). Future exploration and understanding of the petroleum system can be significantly improved by investigation of the genetic relationships between the discovered crude oils and source rocks.
As described previously, two categories of oils at different maturity levels have been identified using chemometric methods. Group A oils represent mixtures generated from the LS-2 and LS-3 members, whereas group B oils were derived from the LS-3 member. Group A oils with relatively lower maturation were distributed in eastern Wushi Sag (Figure 9) and primarily produced from the LS-3 reservoir of the WS162- and WS172- wells (Table 1). The corresponding maturity of Group A oils is consistent with the maturity of the nearby source rocks in the study area (Figure 9). The group of oil is close to the WS172 N Fault. The fault was in a shallower depth and had relatively weak activities during the Paleogene period (Yuan et al., 2020). Furthermore, the combination of oil-source rock correlation results and low permeability reservoirs (Gao et al., 2019) in the study area probably suggests that the migration and accumulation of Group A oils mainly occurred within the LS-2 and LS-3 members, forming a self-generation and self-storage petroleum reservoir.
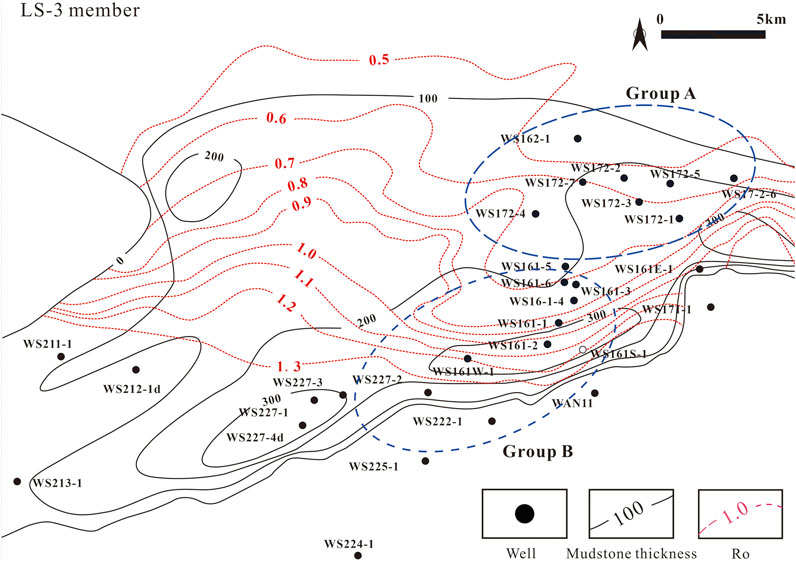
FIGURE 9. The distribution of mudstone thickness and maturity of the third of the Liushagang Formation (LS-3 member) in the Wushi Sag (modified after (Liu et al., 2018)).
Group B oils with relatively high maturation are distributed in southeast Wushi Sag and are mainly produced from the shallower LS-1 reservoir of the WS22-9 and WS16-1 wells (Table 1). The corresponding maturity of Group B oils is essentially equivalent to the maturity of the nearby source rocks from the LS-2 and LS-3 members (Figures 9, 10). Similarly, the distribution of oil is in the vicinity of the WS16-1 Fault, which holds across the entire source rock members of the study area (Figure 11) and is a good pathway connecting oil and source (Yuan et al., 2020). This evidence implies that group B oils were probably migrated vertically through faults, contributing to the shallower distribution of crude oil.
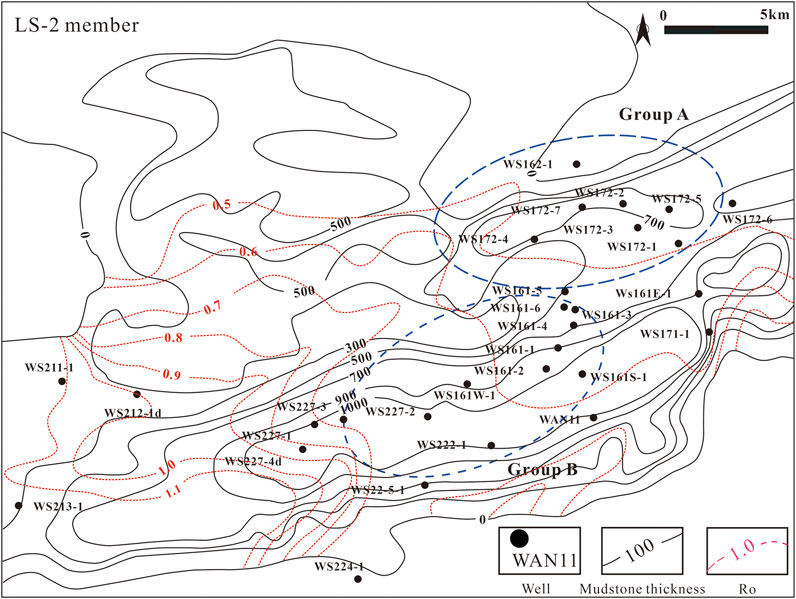
FIGURE 10. The distribution of mudstone thickness and maturity of the second of the Liushagang Formation (LS-2 member) in the Wushi Sag (modified after (Liu et al., 2018)).
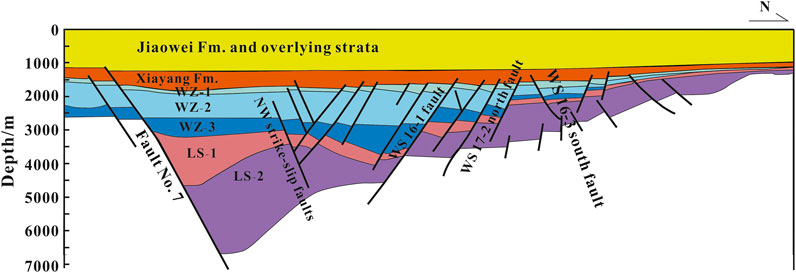
FIGURE 11. Geological profile of the Wushi Sag in south-north trending (modified after (Yuan et al., 2020)). Fm. = Formation, WZ = Weizhou Formation, LS = Liushagang Formation.
In summary, the results in the present study provide some inspiration for future petroleum exploration. For example, the oil-source rock correlation results suggest that the contribution of the LS-3 member to the Wushi oils has been underestimated in the past, and thus greater emphasis should be deserved in future exploration. In addition, exploration of the eastern Wushi Sag, where close to the distribution of Group A oils, should probably be focused on the relatively deep members of the Liushagang Formation, considering a combination of fault features and reservoir characteristics. In contrast, the exploration of southeast Wushi Sag, wherein the proximity of Group B oils should be paid more attention to the shallow layer of the Liushagang Formation.
Conclusions
The studied rocks from the three candidate source rock members, LS-1, LS-2, and LS-3, have a variable abundance of organic matter content and predominantly Type II kerogen. The LS-1 mudstone member of the studied sample is a fair source rock, whereas the LS-2 and LS-3 mudstone members of the studied sample have good to excellent hydrocarbon generation potential. Two oil families with different thermal maturity have been identified based on HCA and PCA. Group A oils with relatively low maturity are characterized by relatively high Pr/Ph ratios, low C27 ααα 20R steranes contents, and low C30-4MSI ratios. Conversely, the opposite is true for Group B oils. The oil-source rock correlation results show that group A oils were mainly derived from a mixture of LS-2 and LS-3 members, and group B oils were likely originated from the LS-2 mudstone member. These results also provide some inspiration for future petroleum exploration when combined with geological evidence. For example, the eastern Wushi Sag has a good potential for petroleum exploration in the deep Liushagang Formation (e.g., LS-3), whereas more attention should be given to the shallow Liushagang Formation in the southeast Wushi Sag.
Data Availability Statement
The original contributions presented in the study are included in the article/Supplementary Material, further inquiries can be directed to the corresponding author.
Author Contributions
Y-PW conceived and wrote the manuscript; YG, XiZ, and ZS supervised and revise the manuscript; SW and JX provided technical support and conceptual advice; XuZ performed all the geochemical analyses and synthesized all the data. All authors discussed the results and implications and commented critically on important intellectual content on the manuscript at all stages.
Funding
This work was supported by the Doctoral Research Initiation Project of Guangdong Ocean University (Grant Nos R20030 and R17001), National Science Foundation of China (Grant No. 41602139), and the Special Financial Aid for Talents of Guangdong Ocean University (Grant No. 002026002004).
Conflict of Interest
XiZ was employed by the company CNOOC International Limited.
The remaining authors declare that the research was conducted in the absence of any commercial or financial relationships that could be construed as a potential conflict of interest.
Publisher’s Note
All claims expressed in this article are solely those of the authors and do not necessarily represent those of their affiliated organizations, or those of the publisher, the editors and the reviewers. Any product that may be evaluated in this article, or claim that may be made by its manufacturer, is not guaranteed or endorsed by the publisher.
Acknowledgments
We acknowledge Yan-Rong Zou for his kind help with this study.
References
Asemani, M., and Rabbani, A. R. (2021). A Novel and Efficient Chemometric Approach to Identifying Oil Families by Saturate Biomarker Data and FTIR Spectroscopy of Asphaltene Subfractions. Mar. Pet. Geology. 124, 104838. doi:10.1016/j.marpetgeo.2020.104838
Brassell, S. C., Eglinton, G., Sheng, G., and Fu, J. (1988). Biological Markers in Lacustrine Chinese Oil Shales. Geol. Soc. Lond. Spec. Publications 40 (1), 299–308. doi:10.1144/gsl.sp.1988.040.01.24
Chakhmakhchev, A., Suzuki, N., Suzuki, M., and Takayama, K. (1996). Biomarker Distributions in Oils from the Akita and Niigata Basins, Japan. Chem. Geology. 133 (1-4), 1–14. doi:10.1016/s0009-2541(96)00061-7
Cheong, K.-L., Wu, D.-T., Deng, Y., Leong, F., Zhao, J., Zhang, W.-J., et al. (2016). Qualitation and Quantification of Specific Polysaccharides from Panax Species Using GC-MS, Saccharide Mapping and HPSEC-RID-MALLS. Carbohydr. Polym. 153, 47–54. doi:10.1016/j.carbpol.2016.07.077
Didyk, B. M., Simoneit, B. R. T., Brassell, S. C., and Eglinton, G. (1978). Organic Geochemical Indicators of Palaeoenvironmental Conditions of Sedimentation. Nature 272 (5650), 216–222. doi:10.1038/272216a0
Dong, M.-Y., Wu, H.-L., Long, W.-J., Wang, T., and Yu, R.-Q. (2021). Simultaneous and Rapid Screening and Determination of Twelve Azo Dyes Illegally Added into Food Products by Using Chemometrics-Assisted HPLC-DAD Strategy. Microchemical J. 171, 106775. doi:10.1016/j.microc.2021.106775
Fu, J., Sheng, G. Y., Peng, P. G., Brassell, S. C., Eglinton, G., and Jiang, J. G. (1986). Peculiarities of Salt lake Sediments as Potential Source Rocks in China. Org. Geochem. 10 (1-3), 119–126. doi:10.1016/0146-6380(86)90015-x
Fu, N., and Liu, J. (2018). Hydrocarbon Generation and Accumulation Characteristics of Three Type Source Rock of Liu II Segment in Beibuwan Basin. Nat. Gas Geosci. 29 (07), 932–941. (in Chinese with English abstract). doi:10.11764/j.issn.1672-1926.2018.06.002
Gan, H., Wang, H., Shi, Y., Ma, Q., and Pan, Z. (2019). Geochemical Characteristics and Genetic Origin of Crude Oil in the Fushan Sag, Beibuwan Basin, South China Sea. Mar. Pet. Geology. 112, 104114. doi:10.1016/j.marpetgeo.2019.104114
Gan, J., Hu, C., Li, X., and Jin, Q. (2017). Genetic Types and Differential Distribution Characteristics of Crude Oil in Wushi Sag. China Offshore Oil and Gas 29 (06), 23–31. (in Chinese with English abstract). doi:10.11935/j.issn.1673-1506.2017.06.003
Gao, Z., Yang, X., Hu, C., Wei, L., Jiang, Z., Yang, S., et al. (2019). Characterizing the Pore Structure of Low Permeability Eocene Liushagang Formation Reservoir Rocks from Beibuwan Basin in Northern South China Sea. Mar. Pet. Geology. 99, 107–121. doi:10.1016/j.marpetgeo.2018.10.005
Gong, Z., and Li, S. (1998). Basin Analysis and Hydrocarbon Accumulation in the Northern continental Margin of the South China Sea.
Goodwin, N. S., Mann, A. L., and Patience, R. L. (1988). Structure and Significance of C30 4-methyl Steranes in Lacustrine Shales and Oils. Org. Geochem. 12 (5), 495–506. doi:10.1016/0146-6380(88)90159-3
Harris, N. B., Freeman, K. H., Pancost, R. D., White, T. S., and Mitchell, G. D. (2004). The Character and Origin of Lacustrine Source Rocks in the Lower Cretaceous Synrift Section, Congo Basin, West Africa. Bulletin 88 (8), 1163–1184. doi:10.1306/02260403069
He, J., Wu, W., Zhu, Y., Chen, S., Cui, S., and Gong, X. (2010). Genetic Types, Migration and Accumulation of Oil & Gas and Exploration Proposal in North Marginal Basins, South China Sea. Nat. Gas Geosci. 21 (01), 7–17. (in Chinese with English abstract). doi:10.11764/j.issn.1672-1926.2010.01.7
Huang, B., Tian, H., Wilkins, R. W. T., Xiao, X., and Li, L. (2013). Geochemical Characteristics, Palaeoenvironment and Formation Model of Eocene Organic-Rich Shales in the Beibuwan Basin, South China Sea. Mar. Pet. Geology. 48, 77–89. doi:10.1016/j.marpetgeo.2013.07.012
Huang, B., Zhu, W., Tian, H., Jin, Q., Xiao, X., and Hu, C. (2017). Characterization of Eocene Lacustrine Source Rocks and Their Oils in the Beibuwan Basin, Offshore South China Sea. Bulletin 101 (9), 1395–1423. doi:10.1306/10171615161
Huang, W.-Y., and Meinschein, W. G. (1979). Sterols as Ecological Indicators. Geochimica et Cosmochimica Acta 43(5), 739–745. doi:10.1016/0016-7037(79)90257-6
Justwan, H., Dahl, B., and Isaksen, G. H. (2006). Geochemical Characterisation and Genetic Origin of Oils and Condensates in the South Viking Graben, Norway. Mar. Pet. Geology. 23 (2), 213–239. doi:10.1016/j.marpetgeo.2005.07.003
Kumar, N., Bansal, A., Sarma, G. S., and Rawal, R. K. (2014). Chemometrics Tools Used in Analytical Chemistry: An Overview. Talanta 123, 186–199. doi:10.1016/j.talanta.2014.02.003
Li, F., Lu, L., Ma, W., Diao, H., Xu, Z., Bai, Y., et al. (2021). Geochemical Characteristics of Source Rocks in Liushagang Formation of Wushi Sag. J. China Univ. Petroleum( Edition Nat. Science) 45 (01), 31–40. (in Chinese with English abstract). doi:10.3969/j.issn.1673-5005.2021.01.004
Li, M. (1994). “Paleoclimate, and Paleoenvironment in the Petroliferous Region of the north continental Shelf Region of South China Sea,” in Tertiary In Petroliferous Region of China (VIII). Editors Z. Jiang, L. Zen, and M. Li (Beijing: Petroleum Industry Press), 80–90. (in Chinese).
Liu, M. (2004). The Assumed Gas Accumulation Systems in Beibuwan basin. China Offshore Oil & Gas 16, 93–97. (in Chinese with English abstract). doi:10.3969/j.issn.1673-1506.2004.02.004
Liu, Y., Ren, Y., Yang, X., Liu, H., and Xu, X. (2018). Geochemical Signatures of the Source Rocks from the Liushagang Formation in the Wushi Depression, Beibuwan Basin. Sediment. Geology. Tethyan Geology. 38 (01), 103–112. (in Chinese with English abstract). doi:10.3969/j.issn.1009-3850.2018.01.012
Liu, Y., Zhao, Z., Li, J., and Xu, J. (2008). Hydrocarbon Play Division and Major Control Analysis in Wushi Sag, Beibuwan Basin. China Offshore Oil and Gas 20 (02), 82–86. (in Chinese with English abstract). doi:10.3969/j.issn.1673-1506.2008.02.003
Mashhadi, Z. S., and Rabbani, A. R. (2015). Organic Geochemistry of Crude Oils and Cretaceous Source Rocks in the Iranian Sector of the Persian Gulf: An Oil-Oil and Oil-Source Rock Correlation Study. Int. J. Coal Geology. 146, 118–144. doi:10.1016/j.coal.2015.05.003
Oliveira, L. G., Araújo, K. C., Barreto, M. C., Bastos, M. E. P. A., Lemos, S. G., and Fragoso, W. D. (2021). Applications of Chemometrics in Oil Spill Studies. Microchemical J. 166, 106216. doi:10.1016/j.microc.2021.106216
Panseriya, H. Z., Gosai, H. B., Vala, A. K., Gavali, D. J., and Dave, B. P. (2021). Assessment of Surface Water of Gulf of Kachchh, West Coast of India: A Chemometric Approach. Mar. Pollut. Bull. 170, 112589. doi:10.1016/j.marpolbul.2021.112589
Peters, K. E., and Cassa, M. R. (1994). “Applied Source Rock Geochemistry,” in The Petroleum System: From Source to Trap, 60. Editors L. B. Magoon, and W. G. Dow (American Association of Petroleum Geologists Memoir), 93–120.
Peters, K. E., and Moldowan, J. M. (1991). Effects of Source, thermal Maturity, and Biodegradation on the Distribution and Isomerization of Homohopanes in Petroleum. Org. Geochem. 17 (1), 47–61. doi:10.1016/0146-6380(91)90039-m
Peters, K. E., and Moldowan, J. M. (1993). The Biomarker Guide: Interpreting Molecular Fossils in Petroleum and Ancient Sediments. Englewood Cliffs, NJ (United States): Prentice-Hall.
Peters, K. E., Walters, C. C., and Moldowan, J. M. (2005). The Biomarker Guide: Biomarkers and Isotopes in Petroleum and Earth History. Cambridge, United State: Cambridge University Press.
Peters, K. E., Scott Ramos, L., Zumberge, J. E., Valin, Z. C., Scotese, C. R., and Gautier, D. L. (2007). Circum-Arctic Petroleum Systems Identified Using Decision-Tree Chemometrics. Bulletin 91 (6), 877–913. doi:10.1306/12290606097
Peters, K. E., Hostettler, F. D., Lorenson, T. D., and Rosenbauer, R. J. (2008). Families of Miocene Monterey Crude Oil, Seep, and Tarball Samples, Coastal California. Bulletin 92 (9), 1131–1152. doi:10.1306/04180807113
Peters, K. E., Coutrot, D., Nouvelle, X., Ramos, L. S., Rohrback, B. G., Magoon, L. B., et al. (2013). Chemometric Differentiation of Crude Oil Families in the San Joaquin Basin, California. Bulletin 97 (1), 103–143. doi:10.1306/05231212018
Seifert, W. K., and Michael Moldowan, J. (1978). Applications of Steranes, Terpanes and Monoaromatics to the Maturation, Migration and Source of Crude Oils. Geochimica et Cosmochimica Acta 42 (1), 77–95. doi:10.1016/0016-7037(78)90219-3
Seifert, W. K., and Moldowan, J. M. (1980). The Effect of thermal Stress on Source-Rock Quality as Measured by Hopane Stereochemistry. Phys. Chem. Earth 12, 229–237. doi:10.1016/0079-1946(79)90107-1
Seifert, W. K., and Moldowan, J. M. (1986). Use of Biological Markers in Petroleum Exploration. Methods Geochem. Geophys. 24, 261–290.
Shi, B., Chang, X., Xu, Y., Wang, Y., Mao, L., and Wang, Y. (2020). Origin and Migration Pathway of Biodegraded Oils Pooled in Multiple-Reservoirs of the Chepaizi Uplift, Junggar Basin, NW China: Insights from Geochemical Characterization and Chemometrics Methods. Mar. Pet. Geology. 122, 104655. doi:10.1016/j.marpetgeo.2020.104655
Sinninghe Damsté, J. S., Kenig, F., Koopmans, M. P., Köster, J., Schouten, S., Hayes, J., et al. (1995). Evidence for Gammacerane as an Indicator of Water Column Stratification. Geochimica et Cosmochimica Acta 59 (9), 1895–1900. doi:10.1016/0016-7037(95)00073-9
Sumithra, V. S., and Subu, S. (2015). A Review of Various Linear and Non Linear Dimensionality Reduction Techniques. Int. J. Comp. Sci. Inf. Tech. 6 (3), 2354–2360.
Tao, K., Cao, J., Wang, Y., Mi, J., Ma, W., and Shi, C. (2020). Chemometric Classification of Crude Oils in Complex Petroleum Systems Using T-Distributed Stochastic Neighbor Embedding Machine Learning Algorithm. Energy Fuels 34 (5), 5884–5899. doi:10.1021/acs.energyfuels.0c01333
Tissot, B. P., and Welte, D. H. (1984). Petroleum Formation and Occurrence. New York: Springer-Verlag.
Volkman, J. K., Alexander, R., Kagi, R. I., Noble, R. A., and Woodhouse, C. W. (1983). A Geochemical Reconstruction of Oil Generation in the Barrow Sub-basin of Western Australia. Geochimica et Cosmochimica Acta 47 (12), 2091–2105. doi:10.1016/0016-7037(83)90034-0
Wang, Y.-P., Zhang, F., Zou, Y.-R., Zhan, Z.-W., and Peng, P. a. (2016). Chemometrics Reveals Oil Sources in the Fangzheng Fault Depression, NE China. Org. Geochem. 102, 1–13. doi:10.1016/j.orggeochem.2016.09.008
Wang, Y.-P., Zhang, F., Zou, Y.-R., Sun, J.-N., Lin, X.-H., and Liang, T. (2018a). Oil Source and Charge in the Wuerxun Depression, Hailar Basin, Northeast China: A Chemometric Study. Mar. Pet. Geology. 89 (3), 665–686. doi:10.1016/j.marpetgeo.2017.10.032
Wang, Y.-P., Zhang, F., Zou, Y.-R., Zhan, Z.-W., and Cai, Y. (2018b). Origin and Genetic Family of Huhehu Oil in the Hailar Basin, Northeast China. Acta Geochim 37 (6), 820–841. doi:10.1007/s11631-018-0288-1
Wang, Y.-P., Zhan, X., Zou, Y.-R., Rodriguez, C. G. V., and Liao, W. (2019). Chemometric Methods as a Tool to Reveal Genetic Types of Natural Gases - A Case Study from the Turpan-Hami Basin, Northwestern China. Pet. Sci. Tech. 37 (3), 310–316. doi:10.1080/10916466.2018.1542444
Wang, Y.-P., Zhan, X., Luo, T., Gao, Y., Xia, J., Wang, S., et al. (2020a). Oil Chemometrics and Geochemical Correlation in the Weixinan Sag, Beibuwan Basin, South China Sea. Energy Exploration & Exploitation 38, 2695–2710. doi:10.1177/0144598720950467
Wang, Y.-P., Zhan, X., Gao, Y., Wang, S., Xia, J., and Zou, Y.-R. (2020b). Chemometric Differentiation of Natural Gas Types in the Northwestern Junggar Basin, NW China. Energy Exploration & Exploitation 38 (6), 2128–2142. Unsp 0144598720913972. doi:10.1177/0144598720913972
Yang, H., Zhao, Z., Li, J., Liu, Y., Xu, J., and Xiao, L. (2009). An Anlysis of Petrleum Geology and Potential Exploration Targets in Wushi Sag. China Offshore Oil and Gas 21 (04), 227–231. (in Chinese with English abstract). doi:10.3969/j.issn.1673-1506.2009.04.003
Yang, H., Lian, J., and Hu, W. (2011). Structural Features and Impacts on Hydrocarbon Accumulation in Wushi Sag. J. Southwest Pet. Univ. (Science Tech. Edition) 33 (03), 41–46+191. 192. doi:10.3863/j.issn.1674-5086.2011.03.006
Yang, X., Hu, L., and Jin, Q. (2016). Analysis of Hydrocarbon Origin and its Accumulation Time in the Middle and East Zone of Wushi Sag. J. Northeast Pet. Univ. 40 (05), 9–17. (in Chinese with English abstract). doi:10.3969/j.issn.2095-4107.2016.05.002
Yuan, L., Kong, L., Zeng, X., Shang, J., Rao, Z., and Liu, D. (2020). The Major Faults and its Control on Hydrocarbon Distribution in the Wushi Sag. J. Shengli Coll. China Univ. Pet. 34 (04), 5–10. (in Chinese). doi:10.3969/j.issn.1673-5935.2020.04.002
Zhan, Z.-W., Lin, X.-H., Zou, Y.-R., Li, Z., Wang, D., Liu, C., et al. (2019). Chemometric Differentiation of Crude Oil Families in the Southern Dongying Depression, Bohai Bay Basin, China. Org. Geochem. 127, 37–49. doi:10.1016/j.orggeochem.2018.11.004
Zhang, L., Bai, G., Zhao, X., Zhou, L., Zhou, S., Jiang, W., et al. (2019). Oil-source Correlation in the Slope of the Qikou Depression in the Bohai Bay Basin with Discriminant Analysis. Mar. Pet. Geology. 109, 641–657. doi:10.1016/j.marpetgeo.2019.06.055
Zhao, Z., Wu, J., and Li, C. (2013). Sub-sag Sorting and Petroleum Distribution in Beibuwan Basin. Pet. Geology. Exp. 35 (03), 285–290. (in Chinese with English abstract). doi:10.11781/sysydz201303285
Keywords: Oil-Oil Correlation, Oil-Source Rock Correlation, Chemometrics, Wushi Sag, Beibu Gulf Basin
Citation: Wang Y-, Zhan X, Zhou X, Gao Y, Wang S, Xia J and Song Z (2022) The Geochemical Study of Oil-Oil and Oil-Source Rock Correlations in the Wushi Sag of the Beibu Gulf Basin, South China Sea. Front. Earth Sci. 10:850922. doi: 10.3389/feart.2022.850922
Received: 08 January 2022; Accepted: 10 February 2022;
Published: 04 March 2022.
Edited by:
Shuang Yu, Guangzhou Institute of Geochemistry (CAS), ChinaReviewed by:
Taotao Cao, Hunan University of Science and Technology, ChinaLu Hong, Guangzhou Institute of Geochemistry (CAS), China
Qingtao Wang, Guangzhou Institute of Energy Testing, China
Copyright © 2022 Wang, Zhan, Zhou, Gao, Wang, Xia and Song. This is an open-access article distributed under the terms of the Creative Commons Attribution License (CC BY). The use, distribution or reproduction in other forums is permitted, provided the original author(s) and the copyright owner(s) are credited and that the original publication in this journal is cited, in accordance with accepted academic practice. No use, distribution or reproduction is permitted which does not comply with these terms.
*Correspondence: Yao-Ping Wang, d2FuZ3lwQGdkb3UuZWR1LmNu