 Zhijie Zhu1,2*
 Songsong Guan1
- 1School of Mining, Liaoning Technical University, Fuxin, China
- 2State Key Laboratory of Coal Mining and Clean Utilization, Beijing, China
The research aims to improve prediction accuracy for heights of fractured water-conducting zones (FWCZs) and effectively prevent and control roof water disasters, to ensure safe coal mining. For this purpose, the method that integrates the improved cuckoo search (ICS) algorithm and extreme learning machine (ELM) is used to predict heights of FWCZs. Based on an analysis of factors influencing FWCZs, the ICS algorithm is employed to optimize two key parameters of the ELM model, the input weight ѡ and the bias b of hidden elements, thus establishing the ICS–ELM model for predicting the height of the FWCZ. The ICS–ELM model is trained using 42 measured samples, and the trained model is employed to predict the remaining six sample data points. The obtained prediction results show a relative error of only 3.97% and are more consistent with the actual situation. To verify the effectiveness of the model, the prediction results are compared with those of the adaptive particle swarm optimization based least squares support vector machine (APSO–LSSVM) and particle swarm optimization (PSO) based backpropagation (PSO–BP) models. The average relative errors of the two models are 8.21 and 9.75%, respectively, which further proves that the ICS–ELM model improves the accuracy of prediction results for heights of FWCZs. The heights of FWCZs predicted using the model are accurate and reliable, and the accuracy meets the requirements of engineering practice.
Introduction
With the advance of underground coal mining, the equilibrium of in-situ stress of strata overlying the roof of coal seams is broken, which causes caving, fracturing, and bending of the overlying strata, forming a caving zone, a fractured zone, and a bending subsidence zone (Dai et al., 2020). Therein, the caving zone and the fractured zone are collectively called a fractured water-conducting zone (FWCZ). If the FWCZ develops upwards to coalesce with an aquifer rich in water or meet surface water, the underground water inflow will increase abruptly, which poses threats to safe mining of coal mines, damages groundwater resources, and aggravates deterioration of the ecological environment in mining areas (He et al., 2021). The height of the water-conducting fracture zone also reflects the movement range of the overlying burden, which has certain guiding significance for the ground pressure behavior ((Zhu et al., 2022)). Therefore, determining the heights of FWCZs has become an important link in safe mining and ecological environmental protection (Bai et al., 2014; Bai and Li 2013; Bai et al., 2021; Bai et al., 2018).
Many studies have been conducted to predict the heights of FWCZs and the commonly used methods include theoretical calculation, empirical formulae, and in-situ measurement. These research findings are of certain theoretical and practical significance for predicting the heights of FWCZs formed due to coal mining. Based on the theory of plates and shells, (Zhu et al., 2020) predicted the heights of FWCZs and discussed the development process of an FWCZ in bedrock and loess strata. (Zhang et al., 2018) established a mechanical analysis model for the height of an FWCZ in overlying strata based on the elastic foundation beam theory. (Zhang 2019) used the fitted empirical formulas to predict height of the FWCZ. (Xu et al., 2012) developed a theoretical method for predicting the heights of FWCZs according to locations of key strata in overlying strata. (Wang et al., 2021) calculated the height of an FWCZ under influences of a fault using the mechanical model of beams and the numerical simulation. (Ti et al., 2021) built mechanics models for first fracture and periodic fracture of an elastic Winkler foundation beam based on the theory of key strata and investigated the failure and deformation processes in overlying strata. (Liu et al., 2020) observed the caving zone and fractured zone during failure of overlying strata in hydrogeological boreholes. (Yan 2015) adopted the observation method for losses of drilling fluid to observe the height of an FWCZ. Many researchers also used FLAC3D numerical simulation to determine height evolution of an FWCZ during mining of a working face (Liu et al., 2015; Liu, et al., 2021; Du and Gao 2017). They proposed a predictive method for the heights of FWCZs according to distribution of damaged zones in the model. (Liu et al., 2021) proposed an approach for detecting the damage height of overlying strata based on isotopic tracing. (He et al., 2020) established a non-linear predictive model for the height of FWCZs based on influencing factors, such as the height, through the multiple regression (MR) analysis. By building a mechanical model for damage evolution in overlying strata, (Guo et al., 2019a, Guo et al., 2019b) studied the mechanisms for first rock caving, breakage of overhung strata, and structural failure of rock blocks above coal seams. On this basis, they proposed a theoretical prediction method for the heights of FWCZs during fully-mechanized caving mining. (Chang et al., 2019) applied the transient electromagnetic (TEM) method to monitor the evolution of an FWCZ beneath a river after longwall mining. Among these methods, the in-situ measurement methods are accurate, while they are seldom used due to heavy workload, complex operation of equipment, and high cost. Methods based on empirical formulae involve few influencing factors, so they do not consider influences of other factors. Theoretical calculation assumes idealistic conditions, which does not tally with reality, so their results exhibit relatively large errors. The accuracy of numerical simulation is closely related to geological parameters of the established model, however, it is difficult to obtain these parameters accurately. As for geophysical exploration methods, such as electrical resistivity and microseismic monitoring, their accuracy is not high due to presence of multiple possible solutions, therefore, how to improve prediction accuracy is a difficulty in the height prediction of FWCZs (Bai and Shi 2017; Bai et al., 2020; Bai et al., 2019; Bai, Zhou, et al., 2021).
Machine learning has been applied to height prediction of FWCZs with the development of computer techniques. Meanwhile, numerous scholars have explored more accurate and efficient prediction models, in which predictive models based on support vector machine (SVM) and backpropagation neural network (BPNN) are most widely used. (Guo et al., 2014) established a model based on entropy weight attribute measure theory for predicting the heights of FWCZs. (Shao and Zhou 2018) built a prediction model for the heights of FWCZs based on a quantum genetic algorithm (QGA)–random forest regression (RFR) model. (Rezaei, 2018) developed an intelligent height prediction model for FWCZs based on the artificial neural network (ANN). (Yang et al., 2019) built a height prediction model for FWCZs based on the BPNN. (Hou et al., 2020) established such predictive models by combining the genetic algorithm (GA) and SVM. (Dai et al., 2020) proposed a predictive model for the heights of FWCZs based on MR model and BPNN. (Lou and Tan 2021) constructed a height-prediction model of FWCZs based on particle swarm optimization (PSO)–BPNN. (Chai et al., 2018) established a prediction model for the height of a FWCZ formed in overlying strata due to mining disturbance based on GA–support vector regression (SVR). Despite having strong non-linear identification ability, traditional ANN learning algorithms, including backpropagation (BP) network and SVM, also have shortcomings such as poor generalization, a slow learning rate, and a tendency to be trapped in local optima. Compared with traditional prediction models, including BPNN and SVM, the extreme learning machine (ELM) shows advantages such as fast learning, favorable generalization, and simple parameter selection (Guo et al., 2021; Huang et al., 2017).
When extreme learning machine deals with nonlinear problems, it is difficult to determine the network structure, which will lead to the problems of low algorithm accuracy and poor stability. In view of this, a predictive model for the heights of FWCZs based on the improved cuckoo search (ICS) algorithm–ELM is established to solve problems. By optimizing parameters of the ELM using the ICS, the research provides an effective method with which to predict heights of FWCZs.
Factors Influencing the Height of an FWCZ
Mining Depth
Burial depth of coal seams influences the original stress on the surrounding rocks. With the increase of burial depth within a certain range, the vertical and lateral stresses on the rock surrounding a working face increase as mining proceeds, which intensifies damage to the overlying strata of roofs and increases the height of the FWCZ. Beyond that range, fractures induced by mining are closed under the high in-situ stresses encountered at such depths, so that the height of the FWCZ decreases (Wang et al., 2018).
Dip Length of Working Faces
Geometrical parameters of a working face mainly refer to the strike length and dip length. Before coal mining reaches full subsidence under conditions of a fixed dip length, the heights of FWCZs constantly increase with the advance of working faces (until reaching their maximum subsidence). If the strike length is the same as the dip length, the height of a FWCZ is maximized and does not increase with the further advance of the working face. Under such conditions, the FWCZ forms a typical arch (Guo et al., 2019b).
Mining Thickness
Mining height of coal seams is a direct factor that influences development of FWCZs. Within a certain range, the overlying strata are gradually broken with further coal mining and the scope of plastic failure zones in the roof enlarges. As a result, the displacement and deformation of the roof increase and correspondingly the heights of FWCZs rise (Zhang et al., 2017).
Hard-Rock Lithology Proportional Coefficient
The uniaxial compressive strength and the structure type of roof strata both affect the heights of FWCZs. The two parameters are replaced with a new index, hard-rock lithology proportional coefficient, to characterize their relationship with the heights of FWCZs. Under conditions of similar mining thickness, the hard-rock lithology proportional coefficient shows an approximately linear increasing relationship with the heights of FWCZs (Chen and Zhu 2020).
Principles of Algorithms
Cuckoo Search Algorithm
The cuckoo search (CS) algorithm is a mathematical model proposed based on the breeding mode of cuckoos in nature (Tang and Xue 2019). Cuckoos are brood parasitic birds that do not raise their offspring. When cuckoos reproduce, they do not build nests and hatch eggs, but look for a host with similar eating habits, shapes and colors and then they quickly lay eggs when the host goes out for food. Only one egg is laid in each nest. Cuckoo eggs are similar in shape and size to other birds, so they are not easy to be identified by other birds. Young cuckoos have an instinct to push young birds of the host out of nests, so they can enjoy the food of the host bird alone and survive well. When the host bird finds the cuckoo offspring in its nest, it will abandon the nest or the cuckoo offspring.
The CS algorithm is based on three idealized assumptions (Gandomi et al., 2013):
(1) Each cuckoo lays only one egg at a time and randomly puts the egg into a nest;
(2) The best nest will be reserved for the next generation;
(3) The probability of cuckoo being found by the host is
Based thereon, the formula used to represent a cuckoo finding a nest for the next generation is given by:
Where,
ICS Algorithm
The specific process of the algorithm is shown as follows (Fan et al., 2021):
(1) Parameters of the algorithm are set. The objective function
(2) The location of the current-generation nest is updated. The locations of the nests in the current generation and previous generation
(3) The random number R is taken as the probability of the host of the nest to find other birds’ eggs. The random number is compared with the probability
(4) Whether the algorithm meets the set maximum number of iterations is judged. If satisfied, the search is ended and the global optimal value
The flow-chart through the ICS algorithm is displayed in Figure 1.
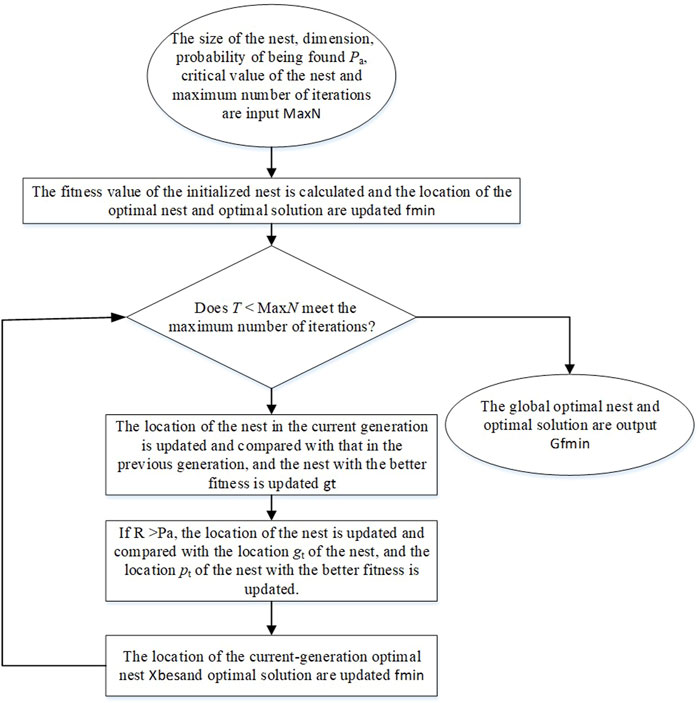
FIGURE 1. Flow-chart through the ICS algorithm.
ELM
Extreme learning machine (extreme learning machine) ELM is an easy-to-use and effective single-hidden layer feedforward neural network SLFNs learning algorithm. Traditional neural network learning algorithms (such as BP algorithm) need to manually set a large number of network training parameters, and it is easy to generate local optimal solutions. The extreme learning machine only needs to set the number of hidden layer nodes of the network, and does not need to adjust the input weights of the network and the bias of the hidden elements during the execution of the algorithm, and generates a unique optimal solution, so it has fast learning speed and generalization (Choudhury et al., 2013). The classic ELM structure is displayed in Figure 2.
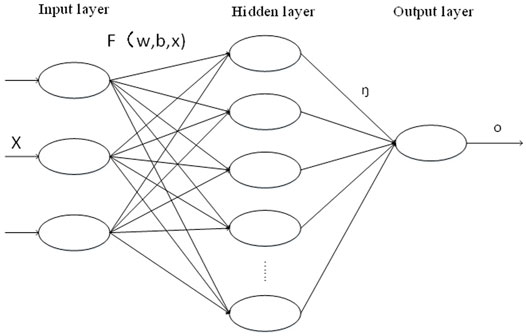
FIGURE 2. Classic ELM structure.
The ELM algorithm can be divided into five steps (Huang et al., 2012):
(1) Sample data are input.
(2) The input weight
(3) The output matrix H of the hidden layer is calculated.
(4) The weight matrix
(5) The predicted value is obtained.
It is assumed that there are N arbitrary samples
Where,
Establishment and Analysis of the ICS–ELM Model for Predicting Heights of FWCZs
Establishment of the Model
The flow-chart through the model is shown in Figure 3.
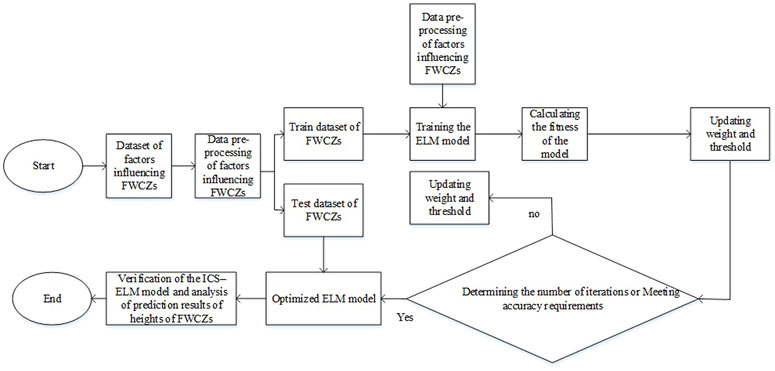
FIGURE 3. Flow-chart for predicting heights of FWCZs.
The calculation process is shown as follows:
(1) Data processing. It is supposed that there are N samples
Where,
(2) Initialization and fitness calculation. The maximum number of iterations, a relevant parameter in the ICS algorithm, is set to 200 and the maximum and minimum values of Pa are 0.5 and 0.1, respectively. The maximum and minimum values of a separately are 1.5 and 0.5. N,
(3) Model training. The training samples are substituted into the model. The optimization objective is to minimize the fitness function, and continuously optimize the model parameters with the ICS algorithm, thus establishing the optimal ICS–ELM model.
(4) Result prediction. The samples to be predicted are input into the trained ICS–ELM model with influencing factors and the predicted values are output, to analyze and verify the feasibility and accuracy of the results.
Model Analysis
The mining depth (H), dip length of working faces (L), mining thickness (M) and hard-rock lithology proportional coefficient (B) as main factors affecting heights of FWCZs are taken as input vectors. Heights of FWCZs (Hf) are output based on the ICS–ELM prediction model. In the research, 48 groups of sample data are collected, in which Groups 1–42 are taken as a training set, while Groups 43–48 are regarded as a test set (Table 1).

TABLE 1. Sample data: factors influencing the height of an FWCZ.
The input weight ѡ and bias b of hidden elements in the ELM model are two important parameters that directly affect the prediction results. Therefore, the ICS model is used to optimize these two important parameters. The number of iterations in the ICS algorithm is set to 100 and the optimized data are substituted into the model to train the training set. The trained values and actual values of each sample are shown in Figure 4. Favorable fitting effects can be observed, furthermore, six samples in the training set are predicted. Excellent regression prediction results are obtained by use of this scheme (Figure 5).
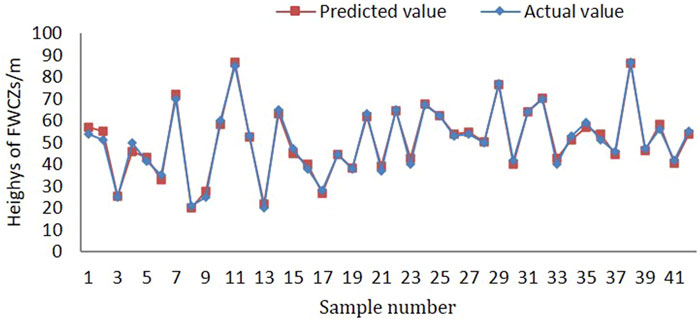
FIGURE 4. Comparison of prediction results of the training set based on the ICS–ELM model.
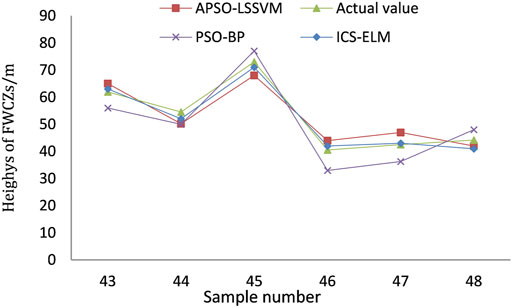
FIGURE 5. Comparisons of prediction results obtained by the APSO–LSSVM, PSO–BP and ICS–ELM models.
To verify the prediction accuracy of the ICS–ELM model for heights of FWCZs, the prediction results are compared with results obtained by adaptive particle swarm optimization based least squares support vector machine (APSO–LSSVM) and PSO based BP (PSO–BP) models. The prediction effects of them are shown in Figure 5 and Table 2.

TABLE 2. Prediction performance comparison of three models.
The root mean square error, mean absolute error, mean relative error and squared correlation coefficient of the ICS–ELM model is smaller than those of the other two models, and the obtained results are closer to the actual values. This indicates that the ICS–ELM model has stronger prediction performance for heights of FWCZs and wider applications.
Example Verification
The N102 working face of a coal mine in Shanxi province in China. The average thickness of the coal seam is 15.3 m and the inclination angle is 2°–3°. The inclination length and strike length of the working face are 193 and 1406 m. The full-mechanized caving mining method is adopted, the mining height is 3.9 m, and the coal caving height is 11.4 m. Most of the working face the roof strata above the working face most are hard sandstone.
The traditional empirical formula for the height of the water-conducting fracture zone is obtained by regression analysis of a large number of measured data under conventional mining conditions. The formula takes into account factors such as mining thickness, overlying rock type and coal seam inclination, and is widely used. The maximum height of the water-conducting fracture zone in the test collection shaft is calculated by using the calculation formula of the maximum influence height of the gob fault zone in GB51044-2014 Code for Geotechnical Engineering Investigation of Coal Mine Goaf. The calculation formula for the maximum height of the water-conducting fracture zone is shown in the Table 3.

TABLE 3. The formula for calculating the height of the water-conducting fracture zone.
Using the above formula, it is estimated that the height of the water-conducting fracture zone is 66.25–84.08 m. The ICS-ELM model is used to predict that the height is 78.34 m. The predicted value differs very little from the empirical formula. It shows that the height prediction model of the fully mechanized mining water-conducting fracture zone proposed in this paper is more realistic, and provides a scientific basis for the prediction and prevention of roof water damage.
Conclusion
(1) The two parameters, namely weight ѡ and bias b of hidden elements in the ELM model are optimized using the ICS algorithm, to establish the ICS–ELM model for predicting heights of FWCZs. This avoids influences of randomness of input weight matrix and bias of the hidden layer on the prediction accuracy of the ELM and improves prediction accuracy.
(2) By selecting 42 prediction samples for heights of FWCZs, the samples of heights of FWCZs are predicted and trained by using the ICS–ELM model and the predicted results are compared with those of APSO–LSSVM and PSO–BP models. The average error of the predicted results obtained by the proposed model is 3.97%, which is smaller than those of the other two algorithms. The predicted results are in line with the actual situations, so this model can accurately and effectively predict heights of FWCZs.
(3) The development of FWCZs is a complex movement and failure process of surrounding rock in time and space, and there are many influencing factors. In the future, the influencing factors such as mining speed, repeated mining, groundwater action, key strata action, etc. will be studied. Consider more influencing factors and increase the number of training samples to further improve the model’s performance.
Data Availability Statement
The original contributions presented in the study are included in the article/Supplementary Material, further inquiries can be directed to the corresponding author.
Author Contributions
ZZ contributed to the conception of the study. SG contributed significantly to analysis and manuscript preparation.
Funding
This work was supported by State Key Laboratory of Coal Mining and Clean Utilization (2021-CMCU-KF016) and Basic Scientific Research Projects of Universities in Liaoning Province (LJKZ0343).
Conflict of Interest
The authors declare that the research was conducted in the absence of any commercial or financial relationships that could be construed as a potential conflict of interest.
Publisher’s Note
All claims expressed in this article are solely those of the authors and do not necessarily represent those of their affiliated organizations, or those of the publisher, the editors and the reviewers. Any product that may be evaluated in this article, or claim that may be made by its manufacturer, is not guaranteed or endorsed by the publisher.
Acknowledgments
The assistance and guidance of the steering group members is gratefully acknowledged.
References
Bai, B., Guo, L., and Han, S. (2014). Pore Pressure and Consolidation of Saturated Silty clay Induced by Progressively Heating/cooling. Mech. Mater. 75, 84–94. doi:10.1016/j.mechmat.2014.04.005
Bai, Bing., Nie, Qingke., Zhang, Yike., Wang, Xiaolong., and Hu, Wei. (2021). 'Cotransport of Heavy Metals and SiO2 Particles at Different Temperatures by Seepage. J. Hydrol. 597 (2), 125771. doi:10.1016/j.jhydrol.2020.125771
Bai, Bing., Xu, Tao., Nie, Qingke., and Li, Pengpeng. (2020). 'Temperature-driven Migration of Heavy Metal Pb2+ along with Moisture Movement in Unsaturated Soils. Int. J. Heat Mass Transfer 153, 119573. doi:10.1016/j.ijheatmasstransfer.2020.119573
Bai, Bing., Yang, Guang-chang., Li, Tao., and Yang, Gao-sheng. (2019). 'A Thermodynamic Constitutive Model with Temperature Effect Based on Particle Rearrangement for Geomaterials. Mech. Mater. 139 (3), 103180. doi:10.1016/j.mechmat.2019.103180
Bai, Bing., Zhou, Rui., Cai, Guoqing., Hu, Wei., and Yang, Guangchang. (2021). 'Coupled Thermo-Hydro-Mechanical Mechanism in View of the Soil Particle Rearrangement of Granular Thermodynamics. Comput. Geotechnics 137 (8), 104272. doi:10.1016/j.compgeo.2021.104272
Bai, B., and Li, T. (2013). Irreversible Consolidation Problem of a Saturated Porothermoelastic Spherical Body with a Spherical Cavity. Appl. Math. Model. 37, 1973–1982. doi:10.1016/j.apm.2012.05.003
Bai, B., Rao, D., Xu, T., and Chen, P. (2018). SPH-FDM Boundary for the Analysis of thermal Process in Homogeneous media with a Discontinuous Interface. Int. J. Heat Mass Transfer 117, 517–526. doi:10.1016/j.ijheatmasstransfer.2017.10.004
Bai, B., and Shi, X. (2017). Experimental Study on the Consolidation of Saturated Silty clay Subjected to Cyclic thermal Loading. Geomech. Eng. 12, 707–721. doi:10.12989/gae.2017.12.4.707
Chai, Huabin., Zhang, Junpeng., and Yan, Chao. (2018). 'Prediction of Water-Flowing Height in Fractured Zone of Overburden Strata Based on GA-SVR. J. Mining Saf. Eng. 35, 359–365.
Chang, Shuai., Yang, Zhen., Guo, Changfang., Ma, Zhanyuan., and Wu, Xiang. (2019). Dynamic Monitoring of the Water Flowing Fractured Zone during the Mining Process under a River. Appl. Sciences-Basel 9 (1), 43.
Chen, Y., and Zhu, S. (2020). Determination of Caved and Water-Conducting Fractured Zones of "two Soft and One Hard" Unstable Coal Seam. Acta Geod Geophys. 55, 451–475. doi:10.1007/s40328-020-00300-w
Choudhury, T. A., Berndt, C. C., and Man., Z. (2013). An Extreme Learning Machine Algorithm to Predict the In-Flight Particle Characteristics of an Atmospheric Plasma Spray Process. Plasma Chem. Plasma Process. 33, 993–1023. doi:10.1007/s11090-013-9466-4
Dai, Song., Han, Bo., Liu, Shiliang., Li, Ningbo., Geng, Fei., and Hou, Xizhong. (2020). 'Neural Network-Based Prediction Methods for Height of Water-Flowing Fractured Zone Caused by Underground Coal Mining. Arabian J. Geosciences 13 (12). doi:10.1007/s12517-020-05505-5
Du, Feng., and Gao, Rui. (2017). 'Development Patterns of Fractured Water-Conducting Zones in Longwall Mining of Thick Coal Seams-A Case Study on Safe Mining under the Zhuozhang River. Energies 10 (11), 1856. doi:10.3390/en10111856
Fan, Yunsheng., Sun, Xiaojie., Wang, Guofeng., and Mu, Dongdong. (2021). 'Collision Avoidance Controller for Unmanned Surface Vehicle Based on Improved Cuckoo Search Algorithm. Appl. Sciences-Basel 11 (20), 9741. doi:10.3390/app11209741
Gandomi, A. H., Yang, X.-S., Alavi, A. H., and Amir Hossein, Alavi. (2013). Cuckoo Search Algorithm: a Metaheuristic Approach to Solve Structural Optimization Problems. Eng. Comput. 29, 17–35. doi:10.1007/s00366-011-0241-y
Guang-Bin Huang, Guang-Bin., Hongming Zhou, Hongming., Xiaojian Ding, Xiaojian., and Rui Zhang, Rui. (2012). Extreme Learning Machine for Regression and Multiclass Classification. IEEE Trans. Syst. Man. Cybern. B 42, 513–529. doi:10.1109/tsmcb.2011.2168604
Guo, Chao., Zhang, Hongwei., Song, Weihua., Chen, Ying., and Wu, Hao. (2014). Application of Entropy Weight Attribute Measure Theory for Predicting the Height of Water Flowing Fractured Zone. J. Saf. Sci. Tech. 10, 87–91.
Guo, W., Zhao, G., Lou, G., and Wang, S. (2019b). 'A New Method of Predicting the Height of the Fractured Water-Conducting Zone Due to High-Intensity Longwall Coal Mining in China. Rock Mech. Rock Eng. 52, 2789–2802.
Guo, W., Zhao, G., Lou, G., and Wang, S. (2019a). Height of Fractured Zone inside Overlying Strata under High-Intensity Mining in China. Int. J. Mining Sci. Tech. 29, 45–49. doi:10.1016/j.ijmst.2018.11.012
Guo, Zizheng., Shi, Yu., Huang, Faming., Fan, Xuanmei., and Huang, Jinsong. (2021). 'Landslide Susceptibility Zonation Method Based on C5.0 Decision Tree and K-Means Cluster Algorithms to Improve the Efficiency of Risk Management. Geosci. Front. 12. doi:10.1016/j.gsf.2021.101249
He, Changchun., Lu, Weiyong., Zha, Wenhua., and Wang, Fei. (2021). 'A Geomechanical Method for Predicting the Height of a Water-Flowing Fractured Zone in a Layered Overburden of Longwall Coal Mining. Int. J. Rock Mech. Mining Sci. 143, 5570884. doi:10.1016/j.ijrmms.2021.104798
He, X., Zhao, Y., Zhang, C., and Han, P. (2020). A Model to Estimate the Height of the Water-Conducting Fracture Zone for Longwall Panels in Western China. Mine Water Environ. 39, 823–838. doi:10.1007/s10230-020-00726-2
Hou, E., Wen, Q., Ye, Z., Chen, W., and Wei, J. (2020). Height Prediction of Water-Flowing Fracture Zone with a Genetic-Algorithm Support-Vector-Machine Method. Int. J. Coal Sci. Technol. 7, 740–751. doi:10.1007/s40789-020-00363-8
Huang, F., Huang, J., Jiang, S., and Zhou, C. (2017). Landslide Displacement Prediction Based on Multivariate Chaotic Model and Extreme Learning Machine. Eng. Geology. 218, 173–186. doi:10.1016/j.enggeo.2017.01.016
Liu, X., Fan, D., Tan, Y., Ning, J., Song, S., Wang, H., and et al, (2021). New Detecting Method on the Connecting Fractured Zone above the Coal Face and a Case Study. Rock Mech. Rock Eng. 54, 4379–4391. doi:10.1007/s00603-021-02487-y
Liu, X., Liu, H., Wan, Z., Wang, L., and Pei, H. (2021). Simulation Research of Water Flowing Fracture Zone of Overburden Strata in Fully Mechanised Caving Mining. Ijetm 24, 457–473. doi:10.1504/ijetm.2021.117299
Liu, X., Tan, Y., Ning, J., Tian, C., and Wang, J. (2015). The Height of Water-Conducting Fractured Zones in Longwall Mining of Shallow Coal Seams. Geotech Geol. Eng. 33, 693–700. doi:10.1007/s10706-015-9851-2
Liu, Yu., Liu, Qimeng., Li, Wenping., and Hu, Youbiao. (2020). 'Height of Mining-Induced Fractured Zones in Overlying Strata and Permeability of Rock with Nonpenetrative Fractures. Geofluids 2020, 8829263.
Lou, Gaozhong., and Tan, Yi. (2021). 'Prediction of the Height of Water Flowing Fractured Zone Based on PSO-BP Neural Network. Coal Geology. Exploration 49, 198–204.
Rezaei, M. (2018). Development of an Intelligent Model to Estimate the Height of Caving-Fracturing Zone over the Longwall Gobs. Neural Comput. Applic 30, 2145–2158. doi:10.1007/s00521-016-2809-3
Shao, Liangshan., and Zhou, Yu. (2018). Application of QGA-RFR Model in Prediction of Height of Water Flowing Fractured Zone. China Saf. Sci. Journal(CSSJ) 28, 19–24.
Tang, H., and Xue, F. (2019). Cuckoo Search Algorithm with Different Distribution Strategy. Ijbic 13, 234–241. doi:10.1504/ijbic.2019.100150
Ti, Zhengyi., Li, Jiazhen., Wang, Meng., Li, Xiaoyan., Jin, Zhupeng., Tai, Caiwang., et al. (2021). Fracture Characteristics and Zoning Model of Overburden during Longwall Mining. Shock and Vibration 2021, 2857750.
Wang, X., Zhu, S., Yu, H., and Liu, Y. (2021). Comprehensive Analysis Control Effect of Faults on the Height of Fractured Water-Conducting Zone in Longwall Mining. Nat. Hazards 108, 2143–2165. doi:10.1007/s11069-021-04772-z
Wang, Z., Wang, C., and Wang, Z. (2018). The Hazard Analysis of Water Inrush of Mining of Thick Coal Seam under Reservoir Based on Entropy Weight Evaluation Method. Geotech Geol. Eng. 36, 3019–3028. doi:10.1007/s10706-018-0520-0
Xu, Jialin., Zhu, Weibing., and Wang, Xiaozhen. (2012). New Method to Predict the Height of Fractured Water-Conducting Zone by Location of Key Strata. J. China Coal Soc. 37, 762–769.
Yan, Zhang. (2015). Research on the Height of Water-Flowing Fractured Zone under the Weak Roof Strata and Fully Mechanized Caving Condition. Adv. Mater. Res. 1092-1093, 1448–1454.
Yang, Liu., Xue-ru, Wen., Wu, Xiao-li., Pei, Li-xin., Yue, Chen., Liu, Bing., et al. (2019). 'Height Prediction of Water Flowing Fractured Zones Based on BP Artificial Neural Network. J. Groundwater Sci. Eng. 7, 354–359.
Zhang, C. (2019). The Height and Scope of Overburden Fractured Zone of Thick Coal Seam Based on Different Gob Behavior for a Case Coal Mine in China. Geotech Geol. Eng. 37, 3299–3311. doi:10.1007/s10706-019-00845-w
Zhang, Shuai., Tang, Shijie., Zhang, Dongsheng., Fan, Gangwei., and Wang, Zhen. (2017). 'Determination of the Height of the Water-Conducting Fractured Zone in Difficult Geological Structures: A Case Study in Zhao Gu No. 1 Coal Seam. Sustainability 9 (7), 1077. doi:10.3390/su9071077
Zhang, Yun., Cao, Shenggen., Gao, Rui., Guo, Shuai., and Lan, Lixin. (2018). 'Prediction of the Heights of the Water-Conducting Fracture Zone in the Overlying Strata of Shortwall Block Mining beneath Aquifers in Western China. Sustainability 10 (5), 1636. doi:10.3390/su10051636
Zhu, T., Li, W., Wang, Q., Hu, Y., Fan, K., and Du, J. (2020). Study on the Height of the Mining-Induced Water-Conducting Fracture Zone under the Q2l Loess Cover of the Jurassic Coal Seam in Northern Shaanxi, China. Mine Water Environ. 39, 57–67. doi:10.1007/s10230-020-00656-z
Keywords: height of fractured water-conducting zone, improved cuckoo search algorithm, extreme learning machine, model comparison, improved cuckoo search based extreme learning machine
Citation: Zhu Z and Guan S (2022) Prediction of the Height of Fractured Water-Conducting Zone Based on the Improved Cuckoo Search Algorithm–Extreme Learning Machine Model. Front. Earth Sci. 10:860507. doi: 10.3389/feart.2022.860507
Received: 23 January 2022; Accepted: 11 March 2022;
Published: 28 March 2022.
Edited by:
Faming Huang, Nanchang University, ChinaReviewed by:
Satyasis Mishra, Adama Science and Technology University, EthiopiaXiaohan Yang, University of Wollongong, Australia
Zhaohui Chong, China University of Mining and Technology, China
Copyright © 2022 Zhu and Guan. This is an open-access article distributed under the terms of the Creative Commons Attribution License (CC BY). The use, distribution or reproduction in other forums is permitted, provided the original author(s) and the copyright owner(s) are credited and that the original publication in this journal is cited, in accordance with accepted academic practice. No use, distribution or reproduction is permitted which does not comply with these terms.
*Correspondence: Zhijie Zhu, emh1emhpamllQGxudHUuZWR1LmNu