 Jia Guang-Pu
 Yang Guang
 Han Xue-Ying†
- College of Desert Control Science and Engineering, Inner Mongolia Agricultural University, Hohhot, China
Although scholars have conducted many studies on barchan dunes in deserts and sandy areas around the world, few studies have been conducted on the morphological characteristics and changes in movement patterns of barchan dunes in the Yamarak Desert, China. To assess the changes in and movement patterns of these dunes, As well as the impact on the wind-sand hazards and geohazards around the study area, we selected several typical barchan dunes of different sizes in the Yamarak Desert and measured and calculated their morphologies using a combination of a 3-D laser scanner (RIEGL VZ-2000) and remote sensing image interpretation. The results show that the average coverage of the barchan dunes in the Yamarak Desert was 37.19%. Moreover, 62.81% of this area was covered by interdune sites. The movement velocity of the barchan dunes in this study area was 0–20 m/a, with an average movement velocity of 8.45 m/a. Of these dunes, 44.18% were fast-dominated dunes, 37.20% were particularly fast-dominated dunes, and 18.62% were moderately fast-dominated dunes. The barchan dunes moved in the 95–130° direction, which was basically consistent with the main wind direction of the area. The determination and function fitting of the barchan dune morphology shows that the correlation coefficients between all of the morphological parameters are greater than 0.8, except for the degree of spread and the symmetry of the two wings. We suggest adding the influences of other factors affecting barchan dunes and dune chains in the Yamarak Desert in future studies and paying attention to new wind-sand hazards and geohazards in the downwind corridor.
Introduction
As a sub-discipline of geomorphology, wind and sand geomorphology specializes in the study of morphological features, spatial combinations of landforms, and their formation and evolution processes under the action of wind. The morphology and formation processes of wind-sand landforms are the core content of wind-sand geomorphology research; and its theoretical basis is that the process determines the morphology, and the morphology reflects the process (Tsoar, 1974; Lancaster, 1995; Dong Z. et al., 2011). Sandy landforms are landforms formed by wind erosion, transport, and accumulation of loose sand material on the surface, among which sand dunes are a common type of sandy landform (Wu, 1987).
Barchan dunes are evolved from shield-shaped sand dunes (Embabi and Ashour, 1993). Because the sand piles make the ground undulate, when the wind sand flows through the sand piles, the wind speed near the ground changes, which makes the air pressure distribution different. At the top of the sand pile, the wind speed is high and the air pressure is low. On the leeward slope, the wind speed is low and the air pressure is high. The airflow from the top of the sand pile and around the two sides of the sand pile generates eddy on the leeward slope of the sand pile, which accumulates the sand grains on the two sides behind the sand pile, forming horseshoe-shaped small depressions on the leeward slope of the sand pile. Sand dunes are an important, unique, and complex ecological, topographic, and physical system (Bagnold, 1941; Pye and Tsoar, 1990; Lancaster, 1995; Joanna and Nield, 2008; Parteli et al., 2009; Reffet et al., 2010; Goudie and Viles, 2014; Lorenz and Zimbelman, 2014). About 20% of the desert area is covered by sand dunes, some of which endanger human settlements, agricultural land, and roads (Dong Z. B. et al., 2011). Their movement is also a major form of desertification movement in addition to desert spreading and dust storms. Sand dune morphology and distribution characteristics are the products of the interactions and dynamic balance between the regional wind, sand sources, and plants, and they are important for discerning regional wind conditions, changes in the sand transport potential, and research on sand dune dynamics (Arens et al., 2004).
The morphology and dynamics of sand dunes depend on the wind direction, wind speed, and inflowing sand (Alvarez and Franklin, 2019). Sand dunes refer to the landform of sand dunes formed by the transportation and accumulation of wind. According to the shape, it can be divided into barchan dunes and dune chains, longitudinal dunes, honeycomb dunes, parabolic dunes and so on, and according to the degree of flow, it can be divided into fixed dunes, semi-fixed dunes and mobile dunes. Barchan dunes are the most common type of dune morphology. Barchan dunes are formed under the influence of unidirectional winds, low sand sources, and sparse vegetation, with a crescent-shaped planar shape, wing angles pointing downwind, and an inner slip surface (Reitz et al., 2010), and they are the most widely distributed and simplest type of wind-sand landform in deserts worldwide (Herrmann and Sauermann, 2000; Andreotti et al., 2002a; Hersen, 2004; Hersen and Douady, 2005; Andreotti and Claudin, 2007; Parteli et al., 2007; Durán et al., 2009; Durán et al., 2010; Burrough et al., 2012). The formation and development of the wind-sand interactions, evolutionary mechanism, and dune distribution have received wide attention from the wind-sand physics community. A wide range of scholars have studied and explored the morphology and distribution patterns, sediment composition, and dynamic processes of sand dunes (Yizhaq et al., 2004). The research methods mainly include field measurements, remote sensing image analysis, numerical simulation and theoretical analysis, wind tunnel simulations of wind-sand environments, and underwater simulations (Assis and Franklin, 2020; Alvarez and Franklin, 2017; Alvarez and Franklin, 2020; Bacik et al., 2020; Yang et al., 2020; Ling et al., 1998; Hersen et al., 2002; Ren et al., 2010; Qu et al., 2011; Jiao et al., 2013; Hanoch et al., 2018; Zhang et al., 2018; Zhou et al., 2019; Alvarez and Franklin, 2019; Zhang et al., 2019; Zhang et al., 2014). Studying the movement and morphology of barchan dunes in desert areas has practical significance for sand control.
As a type of moving dune, the movement direction of barchan dunes can indicate the direction of the surface material transport and the movement speed can be used to estimate the quantity of sand material transport, all of which provide important reference indicators for wind and sand control projects (Dong et al., 2008; Wang et al., 2009; Diniega et al., 2010; Koprowski et al., 2010; Bristow et al., 2019; Zhu et al., 2021; Tsoar et al., 2004). The study area of this project was the Yamarak Desert, which is located in the territory of the Alashan League. This area has a long distribution range and a dune morphology dominated by barchan dunes and barchan dune chains. A large number of independent barchan dunes are distributed in the interior of the desert. Studying the formation mechanism of the desert, the morphological structure of the dunes, and the migration pattern of the dunes is of great value (Yang et al., 2019; Zhou et al., 1990; Zhu et al., 1964). With the improvement of modern monitoring technology, remote sensing images are gradually applied in the fields of geological landslide monitoring (Huang et al., 2021), landslide sensitivity prediction (Zhu et al., 2021), risk assessment (Huang et al., 2020), desert environment monitoring and so on. However, remote sensing images can usually only be used to monitor parameters such as the location and shape of dunes, and satellite images or aerial images cannot be used to directly determine the surface area of dunes, dune volume, dune height, and dune migration rate.
In this study, a dune digital elevation model (DEM) was constructed using field measurements and high-definition remote sensing images from past years. The dune related parameters were extracted, the correlations between parameters were established, and the dune migration pattern in the Yamarak Desert was explored. The results of this study provide a theoretical basis and technical support for remote sensing dune monitoring and rapid 3-D simulation of dunes, as well as a reference for sand damage management.
Study Area
Meteorological Conditions and Location
The Yamarak Desert (103°50′48″–105°27′28″ E, 39°35′23″–41°2′45″ N) is located on the northeastern part of the Alashan Plateau (Figure 1), northwest of the Helan Mountains. The topography is high in the east and low in the west. It is about 186 km long from east to west and 10–30 km wide from north to south, covering an area of 5,600 km2. Mobile dunes account for about 80% of this area and fixed and semi-fixed dunes account for 20%. The dune morphologies mainly include independent barchan dunes, barchan dune chains, and monopolies, followed by undulating sands. The climate of the region is controlled by the westerly circulation all year round. The area has a typical mid-temperate continental climate with scarce precipitation, an annual average precipitation of 102.9 mm, an annual maximum precipitation of 150.3 mm, an annual minimum precipitation of 33.3 mm, an annual average temperature of 7.8°C, an absolute maximum temperature of 39°C, an absolute minimum temperature of −29.6°C, an annual average evaporation of 2258.8 mm, and a frost-free period of 168 days. The daylight hours are 3,181 h, the solar radiation is 150 kcal/cm2, the prevailing wind direction is southwest, the main harmful wind is the northwest wind, the weather is windy, the annual average wind speed is 4.1 m/s, and wind and sand hazards are the main natural disasters. The light and heat resources are abundant, and the development of agriculture has potential advantages.
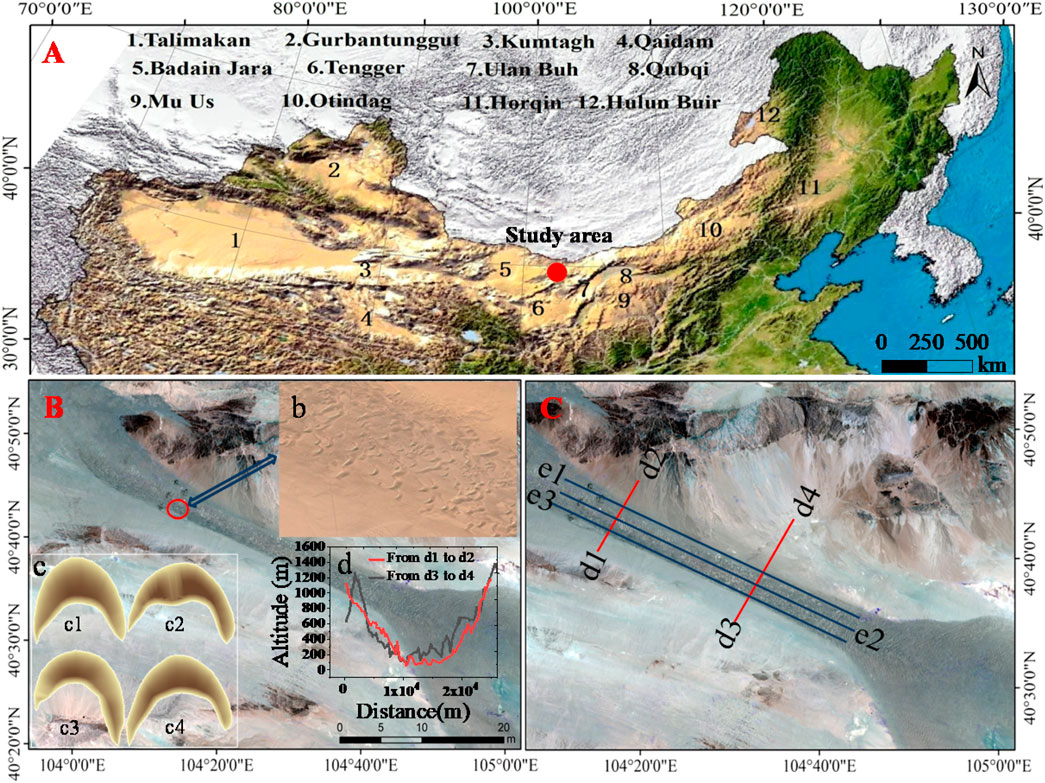
FIGURE 1. The location of the study area and the types of dunes. Note: panel (A) shows the specific location of the study area, panel (B) shows the main types of sand dunes in the study area, and panel (C) shows that the topography of the sub-marek desert is high on both sides and low in the middle, forming a “narrow pipe”-like appearance.
Vegetation Condition
The vegetation is mainly gravelly and sandy gravelly desert vegetation, and the plant species are mainly cathead spurge, small-leaved anemone, small-fruited white spurge, white sand artemisia, and sand needle grass. In addition, there are also valuable ancient relic species such as the national protected Mian Thorn and Bacopa monnieri plants (Yang et al., 2016).
Methods
Dune Density Determination
The barchan dune morphology in the study area is mainly divided into three types (Herrmann et al., 2005; Parteli et al., 2014; Tsoar and Parteli, 2016) (Figure 1B): symmetric barchan (c1), bimodal dunes (c2), and Seif dunes (c3 and c4). Two profile lines (d1–d2 and d3–d4) were selected using high-resolution remote sensing images of the desert area, with the DEM perpendicular to the desert direction as the reference elevation; and the topographic variations in the desert and on both sides were extracted using the profile analysis tool in ArcGIS15.0 (Figure 1C). As can be seen from Figure 1C, the topography along profiles d1–d2 and d3–d4 is low in the middle and high on both sides. The Malagai Mountains and the Yingen Ula Mountains are to the northeast of the desert, and the Alaten Mountains are to the southwest of the desert (Ning and Wang, 2018), resulting in the location of the Yamarak Desert serving as a ventilation corridor, and its northwest trend is consistent with the trend of the Badain Jaran Desert, which provides a rich source of sand material for the formation of this desert.
Three sample lines (e1, e2, and e3) were laid out along the northwest-southeast direction in the desert using satellite images from China Resources III-02 acquired in 2019. The lengths of the three sample lines were measured, and the lengths of each barchan dunes were measured. The cumulative lengths of the dunes were calculated on each sample line, the dune density on each sample line was calculated according to the cumulative lengths of the dunes, and the dune density on the three sample lines was calculated. The average density of the dunes on the three sample lines was taken as the average density of the Yamarak dunes, which is given by the following equation:
where
Morphological Characteristics of Barchan Dunes
The morphological characteristics of the barchan dunes in the study area were used to select different morphological feature discriminative parameters and to establish quantitative feature discriminative indexes for the barchan dunes. According to the definition in Figure 2C, the morphological parameters of barchan dunes are described. The extracted parameters include the inner arc length of the dune (Li), the outer arc length of the dune (Lo), the ridge length of the dune (Lr), the projected width of the dune (L), the dune height (H), the chord length of the dune (Lc), the expansion degree of the two wings (De), the symmetry degree of the two wings (Ds), the projected area of the dune (Ap), the surface area of the dune (As), and the volume of the dune (V). The degree of symmetry of the two wings = [(distance from the left measured point to the reference point) − (distance from the right measured point to the reference point)]/2.
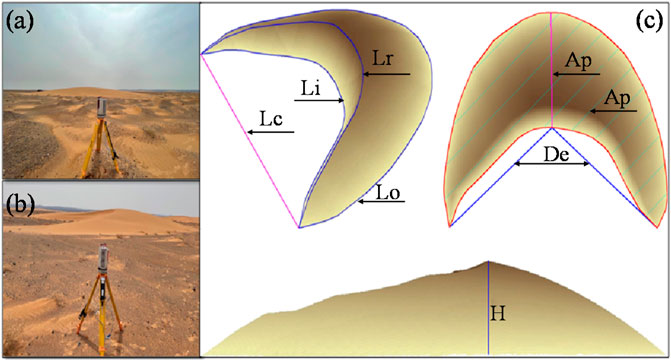
FIGURE 2. Schematic diagram of the extraction of the morphological parameters of the barchan dunes. Panel (A,B) represents the field measurement of sand dunes, and panel (C) represents the schematic diagram of morphological parameters of sand dunes.
Determination of Morphological Characteristics of Barchan Dunes
The RIEGL VZ-2000 was used to measure the barchan dunes in the Yamarak Desert at a distance of over 2000 m, with a target reflectivity of ≥90%, a laser emission frequency of up to 950 kHz, a scanning field of view of 100° × 360°, and scanning parameters, including the field of view, laser emission frequency, and effective measurement frequency. All of these parameters can be set. The fixed period was from 2013 to 2019, and a total of 74 barchan dunes were measured. First, color-corrected control points were placed in different parts of the dunes, a 3-D laser geomorphology scanner was placed in the inter-dune area to scan the morphological features of the dunes, and the scanned data were imported into the Riscan pro laser point cloud processing software for pre-processing data stitching and post-processing, including denoising, vector data creation, feature point (line) retention, vegetation filtering, data thinning, and datum point generation. Then, the pre-processed point cloud data were imported into the ArcGIS15.0 software to create a DEM map of the barchan dunes. Finally, the 3-D analysis module in ArcGIS15.0 was used to extract the morphological parameters of the dunes and to create Figures 2A,B. The 3-D laser geomorphology scanner measurements of the barchan dunes in the Yamarak Desert were obtained in situ.
Correlation Analysis and Movement Rule
MATLAB was used to correlate the extracted morphological parameters of the dunes; and based on the results, Origin2017 Pro was used to fit the morphological parameters to each other. The typical independent barchan dunes were selected, and Google Earth was used to extract the locations of the dunes in different years and to calculate the dune movement direction and the average annual movement distance of each dune (d). According to the dune movement grading method of (Zhu et al., 1981), the dune movement speed in the Yamarak Desert was classified into four classes: slow (<1 m/a), moderate (1–5 m/a), fast (>5–10 m/a), and especially fast (>10 m/a). The average annual movement rate of the dune was fitted to the dune height, dune projection area, and dune volume using Origin2017 Pro.
Results
Description and Analysis of the Shape and Density of Barchan Dunes
Using field data and remote sensing data, descriptive statistics on the shape and density of barchan dunes are carried out respectively. Understanding and mastering the overall situation of dunes in the study area is more conducive to the subsequent study and classification of barchan dunes.
The Data Characteristics of Parameters of Barchan Dunes
Since some of the dunes in the study area did not exhibit the typical characteristics of barchan dunes due to fusion or separation effects with each other, which caused the original dunes to become larger dunes or dune chains, the dunes that exhibit the typical characteristics of barchan dunes were selected for the study in dune selection process, and the Origin2017 Pro data analysis software was used to perform descriptive statistical analysis of the parameters and to obtain a preliminary understanding of the dune morphology, including the distribution, degree of dispersion, outliers, anomalies, and extreme values of the parameters.
As can be seen from Table 1, the data characteristics of the parameters of the barchan dunes were analyzed. As can be seen from the results shown in Figure 3A, the distribution span of Li is 687.26 m, the minimum value is 124.31 m, and the maximum value is 811.57 m, which is mainly due to the formation of large dunes via mutual fusion between adjacent dunes through wind and sand action. The standard deviation of the Li values is 179.68 m, which indicates that most of the arc lengths within the dunes differ significantly from the mean value, and their distributions are more dispersed. The skewness of the Li values is 0.79, indicating that the symmetric distribution form of Li is right skewed, and the tail trails farther on the right side. The kurtosis of the Li values is −0.28, indicating that the steepness of the arc lengths within the dunes is flatter than the normal distribution form. As can be seen from Figure 3B, the distribution span of Lo is 971.64 m, the minimum value is 236.86 m, and the maximum value is 1208.50 m. The main reason for this is also dunes fusing with each other to form larger dunes. The standard deviation of the Lo values is 273.52 m, which indicates that its distribution is more dispersed. The skewness of the Lo values is 0.56, which indicates that the symmetric distribution form of the dunes’ outer arc lengths is right skewed. The kurtosis of the Lo values is −0.78, which indicates that the steepness of the arc length inside the dune is flatter than the normal distribution form.
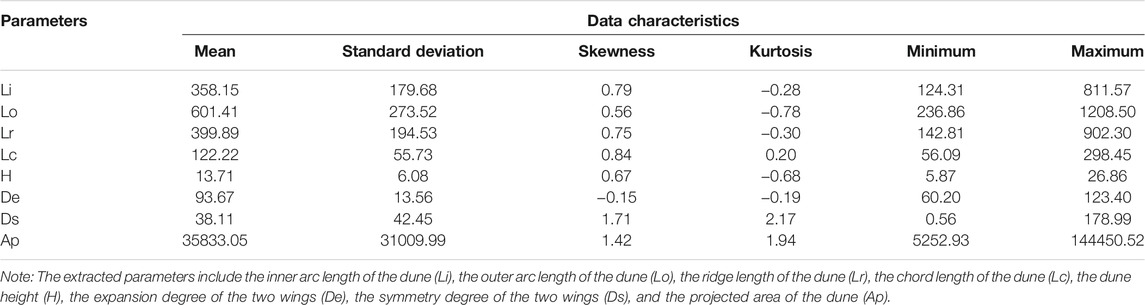
TABLE 1. Morphological parameter data characteristics of crescent-shaped sand dunes.
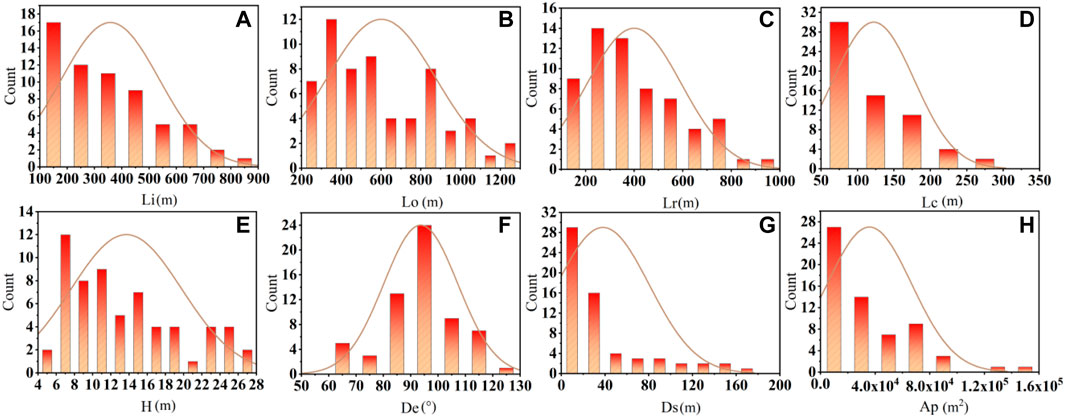
FIGURE 3. Descriptive analysis of the morphological parameters of the crescent-shaped sand dunes.
As can be seen from Figures 3C–H, the data distributions of the parameters Lr, Lc, H, De, Ds, and Ap span 759.49 m, 242.36 m, 20.99 m, 63.20 m, 178.43 m, and 139197.59 m2, respectively, which is also mainly due to the fusion or separation effects between dunes. The standard deviations of the values of the parameters Lr, Lc, H, De, Ds, and Ap are 194.53 m, 55.73 m, 6.08 m, 13.56 m, 42.45 m, and 31009.99 m2, respectively, indicating that their data distributions are more dispersed. The skewness values of the parameters Lr, Lc, H, De, Ds, and Ap are 0.75, 0.84, 0.67, −0.15, 1.71, and 1.42, respectively, indicating that their data are symmetrically distributed, except for parameter De; and the symmetric distribution of which is right-skewed, except for the parameter Lr. The kurtosis values of the parameters Lr, Lc, H, De, Ds, and Ap are −0.30, 0.20, −0.68, −0.19, 2.17, and 1.94, respectively, indicating that the steepness of Lr, H, and De is flatter than the normal distribution form, and the steepness of Lc, Ds, and Ap is steeper than the normal distribution form.
Descriptive Analysis of Dune Density
Before the correlation analysis of each dune parameter was performed, the abnormal values of each parameter needed to be removed. As can be seen from Figure 4, the lower and upper ends of the box represent Q1 and Q3, respectively, and the spacing between them (i.e., the interquartile range, IQR) represents 50% of the values falling between the IQR. When the spacing between the values and Q3 exceeds 1.5 times the IQR, the value is identified as abnormal data and is rejected or specially treated. As can be seen from Figures 4G,H, for parameters De and Ap, six and two data points were eliminated, respectively, before performing the correlation analysis.
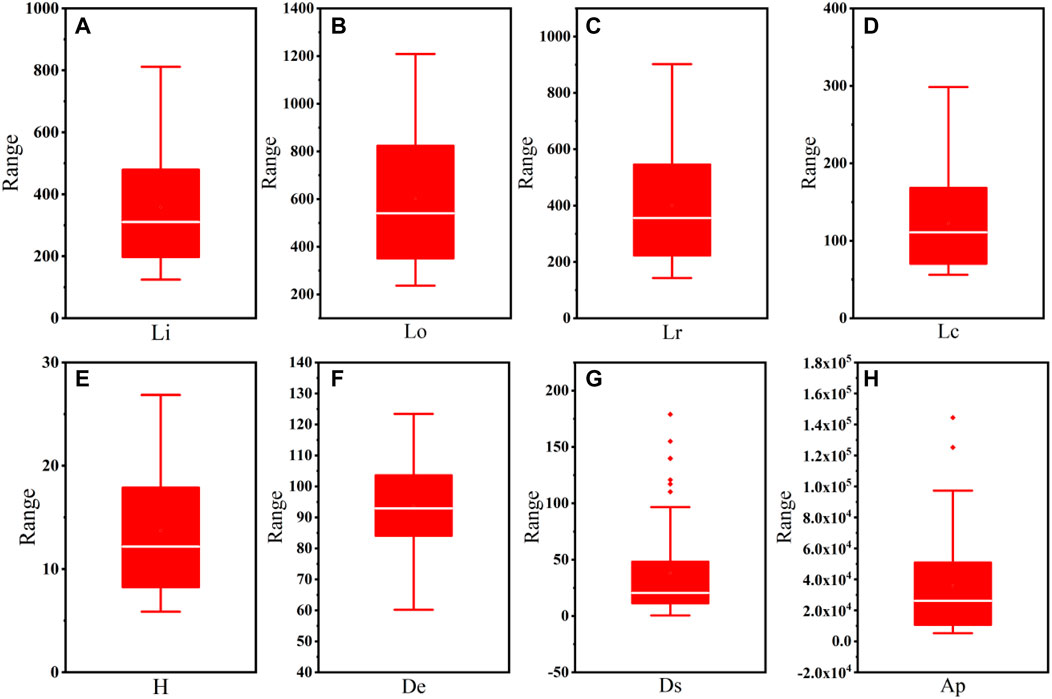
FIGURE 4. Box line diagram of the morphological parameters of the crescent-shaped sand dunes.
As can be seen from Table 2, the dune coverage in the desert was determined using the sample line method. The lengths of sample lines d1, d2, and d3 were 59022.03 m, 58961.47 m, and 59264.54 m, respectively, the cumulative lengths of the dunes on these sample lines were 22587.03 m, 22113.14 m, and 17657.7 m, respectively, and the cumulative lengths of the dunes on these sample lines accounted for 38.27%. The average coverage of the barchan dunes in this desert was 37.19%. Moreover, 62.81% was covered by interdune land covered with low and sparse shrubs and a large amount of coarse gravel, which was also an important factor in the barchan dunes remaining independent.
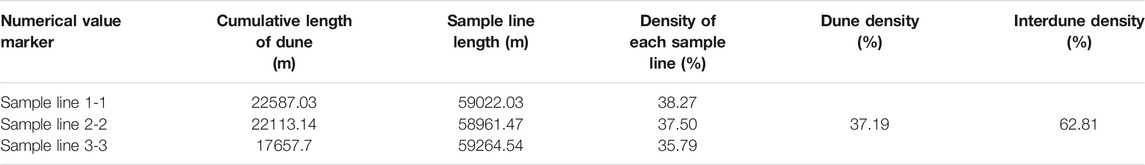
TABLE 2. Dune density and interdune bottomland density.
Dependence Between Various Morphological Parameters of the Sand Dunes
The correlation analysis results for the morphological parameters of the dunes are shown in Figure 5. It can be tentatively concluded that the correlation coefficients of parameters De and Ds are less than 0.2, while the correlation coefficients between De and Ds and the rest of the parameters are less than 0.6. Excluding De and Ds, the correlation coefficients between the other morphological parameters are very strong (>0.8).
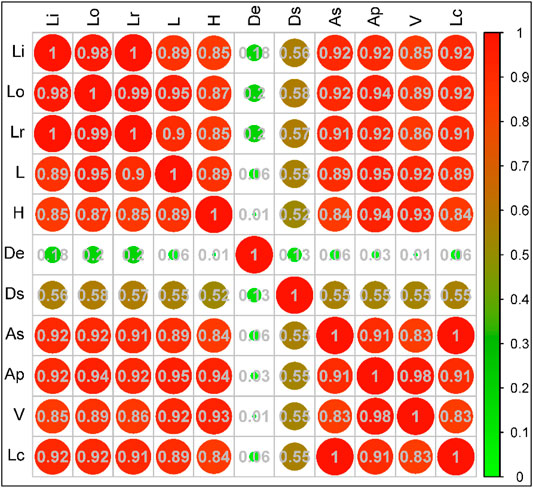
FIGURE 5. Correlation analysis of the morphological parameters of the sand dunes.
The results of the function fitting relationship of the morphological parameters of the sand dunes are shown in Figure 6. The extracted morphological parameters of the measured dunes were plotted, and it was found that Lo and Lr both exhibit smaller power function trends with increasing Li, with R2 values of 0.9545 and 0.9965, respectively (Figure 6A). The correlations between Li and L and between Li and H exhibit a small decreasing trend, with R2 values of 0.7425 and 0.6772, respectively (Figure 6B). There is a decreasing power function trend between parameters Li and Lc, with an R2 value of 0.7425, and there is an increasing power function trend between Li and V, with an R2 value of 0.8383 (Figure 6C). There are increasing power function trends between Li and both Ap and As, with R2 values of 0.8298 and 0.8470, respectively (Figure 6D). There are decreasing power function trends between Lo and both L and H, with R2 values of 0.8788 and 0.7153, respectively (Figure 6E). There are increasing power function trends between Lo and both Ap and As, with R2 values of 0.9618 and 0.9609, respectively (Figure 6F). There are decreasing function trends between Lr and both L and H, with R2 values of 0.8336 and 0.8457, respectively (Figure 6G).
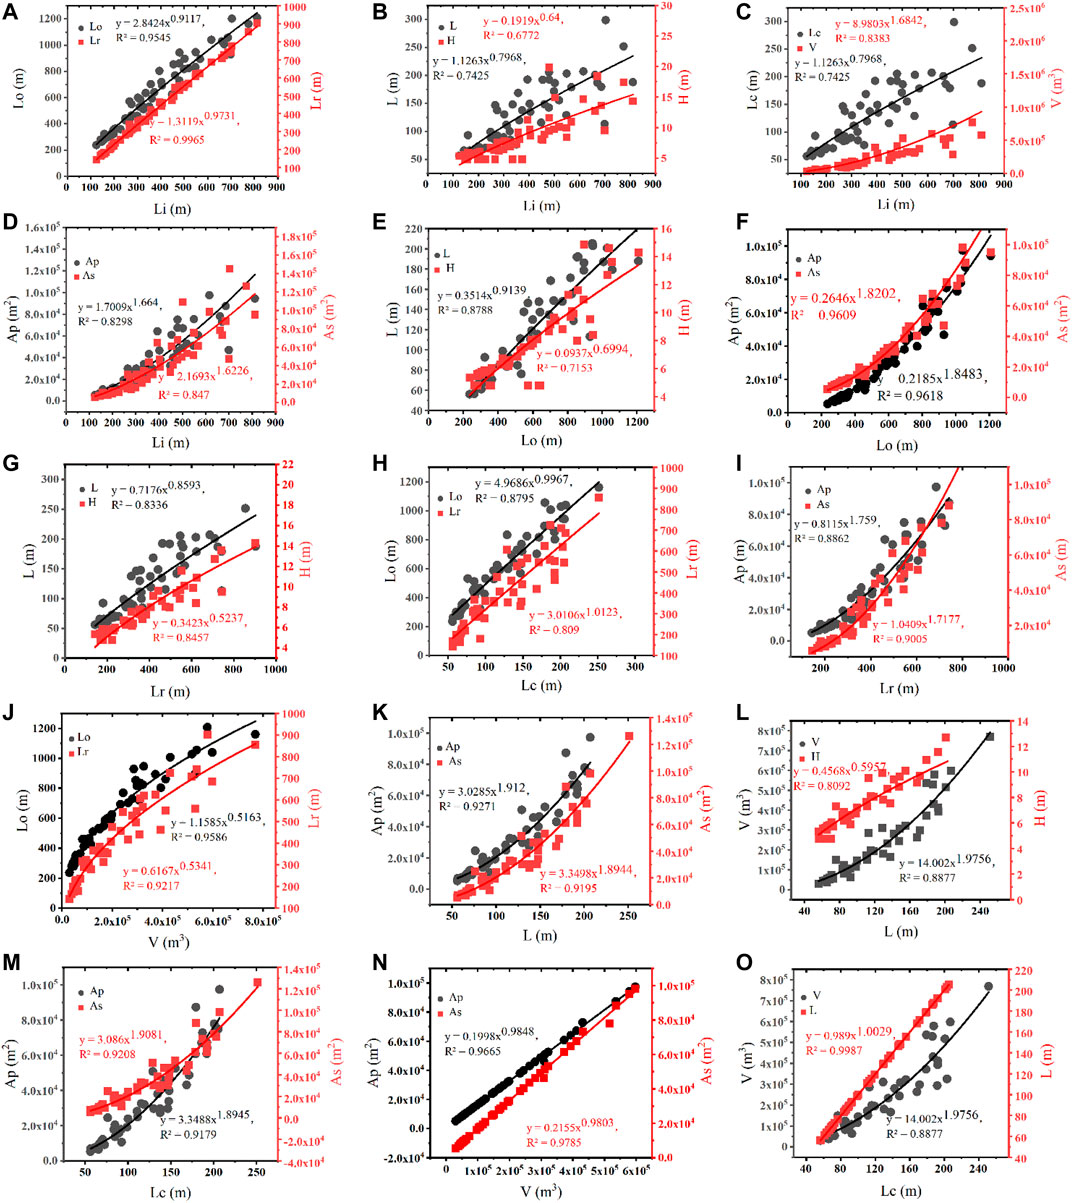
FIGURE 6. Correlations between the various morphological parameters of the sand dunes.
There is a decreasing power function trend between Lc and Lo, with an R2 value of 0.8795, and there is an increasing power function trend between Lc and Lr, with an R2 value of 0.8090 (Figure 6H). There are increasing power function trends between Lr and both Ap and As, with R2 values of 0.8862 and 0.9005, respectively (Figure 6I), showing a good fitting relationship. There are decreasing power function trends between V and both Lo and Lr, with R2 values of 0.9586 and 0.9217, respectively (Figure 6J). There are increasing power function trends between L and both Ap and As, with R2 values of 0.9271 and 0.9195, respectively (Figure 6K). There is an increasing power function trend between L and V, with an R2 value of 0.8877, and there is a decreasing power function trend between L and H, with an R2 value of 0.8092 (Figure 6L). There are increasing power function trends between Lc and both Ap and As, with R2 values of 0.9179 and 0.9208, respectively (Figure 6M). There are decreasing power function trends between V and both Ap and As, with R2 values of 0.9665 and 0.9785, respectively (Figure 6N). There are increasing power function trends between Lc and both V and L, with R2 values of 0.8877 and 0.9987, respectively (Figure 6O).
Relationship Between Velocity and Shape Parameters
Barchan dunes of different sizes in the Yamarak Desert were selected, and the rate of the dune movement was calculated by measuring the distance travelled by the dunes using surrounding fixed points (brazier or scrub) as references. By calculating the movement rate of the dunes, the percentage of the dunes that moved predominantly fast was found to be 44.18%, the percentage of dunes that moved especially fast was 37.20%, and the percentage of dunes that moved at moderate speed was 18.62%. The overall average movement rate of the dunes was 8.45 m/s. The width of the dunes ranged from 50 to 250 m, the volume of the dunes ranged from 0.5 × 10⁵ to 8 × 10⁵ m3, the height of the dunes ranged from 5 to 13 m, and the direction of movement of the dunes ranged from 95° to 130°. As can be seen from Figure 7, the movement rate of the dune exhibited a gradually decreasing power function trend increasing dune width, with an R2 value of 0.6678. The rate of movement of the dunes exhibited a gradually decreasing power function with increasing dune volume, with an R2 value of 0.7708. The rate of movement of the dunes exhibited a gradually decreasing power function with increasing dune height, with an R2 value of 0.6990.
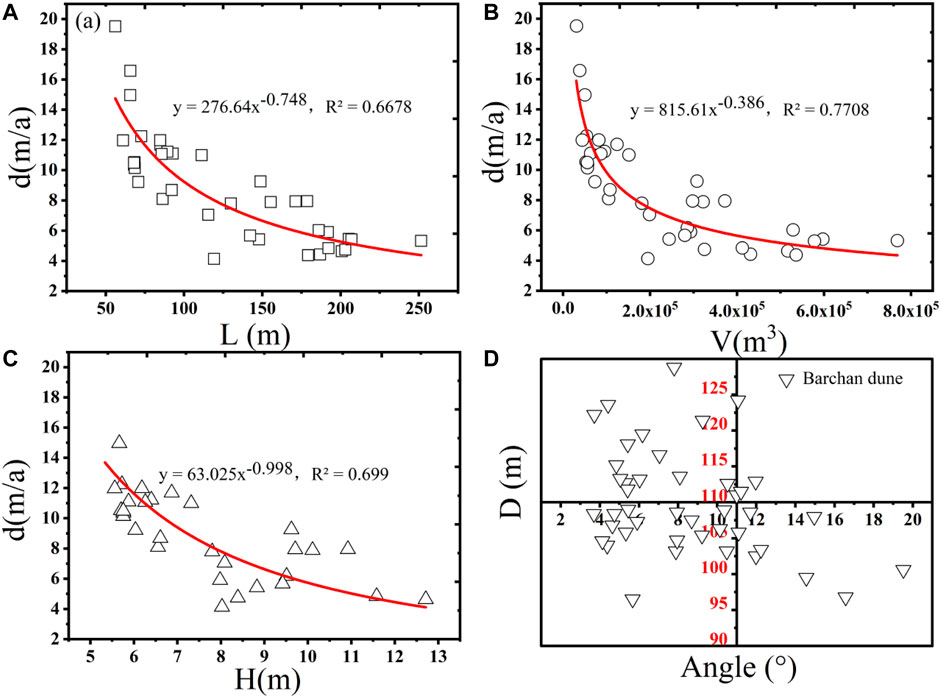
FIGURE 7. The correlations between the length of the dune, the height of the dune, the volume of the dune, and the direction of movement.
Discussion
Effects of External Factors on Crescent Dunes
According to previous research results, barchan dunes are the most basic type of landforms in wind and sand landscapes, and their movement characteristics have received wide attention from scholars at home and abroad (Zhao et al., 1993; Li, 1994; Stam, 1997; Andreotti et al., 2002b; Wu et al., 2011). Barchan dunes are one of the fastest moving dune types. their movement direction can indicate the migration direction of sand materials, and their movement speed can characterize the loss of sand materials, which can be used as the main reference index for wind and sand fixation projects. The movement of barchan dunes is influenced by many factors, including the abundance of sand sources, vegetation coverage, topographic relief, wind conditions, and human activities (Yizhaq et al., 2007). In addition, the study methods and scale of the dune movement are different. The study area is mostly vegetated scrub and inter-dune bottomland, except for sand dunes (62.81% coverage), which is one of the important factors slowing down the dune movement.
Some scholars believe that barchan dune movement is a constant equilibrium state (Hersen, 2004), while others believe that barchan dune movement is a non-equilibrium state that is mainly controlled by the two wing angles of the dune and the stable polygon formed at the top of the dune (El belrhiti and Douady, 2011). However, some scholars believe that barchan dune movement is an always changing process (Yang et al., 2014) and is a geomorphic activity controlled by multiple factors, the change of any one of which will directly affect the morphology of the barchan dune.
Influence of Internal Factors on Crescent Dunes
According to the results of this study, the correlation coefficients among the morphological parameters of the barchan dunes indicate that they are closely related, except for the correlation coefficients between the degree of spread and the symmetry of the two wings and the other parameters, which are less than 0.6. The correlation coefficients between the other parameters are greater than 0.8. The dunes were analyzed using actual field measurements, and the rate of the movement of the barchan dunes in the study area was mainly affected by the barchan dune body itself. As the width, height, and volume of the dune increased, the rate of dune movement gradually decreased, which is consistent with the results of previous studies. However, the dunes are mainly barchan dunes and barchan dune chains, and there are a large number of independent barchan dunes in the interior of the desert, which is connected to the Badain Jaran Desert in the northwest and the Tengger Desert and Ulanbu Desert in the southeast. If we cannot determine the rule of the movement of the sand dunes in this area as soon as possible and adjust the corresponding control measures in time, the drifting sand will surely devour the pastures, salt fields, farmland, and other places, and it will also cause new wind and sand threats to the downwind part of the Hexi Corridor, Ningxia Plain, Hetao Plain, and even the Beijing-Tianjin area.
Conclusion
The barchan dunes in the Yamarak Desert moved at a rate of 0–20 m/a, with an average rate of 8.45 m/a. The percentage of predominantly fast dunes was 44.18%, the percentage of exceptionally fast dunes was 37.20%, and the percentage of moderately fast-moving dunes was 18.62%. The dunes moved in the 95–130° direction, which was generally consistent with the main wind direction in the area. Correlations were found between the morphological parameters of the typical barchan dunes, with correlation coefficients of greater than 0.8 between all of the parameters, except the degree of spread of the two wings and the degree of symmetry of the two wings. The rate of movement of the barchan dunes gradually decreased as a power function with increasing dune width, dune height, and dune volume.
Many factors influence the rate of movement of the barchan dunes in the Yamarak Desert, including the sand supply, vegetation cover, degree of topographic relief, wind strength, climate change, and human activities. In this study, only the topographic relief and the degree of ground cover in the study area were discussed, and subsequent studies should increase the study of other factors to gain a more complete understanding of the barchan dunes in this region.
Data Availability Statement
The original contributions presented in the study are included in the article/Supplementary Material, further inquiries can be directed to the corresponding authors.
Author Contributions
JG-P wrote the main manuscript text and HX-Y prepared Figures. In addition, YG, YY-F, and ZH-J reviewed and revised the manuscript. All authors discussed the results and commented on the manuscript.
Funding
This study was supported by the Natural Science Foundation of Inner Mongolia Autonomous Region under the surface project (2021MS03055).
Conflict of Interest
The authors declare that the research was conducted in the absence of any commercial or financial relationships that could be construed as a potential conflict of interest.
Publisher’s Note
All claims expressed in this article are solely those of the authors and do not necessarily represent those of their affiliated organizations, or those of the publisher, the editors and the reviewers. Any product that may be evaluated in this article, or claim that may be made by its manufacturer, is not guaranteed or endorsed by the publisher.
Acknowledgments
We thank LetPub (www.letpub.com) for its linguistic assistance during the preparation of this manuscript.
References
Alvarez, C. A., and Franklin, E. M. (2017). Birth of a Subaqueous Barchan Dune. Phys. Rev. E 96 (6), 062906. doi:10.1103/PhysRevE.96.062906
Alvarez, C. A., and Franklin, E. M. (2020). Shape Evolution of Numerically Obtained Subaqueous Barchan Dunes. Phys. Rev. E 101, 012905. doi:10.1103/PhysRevE.101.012905
Alvarez, C. A., and Franklin, E. M. (2019). Horns of Subaqueous Barchan Dunes: A Study at the Grain Scale. Phys. Rev. E 100 (4). doi:10.1103/PhysRevE.100.042904
Andreotti, B., and Claudin, P. (2007). Comment on “Minimal Size of a Barchan Dune”. Phys. Rev. E 76 (6), 063301. doi:10.1103/physreve.76.063301
Andreotti, B., Claudin, P., and Douady, S. (2002a). Selection of Dune Shapes and Velocities Part 1: Dynamics of Sand, Wind and Barchans. The Eur. Phys. J. B - Condensed Matter 28 (3), 321–339. doi:10.1140/epjb/e2002-00236-4
Andreotti, B., Claudin, P., and Douady, S. (2002b). Selection of Dune Shapes and Velocities Part 2: A Two-Dimensional Modelling. Eur. Phys. J. B - Condensed Matter 28 (3), 341–352. doi:10.1140/epjb/e2002-00237-3
Arens, S. M., Slings, Q., and de Vries, C. N. (2004). Mobility of a Remobilised Parabolic Dune in Kennemerland, The Netherlands. Geomorphology 59 (1–4), 175–188. doi:10.1016/j.geomorph.2003.09.014
Assis, W. R., and Franklin, E. M. (2020). A Comprehensive Picture for Binary Interactions of Subaqueous Barchans. Geophys. Res. Lett. 47 (18). doi:10.1029/2020gl089464
Bacik, K. A., Lovett, S., Caulfield, C. P., and Vriend, N. M. (2020). Wake Induced Long Range Repulsion of Aqueous Dunes. Phys. Rev. Lett. 124 (5), 054501. doi:10.1103/PhysRevLett.124.054501
Bristow, N. R., Blois, G., Best, J. L., and Christensen, K. T. (2019). Spatial Scales of Turbulent Flow Structures Associated with Interacting Barchan Dunes. J. Geophys. Res. Earth Surf. 124 (5), 1175–1200. doi:10.1029/2018JF004981
Burrough, S. L., Thomas, D. S. G., Bailey, R. M., and Davies, L. (2012). From Landform to Process: Morphology and Formation of lake-bed Barchan Dunes, Makgadikgadi, Botswana. Geomorphology 161-162, 1–14. doi:10.1016/j.geomorph.2012.03.027
Diniega, S., Glasner, K., and Byrne, S. (2010). Long-time Evolution of Models of Aeolian Sand Dune fields: Influence of Dune Formation and Collision. Geomorphology 121 (1-2), 55–68. doi:10.1016/j.geomorph.2009.02.010
Dong, Y., Namikas, S. L., Hesp, P. A., and Ma, J. (2008). Field Measurements of Influence of Sand Transport Rate on Structure of Wind-Sand Flow over Coastal Transverse ridge. Chin. Geogr. Sci. 18 (3), 255–261. doi:10.1007/s11769-008-0255-6
Dong, Z. B., Su, Z. Z., and Qian, G. Q. (2011). Wind and Sand Geomorphology of the Kumtag Desert. Beijing: Science Press. (in Chinese).
Dong, Z., Lu, J., Man, D., Lv, P., Qian, G., Zhang, Z., et al. (2011). Equations for the Near-Surface Mass Flux Density Profile of Wind-Blown Sediments. Earth Surf. Process. Landforms 36 (10), 1292–1299. doi:10.1002/esp.2151
Durán, O., Parteli, E. J. R., and Herrmann, H. J. (2010). A Continuous Model for Sand Dunes: Review, New Developments and Application to Barchan Dunes and Barchan Dune fields. Earth Surf. Process. Landforms 35 (13), 1591–1600. doi:10.1002/esp.2070
Durán, O., Schwämmle, V., Lind, P. G., and Herrmann, H. J. (2009). The Dune Size Distribution and Scaling Relations of Barchan Dune fields. Granular Matter 11 (1), 7–11. doi:10.1007/s10035-008-0120-4
El belrhiti, H., and Douady, S. (2011). Equilibrium versus Disequilibrium of Barchan Dunes. Geomorphology 125 (4), 558–568. doi:10.1016/j.geomorph.2010.10.025
Embabi, N. S., and Ashour, M. M. (1993). Barchan Dunes in Qatar. J. Arid Environments 25 (1), 49–69. doi:10.1006/jare.1993.1042
Goudie, A., and Viles, H. (2014). Landscapes and Landforms of Namibia. Dordrecht, Netherlands: Springer Netherlands.
Hanoch, G., Yizhaq, H., and Ashkenazy, Y. (2018). Modeling the Bistability of Barchan and Parabolic Dunes. Aeolian Res. 35, 9–18. doi:10.1016/j.aeolia.2018.07.003
Herrmann, H. J., and Sauermann, G. (2000). The Shape of Dunes. Physica A: Stat. Mech. its Appl. 283 (1–2), 24–30. doi:10.1016/S0378-4371(00)00124-2
Herrmann, H. J., Andrade, J. S., Schatz, V., Sauermann, G., and Parteli, E. J. R. (2005). Calculation of the Separation Streamlines of Barchans and Transverse Dunes. Physica A: Stat. Mech. its Appl. 357 (1), 44–49. doi:10.1016/j.physa.2005.05.057
Hersen, P., Douady, S., and Andreotti, B. (2002). Relevant Length Scale of Barchan Dunes. Phys. Rev. Lett. 89 (26), 264301. doi:10.1103/PhysRevLett.89.264301
Hersen, P., and Douady, S. (2005). Collision of Barchan Dunes as a Mechanism of Size Regulation. Geophys. Res. Lett. 32 (21), L21403. doi:10.1029/2005gl024179
Hersen, P. (2004). On the Crescentic Shape of Barchan Dunes. Eur. Phys. J. B - Condensed Matter 37 (4), 507–514. doi:10.1140/epjb/e2004-00087-y
Huang, F., Cao, Z., Jiang, S.-H., Zhou, C., Huang, J., and Guo, Z. (2020). Landslide Susceptibility Prediction Based on a Semi-supervised Multiple-Layer Perceptron Model. Landslides 17, 2919–2930. doi:10.1007/s10346-020-01473-9
Huang, F., Tao, S., Chang, Z., Huang, J., Fan, X., Jiang, S.-H., et al. (2021). Efficient and Automatic Extraction of Slope Units Based on Multi-Scale Segmentation Method for Landslide Assessments. Landslides 18, 3715–3731. doi:10.1007/s10346-021-01756-9
Jiao, Y. X., Mu, Y. R., Zhang, W. S., Guo, J., Chen, Y. L., and Li, X. M. (2013). Morphological Characteristics of Kumtagh Sand Dunes in Beishan, Xinjiang Uygur Autonomous Region. Remote Sensing Land Resour. 25 (2), 138–142 (in Chinese). doi:10.6046/gtzyyg.2013.02.23
Koprowski, M., Winchester, V., and Zielski, A. (2010). Tree Reactions and Dune Movements: Slowinski National Park, Poland. CATENA 81 (1), 55–65. doi:10.1016/j.catena.2010.01.004
Li, Z. Z. (1994). A Comprehensive Review on Progress in Study of Barchan Dune. Arid Land Geogr. (4), 81–87 (in Chinese). doi:10.13826/j.cnki.cn65-1103/x.1994.04.012
Ling, Y. Q., Wu, Z., and Liu, S. Z. (1998). Simulated Study on Barchan Dune Forms. Geoscience 18 (1), 88–93. (in Chinese).
Nield, J. M., and Baas, A. C. W. (2008). Investigating Parabolic and Nebkha Dune Formation Using a Cellular Automaton Modelling Approach. Earth Surf. Process. Landforms 33 (5), 724–740. doi:10.1002/esp.1571
Ning, W. X., and Wang, Z. T. (2018). Analysis of Morphological Parameters of Mega-Dunes in the Southeast of Badain Jaran Desert. J. Fujian Agric. For. Univ. (Natural Sci. Edition) 47 (6), 755–763. (in Chinese). doi:10.13323/j.cnki.j.fafu(nat.sci.).2018.06.01
Parteli, E. J. R., Durán, O., and Herrmann, H. J. (2007). Minimal Size of a Barchan Dune. Phys. Rev. E 75 (1), 011301. doi:10.1103/PhysRevE.75.011301
Parteli, E. J. R., Durán, O., Tsoar, H., Schwämmle, V., and Herrmann, H. J. (2009). Dune Formation under Bimodal Winds. Proc. Natl. Acad. Sci. U.S.A. 106, 22085–22089. doi:10.1073/pnas.0808646106
Parteli, E., Poeschel, T., Tsoar, H., Bourke, M., Durán, O., and Herrmann, H. (2013). Barchan Dune Asymmetry: Numerical Investigation. Aeolian Res. 12 (2), 121–133. doi:10.1016/j.aeolia.2013.12.0021248
Qu, J., Liao, K., Dong, G., Niu, Q., Jing, Z., and Han, Q. (2011). Feathered Sand Ridges in the Kumtagh Desert and Their Position in the Classification System. Sci. China Earth Sci. 54 (8), 1215–1225. doi:10.1007/s11430-011-4209-y
Reffet, E., Courrech du Pont, S., Hersen, P., and Douady, S. (2010). Formation and Stability of Transverse and Longitudinal Sand Dunes. Geology 38 (6), 491–494. doi:10.1130/g30894.1
Reitz, M. D., Jerolmack, D. J., Ewing, R. C., and Martin, R. L. (2010). Barchan-parabolic Dune Pattern Transition from Vegetation Stability Threshold. Geophys. Res. Lett. 37 (19). doi:10.1029/2010GL044957
Ren, X. Z., Liu, T., and Wang, Z. T. (2010). Parametric Observation of crescent-shaped Dune Morphology in the sandy Area of Hexi River. Res. Soil Water Conservation 17 (1), 163–166. (in Chinese).
Stam, J. M. T. (1997). On the Modelling of Two-Dimensional Aeolian Dunes. Sedimentology 44 (1), 127–141. doi:10.1111/j.1365-3091.1997.tb00428.x
Tsoar, H., Dan, G. B., and Stoler, Y. (2004). Elongation and Migration of Sand Dunes. Geomorphology 57 (3/4), 293–302. doi:10.1016/S0169-555X(03)00161-2
Tsoar, H., and Parteli, E. (2016). Bidirectional Winds, Barchan Dune Asymmetry and Formation of Seif Dunes From Barchans: A Discussion. Environ. Earth Sci. 75 (18), 1237. doi:10.1007/s12665-016-6040-4
Wang, Z. T., Zhao, H., Zhang, K. C., and Ren, X. (2009). Barchans of Minqin: Quantifying Migration Rate of a Barchan. Sci. Cold Arid Regions 1 (2), 151–156.
Wu, X., Zou, X., Zheng, Z. C., and Zhang, C. (2011). Field Measurement and Scaled-Down Wind-Tunnel Model Measurement of Airflow Field over a Barchan Dune. J. Arid Environments 75 (5), 438–445. doi:10.1016/j.jaridenv.2010.12.016
Yang, B., Su, Y., He, N., Zhang, B., Zhou, X., and Zhang, Y. (2020). Experimental Study on the Stable Morphology and Self-Attraction Effect of Subaqueous Barchan Dunes - ScienceDirect. Adv. Powder Technol. 31 (3), 1032–1039. doi:10.1016/j.apt.2019.12.032
Yang, G., Ma, W. X., Bao, S. Q., and Zhang, C. F. (2016). Relationship between the Structure of Oxytropis aciphylla and Caragana Microphylia Shrubberies and Their Wind-Shadow Dunes. Arid Zone Res. 33 (3), 540–547. (in Chinese). doi:10.13866/j.azr.2016.03.13
Yang, J., Dong, Z., Liu, Z., Shi, W., Chen, G., Shao, T., et al. (2019). Migration of Barchan Dunes in the Western Quruq Desert, Northwestern China. Earth Surf. Process. Landforms 44 (10), 2016–2029. doi:10.1002/esp.4629
Yang, Y. Y., Liu, L. Y., Qu, Z. Q., and Zhang, G-M. (2014). A Review of Barchan Dunes. Scientia Geographica Sinica 34 (1), 76–83. (in Chinese). doi:10.13249/j.cnki.sgs.2014.01.001
Yizhaq, H., Ashkenazy, Y., and Tsoar, H. (2007). Why Do Active and Stabilized Dunes Coexist under the Same Climatic Conditions? Phys. Rev. Lett. 98 (18), 188001. doi:10.1103/PhysRevLett.98.188001
Yizhaq, H., J. Balmforth, N., and Provenzale, A. (2004). Blown by Wind: Nonlinear Dynamics of Aeolian Sand Ripples. Physica D: Nonlinear Phenomena 195 (3–4), 207–228. doi:10.1016/j.physd.2004.03.015
Zhang, M. Y., Zhang, D. S., Wu, W. Y., Tian, L. H., and Zhou, X. (2018). Application of UAV Image Based 3D Reconstruction in Morphological Monitoring of Dunes. Arid Land Geogr. 41 (6), 1341–1348. (in Chinese). doi:10.12118/j.issn.1000-6060.2018.06.22
Zhang, Y., Li, M., Wang, Y., and Yang, B. (2019). Reinvestigation of the Scaling Law of the Windblown Sand Launch Velocity with a Wind Tunnel experiment. J. Arid Land 11 (5), 664–673. doi:10.1007/s40333-019-0105-7
Zhang, Y., Wang, Y., and Jia, P. (2014). Evolution of Downsized crescent-shaped Dune in Wind Tunnel experiment. Sci. China Phys. Mech. Astron. 57, 143–151. doi:10.1007/s11433-013-5261-8
Zhao, J. F., Li, C. S., Zhou, X. J., and Lei, J. (1993). Study on the Fluid Field and Deflation Characteristics on Barchanic Dune Surface. J. Desert Res. 13 (3), 18–24. (in Chinese).
Zhou, X. J., Li, C. S., Lei, J. Q., and Zhao, J. F. (1990). Preliminary Study on the Dunes Woving Laws in Cele County. Arid Zone Res. 1, 39–44. (in Chinese). doi:10.13866/j.azr.1990.01.008
Zhou, X., Wang, Y., and Yang, B. (2019). Three-dimensional Numerical Simulations of Barchan Dune Interactions in Unidirectional Flow. Particulate Sci. Technol. 37 (7), 835–842. doi:10.1080/02726351.2018.1454994
Zhu, B.-Q., Zhang, J.-X., and Sun, C. (2021). Physiochemical Characteristics, Provenance, and Dynamics of Sand Dunes in the Arid Hexi Corridor. Front. Earth Sci. 9, 728202. doi:10.3389/feart.2021.728202
Zhu, Z. D., Chen, Z. P., and Wu, Z. (1981). Wind and Sand Geomorphology of the Taklamakan Desert Research. Beijing: Science Press, 78–80. (in Chinese).
Zhu, Z. D., Guo, H. W., and Wu, G. C. (1964). The Study on the Law of Sand Dune Movement Near Oasisin the South West of the Taklimakan Desert. Acta Geographica Sinica 30 (1), 35–50. (in Chinese).
Keywords: morphological characteristics, movement patterns, barchan dunes, Yamarak Desert, wind-sand hazards, geohazards
Citation: Guang-Pu J, Guang Y, Xue-Ying H, He-Jun Z and Yun-Feng Y (2022) Quantitative Study on Morphological Characteristics of Barchan Dunes in Yamarak Desert, China. Front. Earth Sci. 10:861991. doi: 10.3389/feart.2022.861991
Received: 25 January 2022; Accepted: 11 March 2022;
Published: 29 March 2022.
Edited by:
Faming Huang, Nanchang University, ChinaReviewed by:
Bin Yang, Northwest University, ChinaYang Zhang, Xi’an Jiaotong University, China
Nabil Embabi, Ain Shams University, Egypt
Carlos Alvarez Zambrano, University of California, Los Angeles, United States
Copyright © 2022 Guang-Pu, Guang, Xue-Ying, He-Jun and Yun-Feng. This is an open-access article distributed under the terms of the Creative Commons Attribution License (CC BY). The use, distribution or reproduction in other forums is permitted, provided the original author(s) and the copyright owner(s) are credited and that the original publication in this journal is cited, in accordance with accepted academic practice. No use, distribution or reproduction is permitted which does not comply with these terms.
*Correspondence: Yang Guang, eWczMzFAMTI2LmNvbQ==; Yao Yun-Feng, MTg5MDQ3MTg4NTVAMTYzLmNvbQ==
†These authors have contributed equally to this work