 Zhichao Li1,2
 Shuren Wang
 Lianchong Li
- 1School of Civil Engineering, Henan Polytechnic University, Jiaozuo, China
- 2International Joint Research Laboratory of Henan Province for Underground Space Development and Disaster Prevention, Henan Polytechnic University, Jiaozuo, China
- 3School of Resources and Civil Engineering, Northeastern University, Shenyang, China
Staged treatment in vertical wells is extensively applied in layered formation to obtain commercial exploitation of hydrocarbon resources. Large-sized heterogeneities always exist between multiple hydraulic fractures in different layers. To reveal the interference of multiple hydraulic fractures in layered formation, a series of numerical investigations were conducted based on the cohesive zone finite element method. The results show that the sole stress interference is too small to exert an effective impact on adjacent pay zones, which is quite different from those in horizontal wells. The flow distribution in one pay zone can reach 56.2%, which is more than five times the magnitude of the least 10.5% during the fracturing in three pay zones. The fracture size heterogeneities are mainly caused by the interference of the fluid flow into multiple perforation tunnels in different pay zones. To further clarify how the flow distribution in the pay zones is affected, five related factors, including perforating thickness, pay zone thickness, rock permeability, minimum horizontal stress of the pay zone, and rock strength, are analyzed. The results show that it is through the manner of flow distribution adjustment in each pay zone that the five factors affect the fracture size. This study is of critical importance to clarify how the multiple hydraulic fractures from vertical wells interfere in layered formation and explain why the hydraulic fractures we get in the field are far away from what we want ideally.
Introduction
Hydraulic fracturing has become a common practice to enhance hydrocarbon recovery in oil and gas production. Hydrocarbon reservoirs are typically sedimentary rock, which is characterized by multiple layers. These layers can form with different lithologies, such as sandstone interbedded with mudstone (Nordiana et al., 2019). They can also exhibit a large difference in size, from millimeters to kilometers (Nagel et al., 2013). Particularly, a large number of natural weaknesses in layered formation, such as beddings and pre-existing cracks, make the rock properties quite different from those in homogenous rock (Chang et al., 2016; Li et al., 2017; AlTammar et al., 2019; Ham and Kwon, 2020). Therefore, a deep understanding of how the hydraulic fractures propagate in layered formation is especially necessary, which is beneficial to the fracturing design and implementation on site.
Although numerous studies have been conducted to investigate this issue (Zhu et al., 2015; Oyedokun and Schubert, 2017; Zhu et al., 2018; Douma et al., 2019; Ju et al., 2019; Salimzadeh et al., 2019; Pan et al., 2020; Mu et al., 2021; Tan et al., 2021), it is still a difficult task to clearly figure out the definite characteristics of multiple vertical hydraulic fractures in layered formation. Generally, a vertical hydraulic fracture is eagerly expected to be contained in the pay zone without penetrating the interlayer in the vertical direction (Xing et al., 2018; Wan et al., 2020). This is because all the related input into the interlayers that are born with little or no hydrocarbon resource, including the treatment material, effort in equipment, and power, will be considered wasteful. However, whether the hydraulic fracture can penetrate the interlayer relies on multiple factors, including both the geological conditions and treatment conditions. A large contrast in minimum horizontal stress between the interlayer and pay zone is confirmed by many studies to be the main factor in controlling fracture height (Huang and Liu, 2017; Zou et al., 2018; Gutierrez Escobar et al., 2019; Qin et al., 2021). Hydraulic fractures can always penetrate an interlayer with a small minimum horizontal stress in the vertical direction. Moreover, a weak interface between the pay zone and interlayer has also been demonstrated to be another important factor in controlling the fracture height because hydraulic fracture always tends to deflect into the interface to form a “T”-shaped fracture (Dehghan et al., 2015; Guo et al., 2017; Vahab et al., 2021). Furthermore, a higher pump rate or larger fluid viscosity, which is beneficial to build a higher net pressure, is proven to facilitate hydraulic fracture propagation into the interlayer (Yao, 2012; Chuprakov et al., 2014). Other factors, such as formation elastic modulus, rock brittleness, permeability, and pore pressure, are also proven to affect the propagation behavior of vertical hydraulic fracture (Gu and Siebrits, 2008; Ghaderi and Clarkson, 2016; Deng et al., 2018; Li et al., 2018). Considering all these factors, it is rather difficult to evaluate whether a certain hydraulic fracture can penetrate an interlayer.
It is crucial to note that during a staged treatment in a vertical well, several perforation clusters, which exactly target the pay zones at different depths, will be created in advance. During the fracturing treatment, multiple hydraulic fractures can be initiated from the perforation tunnels. In most cases, a perforation cluster can result in the main fracture. Therefore, a staged treatment in a vertical well always promotes the simultaneous propagation of multiple hydraulic fractures in different pay zones. Obviously, the propagation of multiple hydraulic fractures during a staged treatment will not be the same as those extended individually. This is because a hydraulic fracture is usually held open by a proppant, which will induce certain stress in the surrounding formation. This stress can extend to significant distances into the formation, especially when the fracture is of large size (Palmer, 1993), thus exerting an interference on the rock activities in the range. This phenomenon is first named “stress shadow effect” and then studied from different perspectives (Warpinski and Branagan, 1989; Germanovich and Astakhov, 2004; Nagel and Sanchez-Nagel, 2011; Li et al., 2019). In hydraulic fracturing, the stress shadow effect is mostly studied in the horizontal wells that are initially used to stimulate shale reservoirs, in which multiple hydraulic fractures are located in a line parallel to the fracture opening direction. The stress shadow effect in horizontal wells is significantly obvious and cannot be neglected during the fracturing design and implementation. However, how the stress shadow effect acts in vertical wells to stimulate layered formation is another question. How much does a hydraulic fracture in a pay zone influence others in adjacent zones remains a complicated task to complete. Considering the existence of multiple interlayers with various properties and dimensions, it is really a challenge to make sense of this stress interference.
In addition to the stress interference induced by the hydraulic fractures in the formation, the flow distribution due to the competition among multiple tunnels near the wellbore should also be carefully considered. The fluid infusion from vertical wells into the pay zones through perforation tunnels could be extremely different in each zone, which could be an important cause leading to terrible treatment beyond our expectation. What we want in reality is the homogenous treatment of multiple pay zones as shown in Figure 1A, rather than the large heterogeneity of fracture sizes that we always get in the field, as shown in Figure 1B. Therefore, we believe that research on the interference of multiple fractures in layered formation simply by investigating the effect of rock stress interference without considering the flow distribution in each zone is not convincing. The difference in flow distribution should be considered in detail in the study of multiple hydraulic fracture propagation in layered formation.
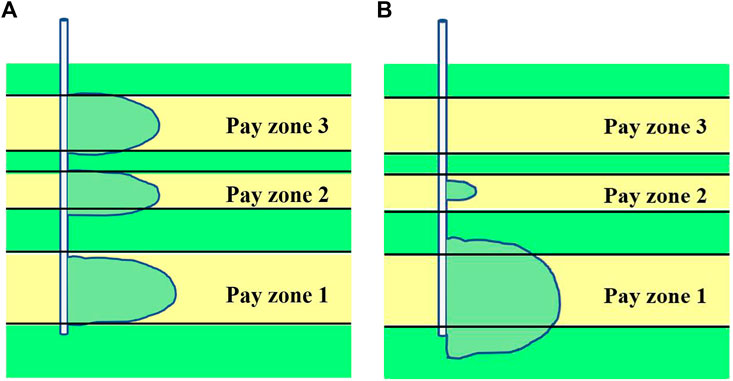
FIGURE 1. Schematic diagram of multiple zone stimulation in vertical wells. (A) What we want; (B) What we get.
However, this problem is not an easy task to deal with through laboratory experiments or field tests. The minimum horizontal stress contrast in a layered specimen has seldomly been considered during laboratory fracturing experiments because of the difficulty of applying confining stress with variable values along height, while this stress contrast is really crucial to control the fracture propagation in layered formation (Haddad and Sepehrnoori, 2015; Zhang et al., 2017; Aimene et al., 2019; Gao and Ghassemi, 2020). This leads to a vast inconvenience during laboratory experiments, and that is why a majority of related works of literature have focused on the study of the effect of rock properties and beddings (Zhao and Chen, 2010; Yang and Zoback, 2016; Huang and Liu, 2017; Liu et al., 2017; Tan et al., 2017; Liu et al., 2020; Hadei and Veiskarami, 2021), rather than the direct influence of stress contrast. Field tests are considered the most direct and convincing way to clarify this issue, but different kinds of uncertainties always exist in the process of accurate fracture size diagnosis (Nejad et al., 2013). Moreover, how to accurately monitor and figure out each fluid volume in different layers in deep reservoirs is itself a big challenge. All these problems bring great difficulties to the laboratory and field studies on this issue.
As an alternative way, numerical simulation is a nice method to deal with the problem. The cohesive zone finite element method (CZM) is selected in this study because of its great superiority in simulating hydraulic fracture propagation (Chen, 2012): (1) the CZM has involved four important coupling processes, namely, rock deformation caused by fluid pressure on the fracture faces, viscous fluid flow within the fracture, fluid leak-off from the fracture into the formation, and fracture propagation in rock; (2) the CZM avoids the crack tip singularity that may appear as a great challenge for numerical simulation in classic fracture mechanics; (3) fracture tip in the CZM is a direct, natural outcome of a solution, rather than an input parameter, which can increase computation efficiency; and (4) the CZM has adequate ability to simulate microstructural damage in the process of hydraulic fracturing such as microfracture initiation and coalescence.
The basic theory of CZM is first introduced. Then, three-dimensional models are established to investigate the interference of vertical hydraulic fractures in sandstone and mudstone interbedded formation. The interference is artificially divided into two aspects for detailed investigation: the stress interference induced by hydraulic fractures in the formation and flow distribution due to the competition between multiple perforation tunnels near the wellbore. Finally, five related factors, namely, perforating thickness, pay zone thickness, rock permeability, minimum horizontal stress of the pay zone, and rock strength are analyzed to further clarify how the flow distribution of the pay zones is affected.
Materials and Methods
Damage Propagation Criterion
Traction–separation law is applied as the damage pattern for cohesive elements. Whether the occurrence of damage initiation depends on the maximum principal stress criterion adopted in this study (Gao et al., 2019) is analyzed as follows:
where
When the damage evolution starts, the weakening of material cohesion occurs. A scalar damage variable D is applied in this study to describe material weakening after damage initiation, with its value ranging from 0 to 1. It has an initial value of 0. As the damage evolves, it then monotonically increases to 1. When D increases to 1, the element is completely broken. The normal and shear stress components will change over the damage variable D as follows:
where Tn, Ts, and Tt are the normal and shear stress components, respectively, from the traction–separation behavior for the current strain without damage. tn, ts, and tt are the actual stresses in the three loading directions. During the damage process, for linear softening behavior, D can be expressed as follows:
where
where Gc is the fracture energy. It is an independent parameter that can be gained from the mode-I fracture toughness (KIC), rock Young’s modulus E, and Poisson’s ratio
Incompressible Newton fluid is assumed in the cohesive element. The tangential flow within the gap obeys the lubrication law as follows:
where q is the volume flow across the fracture section, w is the opening width,
Normal flow is defined through the filtration rate into the element's top and bottom surfaces as follows:
where qt and qb are the normal flow rates of fluid filtrating into the element's top and bottom surfaces; ct and cb are the loss coefficients of the top and bottom surfaces, respectively; pi is the fluid pressure in the middle of the fracture; and pt and pb are the pore pressures on the fracture’s top and bottom surfaces, respectively.
In the following section, the distribution of fluid flow from vertical wells into pay zones through perforation tunnels will be considered through the integration of fluid pipe elements with the CZM. The pipe elements in the standard analysis can be used to model the gravity pressure loss and viscous terms in a fluid pipe network by applying the pure pressure formulation. A single-phase, incompressible fluid is assumed to flow through the fully filled pipe that has a constant cross-sectional area, based on Bernoulli’s equation which is written as follows:
where
The Blasius friction loss method is applied in this study to specify the friction loss behavior and define the friction factor f. It conforms to an empirical relation related to Reynold’s number (Re) by which two different regimes can form on account of whether it is a laminar or turbulent flow. The friction factor is empirically calculated as follows:
Numerical Computational Model
Sandstone and mudstone interbedded formations are extensively distributed in Yong block in the Yanjia oilfield of Dongying depression, China. The buried depth of the reservoir ranges from 3,000 to 4350 m. It is characterized by tremendous heterogeneity of lithologies in the vertical direction. Logging data and drill core analysis indicate that the average reservoir porosity is 7.9% and the permeability is 3.93 mD. The minimum horizontal stresses of mudstone interlayers are measured as 2.0–9.0 MPa larger than those of the sandstone pay zones. Staged treatment through vertical wells is implemented to stimulate the reservoirs. According to the basic reservoir data, a three-dimensional numerical model is established, as shown in Figure 2 to tentatively investigate the stress interference of multiple hydraulic fractures.
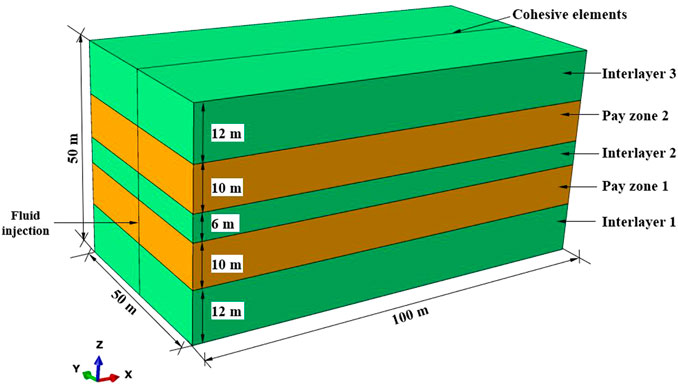
FIGURE 2. Numerical model that consists of five layers.
The numerical model is 100 m in size along the X-axis direction, 50 m along the Y-axis direction, and 50 m along the Z-axis direction. The fracture is assumed to be symmetrical along the vertical well, and half of the domain in the X-axis direction is modeled. Two pay zones interbedded with three interlayers make up the model. Pore cohesive elements with a thickness of 0 m are embedded in the vertical plane where the y coordinate is 25.0 m. The basic parameters applied in the model are shown in Table 1. The overburden pressure σv (85.0 MPa), maximum horizontal stress σH (77 MPa), and minimum horizontal stress σh are shown in Table 1 and are applied to the model in the Z-, X-, and Y-axis directions, respectively. It is important to state that the direction of the minimum principal stress is horizontal. The hydraulic fractures are preset to propagate in the vertical plane, which is consistent with the basic theory of rock fracture mechanics and also in agreement with the fracturing behavior on site. An initial pore pressure of 35.0 MPa is applied to the formation. All the applied in situ stress and pore pressure vary with depth based on their weight. First, fracturing fluid is only injected into pay zone 1. The fluid viscosity is 50

TABLE 1. Basic parameters of pay zones and interlayers.
Experimental Results
Stress Interference of Hydraulic Fractures
The final geometry of the numerically obtained hydraulic fracture is shown in Figure 3, in which the cohesive elements are solely exhibited. The layers are separated with the mark of the horizontal black dashed lines on the figure. The hydraulic fracture can be easily recognized in the PFOPEN field (pore pressure fracture opening). It is clear that the hydraulic fracture has propagated to a certain size along the fracture length direction (X-axis direction), but it is contained in pay zone 1 by two adjacent interlayers in the fracture height direction (Z-axis direction). According to the theory of the stress shadow effect, this hydraulic fracture will induce a certain stress in the surrounding rocks, which may exert an impact on the fracturing behavior of pay zone 2. To effectively quantify the magnitude of this stress, the term “induced stress,” which refers to the change of matrix stress generally due to the initiation of a fracture of arbitrary length and height, is introduced in this study to describe this effect by its principal form, which is as follows:
where
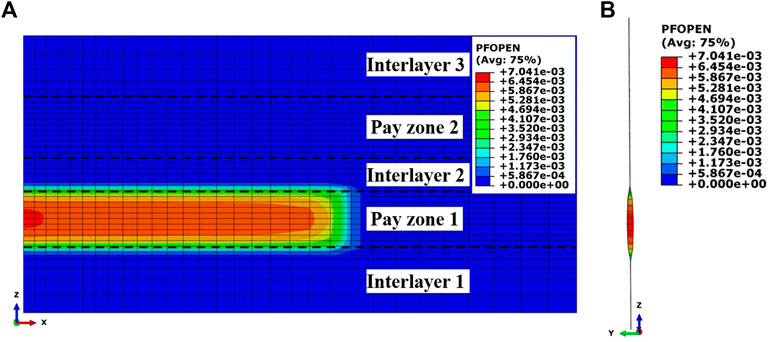
FIGURE 3. Hydraulic fracture geometry when pay zone 1 is treated. (A) X–Z view; (B) Y–Z view.
Since rock failure in the matrix during the hydraulic fracturing process is dominantly controlled by tensile cracking (Al-Busaidi et al., 2005; Chen et al., 2015), the maximum induced stress
where
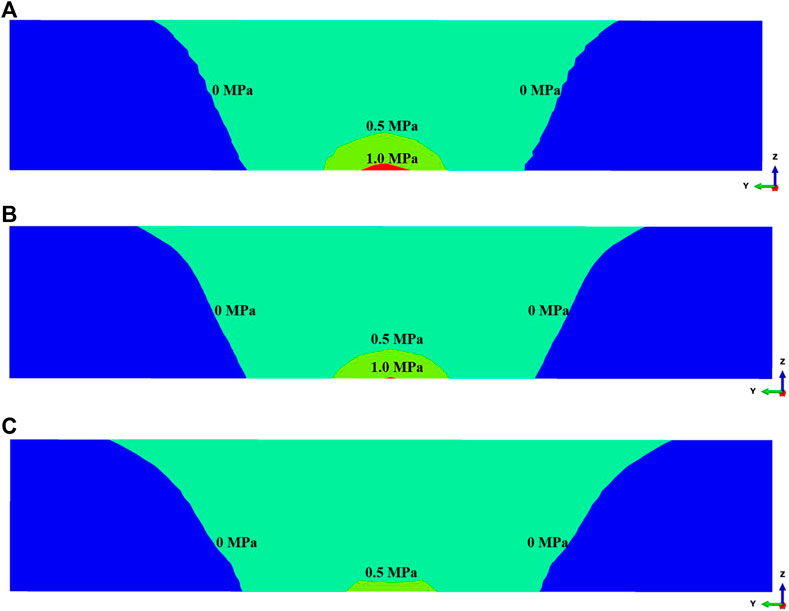
FIGURE 4. Contour lines of the maximum induced stress in pay zone 2 at different coordinates. (A) x = 0.0 m; (B) x = 20.0 m; (C) x = 40.0 m.
The other two numerical cases are set to directly display the interference effect. One case is set with the sole fracturing treatment in pay zone 2, and the other is the simultaneous treatment in both pay zones 1 and 2. The two cases share all the same parameters, except the treatment scheme. A comparison will be made based on the two cases to investigate whether there is a difference between the hydraulic fractures in pay zone 2 when the hydraulic fracture in pay zone 1 exists or not. Figure 5 shows the geometries of the hydraulic fractures in the two cases. It can be seen from Figure 5 that fracture size difference really exists between the two cases. The final fracture length in pay zone 2 shown in Figure 5A is 57.4 m, which is a little larger than the 55.5 m shown in Figure 5B. However, this difference does not make much sense to a hydraulic fracture on site which is tens or hundreds of meters in size, especially when it is compared to those in horizontal wells.
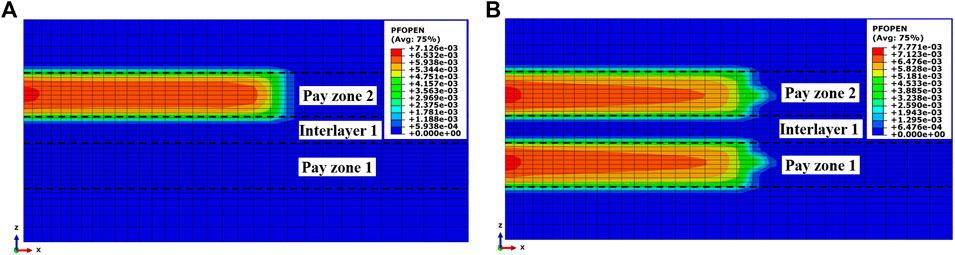
FIGURE 5. Hydraulic fracture geometries in models with two different treatment schemes. (A) pay zone 2 is solely treated; (B) pay zones 1 and 2 are simultaneously treated.
Figure 6 displays three cases involving multiple hydraulic fractures in horizontal wells in previous studies (Kresse et al., 2013; Guo et al., 2015; Li et al., 2016). It can be easily discovered that the two fractures in Figure 6A propagate away from each other, exhibiting intense repelling. The propagation of the external fractures given in Figures 6B,C inhibits the middle fractures from propagating normally. Both the repelling and inhibition effects show fierce stress interference between multiple parallel fractures in horizontal wells. It is necessary to note that the three models also involve no flow distribution, and then it is convincing that the stress interference of multiple hydraulic fractures from vertical wells in layered formation is much weaker than that from horizontal wells. Therefore, we believe that stress interference in the formation could not be the main cause to induce large heterogeneities of multiple hydraulic fractures on site in layered formation.
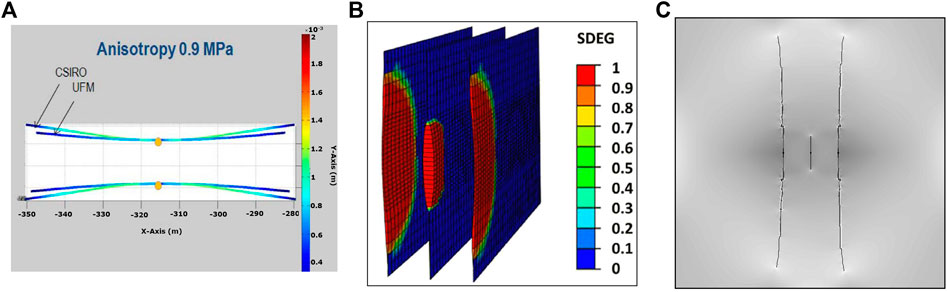
FIGURE 6. Numerically obtained stress interference of hydraulic fractures from horizontal wells in previous studies. (A) Geometry of parallel fractures in anisotrophic stress fields by Kresse et al. (2013). (B) Fracture geometry with a fracture spacing of 20.0 m by Guo et al. (2015) and (C) shows the geometry of three hydraulic fractures with 3.0 m spacing by Li et al. (2016).
Flow Distribution of Multiple Hydraulic Fractures
After completing the integration, another three-dimensional numerical model will be established with the consideration of flow distribution, as shown in Figure 7, in which the cohesive elements are solely presented to show the multiple layers. The model is 100 m along the X-axis direction, 50 m along the Y-axis direction, and 70 m along the Z-axis direction. Three pay zones and four interlayers are interbedded to make up the model. Similarly, half of the domain in the X-axis direction is modeled. Three-dimensional fluid pipe elements are used to establish the wellbore from the ground to the reservoirs to realize ground fluid injection. Perforation tunnels are simulated through pipe elements with the consideration of perforating thickness. In pay zone 1, three horizontal pipe elements are tentatively adopted to simulate the effective tunnels forming during the perforating treatment. Similarly, in pay zones 2 and 3, two and one pipe elements are adopted, respectively, as shown in the figure (horizontal pipe elements are enlarged for visual effect). The fluid viscosity is 50 mPa s, and the injection rate is 0.017 m3/s. The material properties and reservoir in situ stresses are the same as in the model shown in Figure 2. The fracturing duration lasts for 20.0 min.
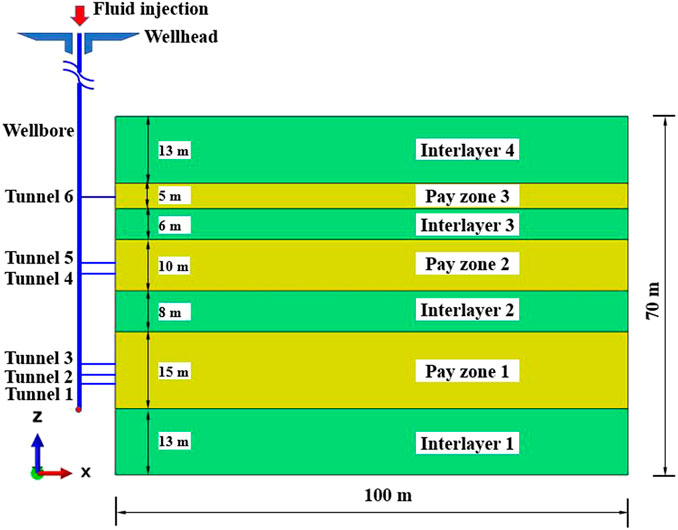
FIGURE 7. Numerical model containing seven layers, with the integration of fluid pipe elements.
The final fracture geometry is shown in Figure 8, in which the three fractures can be easily observed as quite heterogenous. The stimulation in pay zone 1 has successfully built a hydraulic fracture with the most considerable fracture length of 67 m, while the fracture in pay zone 3 is the smallest in size with a fracture length of 33 m, nearly half of the size in pay zone 1. Obviously, this heterogeneity is not the ideal scenario that we want because of the terrible stimulation in pay zone 3, but it is always the actual state of the field treatment.
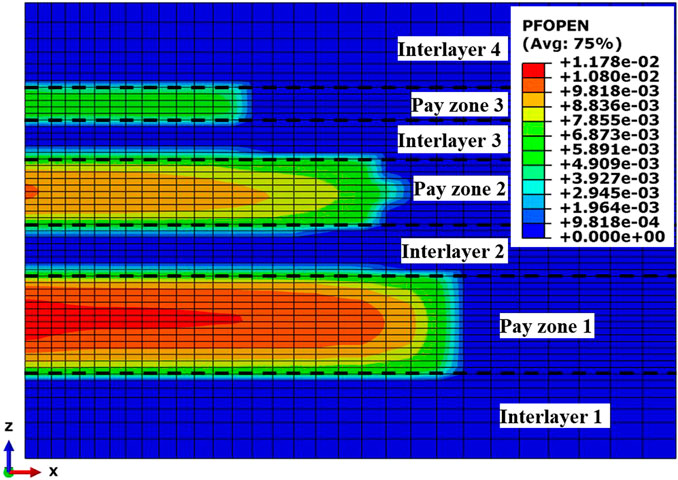
FIGURE 8. Hydraulic fracture geometries in the model containing seven layers.
This heterogeneity is unlikely to be caused just by the stress interference of hydraulic fractures. As stated earlier, the stress interference itself cannot result in such a difference between multiple fractures in the layered formation. We suppose the flow distribution of multiple perforation tunnels in the multiple layers could have played an important role in inducing this heterogeneity, and the numerical result has supported this idea. Figure 9 depicts the volume flow rates of the fluid into different tunnels and zones during injection. As shown in Figure 9A, it is particularly apparent that the flow rates of the fluid into the six tunnels are completely different. This difference could be considerably large, and each flow rate keeps on fluctuating over time, demonstrating the instant adjustment of flow distribution. In total, the minimum flow rate occurs at tunnel 6, which is the only channel from the wellbore to pay zone 3. The maximum flow rate occurs at tunnel 3, which simulates the upper zone of the three perforations in pay zone 1. Figure 9B summarizes the total flow rates of fluid through multiple tunnels in each pay zone. It is shown in the figure that the three flow rates are clearly separated, which means the fluid flow into the three zones is different. While this difference exactly illustrates the existence of fluid flow interference between different pay zones, the perforation tunnels in pay zone 1 account for 56.2% of the accumulative fluid volume, tunnels in pay zone 2 account for 33.3%, and tunnels in pay zone 3 account for 10.5%. In fact, for a certain layer, whether a hydraulic fracture initiates or at which level it can propagate in size depends much on the flow distribution obtained from competing with those in other layers. A larger flow distribution always means a larger size of hydraulic fracture because the pressured fluid into formations has no other choice but to create fractures except for some filtration. Therefore, pay zone 1, which accounts for the maximum flow distribution, has generated a hydraulic fracture with the largest size, both in length and height. On the contrary, the hydraulic fracture in pay zone 3 has the smallest size in all the three dimensions.
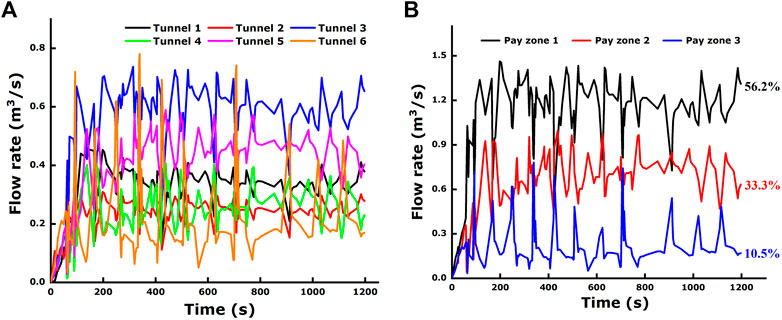
FIGURE 9. Flow rates of the fluid into different tunnels and pay zones during injection. (A) Fluid into the six tunnels; (B) Fluid into the three pay zones.
Another numerical case is set for comparison. In this case, three injection rates of equal value are applied to the three pay zones through the key nodes of pore cohesive elements, without the application of pipe elements. Therefore, the three pay zones share the same flow rate during stimulation, each of which accounts for one-third of the injection rate in the previous model. The final fracture geometry is shown in Figure 10. As to the hydraulic fracture in each pay zone, this figure shows that there are some differences from the previous model as follows: (1) the hydraulic fracture in pay zone 1 is not the longest in size anymore. Because of the accumulative fluid volume, it accounts for decrease from 56.2% to a third; this has directly resulted in a significant decrease of fracture length. (2) Hydraulic fractures in pay zone 2 and 3 have a penetrated interlayer 3, forming a connective fracture. Interlayer 3 has failed to contain the hydraulic fractures in the vertical direction. (3) The hydraulic fracture in pay zone 2 turns out to be the excellent one both in fracture length and fracture width. (4) Fracture propagation in pay zone 3 has improved in this model. The fracture length has increased from 33 m in the previous model to 51 m in the present model. (5) Smaller heterogeneity of fracture size in the three pay zones can be observed. In view of the hydraulic fracture length, the maximum gap of the three fractures has decreased from 34 m in the previous model to 15 m in the present model.
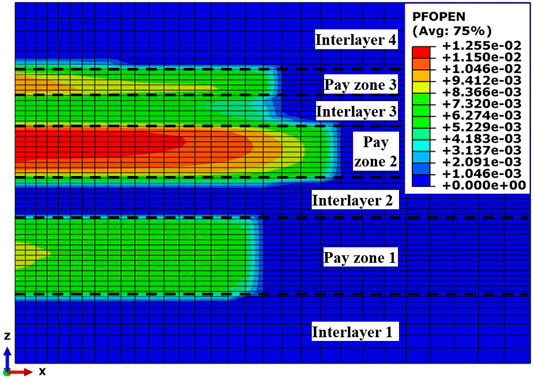
FIGURE 10. Hydraulic fracture geometry in the model with pay zones sharing the same injection rate.
The aforementioned comparison impressively indicates that the sizes of multiple hydraulic fractures could be considerably different in situations, whether the fluid flow distribution has been considered or not. During field treatment, the fracturing fluid into the deep formation is pumped through wellbores. Therefore, the numerical simulation with the integration of fluid pipe elements to realize the flow distribution is more reasonable to describe the real scenario on site, and the corresponding conclusions will be more persuasive. In this view, the existence of large-sized heterogeneities of multiple hydraulic fractures in layered formation should be a normal phenomenon in theory. Although this is exactly not what we want, creating multiple hydraulic fractures with vast dimensions that can connect large volumes of reservoirs is always the ultimate goal of engineers and scholars in this area. To do our best to realize this goal, we believe the first step is to clarify what really affects flow distribution and the manner in which it affects. In the following section, related numerical simulations will be conducted to carry out this investigation.
Discussion
Affecting Factors on Flow
Some factors that are discussed to possibly affect flow distribution will be numerically investigated to explore the manner in which they affect it through contrastive studies. The factors include perforating thickness, pay zone thickness, rock permeability, minimum horizontal stress of the pay zone, and rock strength. It is necessary to explain that the following numerical simulations and comparisons are based on the numerical model shown in Figure 7.
Perforating Thickness
Perforating creates the passageway between the wellbore and reservoir. In a fracturing treatment, perforation is the conduit for fluid flow between the fracture and wellbore. Perforating thickness is an important parameter for fracturing design. Therefore, perforating thickness is first considered the most relevant factor in this study to affect flow distribution. Since the horizontal pipe elements with constant vertical intervals to simulate the effective perforations in this study are directly related to perforating thickness, the pipe element number will be adopted to reflect the perforating thickness.
In the new model, the pipe element number in each pay zone is reset as follows: the pipe element number in pay zone 1 is reduced from three in the base model to one in the new model, the pipe element number in pay zone 2 is increased from two to three, and the pipe element number in pay zone 3 is increased from one to two, without variation of the total number. All the other parameters in the model are kept constant with the base model.
The final hydraulic fracture geometry and flow rates of the fluid through tunnels in pay zones in the new model are shown in Figures 11A,B, respectively. Compared with the base model, Figure 11A shows the length of the hydraulic fracture in pay zone 1 has reduced, but those in pay zones 2 and 3 have increased, which exhibits the same tendency as how the perforating thickness in each zone varies in the new perforating scheme. This consistency convincingly proves that there is a close correlation between perforating thickness and hydraulic fracture size. A larger perforating thickness promotes the hydraulic fracture to extend longer. Similarly, it can also promote the hydraulic fracture to extend higher, which can be seen from the vertical connection of fractures in pay zones 2 and 3. This connection might be caused by the increasing net pressure resulting from the increased flow of the fracturing fluid into these two zones, which can be verified from the flow rate curves shown in Figure 11B. The three curves in the figure provide a similar tendency from the perspective of flow rate, that is, as the perforating scheme varies, the accumulative fluid volume of the tunnels in zones 2 and 3 that it accounts for has rapidly increased from 43.8% to 60.1%, directly demonstrating the remarkable influence of perforating thickness on flow distribution.
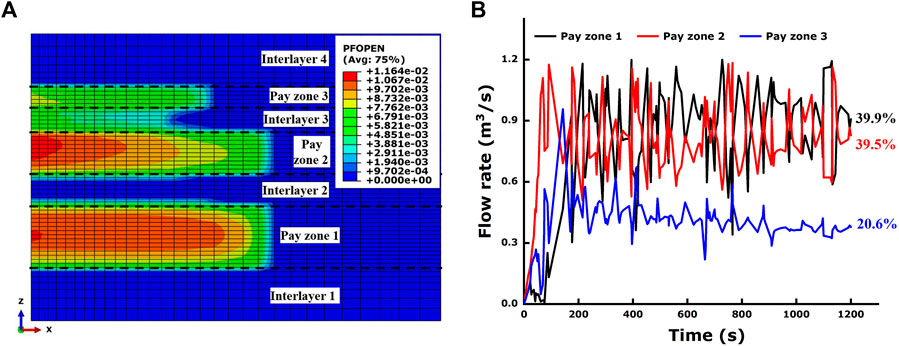
FIGURE 11. Fracture geometry and flow rates of the fluid into pay zones in the model with the new perforating scheme. (A) Hydraulic fracture geometry; (B) Flow rates of fluid into the three pay zones.
Moreover, we have noticed that during the initial fracturing stage (0–150 s), the flow rate of tunnels in pay zone 2 is much higher than that of the other two zones. This might result from the superiority of the perforation tunnel number in pay zone 2 because a large perforating thickness in a certain pay zone is undoubtedly beneficial for fluid inflow, especially during the initial fracturing stage. However, this superiority in pay zone 2 gradually weakens over time, until it shares nearly an equal flow rate with pay zone 1. From this phenomenon, it can be seen that there are certainly other factors that control the flow distribution, except for perforating thickness, which will be studied in the following section.
Pay Zone Thickness
It is hard to imagine that the pay zone thickness has no impact on the final fracture sizes and related flow distribution because a thick pay zone is always the most superior target for treatment. A thick pay zone usually attracts much attention of the engineers and always gets more preferential treatment, such as larger perforating thickness. In fact, a thick pay zone in layered formation is more attractive for obtaining a large flow distribution and inducing hydraulic fractures with large sizes. That is because the interlayers always play a role of barriers in the vertical direction that are usually less permeable and more difficult for the hydraulic fracture to penetrate due to the stress contrast, thus making the pay zones act as conduits separated by barriers. Fluids prefer to flow into wide conduits with less resistance; hence, we believe pay zones with larger thickness can obtain larger flow distribution and generate hydraulic fractures of larger sizes.
The numerical simulation results can be used as proof to further clarify this issue. Larger perforating thickness in pay zone 2 is demonstrated to be a positive advantage to get larger fluid volumes. However, under the condition of initial advantage, we have noticed that pay zone 2 has no advantage over pay zone 1 in the final accumulative fluid volume. The reason is supposed to lie in the difference in pay zone thickness because all the other parameters in these two zones are the same during the whole fracturing stage. From this case, we can see that a larger thickness will facilitate the pay zone to obtain a larger flow distribution and then generate hydraulic fractures with larger sizes.
Rock Permeability
Permeability is a key rock property that describes the ability of pore fluid to transport in a rock mass. It is of critical importance to achieve high recovery rates in oil and gas extraction, which is highly dependent on rock permeability. Although it is almost common sense that a pay zone with high permeability is easy to be hydraulically stimulated, it is still necessary to conduct further investigation from the perspective of flow distribution in different pay zones. In the new model, the permeability of pay zone 3 is set 10.0 times larger than that in the base model, while keeping all the other parameters constant.
The final hydraulic fracture geometry and flow rates of the fluid into the pay zones in the new model are shown in Figures 12A,B, respectively. The final length of the hydraulic fracture in the pay zone 3 is 59 m, which is 26 m longer than that in the base model. Therefore, it can be seen that rock permeability variation has successfully increased the fracture length by 78.8%. We have noticed that tunnels in pay zone 3 account for 16.7% of total accumulative fluid volume, which is 6.2% larger than that in the base model. Through this comparison, it can be seen that rock permeability can significantly influence flow distribution in a layered formation, and a higher permeability is beneficial for the pay zone to generate a hydraulic fracture with a larger size.
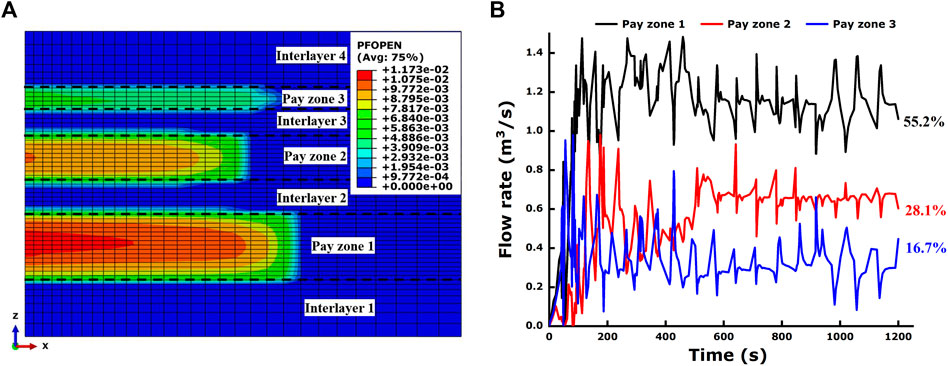
FIGURE 12. Fracture geometry and flow rates of the fluid into pay zones with new pay zone permeability. (A) Hydraulic fracture geometry; (B) Flow rates of fluid into the three pay zones.
Minimum Horizontal Stress of the Pay Zone
The reservoir in situ stress field is highly variable in nature. It cannot be solely explained by the actions of rock gravity and topography because the tectonic stresses could play a crucial role (Wasantha and Konietzky, 2017). In situ stress is a primary factor to be considered during the design and implementation of hydraulic fracturing treatment. In reality, the in situ stress field is far more complicated than any numerical model could simulate, and what we conduct in the numerical model is more or less a simplification of the real in situ stress field. In view of the minimum horizontal stress concerned in this study, we believe it can exert an impact on the flow distribution in layered formation because it has a direct relationship with rock failure. Considering the great gap in the final fracture length in pay zones 1 and 3 in the base model, the minimum horizontal stresses of pay zones 1 and 3 are increased by 1.0 MPa and reduced by 1.0 MPa in the new model, respectively, which is expected to be a favorable operation to make up the gap. Finally, this idea has been confirmed by the numerical results shown in Figure 13.
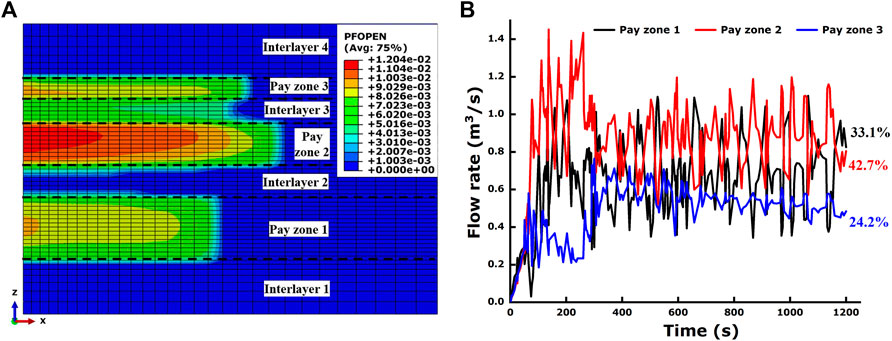
FIGURE 13. Fracture geometry and flow rates of the fluid into pay zones with new minimum horizontal stress of pay zones. (A) Hydraulic fracture geometry; (B) Flow rates of fluid into the three pay zones.
Compared with the base model, the final fracture length in pay zone 1 in the present model has been reduced, while that in pay zone 3 has increased, thus leading to a relatively homogenous propagation of multiple fractures. In addition, we have noticed that the variation that the accumulative fluid volumes in pay zones 1 and 3 accounts for from the base model to the present model is consistent with the size variation of hydraulic fractures. Therefore, we believe a larger minimum horizontal stress of the pay zone is more likely to preclude the hydraulic fracture propagation and decrease the fluid flow into the pay zone, thus reducing the flow distribution.
Rock Strength
Rock strength is assuredly the most vital material parameter to induce rock damage and failure. It will undoubtedly exert enormous influence on hydraulic fracture propagation. To investigate the effect of rock strength on the final flow distribution, another numerical model is set up with a half reduction of the tensile strength of pay zone 3 in the base model, while keeping other parameters constant. The final hydraulic fracture geometry and the flow rates of fluid into the pay zones in the new model are shown in Figures 14A,B, respectively. The final length of the hydraulic fracture in pay zone 3 increases from 33 m in the base model to 55 m in the present model, exceeding the fracture length in pay zone 2. Moreover, it can be found that interlayer 3 has failed to contain the fracture propagation in the vertical direction. The accumulative fluid volume that pay zone 3 accounts for has increased from 10.5% in the base model to 19.2% in the present model, further demonstrating the consistency of flow distribution and fracture size variation. It can be seen that a lower rock strength is beneficial for creating a hydraulic fracture with a larger size that has a higher flow distribution.
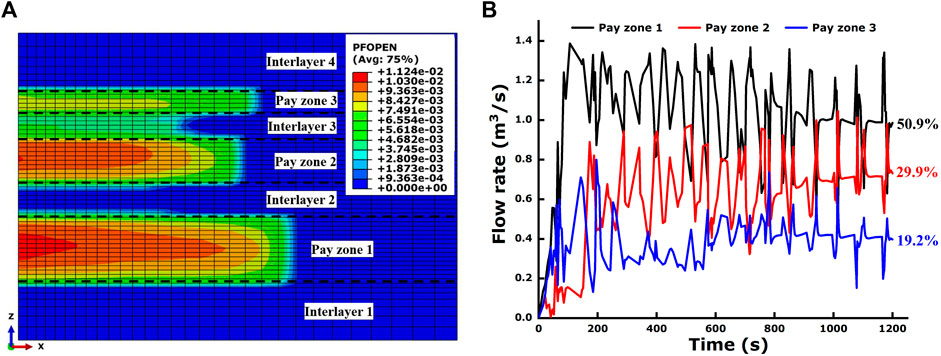
FIGURE 14. Fracture geometry and flow rates of fluid into pay zones with new rock strength of pay zone 3. (A) Hydraulic fracture geometry; (B) Flow rates of fluid into the three pay zones.
Conclusion
The interference of multiple hydraulic fractures in layered formation was numerically investigated. The CZM was selected due to its superiority in modeling hydraulic fracture propagation. A series of three-dimensional models were established to conduct this investigation. The main conclusions are as follows:
1) Large size heterogeneities always exist during the fracturing treatment in the layered formation. This phenomenon is caused by the interference of multiple hydraulic fractures, including the stress interference in the formation and flow difference of the fracturing fluid into each pay zone from the wellbore. The results show that the size difference of the hydraulic fractures is so small that it does not make much sense to a hydraulic fracture on site, which means the stress interference is nearly neglectable, especially when compared with that in horizontal wells.
2) The obvious heterogeneity of multiple fracture propagation can reflect the actual scenario of field fracturing. This heterogeneity is mainly caused by the difference in flow distribution, which has been confirmed during the analysis on the flow rate in each tunnel and in each zone. The fluid flow into each pay zone is found crucial to fracture propagation. The flow distribution in one pay zone can reach 56.2%, which is more than five times the magnitude of the least 10.5% during the fracturing in three pay zones. Pay zones that generate hydraulic fractures with larger sizes always account for larger flow distributions.
3) The five factors, namely, perforating thickness, pay zone thickness, rock permeability, minimum horizontal stress of the pay zone, and rock strength affect the flow distribution in layered formation. The results show that it is through the manner of flow distribution adjustment in each pay zone that these factors affect the hydraulic fracture sizes.
Data Availability Statement
The original contributions presented in the study are included in the article/Supplementary Material, further inquiries can be directed to the corresponding author.
Author Contributions
ZL: writing—original draft, software, methodology, and formal analysis; SW: supervision and conceptualization; LL: writing—review and editing; JZ: Investigation.
Funding
This work was financially supported by the Chinese Postdoctoral Science Foundation (2020M672224), the National Natural Science Foundation of China (51879041), the Fundamental Research Funds for the Universities of Henan Province (NSFRF200202), and Henan Province Key Science and Technology Research Projects (222102320410).
Conflict of Interest
The authors declare that the research was conducted in the absence of any commercial or financial relationships that could be construed as a potential conflict of interest.
Publisher’s Note
All claims expressed in this article are solely those of the authors and do not necessarily represent those of their affiliated organizations, or those of the publisher, the editors, and the reviewers. Any product that may be evaluated in this article, or claim that may be made by its manufacturer, is not guaranteed or endorsed by the publisher.
Acknowledgments
The authors also acknowledge the field data that were provided by the Yanjia oilfield of Dongying, China.
References
Aimene, Y., Hammerquist, C., and Ouenes, A. (2019). Anisotropic Damage Mechanics for Asymmetric Hydraulic Fracture Height Propagation in a Layered Unconventional Gas Reservoir. J. Nat. Gas Sci. Eng. 67, 1–13. doi:10.1016/j.jngse.2019.04.013
Al-Busaidi, A., Hazzard, J. F., and Young, R. P. (2005). Distinct element modeling of hydraulically fractured Lac du Bonnet granite. J. Geophys. Res. 110, B06302. doi:10.1029/2004JB003297
AlTammar, M. J., Agrawal, S., and Sharma, M. M. (2019). Effect of Geological Layer Properties on Hydraulic-Fracture Initiation and Propagation: An Experimental Study. SPE J. 24 (2), 757–794. doi:10.2118/184871-PA
Chang, X., Wang, J., Tang, C., and Ru, Z. (2016). Effects of Interface Behavior on Fracture Spacing in Layered Rock. Rock Mech. Rock Eng. 49, 1733–1746. doi:10.1007/s00603-015-0852-5
Chen, Y., Nagaya, Y., and Ishida, T. (2015). Observations of Fractures Induced by Hydraulic Fracturing in Anisotropic Granite. Rock Mech. Rock Eng. 48 (4), 1455–1461. doi:10.1007/s00603-015-0727-9
Chen, Z. (2012). Finite Element Modelling of Viscosity-Dominated Hydraulic Fractures. J. Pet. Sci. Eng. 88-89 (1), 136–144. doi:10.1016/j.petrol.2011.12.021
Chuprakov, D., Melchaeva, O., and Prioul, R. (2014). Injection-sensitive Mechanics of Hydraulic Fracture Interaction with Discontinuities. Rock Mech. Rock Eng. 47, 1625–1640. doi:10.1007/s00603-014-0596-7
Dehghan, A. N., Goshtasbi, K., Ahangari, K., and Jin, Y. (2015). The Effect of Natural Fracture Dip and Strike on Hydraulic Fracture Propagation. Int. J. Rock Mech. Mining Sci. 75, 210–215. doi:10.1016/j.ijrmms.2015.02.001
Deng, H., Liu, Y., Peng, X., Liu, Y., and Li, H. A. (2018). A New index Used to Characterize the Near-Wellbore Fracture Network in Naturally Fractured Gas Reservoirs. J. Nat. Gas Sci. Eng. 55, 52–63. doi:10.1016/j.jngse.2018.04.018
Douma, L. A. N. R., Regelink, J. A., Bertotti, G., Boersma, Q. D., and Barnhoorn, A. (2019). The Mechanical Contrast between Layers Controls Fracture Containment in Layered Rocks. J. Struct. Geology. 127, 103856. doi:10.1016/j.jsg.2019.06.015
Gao, Q., and Ghassemi, A. (2020). Three Dimensional Finite Element Simulations of Hydraulic Fracture Height Growth in Layered Formations Using a Coupled Hydro-Mechanical Model. Int. J. Rock Mech. Mining Sci. 125, 104137. doi:10.1016/j.ijrmms.2019.104137
Gao, Q., Han, S., Cheng, Y., Yan, C., Sun, Y., and Han, Z. (2019). Effects of Non-uniform Pore Pressure Field on Hydraulic Fracture Propagation Behaviors. Eng. Fracture Mech. 221, 106682. doi:10.1016/j.engfracmech.2019.106682
Germanovich, L. N., and Astakhov, D. K. (2004). Fracture Closure in Extension and Mechanical Interaction of Parallel Joints. J. Geophys. Res. 109, B02208. doi:10.1029/2002jb002131
Ghaderi, S. M., and Clarkson, C. R. (2016). Estimation of Fracture Height Growth in Layered Tight/shale Gas Reservoirs Using Flowback Gas Rates and Compositions - Part I: Model Development. J. Nat. Gas Sci. Eng. 36, 1018–1030. doi:10.1016/j.jngse.2016.05.058
Gu, H. R., and Siebrits, E. (2008). Effect of Formation Modulus Contrast on Hydraulic Fracture Height Containment. SPE Prod. Oper. 23 (2), 170–176. doi:10.2118/103822-pa
Guo, J., Lu, Q., Zhu, H., Wang, Y., and Ma, L. (2015). Perforating Cluster Space Optimization Method of Horizontal Well Multi-Stage Fracturing in Extremely Thick Unconventional Gas Reservoir. J. Nat. Gas Sci. Eng. 26, 1648–1662. doi:10.1016/j.jngse.2015.02.014
Guo, J., Luo, B., Lu, C., Lai, J., and Ren, J. (2017). Numerical Investigation of Hydraulic Fracture Propagation in a Layered Reservoir Using the Cohesive Zone Method. Eng. Fracture Mech. 186, 195–207. doi:10.1016/j.engfracmech.2017.10.013
Gutierrez Escobar, R., Mejia Sanchez, E. C., Roehl, D., and Romanel, C. (2019). Xfem Modeling of Stress Shadowing in Multiple Hydraulic Fractures in Multi-Layered Formations. J. Nat. Gas Sci. Eng. 70, 102950. doi:10.1016/j.jngse.2019.102950
Haddad, M., and Sepehrnoori, K. (2015). Simulation of Hydraulic Fracturing in Quasi-Brittle Shale Formations Using Characterized Cohesive Layer: Stimulation Controlling Factors. J. Unconv. Oil Gas Resour. 9, 65–83. doi:10.1016/j.juogr.2014.10.001
Hadei, M. R., and Veiskarami, A. (2021). An Experimental Investigation of Hydraulic Fracturing of Stratified Rocks. Bull. Eng. Geol. Environ. 80, 491–506. doi:10.1007/s10064-020-01938-0
Ham, S.-M., and Kwon, T.-H. (2020). Photoelastic Observation of Toughness-Dominant Hydraulic Fracture Propagation across an Orthogonal Discontinuity in Soft, Viscoelastic Layered Formations. Int. J. Rock Mech. Mining Sci. 134, 104438. doi:10.1016/j.ijrmms.2020.104438
Huang, B., and Liu, J. (2017). Experimental Investigation of the Effect of Bedding Planes on Hydraulic Fracturing under True Triaxial Stress. Rock Mech. Rock Eng. 50, 2627–2643. doi:10.1007/s00603-017-1261-8
Ju, Y., Wang, Y., Xu, B., Chen, J., and Yang, Y. (2019). Numerical Analysis of the Effects of Bedded Interfaces on Hydraulic Fracture Propagation in Tight Multilayered Reservoirs Considering Hydro-Mechanical Coupling. J. Pet. Sci. Eng. 178, 356–375. doi:10.1016/j.petrol.2019.03.049
Kresse, O., Weng, X., Gu, H., and Wu, R. (2013). Numerical Modeling of Hydraulic Fractures Interaction in Complex Naturally Fractured Formations. Rock Mech. Rock Eng. 46 (3), 555–568. doi:10.1007/s00603-012-0359-2
Li, W., Li, L. C., and Tang, C. A. (2016). Numerical Simulation Research on Mechanism of Induced Stress Perturbation between Parallel Fractures in Horizontal wells. Nat. Gas Geos. 27 (11), 2043–2053. doi:10.11764/j.issn.1672-1926.2016.11.2043
Li, Z., Li, L., Huang, B., Zhang, L., Li, M., Zuo, J., et al. (2017). Numerical Investigation on the Propagation Behavior of Hydraulic Fractures in Shale Reservoir Based on the DIP Technique. J. Pet. Sci. Eng. 154, 302–314. doi:10.1016/j.petrol.2017.04.034
Li, Z., Li, L., Li, M., Zhang, L., Zhang, Z., Huang, B., et al. (2018). A Numerical Investigation on the Effects of Rock Brittleness on the Hydraulic Fractures in the Shale Reservoir. J. Nat. Gas Sci. Eng. 50, 22–32. doi:10.1016/j.jngse.2017.09.013
Li, T., Li, L., Tang, C. A., Zhang, Z., Li, M., Zhang, L., et al. (2019). A Coupled Hydraulic-Mechanical-Damage Geotechnical Model for Simulation of Fracture Propagation in Geological media during Hydraulic Fracturing. J. Pet. Sci. Eng. 173, 1390–1416. doi:10.1016/j.petrol.2018.10.104
Liu, Z., Wang, S., Zhao, H., Wang, L., Li, W., Geng, Y., et al. (2017). Effect of Random Natural Fractures on Hydraulic Fracture Propagation Geometry in Fractured Carbonate Rocks. Rock Mech. Rock Eng. 51 (3), 491–511. doi:10.1007/s00603-017-1331-y
Liu, Z., Ren, X., Lin, X., Lian, H., Yang, L., and Yang, J. (2020). Effects of Confining Stresses, Pre-crack Inclination Angles and Injection Rates: Observations from Large-Scale True Triaxial and Hydraulic Fracturing Tests in Laboratory. Rock Mech. Rock Eng. 53, 1991–2000. doi:10.1007/s00603-019-01995-2
Mu, W., Wang, D., Li, L., Yang, T., Feng, Q., Wang, S., et al. (2021). Cement Flow in Interaction Rock Fractures and its Corresponding New Construction Process in Slope Engineering. Construct. Build. Mater. 303 (11), 124533. doi:10.1016/j.conbuildmat.2021.124533
Nagel, N. B., and Sanchez-Nagel, M. (2011). Stress Shadowing and Microseismic Events: A Numerical Evolution. Denver, CO: Society of Petroleum Engineers. doi:10.2118/147363-MS
Nagel, N. B., Sanchez-Nagel, M. A., Zhang, F., Garcia, X., and Lee, B. (2013). Coupled Numerical Evaluations of the Geomechanical Interactions between a Hydraulic Fracture Stimulation and a Natural Fracture System in Shale Formations. Rock Mech. Rock Eng. 46 (3), 581–609. doi:10.1007/s00603-013-0391-x
Nejad, A. M., Shelley, R. F., Lehman, L. V., Shah, K., Gusain, D., and Conway, M. T. (2013). Development of a Brittle Shale Fracture Network Model. The Woodlands, TX: Society of Petroleum Engineers. doi:10.2118/163829-MS
Nordiana, M. M., Nordiana, A. N., Zakaria, M. T., and Adeeko, T. O. (2019). Distinction of the Type of Mudstone at Bukit Chondong, Perlis Using 2-d Resistivity Method. Kuala Lumpur, Malaysia: European Association of Geoscientists & Engineers EAGE. doi:10.3997/2214-4609.201900419
Oyedokun, O., and Schubert, J. (2017). A Quick and Energy Consistent Analytical Method for Predicting Hydraulic Fracture Propagation through Heterogeneous Layered media and Formations with Natural Fractures: The Use of an Effective Fracture Toughness. J. Nat. Gas Sci. Eng. 44, 351–364. doi:10.1016/j.jngse.2017.05.001
Palmer, I. D. (1993). “Induced Stresses Due to Propped Hydraulic Fracture in Coalbed Methane Wells,” in Rocky Mountain Regional Meeting/Low Permeability Reservoirs Symposium and Exhibition Denver, CO, 221–244. doi:10.2118/25861-MS
Pan, R., Zhang, G., Li, S., Zheng, X., Xu, C., and Fan, Z. (2020). Influence of the Fracture Process Zone on Fracture Propagation Mode in Layered Rocks. J. Pet. Sci. Eng. 202, 108524. doi:10.1016/j.petrol.2021.108524
Qin, M., Yang, D., Chen, W., and Yang, S. (2021). Hydraulic Fracturing Model of a Layered Rock Mass Based on Peridynamics. Eng. Fract. Mech. 258, 108088. doi:10.1016/j.engfracmech.2021.108088
Salimzadeh, S., Hagerup, E. D., Kadeethum, T., and Nick, H. M. (2019). The Effect of Stress Distribution on the Shape and Direction of Hydraulic Fractures in Layered media. Eng. Fract. Mech. 215, 151–163. doi:10.1016/j.engfracmech.2019.04.041
Tan, P., Jin, Y., Han, K., Hou, B., Chen, M., Guo, X., et al. (2017). Analysis of Hydraulic Fracture Initiation and Vertical Propagation Behavior in Laminated Shale Formation. Fuel 206, 482–493. doi:10.1016/j.fuel.2017.05.033
Tan, P., Jin, Y., and Pang, H. (2021). Hydraulic Fracture Vertical Propagation Behavior in Transversely Isotropic Layered Shale Formation with Transition Zone Using XFEM-Based CZM Method. Eng. Fracture Mech. 248 (16), 107707. doi:10.1016/j.engfracmech.2021.107707
Vahab, M., Hirmand, M. R., Jafari, A., and Khalili, N. (2021). Numerical Analysis of Multiple Hydro-Fracture Growth in Layered media Based on a Non-differentiable Energy Minimization Approach. Eng. Fract. Mech. 241, 107361. doi:10.1016/j.engfracmech.2020.107361
Wan, X., Rasouli, V., Damjanac, B., and Pu, H. (2020). Lattice Simulation of Hydraulic Fracture Containment in the North Perth Basin. J. Pet. Sci. Eng. 188, 106904. doi:10.1016/j.petrol.2020.106904
Warpinski, N. R., and Branagan, P. T. (1989). Altered-Stress Fracturing. J. Petrol. Tech. 1989 41 (9), 990–997. doi:10.2118/17533-PA
Wasantha, P. L. P., and Konietzky, H. (2017). Hydraulic Fracture Propagation under Varying In-Situ Stress Conditions of Reservoirs. Proced. Eng. 191, 410–418. doi:10.1016/j.proeng.2017.05.198
Xing, P., Yoshioka, K., Adachi, J., El-Fayoumi, A., Damjanac, B., and Bunger, A. P. (2018). Lattice Simulation of Laboratory Hydraulic Fracture Containment in Layered Reservoirs. Comput. Geotech. 100, 62–75. doi:10.1016/j.compgeo.2018.03.010
Yang, Y., and Zoback, M. (2016). Viscoplastic Deformation of the Bakken and Adjacent Formations and its Relation to Hydraulic Fracture Growth. Rock Mech. Rock Eng. 49, 689–698. doi:10.1007/s00603-015-0866-z
Yao, Y. (2012). Linear Elastic and Cohesive Fracture Analysis to Model Hydraulic Fracture in Brittle and Ductile Rocks. Rock Mech. Rock Eng. 45, 375–387. doi:10.1007/s00603-011-0211-0
Zhang, X., Wu, B., Jeffrey, R. G., Connell, L. D., and Zhang, G. (2017). A pseudo-3D Model for Hydraulic Fracture Growth in a Layered Rock. Int. J. Sol. Struct. 115-116, 208–223. doi:10.1016/j.ijsolstr.2017.03.022
Zhao, H., and Chen, M. (2010). Extending Behavior of Hydraulic Fracture when Reaching Formation Interface. J. Pet. Sci. Eng. 74 (1-2), 26–30. doi:10.1016/j.petrol.2010.08.003
Zhu, H., Zhang, X., Guo, J., Xu, Y., Chen, L., Yuan, S., et al. (2015). Stress Field Interference of Hydraulic Fractures in Layered Formation. Geomech. Eng. 9 (5), 645–667. doi:10.12989/gae.2015.9.5.645
Zhu, H., Tang, X., Liu, Q., Li, K., Xiao, J., Jiang, S., et al. (2018). 4D Multi-Physical Stress Modelling during Shale Gas Production: A Case Study of Sichuan Basin Shale Gas Reservoir, China. J. Pet. Sci. Eng. 167, 929–943. doi:10.1016/j.petrol.2018.04.036
Keywords: multiple hydraulic fractures, stress interference, layered formation, flow distribution, numerical investigation
Citation: Li Z, Wang S, Li L and Zhang J (2022) Numerical Investigation on Interference of Multiple Hydraulic Fractures in Layered Formation. Front. Earth Sci. 10:865155. doi: 10.3389/feart.2022.865155
Received: 01 February 2022; Accepted: 28 March 2022;
Published: 10 May 2022.
Edited by:
Sheng-Qi Yang, China University of Mining and Technology, ChinaReviewed by:
Pengfei Shan, Xi’an University of Science and Technology, ChinaZhengzhao Liang, Dalian University of Technology, China
Copyright © 2022 Li, Wang, Li and Zhang. This is an open-access article distributed under the terms of the Creative Commons Attribution License (CC BY). The use, distribution or reproduction in other forums is permitted, provided the original author(s) and the copyright owner(s) are credited and that the original publication in this journal is cited, in accordance with accepted academic practice. No use, distribution or reproduction is permitted which does not comply with these terms.
*Correspondence: Shuren Wang, d19zcjg4QDE2My5jb20=