 Daniel Bertin1*
 Jan M. Lindsay1
 Shane J. Cronin1
 Shanaka L. de Silva2
 Charles B. Connor3
 Pablo J. Caffe4
 Pablo Grosse5,6
 Walter Báez7
 Emilce Bustos7
 Robert Constantinescu3
- 1School of Environment, University of Auckland, Auckland, New Zealand
- 2College of Earth, Ocean, and Atmospheric Sciences, Oregon State University, Corvallis, OR, United States
- 3School of Geosciences, University of South Florida, Tampa, FL, United States
- 4Instituto de Ecorregiones Andinas and Instituto de Geología y Minería (CONICET — Universidad Nacional de Jujuy), San Salvador de Jujuy, Argentina
- 5Consejo Nacional de Investigaciones Científicas y Técnicas (CONICET), Argentina
- 6Fundación Miguel Lillo, San Miguel de Tucumán, Argentina
- 7Instituto de Bio y Geociencias del NOA (IBIGEO, UNSa-CONICET), Salta, Argentina
Evaluation of volcanic hazards typically focusses on single eruptive centres or spatially restricted areas, such as volcanic fields. Expanding hazard assessments across wide regions (e.g., large sections of a continental margin) has rarely been attempted, due to the complexity of integrating temporal and spatial variability in tectonic and magmatic processes. In this study, we investigate new approaches to quantify the hazards of such long-term active and complex settings, using the example of the 22.5–28°S segment of the Central Volcanic Zone of the Andes. This research is based on the estimation of: 1) spatial probability of future volcanic activity (based on kernel density estimation using a new volcanic geospatial database), 2) temporal probability of future volcanic events, and 3) areas susceptible to volcanic flow and fall processes (based on computer modeling). Integrating these results, we produce a set of volcanic hazard maps. We then calculate the relative probabilities of population centres in the area being affected by any volcanic phenomenon. Touristic towns such as La Poma (Argentina), Toconao (Chile), Antofagasta de la Sierra (Argentina), Socaire (Chile), and Talabre (Chile) are exposed to the highest relative volcanic hazard. In addition, through this work we delineate five regions of high spatial probability (i.e., volcanic clusters), three of which correlate well with geophysical evidence of mid-crustal partial melt bodies. Many of the eruptive centres within these volcanic clusters have poorly known eruption histories and are recommended to be targeted for future work. We hope this contribution will be a useful approach to encourage probabilistic volcanic hazard assessments for other arc segments.
Introduction
Traditionally, volcanic hazards are assessed at the scale of single volcanic systems, such as stratovolcanoes (e.g., Ogburn et al., 2020), or single volcanic fields (e.g., Connor and Hill, 1995). Motivation for hazard assessments typically stems from a perception of future risk, based on past eruptive casualties, rapid population and infrastructure growth, insights from new age or other geological information, and/or an increase in unrest indicators (e.g., Siebe and Macías, 2003; Bird et al., 2010; Sandri et al., 2014; Biass et al., 2016;Charbonnier et al., 2020; Jiménez et al., 2020). Volcanic hazard assessments depend upon assembling detailed information on eruption frequency, magnitude and style, integrating information from diverse geomorphic, structural, geochronological, geophysical, and geochemical data (e.g., Clavero et al., 2004; Harpel et al., 2011; Johnston et al., 2011; Alloway et al., 2017).
Different tools are required for assessing volcanic hazards at distributed volcanic fields (e.g., Bartolini et al., 2015; Sieron et al., 2021), volcanic islands (e.g., Becerril et al., 2014; Cappello et al., 2016), caldera systems (e.g., Bevilacqua et al., 2015; Charlton et al., 2020), and large complex multi-vent volcanoes (e.g., Cappello et al., 2012; Jiménez et al., 2018). The greatest problem in dealing with such complex volcanic systems is that the distribution of specific eruptive hazards needs to be examined in relation to the locations of possible vent opening (e.g., Sandri et al., 2018; Bevilacqua et al., 2021). In addition to investigating spatial variability, long-lived volcanism at complex sites generates strong temporal hazard variability, which is a challenge to understand in contemporary forecasts (e.g., Bebbington and Cronin, 2011; Lerner et al., 2019).
The problems of integrating spatial and temporal variations in hazard are compounded when examining larger areas of interest, such as volcanic arcs. Past regional-scale assessments typically analysed every volcano independently (e.g., Mullineaux, 1976; Miller, 1989; Lara et al., 2011; Amigo et al., 2012). However, this is only feasible when a handful of volcanoes in a region are considered. If dozens or hundreds of volcanic centres are analysed, new approaches and methods are needed. Techniques have been developed to forecast the location and timing of future volcanic vent opening in arc segments (Martin et al., 2004; Jaquet et al., 2012, Jaquet et al., 2017; Germa et al., 2013; Kósik et al., 2020; O’Hara et al., 2020), which is the first step towards regional assessments. There is a further need to integrate spatial and temporal histories into these types of analyses, along with a comprehensive and systematic methodology to evaluate different types, frequencies and scales of volcano processes associated with each vent/volcano. Another challenge when carrying out volcanic hazard assessments in large and complex volcanic regions is the inherent difficulty of collecting comprehensive data that are of similar quality and resolution across a broad area. Even data coverage, such as in age information, mapping or volume estimations are less likely (and less affordable) as the spatial scope increases to whole arcs or long-lived continental margin segments.
Despite the complex challenge that the assessment represents, evaluating volcanic hazards over very large areas can be useful for a first-order synoptic assessment to enable the targeting of limited resources for new investigations or mitigation efforts to the most important areas. Furthermore, a regional long-term analysis can help to understand larger system changes that may highlight critical features for future hazard, such as regional migration of volcanic focussing, arc-scale variations in volcanic flux, and other specific regional-based tectonic or other drivers for volcanic flare-ups.
In consequence, in this study we examine approaches to understand the relative spatial and temporal aspects of volcanic hazards within a large continental margin setting. This study is based on an area between latitudes 22.5–28°S along the Central Volcanic Zone of the Andes of South America (Figure 1). This region records ∼35 Myr of uninterrupted volcanic activity, comprising a vast variety of activity types, volcanic landforms and erupted compositions. It includes the site of one of the largest (VEI 6+) Holocene explosive eruptions in the Andes, which occurred approximately 4.2 ka BP from the Cerro Blanco volcanic complex (26.8°S/67.7°W) (Báez et al., 2015; Fernández-Turiel et al., 2019; Báez et al., 2020a; de Silva et al., 2022), whereas the only confirmed historical (i.e., post ∼1750 AD) eruptions in this arc segment occurred at Láscar (23.4°S/67.7°W), with the largest event (VEI of 3-4) in April 1993 (Gardeweg and Medina, 1994). However, much of the volcanic history of this area remains poorly constrained, even though many morphologically young volcanic features can be recognized throughout the region and several of these are considered potentially active (de Silva and Francis, 1991; González-Ferrán, 1995).
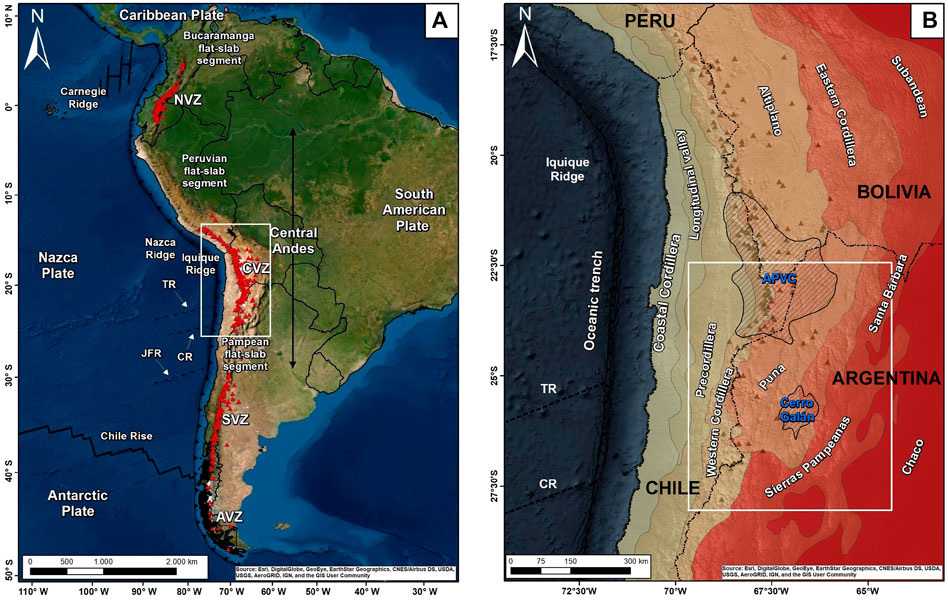
FIGURE 1. (A) Location map of the Central Andes, showing the main tectonic elements. JFR = Juan Fernández, TR = Taltal, and CR = Copiapó ridges. NVZ = Northern Volcanic Zone, CVZ = Central Volcanic Zone, SVZ = Southern Volcanic Zone, and AVZ = Austral Volcanic Zone, according to Stern et al. (2007). (B) Main tectonomorphic regions of the Central Andes. White rectangle in (B) indicates our study area. Red triangles in (A) and grey triangles in (B) correspond to the Neogene-Quaternary volcanoes according to Siebert et al. (2010). The black striped regions in (B) show the Altiplano-Puna Volcanic Complex (APVC; de Silva, 1989) and the Cerro Galán (Kay et al., 2011) ignimbrite provinces.
Here, we merge the MatHaz tool of Bertin et al. (2019) with a new volcanic geospatial database (Bertin et al., 2022) to generate the first probabilistic volcanic hazard assessment for the ∼22.5–28°S segment of the Central Volcanic Zone of the Andes. MatHaz is an open-source computer code that performs an integrated probabilistic volcanic hazard assessment in regions characterized by distributed volcanism, whereas the Bertin et al. (2022) database collates, for the study area, all available late Cenozoic (<36 Ma) information on volcano types, vent locations, eruptive volumes and eruption ages. By integrating these two resources, we identify the most likely regions to host future volcanic activity, and delineate areas likely to be affected by pyroclastic density currents, ballistic projectiles, lava flows, debris flows, and tephra fallout. In doing so we are able to recognize, for the first time, order-of-magnitude variations in volcanic hazards across the region. After integrating these results into a single hazard map, we evaluate the relative volcanic hazard for all the settlements of the region. Overall, we hope the approach and results from our study will provide a guide for more targeted hazard and risk assessments in the future.
Tectonic Setting of the ∼22.5–28°S Segment
The ∼22.5–28 S segment of the western margin of South America is part of the Central Volcanic Zone (CVZ) of the Central Andes (e.g., Stern et al., 2007) (Figure 1A). The Central Andes is an orogenic belt located between ∼5 and −33°S that includes the CVZ and two flat slab segments (Peruvian to the north and Pampean to the south). The CVZ spans between ∼13 and −28°S, and includes active and potentially active volcanoes of southern Peru, northern Chile, western Bolivia and northwestern Argentina. Volcanism in this region can be traced as far back as the Early Jurassic (190–180 Ma) (e.g., Parada et al., 2007; Ramos, 2009). Volcanic activity was semi-continuous since then, and its front migrated inland from the Coastal Cordillera (Early Jurassic-Late Cretaceous arc) to the Precordillera (Late Cretaceous-Paleogene arc), and then to the Western Cordillera (Neogene-Quaternary arc) (e.g., James and Sacks, 1999; Haschke et al., 2002; Charrier et al., 2007; Hoke and Lamb, 2007) (Figure 1B). During the middle Miocene, volcanic activity broadened to the east across much of the Altiplano-Puna (a hinterland plateau), and then progressively retreated back to the Western Cordillera during the upper Miocene and Pliocene (e.g., Coira et al., 1993; Allmendinger et al., 1997; Trumbull et al., 2006; Kay and Coira, 2009; Guzmán et al., 2014).
The magmatic broadening and narrowing event has been linked to a transient shallowing of the subduction zone due to the passage of the Juan Fernández Ridge (e.g., Trumbull et al., 2006; Kay and Coira, 2009; Freymuth et al., 2015; de Silva and Kay, 2018). This ridge, along with the Taltal and Copiapó oceanic ridges, earlier caused a flat slab event that affected a large segment of the Central Andean margin centred at ∼18–20°S during the Eocene-Oligocene (45–25 Ma) (James and Sacks, 1999; O’Driscoll et al., 2012; Bello-González et al., 2018; Martinod et al., 2020). The passage of the Juan Fernández Ridge was followed 5–10 Myr later by a period of large-volume volcanism (e.g., Kay and Coira, 2009; Kay et al., 2010; Beck et al., 2015; Freymuth et al., 2015; Brandmeier and Wörner, 2016), which resulted in the Central Andean Neogene Ignimbrite Province (Kay et al., 2010; de Silva and Kay, 2018). In particular, the Altiplano-Puna Volcanic Complex (APVC; de Silva, 1989) and Cerro Galán (Kay et al., 2011) ignimbrite provinces are prominent foci in the study area (Figure 1B). The first-order correlation between the passage of the Juan Fernández Ridge and large-volume volcanism has given rise to the proposal that the southernmost segment of the CVZ (i.e., around ∼27–28°S) has the potential to host a magmatic flare-up in the future (e.g., Kay and Coira, 2009; Beck et al., 2015; Ward et al., 2017). In addition, along with the arc broadening and narrowing, back-arc mafic magmatism also occurred in this region in response to lithospheric foundering events (e.g., Kay et al., 1994; Risse et al., 2013; Mulcahy et al., 2014; Maro et al., 2017; Chen et al., 2020; Gao et al., 2021). Collectively, volcanism has been controlled by a range of varying tectonic processes (e.g., Tibaldi et al., 2017; Naranjo et al., 2018; Morfulis et al., 2020).
Currently, Láscar is the most active volcano in this segment of the CVZ (Figure 2), with 34 eruptions recorded between 1848 and October 2015 (Casertano, 1963; González-Ferrán, 1995; Petit-Breuilh, 2004; Global Volcanism Program, 2016). Láscar has also produced the only VEI 3-4 eruption in this arc segment in the historical record (i.e., since ∼1750 AD), in April 1993. Other volcanoes with unconfirmed historical eruptions include (Figure 2): Llullaillaco, with seven events between 1854 and 1960 (Casertano, 1963; Petit-Breuilh, 2004); Aracar, with one event in March 1993 (Global Volcanism Program, 1993a); and Ojos del Salado, with one event in November 1993 (Global Volcanism Program, 1993b). Four volcanoes host long-term active fumarolic activity: Alítar, Láscar, Lastarria, and Ojos del Salado (de Silva and Francis, 1991; González-Ferrán, 1995), four are actively deforming: Lastarria, Cordón del Azufre, Cerro Bayo, and Cerro Blanco (Pritchard and Simons, 2002; Henderson and Pritchard, 2013), and nine have shown thermal anomalies detected by infrared satellite imagery: Licancabur, Alítar, Láscar, Chiliques, Púlar-Pajonales, Lastarria, Sierra Nevada, Falso Azufre, and Ojos del Salado (Jay et al., 2013). Only two of these volcanoes, Láscar and Lastarria, are currently actively monitored (Amigo, 2021; Aguilera et al., 2022).
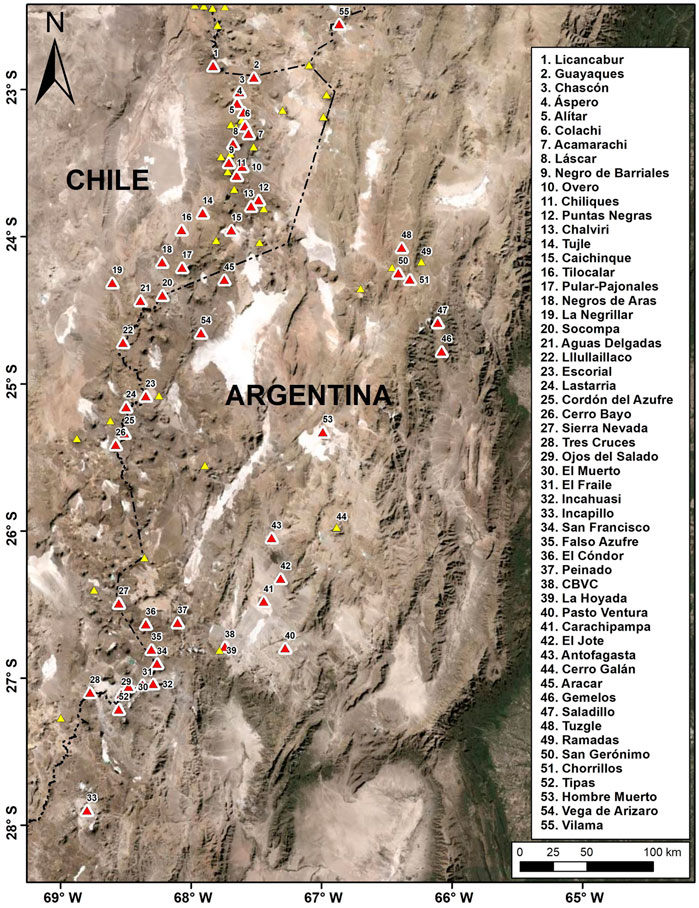
FIGURE 2. The Central Volcanic Zone of the Andes of Chile and Argentina (∼22.5–28°S). Yellow and red triangles correspond to the Plio-Pleistocene and Pleistocene-Holocene volcanoes in the region, respectively, modified from Siebert et al. (2010). Minor monogenetic fields/centres have been included as well. All the volcanoes of interest are labelled. CBVC = Cerro Blanco volcanic complex.
Eruption histories of only a few volcanoes in the region have been comprehensively studied (e.g., Richards and Villeneuve, 2001; Richards et al., 2006; Naranjo, 2010; Gardeweg et al., 2011; Norini et al., 2014; Grosse et al., 2018, Grosse et al., 2022; Bustos et al., 2019); overall, they reveal a rich history of activity ranging in type (from effusive to explosive), volume (from <10−3 to 10 s of km3 of magma), and composition (from basaltic andesites to rhyolites). Specific vents at Láscar, Lastarria, and Cerro Blanco have been thoroughly studied and are known to pose high hazard (Perucca and Moreiras, 2009; Amigo et al., 2012; Gardeweg and Amigo, 2015; Elissondo et al., 2016). However, these vents are a small fraction of the hundreds of youthful-looking existing vents in the area. The lack of detailed information on these other vents has hindered systematic regional hazard assessment. Recent studies have just begun to assess specific hazards in this area, including: pyroclastic density currents (Cerro Blanco; Báez et al., 2020a; Báez et al., 2020b), ballistic projectiles (Láscar; Bertin, 2017), lava flows (Chorrillos and San Gerónimo; Fernández-Turiel et al., 2021), debris flows (Lastarria; Rodríguez et al., 2020), and tephra fallout (Cerro Blanco; Fernández-Turiel et al., 2019). Building on this, a regional perspective on volcanic hazards is needed in order to identify which volcanic regions are most likely to become active in the future, which areas will be affected the most by future volcanic activity, and to motivate additional studies to better understand hazards at more detailed scales. The regional hazard assessment presented here is based on a comprehensive volcanic database and simplified tools for modeling volcanic hazards.
Methods
Volcanic hazard assessments for specific segments of the CVZ (Perucca and Moreiras, 2009; Amigo et al., 2012; Ayala, 2014; Macedo et al., 2016) have typically analysed each volcano independently and conditional upon an eruption occurring. However, this approach is best suited for comparison of a handful of volcanoes. If hundreds of volcanic centres are analysed, as it is the case here, different approaches and methods are needed to take spatial and temporal variations in hazard into account. On the broadest scale, different techniques have been developed to forecast the location and timing of future volcanic activity in arc segments (e.g., Martin et al., 2004; Jaquet et al., 2012; Germa et al., 2013; Jaquet et al., 2017; Kósik et al., 2020; O’Hara et al., 2020). Of these, the approach of Martin et al. (2004) is particularly useful for the purposes of our application as it performs an estimation of the spatio-temporal hazard by modeling each volcanic vent as monogenetic or polygenetic. Hence, following the Martin et al. (2004) approach, we classified the volcanic vents within our study area (vents extracted from the Bertin et al., 2022 database) according to their categories (Németh and Kereszturi, 2015): monogenetic (single event in unique site), transitional-polycyclic (multiple events but each with a unique magma driver), or polygenetic (multiple events driven by a long-lived magmatic feeding system), based on the amount and type of different volcanic phenomena sourced from each vent (see Supplementary Table S1 for the criteria followed). We concentrated our analysis on the last 36 Myr, postdating the latest major magmatic migration of the arc.
The Bertin et al. (2022) database lists 2,950 volcanic vents and 2,057 volcanic deposits (e.g., ignimbrite sheets, lava flows). For simplicity, to estimate vents for those volcanic deposits without an evident source location, 479 additional vents were mapped at the geometric centres of the deposits; thus 3,429 vents were identified in total (1,825 monogenetic, 133 transitional-polycyclic, 1,471 polygenetic). For every volcanic vent, maximum and minimum ages (expressed as a mean and two standard deviations) were assigned based on the radiometric ages of its associated volcanic deposits. For volcanic deposits lacking radiometric ages, estimations were conducted based on the ages of the adjoining deposits with a clear stratigraphic relationship. If this was not possible, a broad estimate was made based on the ages of all neighbouring deposits with similar geomorphic preservation. The volcanic vents layer thus created is available in geospatial vector data format in Supplementary Material S1.
From Vents to Events
A major challenge in volcano science is to unravel the eruptive histories of volcanoes from the geologic record (e.g., Damaschke et al., 2018; Lerner et al., 2019; Pure et al., 2020). On an arc-scale, we cannot hope, at least at this point in time, to successfully integrate the volcanic histories of hundreds of volcanoes. Therefore, here we estimate the average number of volcanic events per vent type over a fixed time interval assuming a fixed erupted volume.
An additional hindrance is that, even for ‘monogenetic’ vents, it is not certain that each volcanic vent represents a single eruptive episode (Runge et al., 2014; Báez et al., 2016; Bevilacqua et al., 2017; Connor et al., 2018; Gallant et al., 2021). This uncertainty, along with the likely presence of buried and eroded vents, can be examined through statistical (Runge et al., 2014), morphometric (Nieto-Torres and Martin Del Pozzo, 2019), and spatio-temporal clustering (Gallant et al., 2021) techniques. However, due to the large study area and the availability of age and volume information in the Bertin et al. (2022) database (each volcanic deposit includes an age and volume range), here we followed an alternative approach. For each volcanic deposit within the database (excluding voluminous ignimbrites), a specific volume was estimated from the known volume ranges assuming a uniform distribution. These volumes were summed to obtain a total erupted volume. Using a Monte Carlo approach, the volume estimations were repeated 106 times, constraining the total volume of the arc segment to be between 15,800 and 16,400 km3. This volume range was then used to forecast the total number of volcanic events assuming the following: 1) age ranges were calculated for each vent by sampling their maximum and minimum ages; 2) every volcanic event had a volume of 0.1 km3, which is the total dense rock equivalent (DRE) volume calculated for the Láscar 1993 eruption (Calder et al., 2000; Gardeweg et al., 2011); and 3) a fixed time interval of 10 kyr from 36 Ma to present (i.e., 3,600 time bins), deemed here as a sensible partition to evaluate event recurrence rates in detail without dramatically losing computational efficiency. Monogenetic vents were assumed to have only one eruption, polycyclic vents were assumed to have one eruption every 10 kyr, and polygenetic eruption rates were unknown. Hence, we estimated the polygenetic eruption rate by trial and error. That is, we started with an arbitrary polygenetic eruption rate and calculated the total number of events 104 times. When the mean of the total number of events, multiplied by 0.1 km3, was within the range 15,800–16,400 km3, then we kept that polygenetic eruption rate and repeated the exercise with a slightly different eruption rate until the whole volume range was covered. The code used to perform these calculations is available in Supplementary Material S2.
The results indicate a rate of 0.4433 (−0.0078/+0.0081) events per 10 kyr per polygenetic vent. This means that for all post-10 ka potentially active vents (137), an estimated 45.77 (−1.41/+1.35) events occurred, i.e., a 218 (−6/+7) year interval between 0.1 km3 DRE events, a reasonable result taking into account that since AD ∼1750, only one 0.1 km3 eruption has been recorded in the region. The values obtained above, however, change when other event volumes are considered. This issue, and how it can influence the hazard analysis, is further addressed in the discussion.
Topographic Data
In order to provide a topographic digital base onto which conduct the hazard simulations, we compiled 135 ASTER GDEM v3 files (Advanced Spaceborne Thermal Emission and Reflection Digital Elevation Model; https://search.earthdata.nasa.gov). Each square degree tile has an average spatial resolution of ∼30 m and a vertical accuracy of 7–14 m (Talchabhadel et al., 2021). Using Global Mapper v18 (https://www.bluemarblegeo.com/global-mapper/), we clipped out the region inside 22–30°S/70–64°W and reduced the spatial resolution to 1,000 m in order to generate a manageable file (<10 Mb). This pixel size was used to adjust the coordinates of each vent to make them compatible with the grid. Finally, the topography was exported as an Excel file (Supplementary Material S3) to be loaded in MatHaz.
Spatial and Temporal Volcanic Hazard Assessments
MatHaz provides a semi-automated probabilistic volcanic hazard assessment in regions characterized by distributed volcanism (Supplementary Material S7). The spatial analysis was conducted using an elliptical bivariate Gaussian kernel function, which transforms the point location of every volcanic event into a 2D probability density function (e.g., Connor et al., 2018). Elliptical kernels are well suited to situations where tectonism exerts a strong control on volcanism (e.g., rift settings or arcs) (e.g., Connor et al., 2018; Bertin et al., 2019). To obtain the dominant ellipse axes and orientations, the bandwidth matrices have to be calculated first (e.g., Connor et al., 2018). Amongst the many methods to estimate a bandwidth matrix, the ĤPI,AMSE selector (PI: plug-in; AMSE: asymptotic mean squared error) was used in this case study due to its fast convergence to an optimal bandwidth (see Duong, 2005; Bertin et al., 2019). The influence of other bandwidth selectors on the kernel are addressed in the Discussion section.
MatHaz generates as many probability density functions as volcanic events, and groups them according to their age into different time bins. Here 36 time bins of 1 Myr each, spanning the range 36 Ma to Present, were defined in order to optimize simulation times. This required calculating the cumulative number of events per vent type for as long the vent was active with the restriction that no extra eruptions were added if the activity lasted more than 1 Myr. Thus, a rate of 44.33 (+0.78/−0.81) events per 1 Myr per polygenetic vent was obtained after extrapolating the eruption rates calculated above (see From Vents to Events). Similarly, a rate of 25.17 (−0.57/+0.56) events per 1 Myr was calculated for each polycyclic vent, and monogenetic vents were assigned a single event each. Finally, each vent was assigned to the time bin(s) representative of its period of activity (Supplementary Material S4).
For the temporal analysis it was assumed that future events will have a volume of 0.1 km3, with a mean recurrence rate of 45.77 events/10 kyr (see From Vents to Events). Spatial and temporal data were assumed to be independent (e.g., Connor et al., 2013), so multiplying them together was used to obtain the spatio-temporal matrix. The spatio-temporal probability at present was calculated based on the last 36 Myr record of volcanic activity following an age-weighting procedure using an exponentially decreasing function, with higher (lower) weights assigned to younger (older) volcanoes (for example, 10 Myr-old-vents contribute ∼4·10−5 whereas 20 Myr-old-vents contribute ∼2·10−9 to the final spatial density map; see Supplementary Material S7 for a detailed explanation on this). The probability of at least one volcanic event within a specific area (in km2) for a specific forecasting time interval (in years) was obtained by integrating the spatio-temporal matrix over a finite region. In order to work with a cumulative probability as close to 1 as possible (that is, at least one volcanic eruption is expected in the time interval of interest), a period of 10,000 years was deemed as a suitable forecasting time interval. Such a long time interval also eliminates the differences that arise when other event volumes are considered. This is further addressed in the Discussion section.
Volcanic Hazards
The most relevant volcanic hazards in the study area are: pyroclastic density currents, ballistics, lava flows (including lava domes), debris flows, and tephra fallout. The near-vent environment, with hazards associated with vent opening, short-lived phreatic explosions and toxic gas emissions, which are extremely difficult to model, are expected to be included in the ballistic ejecta zone, deemed here as an approximation of the proximal hazard zone. We did not model debris avalanches because it is unclear whether the debris avalanche deposits exposed in the study area were generated during an eruption or not (e.g., van Wyk de Vries et al., 2001; Norini et al., 2020; Rodríguez et al., 2020).
MatHaz uses an energy cone model for pyroclastic density currents (Malin and Sheridan, 1982), a two-dimensional analytical model for ballistic projectiles (Bertin, 2017), a flow inundation model for lava flows and debris flows (Connor et al., 2012), and a two-segment linear approximation for tephra fallout (Fierstein and Nathenson, 1992) (see Supplementary Material S7 for in-depth explanations about each technique). The input parameters of each model (e.g., volumes, thicknesses) were extracted from the Bertin et al. (2022) database and modeled as normal, lognormal or uniform distributions (Supplementary Figures S1–S5). The input parameters of each simulation were randomly sampled from these distributions. We ran simulations for as many different source locations as possible, which were convolved with the probabilities of a new eruption at those source locations within the time interval of interest (cf. Bertin et al., 2019). Results were then summed and normalized to obtain the probabilistic zoning for each volcanic hazard. We repeated this exercise ten times for each volcanic hazard to compare the outputs for the same inputs, and found that probabilities above ∼5×10⁻⁵ can be confidently defined (Supplementary Figures S6–S9). Finally, we combined the five modeling results into a single map (cf. Javidan et al., 2021) with an even weighting for each volcanic hazard. The choice of equal weighting was made in the absence of additional evidence to define specific relative weights for the different volcanic phenomena considered in our case study, although the interested reader can assign other weights (e.g., based on expert knowledge) using the files provided in Supplementary Material S5. The limitations of the code are addressed in the Discussion section.
Results
Spatial Analysis
Considering the 10−6 (events/km2) probability isocontour as a conservative boundary of volcanism at any time, most of the volcanic activity in the region is represented by a well-defined magmatic arc and small zones of back-arc activity (Figure 3A). In addition, we delineate five regions of relatively high spatial probability of future volcanic activity (above 10−5 events/km2), named here as clusters, which can be more clearly recognized if the spatial probabilities are shown following a cumulative scale (Figure 3B). These regions are:
1) Láscar cluster is N-S oriented and includes the Láscar, Colachi, Acamarachi, Chiliques, and Caichinque stratovolcanoes, the Alítar maar, the Chascón and Áspero domes, and the Chalviri and Puntas Negras volcanic chains.
2) Socompa cluster is roughly circular and includes the Socompa stratovolcano, the Púlar-Pajonales volcanic complex, and numerous distributed lava flows and cinder cones around Socompa, such as Negros de Aras/El Negrillar and Aguas Delgadas.
3) Lazufre cluster is elliptical with a NNE-SSW axis, and includes the Lastarria, Cordón del Azufre, and Cerro Bayo stratovolcanoes.
4) Incahuasi cluster is the largest of the five and includes several stratovolcanoes and volcanic complexes that straddle the Chile-Argentina border at around ∼27°S, such as Ojos del Salado, Tres Cruces, El Muerto, El Fraile, Tipas, Incahuasi, Falso Azufre, Sierra Nevada, El Cóndor, and Peinado.
5) The Antofagasta cluster is the most diffuse and the only one located in the back-arc. It includes the Cerro Blanco volcanic complex and several monogenetic mafic centres and isolated lava flows, such as Carachipampa, Pasto Ventura, and those in the Antofagasta de la Sierra region.
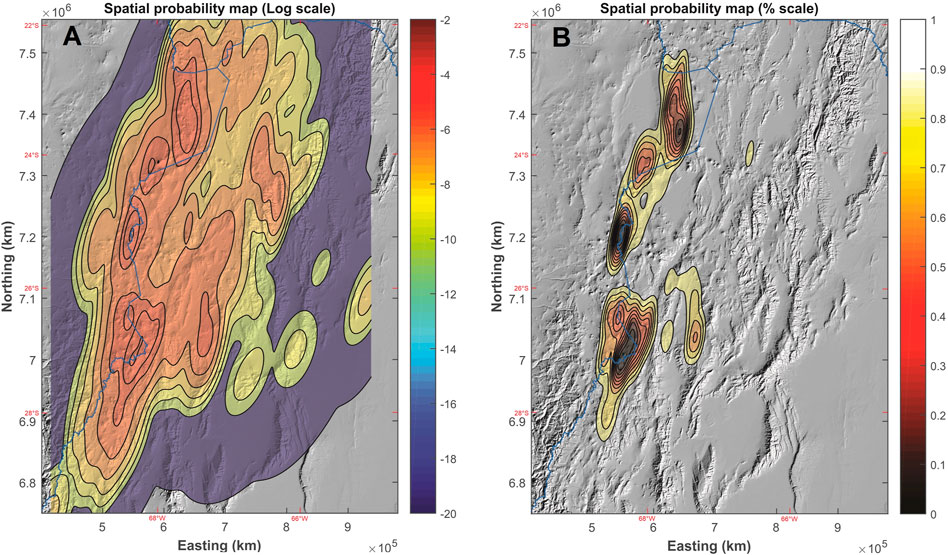
FIGURE 3. Spatial probability maps of volcanic activity for our study area: (A) Raw probabilities. Probability density functions were obtained after applying the kernel density estimation method and are shown as probability isocontours on a logarithmic scale to illustrate order-of-magnitude changes. (B) Cumulative probabilities. Given a volcanic event, there is a 50% chance it will occur within the area defined by the 0.5 isocontour. The locations of the five clusters defined in this work are indicated. Main coordinate grid is in UTM units (zone 19 S) as MatHaz works in a plane coordinate grid system. Legend units are events/km2. The political border between Chile, Argentina and Bolivia is depicted for reference (blue line). ASTER Digital elevation model used as a background image follows a greyscale colour scheme: the whiter the pixel, the higher the elevation.
Spatio-Temporal Analysis
Two spatio-temporal probability maps, generated for time intervals of 10 and 1,000 years (Figures 4A,B), show broadly similar areas of event location, with cumulative probabilities of ∼5% and ∼99%, respectively. The cumulative probability curve over time (Figure 5) indicates that a 50% probability of at least one 0.1 km3 eruption occurring anywhere in the study area is estimated within ∼150 years after the last 0.1 km3-event. Cumulative probability curves constructed using other volumes are shown in Supplementary Figure S14 and are further discussed in the next section.
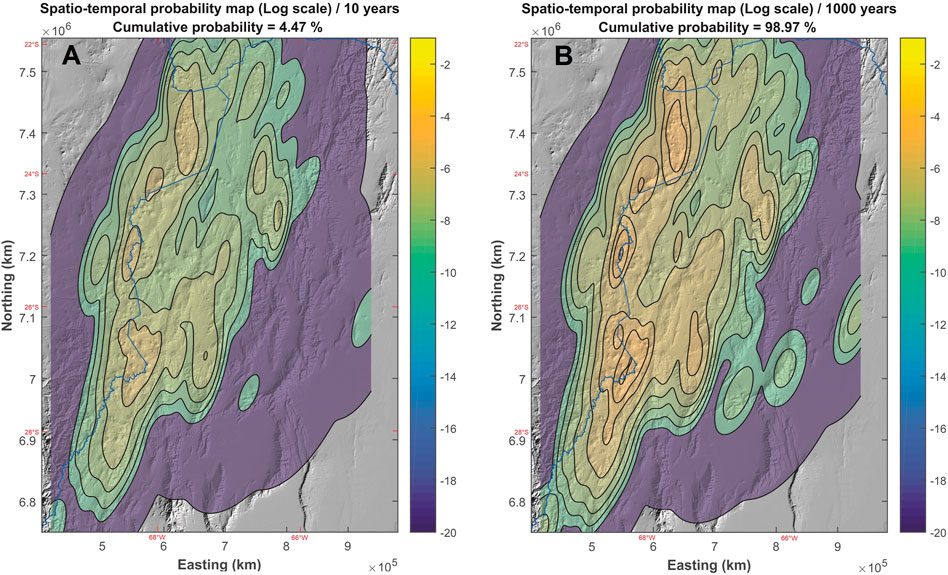
FIGURE 4. Spatio-temporal probability maps of future volcanic activity for our study area at different forecasting time intervals. Probabilities were obtained after multiplying the spatial probability map shown in Figure 3A by the event recurrence rate (45.77 events per 10 kyr) modeled as a homogeneous Poisson point process, and are shown as probability isocontours on a logarithmic scale to illustrate order-of-magnitude changes. Above each plot we include the cumulative probabilities of occurrence of at least one Láscar 1993-like (i.e., 0.1 km3) eruption for the next: (A) 10 years, and (B) 1,000 years, with 1993 taken as ‘year zero’. Legend units are events/time interval/km2. The political border between Chile, Argentina and Bolivia is depicted for reference (blue line). ASTER Digital elevation model used as a background image follows a greyscale colour scheme: the whiter the pixel, the higher the elevation.
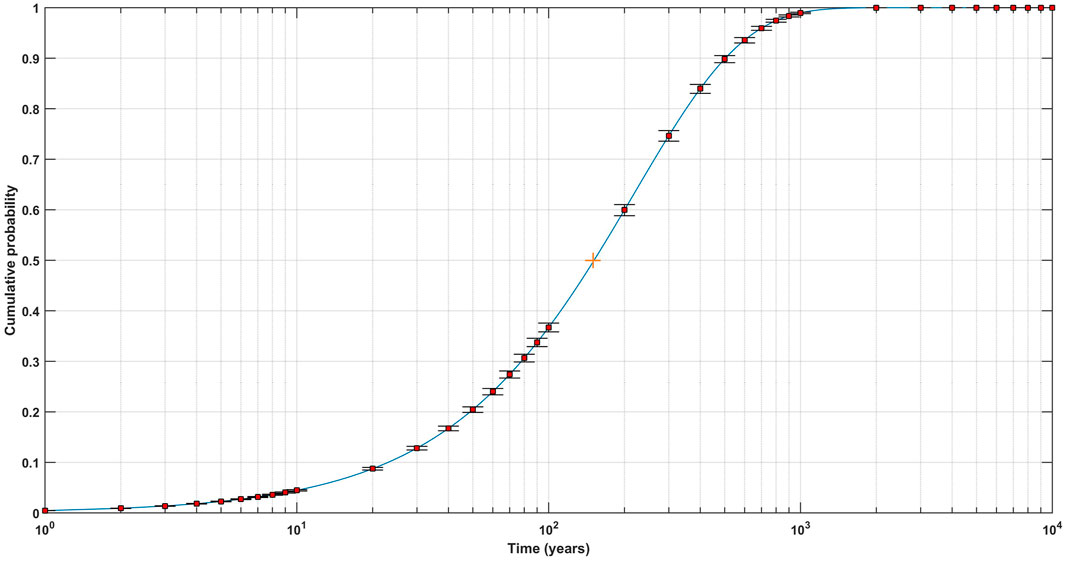
FIGURE 5. Cumulative probability of occurrence versus forecasting time interval for a Láscar 1993-like (i.e., 0.1 km3) eruption occurring anywhere within the study area. The curve was calculated for a mean recurrence rate of 45.77 events per 10 kyr and modelled as a homogeneous Poisson point process. Ranges of probabilities (black intervals) are illustrated at specific times (red squares) for the minimum and maximum recurrence rates calculated, which vary between 44.36 and 47.12 events per 10 kyr, respectively. Orange cross indicates the time when a cumulative probability of 50% is achieved. Another plot considering different recurrence rates is provided in Supplementary Figure S14.
Probabilistic Volcanic Hazard Analysis
The probabilistic hazard map for pyroclastic density currents (Figure 6A) was obtained by using the energy cone model to forecast runout from individual volcanoes. The shape of the probability isocontours for pyroclastic density currents generally mimics the spatial distribution of volcanism due to the simple modeling approach. The lowlands within <20–30 km from the most active volcanic regions (cf. Figure 6F) show the highest probabilities for pyroclastic density currents, of which the maximum (∼10−4 pyroclastic density currents per km2 per 10 kyr) occurs along the northern flanks of Ojos del Salado and El Muerto volcanic complexes (Incahuasi cluster). The pyroclastic density currents related to back-arc volcanic centres, such as around the Cerro Blanco volcanic complex and the Tuzgle stratovolcano, have probabilities up to 1.5 orders of magnitude lower than those estimated for the volcanic arc.
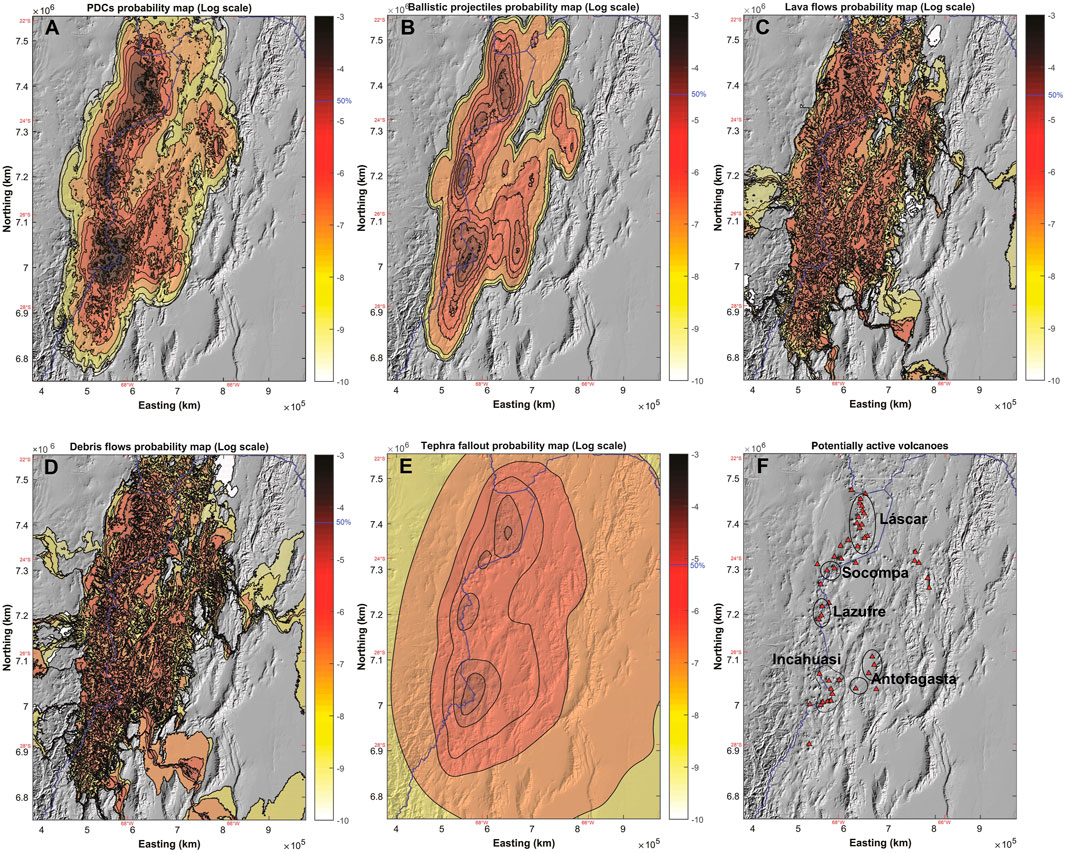
FIGURE 6. Probabilistic volcanic hazard maps for the Central Volcanic Zone of Chile and Argentina (∼22.5–28°S), obtained after empirical, semi-empirical or analytical modeling of: (A) Pyroclastic density currents, (B) Ballistic projectiles (which encompass near-vent hazards), (C) Lava flows, (D) Debris flows, and (E) Tephra fallout, based on the spatio-temporal probability assessment for a forecasting time interval of 10,000 years. Legend shows the probability of a 1 km2 area be affected by a given volcanic phenomenon during the next 10 kyr, shown as probability isocontours on a logarithmic scale to illustrate order-of-magnitude changes. Light blue horizontal lines drawn in each legend depict the 50% boundary, which means that if a given volcanic phenomenon occurs somewhere, there is a 50% probability it will affect the area enclosed by that boundary. (F) Depicts the Pleistocene-Holocene volcanoes of Figure 2 as well as the approximate boundary of each volcanic cluster, based on Figure 3B, which can be used as a spatial reference. The political border between Chile, Argentina and Bolivia is depicted for reference (blue line). ASTER Digital elevation model used as a background image follows a greyscale colour scheme: the whiter the pixel, the higher the elevation.
The probabilistic hazard map for ballistic projectiles (Figure 6B), which also encompasses the near-vent hazards, highlights the five volcanic clusters identified during the spatial analysis (cf. Figure 6F). In this map, probabilities rapidly decrease away from the main loci of activity, and just like the pyroclastic density currents, attain their maxima in the Incahuasi cluster. The lava flow and debris flow probabilistic hazard maps (Figures 6C,D, respectively) highlight the influence of topography. High probabilities for lava flows (∼10−4 lavas per km2 per 10 kyr) occur within depressions or valleys, usually at <5–15 km from the summits of young stratovolcanoes. Despite a similar general appearance in the figure scale, the debris flow probabilistic hazard map (Figure 6D) highlights twice as many small ravines and catchments compared with the lava flow map. This difference is due to the lower aspect ratio (higher dispersal) of debris flows in general, as indicated by their modeling parameters. Consequently, high probabilities for debris flows (∼10−4 debris flows per km2 per 10 kyr) extend up to 30–40 km from the major summits in the area. The highest probabilities for lava flows and debris flows (>10−4) occur between the Ojos del Salado and Falso Azufre volcanic complexes, and between the El Cóndor and Peinado stratovolcanoes (Incahuasi cluster). Also highlighted by this analysis are moderate probability (∼10−5) zones running along the main river valleys that drain the Puna plateau towards the foreland.
Tephra fallout probabilities (normalized thickness per km2 per 10 kyr; Figure 6E) are greatest in the prevailing downwind areas to the east of the main volcanic vents. The individual influence of each volcanic cluster (cf. Figure 6F) is well defined at probabilities >10−5 (cumulative probability of ∼50%), but they merge at probabilities <10−5.5. The extent of the 10−5.5 probability east of the main arc clusters are due to the influence of the back-arc Antofagasta cluster, as well the Tuzgle stratovolcano and nearby monogenetic centres. The Incahuasi cluster generates the highest probabilities for tephra fallout (∼10−4.5) between the El Fraile and Falso Azufre volcanoes.
Integrated Hazard Map
Integrating the individual volcanic hazards with an even weighting (Figure 7A) shows that most of the late Cenozoic volcanism is included within the 10−7 probability isocontour (defined here as the probability that an area of 1 km2 is impacted by any volcanic hazard in a 10 kyr time frame). This region defines an overall ∼700 km-long and ∼300 km-wide NNE oriented ellipse. At higher probabilities, patterns are more complex. The 10−6 isocontour includes most Quaternary volcanic products; that of 10−5.5 encloses most late Pleistocene-Holocene products, while all volcanic clusters are included within the 10−5 isocontour. The 10−4.7 isocontour defines the 50% boundary, which means that if a given volcanic phenomenon occurs somewhere, there is a 50% chance it will affect the area enclosed by that isocontour. Probabilities >10−4 are only found in very small regions related to the Láscar, Lazufre and Incahuasi volcanic clusters. The highest probability calculated, 10−3.5, occurs midway between the Ojos del Salado and Falso Azufre volcanic complexes, in the Incahuasi cluster.
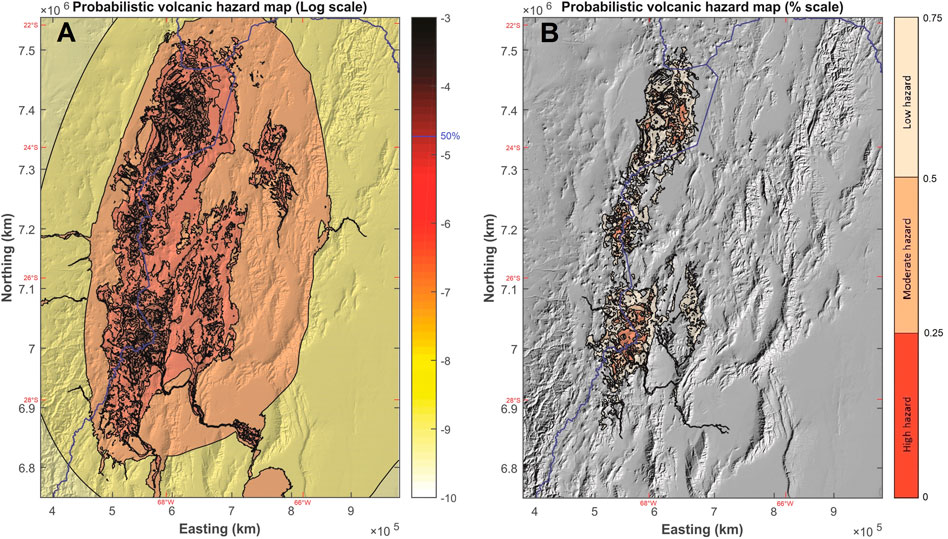
FIGURE 7. (A) Integrated quantitative volcanic hazard map, constructed by adding each probability map (Figures 6A–E), weighted evenly. Legend shows the probability of a 1 km2 area to be affected by any of the five volcanic phenomena during the next 10 kyr, shown as probability isocontours on a logarithmic scale to illustrate order-of-magnitude changes. Light blue horizontal line drawn in the legend depicts the 50% boundary, which means that if a volcanic phenomenon occurs somewhere, there is a 50% probability it will affect the area enclosed by that boundary. (B) Integrated volcanic hazard map, based on the results obtained in (A), depicting three cumulative probability intervals: 0%–25%, 25%–50%, and 50%–75%, interpreted as relatively high, moderate, and low hazard regions, respectively. Zoomed-in excerpts highlighting some key regions are provided in Supplementary Figures S10–S13. The political border between Chile, Argentina and Bolivia is depicted for reference (blue line). ASTER Digital elevation model used as a background image follows a greyscale colour scheme: the whiter the pixel, the higher the elevation.
Classifying probabilities as percentiles (Figure 7B; see Supplementary Figures S10–S13 for zoomed-in excerpts that highlight each volcanic cluster), three relative hazard zones are defined: high (0%–25%; >10−4.4), moderate (25%–50%; 10−4.7–10−4.4), and low (50%–75%; 10−5.2–10−4.7) hazard. This means that, for instance, in the high hazard zone, an overall 25% of the volcanic hazard occurs in areas enclosed by the 10−4.4 probability isocontour. Whilst these bins are relatively arbitrary, our choice was guided by the desire to only show three zones (rather than many); in practice the interested reader can select other divisions by using the files provided in Supplementary Material S5.
Coupling the Probabilistic Volcanic Hazards Assessment With Exposure Information
The integrated volcanic hazard map shown in Figure 7A was used to calculate the relative hazard of the 692 settlements in the region (from INDEC, 2010; INE Chile, 2017) (see Table 1 for the top 20; Supplementary Material S6 for the complete list). Most of the 10 settlements with the highest relative hazard of being impacted by a volcanic phenomenon are small villages/hamlets, administration buildings, mountain camps or mining camps. Touristic villages Antofagasta de la Sierra, El Peñón, and La Poma, rank 14th, 15th and 18th, respectively. More populous touristic towns such as San Antonio de los Cobres, in Argentina, and San Pedro de Atacama, in Chile, rank 23rd and 62nd, respectively. The three highest ranked provincial capitals are Salta (177th), San Salvador de Jujuy (219th), and San Miguel de Tucumán (353rd), in Argentina. For Chile, the three highest ranked cities are El Salvador (357th), Diego de Almagro (433rd), and Calama (642nd). In addition, the probability of a specific location being affected by any volcanic phenomenon (calculated using the integrated volcanic hazard map shown in Figure 7A) can be plotted against the spatial probability of a future volcanic event occurring directly at that location (calculated using the spatial probability map shown in Figure 3A). Figure 8 shows this exercise repeated for the 692 settlements in the region, using logarithmic scales on both axes to illustrate order-of-magnitude changes. Some settlements show low probabilities of hosting a volcanic event, but higher probabilities of being affected by any volcanic phenomenon (especially tephra fallout) (e.g., Tinogasta).
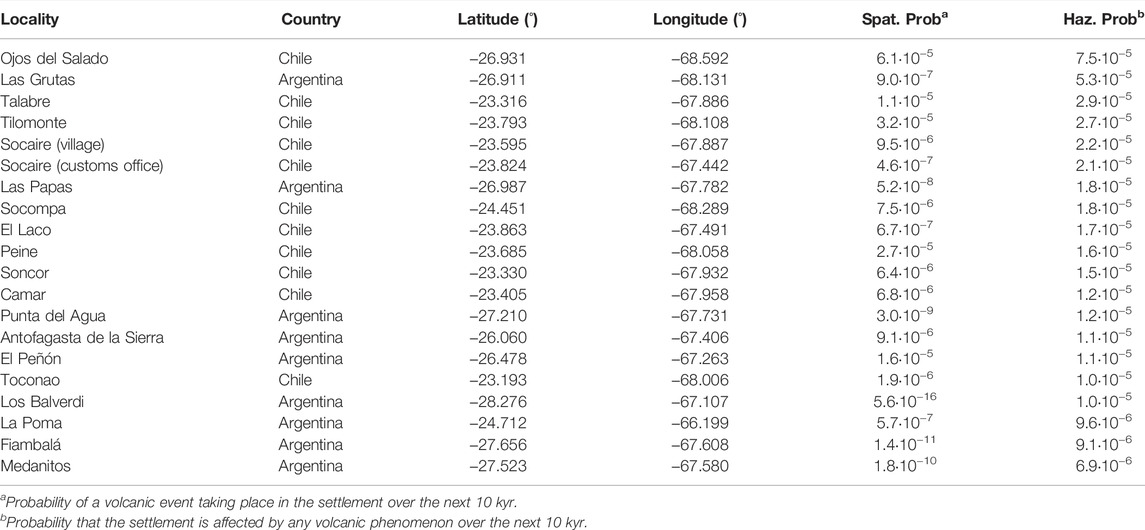
TABLE 1. The 20 settlements most likely to be affected by any volcanic phenomenon in case an eruption occurs in the study region. For the complete list of settlements analysed, the reader is referred to Supplementary Material S6.
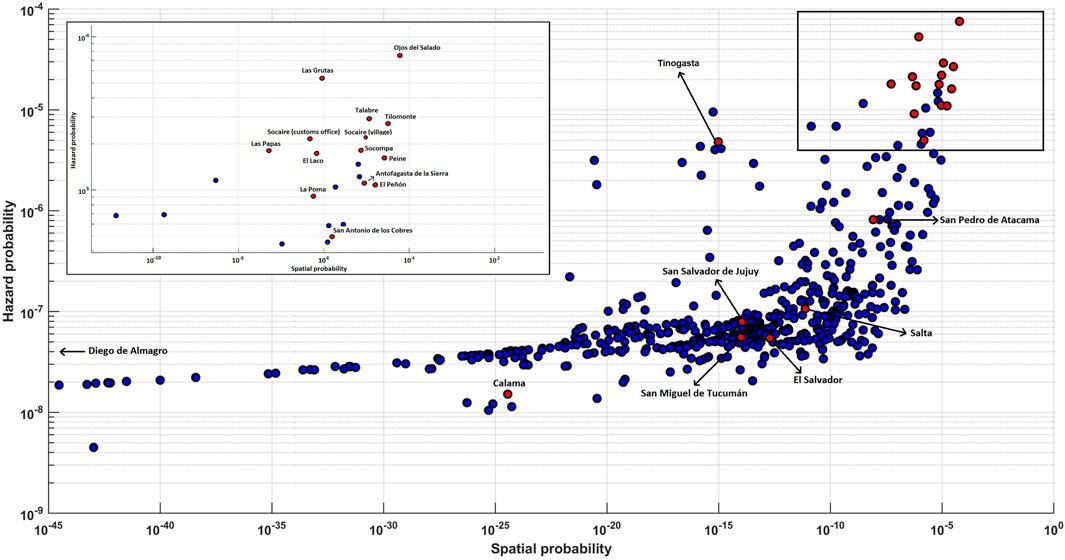
FIGURE 8. Probability of a volcanic event occurring at any of the 692 populated sites in the study area over the next 10 kyr (calculated using the spatial probability map shown in Figure 3A), plotted against the probability that this same location be affected by any volcanic phenomenon over the same period (calculated using the integrated quantitative volcanic hazard map shown in Figure 7A). Red dots highlight the ten highest-ranked settlements listed in Table 1 and all those mentioned in the text. The list with all the settlements can be found in Supplementary Material S6.
Results shown in Table 1 and Figure 8 could be useful for prioritizing hazard mitigation actions, or more detailed location-specific risk analysis, such as that of Reyes-Hardy et al. (2021) examining settlements in relation to Guallatiri volcano (18.5°S/69°W).
Discussion
Volcanic Clusters, Magma Bodies and Thermal Anomalies
The volcanic clusters identified in this work can be indicative of subvolcanic processes that could lead to large-volume volcanism in the future (cf. George et al., 2016). In our study region, geophysical studies have identified large-scale crustal anomalies related to shallow (∼2–10 km) partial melt bodies (Ward et al., 2013, Ward et al., 2017; Pritchard et al., 2018) (Figure 9). These include the Altiplano-Puna Magma Body (∼21–24°S; Chmielowski et al., 1999; Ward et al., 2014; Pritchard et al., 2018), which is a ∼500,000 km3 mid-crustal body with an average 15%–22% partial melt (Schilling et al., 2006; Comeau et al., 2016; Pritchard et al., 2018; Spang et al., 2021). The Láscar volcanic cluster is located in its southern portion, also recognized by Díaz et al. (2012) using magnetotelluric data. The Láscar cluster may therefore represent a subdomain of the broader magma body with higher melt fractions. The Socompa cluster identified here lies outside the known boundaries of the Altiplano-Puna Magma Body to the south and may either represent a previously undocumented southern extension of it, or some other source anomaly such as a small zone of recent lithospheric delamination (Beck et al., 2015; DeCelles et al., 2015; Schoenbohm and Carrapa, 2015).
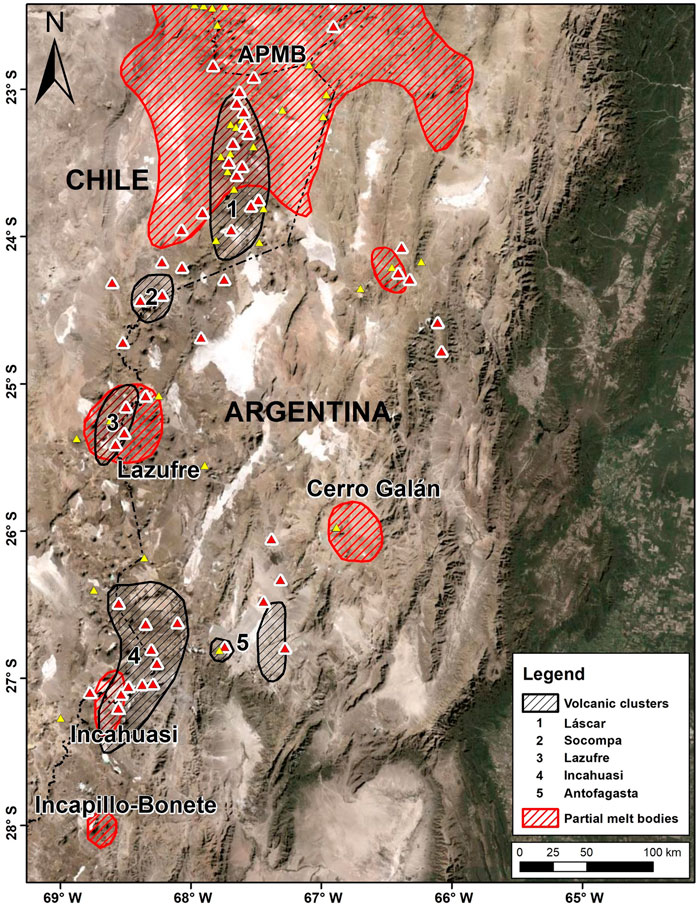
FIGURE 9. The approximate extent of the five clusters identified in this work (black striped regions, based on the 0.6 probability isocontours from Figure 3B), along with the mid-to-upper crustal partial melt bodies identified in the region by Ward et al. (2017) (red striped labelled regions; APMB: Altiplano-Puna Magmatic Body). Yellow and red triangles correspond to the Plio-Pleistocene and Pleistocene-Holocene volcanoes in the region, respectively, modified from Siebert et al. (2010). Minor monogenetic fields/centres have been included as well.
Further south, the Southern Puna Magma Body (∼25–27.5°S; Bianchi et al., 2013) comprises at least four separate mid-to-upper crustal magma bodies: Lazufre, Incahuasi, Cerro Galán, and Incapillo-Bonete (Figure 9), with a cumulative volume of ∼90,000 km3 (Delph et al., 2017, Delph et al., 2021; Ward et al., 2017). The Lazufre and Incahuasi volcanic clusters overlap with the eponymous magma bodies, although the latter volcanic cluster is much larger than the magma body identified. The Incapillo-Bonete and Cerro Galán magma bodies do not appear to be linked to volcanic clusters. The Cerro Galán magma body is related to the eponymous caldera, which records at least ∼4 Myr of ignimbrite-forming eruptions (Folkes et al., 2011; Kay et al., 2011), yet there has been no late Pleistocene-Holocene volcanic activity at this centre. The Incapillo-Bonete magma body is deeper than the others (∼30–50 km; Goss et al., 2011; Ward et al., 2017) and may need to grow or rise before large-volume volcanism starts. The Antofagasta volcanic cluster identified here is, apparently, not associated with a previously defined magma body nor mid-to-upper crustal region of partial melt (Ward et al., 2017), although it is an actively deforming region, hosting the only known active caldera in the CVZ (Cerro Blanco) (Pritchard and Simons, 2002; Henderson and Pritchard, 2013; Vélez et al., 2021; de Silva et al., 2022).
Surface thermal anomalies have been detected through infrared satellite imagery at nine volcanoes: Licancabur, Alítar, Láscar, Chiliques, Púlar-Pajonales, Lastarria, Sierra Nevada, Falso Azufre, and Ojos del Salado (Jay et al., 2013). Of these, all but Licancabur are either on or near the edges of the volcanic clusters identified here, and four of them (Alítar, Láscar, Lastarria and Ojos del Salado) host permanent fumarolic activity. Volcanoes analysed by Jay et al. (2013), however, were only those selected from the Siebert and Simkin (2002-2010) catalogue, thus some volcanoes with the potential for thermal anomalies (i.e., with crater lakes and/or sulphur deposits) were not analysed (e.g., Chalviri, Tres Cruces, Cerro Blanco, El Fraile, El Muerto). Some of those volcanoes should be the focus of future field studies as they lie within the clusters identified here.
Arc vs. Back-Arc Distinction
In the Puna plateau, there was a kinematic shift from compression to strike-slip and minor extension at 12–10 Ma (Marrett et al., 1994; Schoenbohm and Strecker, 2009; Daxberger and Riller, 2015). The oldest back-arc mafic lavas in this region to have erupted since this shift have been dated at ∼7.3 Ma (Risse et al., 2008) (although other undated lavas might be older), whereas the youngest ones are some extremely well preserved lava flows and cinder cones in the Antofagasta de la Sierra region (Risse et al., 2008; Fernández-Turiel et al., 2021). Based on the spatial probability map of volcanic activity (Figure 3A), the current volcanic back-arc can be delineated within the 10−5.4 probability isocontour (Figure 10). Matching the western boundary of the back-arc with the eastern boundary of the volcanic arc, these two regions can be compared to analyse their respective contributions to the volcanism by integrating the probabilities enclosed by each region. Thus, in terms of the probable locations of future volcanic activity, the arc contributes 88% and the back-arc 12%, whereas in terms of areas likely to be affected by future volcanic activity, the arc contributes 81% and the back-arc 19%. We therefore conclude that the arc is seven times more likely to host volcanic activity than the back-arc, and four times more likely to be affected by volcanic phenomena than the back-arc.
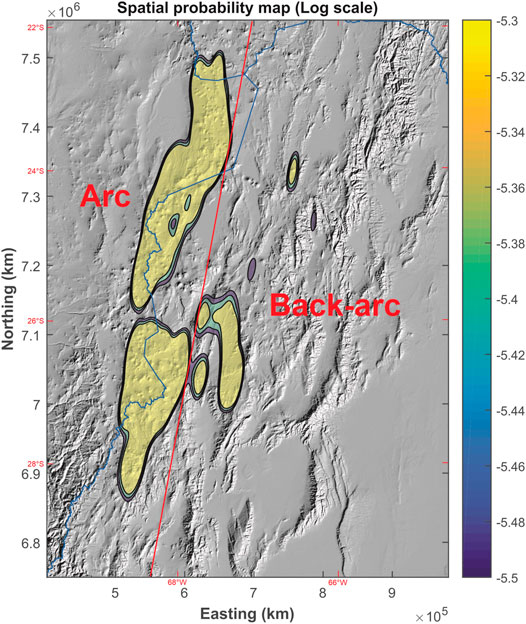
FIGURE 10. Spatial distribution of the volcanism showing the current arc and back-arc regions. The probability isocontour 10−5.4 events/km2 was used to define the boundary between these two regions (thick red line). Figure constructed using data from Figure 3A. The political border between Chile, Argentina and Bolivia is depicted for reference (blue line). ASTER Digital elevation model used as a background image follows a greyscale colour scheme: the whiter the pixel, the higher the elevation.
Sensitivity Analysis and Limitations of Our Study
The hazard assessment conducted in this study follows a sequential methodology that relies upon some assumptions. For instance, the estimation of volcanic events per vent type depended on the assumption of a fixed volume of 0.1 km3 per event. Even though this volume can be deemed reasonable for the purposes of our application, considering that the large majority (>90%) of explosive volcanic eruptions in the world are of small-to-moderate size (VEIs of 0–3), and that ∼20% of Holocene eruptions have VEIs of 3–4 (e.g., Siebert et al., 2010; Papale, 2018), it is necessary to test the influence of other volumes on the estimated eruption rates. We therefore tested order-of-magnitude differences in volume: 0.01 and 1 km3. A volume of 0.01 km3 led to a polygenetic eruption rate of 4.5855 (−0.0801/+0.0802) events per 10 kyr and an estimated 183.23 (−10.21/10.90) events for all post−10 ka active vents. For a volume of 1 km3, the polygenetic eruption rate was 0.0315 (-0.0008/0.0008) events per 10 kyr and the eruption rate for all post-10 ka active vents was 32.06 (−0.80/+0.84) events. When the cumulative probabilities calculated from these eruption rates are projected into the future and plotted alongside the cumulative probabilities used throughout our case study (Supplementary Figure S14), we see that at large (>2,000 years) forecasting time intervals, all curves have attained cumulative probabilities very close to 1. Thereby, the forecasting interval of 10 kyr used during our hazard assessment can be considered as a reasonable and conservative value because the cumulative probabilities sum to near unity irrespective of the event recurrence rate.
Two main sources of uncertainty can affect the spatial probabilistic analysis (Bertin et al., 2019). The first refers to how bandwidth selectors can change the shape of the probability isocontours in the spatial probability map. Here, besides the ĤPI,AMSE selector used in our case study, we also tested the influence of two other commonly used bandwidth selectors, ĤPI,SAMSE (PI: plug-in; SAMSE: sum of asymptotic mean squared errors) and ĤSCV (SVC: smoothed cross validation) (see Duong, 2005; Bertin et al., 2019), on the spatial probability map shown in Figure 3A. Results (Supplementary Figure S15) show that the largest discrepancies are found towards the lowest probability isocontours (<10−10 in our case), so the location and extent of the spatial clusters, which were defined at the highest probabilities, do not change when other bandwidth selectors are used. The second source of uncertainty is related to the distribution of vents into different time bins according to their modeled ages (ages sampled from normal distributions). Here we compared the distribution of vents used during our analysis to the range of distributions obtained after repeating the vent-grouping exercise 104 times. If we plot the minimum and maximum number of vents grouped within each time bin (Supplementary Figure S16), we see differences no higher than ∼3% compared to the number of vents per time bin used during our study. Further, if we extract the minimum and maximum number of vents for the most recent time bin (<1 Ma) and model the ellipses of their respective bandwidths (calculated using the ĤPI,AMSE selector), it is found that the orientation (i.e., azimuth) of the ellipses differ by less than 0.3% compared to the orientation of the ellipse used during the spatial analysis. Similarly, a minor difference (<0.4%) is obtained when the areas of these ellipses are compared to each other. In conclusion, other bandwidth selectors and different vent-grouping age distributions do not affect the spatial probability map to any significant extent.
MatHaz has been developed as a tool to help deal with the real and practical complications of assessing hazard for large volcanic areas (Bertin et al., 2019). In order to achieve this task within reasonable simulation times, and unlike other hazard simulation tools, MatHaz has not been developed to model the physics of volcanic eruptions and their products, or to model the details of specific eruptive scenarios (Bertin et al., 2019). This strategy focuses on simplified models that are easy to manage and replicate and quick to execute, acknowledging that by meeting these conditions model resolution is lost. Nevertheless, even the simplest models considered in MatHaz have their own assumptions. For example, tephra fallout modeling was performed by drawing elliptical isopachs assuming a deposit that thins exponentially away from the source, an approach that is not necessarily true based on well-documented eruptions (e.g., Bonadonna and Costa, 2012; Kawabata et al., 2013). Debris flows and lava flows are modelled based on a simple ‘flow-routing’ code, so an important limitation is that the hazard areas will always follow the thalweg of the valley and will never overbank.
The simulation times of each model tested are also strongly influenced by the pixel size, which determines the level of spatial detail of the assessment. In our case study application, a pixel size of 1,000 m was used, which is ∼0.1% of the longest side of the study area. This proportion was deemed adequate by Bertin et al. (2019) after testing the pixel size/computational efficiency trade-off for different pixel sizes, as any improvement on the spatial resolution of the assessment was far more computationally intensive but with little reward, in that the shapes of the main probability isocontours did not differ significantly for pixel size/study area ratios lower than 0.1%.
For the modeling methodology, it was assumed that every volcanic phenomenon had its source in a single pixel of fixed size. This is an oversimplification, especially for lava flows, since these can also start erupting from a fissure, which may or may not evolve into a single vent (e.g., Valentine and Gregg, 2008). In MatHaz, simulation of fissure eruptions adds a major complexity to the model due to the many assumptions about which additional source vents will have to be considered. In spite of these limitations, for a future application of MatHaz a potential user can edit the code to include other modeling algorithms and simulation tools. Another possibility might be running more sophisticated numerical models for those regions where the highest spatial probabilities were obtained.
Summarizing, our approach is, at least, effective in providing a first-order assessment of volcanic hazards for large and complex volcanic regions. In addition, even though we acknowledge that our results are mostly valid at a large (regional) scale, they can be used to guide targeted hazard assessments at more detailed scales.
Improving Future Hazard Assessments With Structural, Geophysical, and Geochronological Datasets
Probabilistic volcanic hazard assessments can be improved by including robust volcano-structural, seismic and thermal datasets at more detailed scales (e.g., Bartolini et al., 2014; Bertin et al., 2019). This information is however still patchy and incomplete for the area considered in the present study. For instance, apart from two volcanoes (Láscar and Lastarria), there is no permanent seismic network in the region (Amigo, 2021; Aguilera et al., 2022). Other isolated seismicity has been considered tectonic, but could have magmatic influences; for instance, Mulcahy et al. (2014) identified two brief, shallow (<5 km) swarms east of Falso Azufre and at Cerro Galán.
There is a large catalogue of faults, fractures, fissures and lineaments for this area (5,887 structures; extracted from the Bertin et al., 2022 database) (Supplementary Material S4), although these are mainly mapped in basement units, with structures unrecognised beneath most of the volcanic centres. To gain insight into how the structures can influence a future hazard analysis, we tested the incorporation of this patchy structural data into the probabilistic spatial assessment following the methodology described in Bertin et al. (2019). Results (Figure 11) show that even conservative weightings on structures (∼20%) distort the probability isocontours towards regions far away from known volcanism. Hence, it appears that homogenous and high-resolution structural information (e.g., Becerril et al., 2013; Bartolini et al., 2014; Bertin et al., 2019; Bevilacqua et al., 2021) is required before it becomes useful, especially in order to discriminate between those structures that have interacted with ascending magmas in the past, and those that have not. In other words, regional-scale structural data do not seem to improve the assessment.
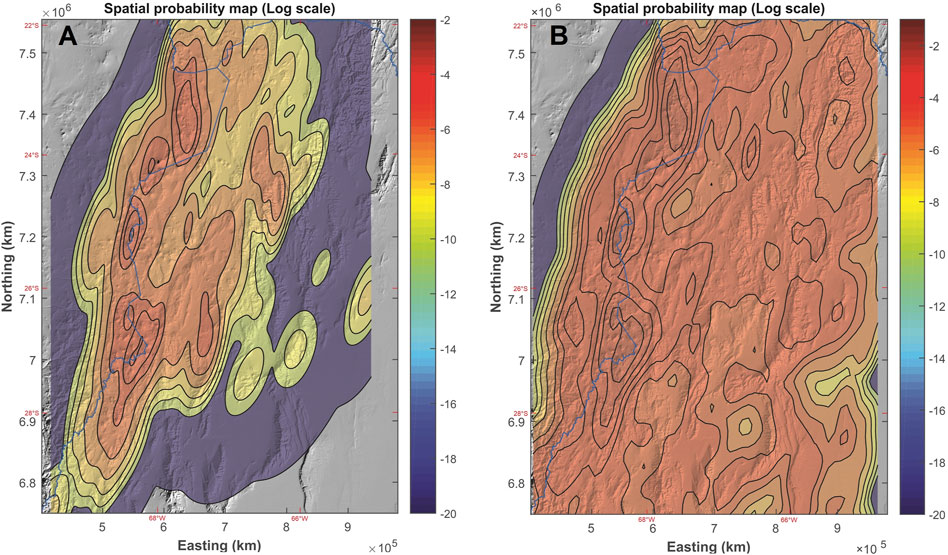
FIGURE 11. Spatial probability analysis considering: (A) volcanic events, and (B) volcanic events (80%) and structural data (20%). Probability density functions were obtained after applying the kernel density estimation method, and are shown as probability isocontours on a logarithmic scale to illustrate order-of-magnitude changes. The political border between Chile, Argentina and Bolivia is depicted for reference (blue line). ASTER Digital elevation model used as a background image follows a greyscale colour scheme: the whiter the pixel, the higher the elevation.
Data indicative of persistent thermal anomalies and/or zones of active surface deformation could also be used to improve future hazard assessments, although homogeneity of data coverage must be considered. Low enthalpy geothermal springs have been mapped in Chile (Hauser, 1997) and Argentina (Pesce and Miranda, 2003), although these are mostly in places accessible by road. Fumarolic activity at some volcanoes (e.g., Tassi et al., 2009, Tassi et al., 2011; Aguilera et al., 2016; Chiodi et al., 2019), together with geological evidence of young (i.e., Quaternary) phreatomagmatic activity at others (e.g., van Alderwerelt, 2017; Filipovich et al., 2019, Filipovich et al., 2020;Ureta et al., 2020, Ureta et al., 2021), most of which fall within the volcanic clusters identified here, should be coupled with high-resolution thermal surveys to improve the spatial coverage of potential current magmatic anomalies. On the other hand, there are long-term ground deformation anomalies identified in InSAR time series, tilt meter data, GPS/GNSS permanent stations and ground surveying at some active volcanoes (Pritchard and Simons, 2002; Henderson and Pritchard, 2013; Amigo, 2021; Vélez et al., 2021; Aguilera et al., 2022). This information could be used to guide high-resolution geodetic studies, following on from some targeted surveys that have been conducted at Cerro Blanco (Di Filippo et al., 2008; Brunori et al., 2013; Chiodi et al., 2019; Lamberti et al., 2020; Vélez et al., 2021).
Improvement of the geochronological data will definitely help constrain the periods of activity of individual volcanic vents. Summing all available data into a geochronological database (Bertin et al., 2022) is robust over long time periods (10s of Myr), or better in some areas, but there is a paucity of data to effectively characterise the late Pleistocene-Holocene volcanic record, especially when many morphologically young volcanic deposits remain undated. A desirable future goal would be to gain enough new accurate and high-precision age determinations to improve the temporal resolution of this modeling approach ten-fold (i.e., from 1 Myr to 100 kyr analysis windows). This will require targeting well-preserved recent volcanic deposits with state-of-the-art dating techniques to have the best chance of defining robust probability density functions for shorter time intervals, especially because the youngest time window is the one that contributes the most to the spatial probability map.
Recommendations for Future Work
Our study area is too large to expect a uniform high-resolution assessment of the volcanic eruption record. However, targeted analyses on particularly active parts of the region could lead to a much improved hazard assessment. We suggest high-resolution studies on the Puntas Negras and Chalviri volcanic chains (Láscar cluster), the Socompa and Púlar-Pajonales volcanoes (Socompa cluster), as well as the many volcanoes within the Incahuasi cluster (e.g., Ojos del Salado, El Fraile, Tipas, Peinado). The Incahuasi region shows the highest event probabilities (Figures 3, 4), and has been addressed in only a few studies (González-Ferrán et al., 1985; Baker et al., 1987; Mpodozis et al., 1996; Gardeweg et al., 2000; Grosse et al., 2018, Grosse et al., 2020, Grosse et al., 2022; Naranjo et al., 2019). In addition, at least two <1 ka BP tephras mapped in Argentina (Fauqué and Tchilinguirian, 2002; Hermanns and Schellenberger, 2008), were likely erupted from the Incahuasi cluster (Sampietro-Vattuone et al., 2018, Sampietro-Vattuone et al., 2020; Fernández-Turiel et al., 2019). Additional permanent seismic monitoring networks should also be considered at Socompa, Tres Cruces, Ojos del Salado, and Cerro Blanco.
We recommend conducting a comprehensive evaluation of the erupted volume and volcanic eruption rates for this arc segment, as it could allow for an in-depth reconstruction of the spatio-volumetric-temporal evolution of volcanism in the region (e.g., how volcanism in terms of intensity and magnitude has varied over time). To achieve this goal, however, will require the development of a model that explicitly integrates the spatial, temporal, and volumetric components of hazard. Sophisticated spatio-temporal (Bebbington, 2013) and spatio-volumetric (Bebbington, 2015) hazard models have been developed for distributed volcanic fields, but their applicability to arc segments is yet to be tested. The inclusion of a volumetric component into a well-tested spatio-temporal model may shed further light on how much each volcanic cluster identified here contributes in terms of erupted volume. This will, in our opinion, highlight the Antofagasta cluster, particularly due to the presence of the Cerro Blanco volcanic complex, which has long been recognized as the source of at least two eruptions on the scale of the largest eruptions to have occurred on Earth since the late Pleistocene (Báez et al., 2015; Báez et al., 2020a; Báez et al., 2020b; Fernández-Turiel et al., 2019; de Silva et al., 2022).
Conclusion
We developed a long-term probabilistic volcanic hazard assessment of the Chilean-Argentinian segment of the Central Volcanic Zone of the Andes (∼22.5–28°S). Through this we provide a first-order framework on which to build a detailed understanding of arc-scale/regional volcanic hazard. We recognize five regions of high spatial probability of future volcanic activity: Láscar, Socompa, Lazufre, Incahuasi, and Antofagasta. The largest clusters (Láscar, Lazufre and Incahuasi) correlate well with geophysical evidence of mid-crustal partial melt bodies, but the smallest two (Socompa and Antofagasta) do not. The Socompa and Antofagasta clusters should therefore be considered for further targeted thermal and other geophysical studies. We estimate a probability of 50% for an eruption of the scale of the Láscar 1993 event (0.1 km3) by the year ∼2150. Our results suggest an ∼80% probability that the next 0.1 km3 eruption will occur from within one of the five volcanic clusters. The lack of a robust late Pleistocene-Holocene eruption record in this area is still a major hindrance for accurate short-term hazard assessments.
Five volcanic phenomena (pyroclastic density currents, ballistic projectiles, lava flows, debris flows and tephra fallout) were modeled for the whole region. Considering these collectively in an integrated volcanic hazards map, a relative hazard exposure was established for population centres in the region. This showed that the settlements with the highest relative likelihood of being affected by any of the volcanic phenomena mentioned above are small towns or similar, some of which are popular tourist destinations. Our results suggest that any major efforts towards improving volcanic hazard knowledge for this region should concentrate on improving volcanic event records within each of the five volcanic clusters identified here, especially the Incahuasi and Antofagasta clusters. In addition, examining the volcanic risk associated with the largest population centres that were defined in our exposure analysis should be pursued, especially San Antonio de los Cobres in Argentina and San Pedro de Atacama in Chile.
We suggest that the sequential methodology developed here could be tested in other volcanically active regions, as the results of such regional analysis can be used to identify areas to be prioritised for future volcanological research. Future efforts should also seek to explicitly add the erupted volume to the spatio-temporal framework in order to better understand other arc-scale processes that can impinge upon volcanic hazards.
Data Availability Statement
The original contributions presented in the study are included in the article/Supplementary Material, further inquiries can be directed to the corresponding author.
Author Contributions
DB conceived the study, developed methods, wrote and run all code, wrote the manuscript and prepared all relevant figures and complements. This work was supported and supervised by JL, SC, SdS, CC, and PC, who also contributed to the interpretation and edited the manuscript with several inputs from PG, WB, EB, and RC. All authors read and approved the final manuscript.
Funding
This work was partially funded through a CONICYT-Becas Chile PhD scholarship held by DB (2018–2021: Folio 72170365) and supported by the University of Auckland. SC and JL were supported by Transitioning Taranaki to a Volcanic Future MBIE Endeavour Project UOAX 1913. PC was supported by project PUE CONICET (Grant PUE-INECOA 22920170100027CO). PG was supported by Project PICT-2017-2798 of the Agencia Nacional de Promoción Científica y Tecnológica, and by Fundación Miguel Lillo. WB was supported by the PICT-2016/1359 grant.
Conflict of Interest
The authors declare that the research was conducted in the absence of any commercial or financial relationships that could be construed as a potential conflict of interest.
Publisher’s Note
All claims expressed in this article are solely those of the authors and do not necessarily represent those of their affiliated organizations, or those of the publisher, the editors and the reviewers. Any product that may be evaluated in this article, or claim that may be made by its manufacturer, is not guaranteed or endorsed by the publisher.
Acknowledgments
We thank Eliana Arango, Esteban Bertea, Alfredo Esquivel and Cristian Montonaro for their valuable help in several field campaigns throughout the region. The author acknowledges Danielle Charlton for helping with map designs, as well as Felipe Aguilera and Guadalupe Maro for discussions about Andean magmatism. Further data for this paper, if needed, are available by contacting the corresponding author at daniel.bertin.u@gmail.com. Chief Editor, Valerio Acocella, Associate Editor, Pablo Samaniego, and reviewers Alvaro Aravena and Suzanne Kay are deeply thanked for their insightful comments and suggestions that substantially improved the quality and structure of this paper.
Supplementary Material
The Supplementary Material for this article can be found online at: https://www.frontiersin.org/articles/10.3389/feart.2022.875439/full#supplementary-material
References
Aguilera, F., Apaza, F., Del Carpio, J., Grosse, P., Jiménez, N., Ureta, G., et al. (2022). Advances in Scientific Understanding of the Central Volcanic Zone of the Andes: a Review of Contributing Factors. Bull. Volcanol. 84, 22. doi:10.1007/s00445-022-01526-y
Aguilera, F., Layana, S., Rodríguez-Díaz, A., González, C., Cortés, J., and Inostroza, M. (2016). Hydrothermal Alteration, Fumarolic Deposits and Fluids from Lastarria Volcanic Complex: A Multidisciplinary Study. andgeo 43 (2), 166–196. doi:10.5027/andgeov43n2-a02
Allmendinger, R. W., Jordan, T. E., Kay, S. M., and Isacks, B. L. (1997). The Evolution of the Altiplano-Puna Plateau of the Central Andes. Annu. Rev. Earth Planet. Sci. 25, 139–174. doi:10.1146/annurev.earth.25.1.139
Alloway, B. V., Pearce, N. J. G., Moreno, P. I., Villarosa, G., Jara, I., De Pol-Holz, R., et al. (2017). An 18,000 Year-Long Eruptive Record from Volcán Chaitén, Northwestern Patagonia: Paleoenvironmental and Hazard-Assessment Implications. Quat. Sci. Rev. 168, 151–181. doi:10.1016/j.quascirev.2017.05.011
Amigo, A., Bertin, D., and Orozco, G. (2012). “Peligros volcánicos de la zona norte de Chile,” in Servicio Nacional de Geología y Minería, Chile (Santiago, Chile: Servicio Nacional de Geología y Minería), 17, 45. Serie Geología Ambiental.
Amigo, A. (2021). Volcano Monitoring and Hazard Assessments in Chile. Volcanica 4 (S1), 1–20. doi:10.30909/vol.04.s1.0120
Ayala, R. R. (2014). Mapa preliminar de amenaza volcánica de Bolivia. Cochabamba: XXI Congreso Geológico Boliviano, 241–251.
Báez, W., Arnosio, M., Chiodi, A., Ortiz-Yañes, A., Viramonte, J. G., Bustos, E., et al. (2015). Estratigrafía y evolución del Complejo Volcánico Cerro Blanco, Puna Austral, Argentina. Rev. Mex. Ciencias Geol. 32 (1), 29–49.
Báez, W., Bustos, E., Chiodi, A., Reckziegel, F., Arnosio, M., de Silva, S., et al. (2020a). Eruptive Style and Flow Dynamics of the Pyroclastic Density Currents Related to the Holocene Cerro Blanco Eruption (Southern Puna Plateau, Argentina). J. S. Am. Earth Sci. 98, 102482. doi:10.1016/j.jsames.2019.102482
Báez, W., Carraso Nuñez, G., Giordano, G., Viramonte, J. G., and Chiodi, A. (2016). “Polycyclic scoria cones of the Antofagasta de la Sierra basin, Southern Puna plateau, Argentina,” in Monogenetic Volcanism. Editors K. Németh, G. Carrasco-Núñez, J. J. Aranda-Gómez, and I. E. M. Smith (London, UK: Special Publication of the Geological Society of London), 446, 311–336. doi:10.1144/SP446.3
Báez, W., de Silva, S., Chiodi, A., Bustos, E., Giordano, G., Arnosio, M., et al. (2020b). Pulsating flow dynamics of sustained, forced pyroclastic density currents: insights from a facies analysis of the Campo de la Piedra Pómez ignimbrite, southern Puna, Argentina. Bull. Volcanol. 82, 53. doi:10.1007/s00445-020-01385-5
Baker, P. E., Gonzalez-ferran, O., and Rex, D. C. (1987). Geology and geochemistry of the Ojos del Salado volcanic region, Chile. J. Geol. Soc. 144, 85–96. doi:10.1144/gsjgs.144.1.0085
Bartolini, S., Bolós, X., Martí, J., Pedra, E. R., and Planagumà, L. (2015). Hazard Assessment at the Quaternary La Garrotxa Volcanic Field (NE Iberia). Nat. Hazards 78, 1349–1367. doi:10.1007/s11069-015-1774-y
Bartolini, S., Geyer, A., Martí, J., Pedrazzi, D., and Aguirre-Díaz, G. (2014). Volcanic Hazard on Deception Island (South Shetland Islands, Antarctica). J. Volcanol. Geotherm. Res. 285, 150–168. doi:10.1016/j.jvolgeores.2014.08.009
Bebbington, M. S. (2013). Assessing Spatio-Temporal Eruption Forecasts in a Monogenetic Volcanic Field. J. Volcanol. Geotherm. Res. 252, 14–28. doi:10.1016/j.jvolgeores.2012.11.010
Bebbington, M. S., and Cronin, S. J. (2011). Spatio-temporal Hazard Estimation in the Auckland Volcanic Field, New Zealand, with a New Event-Order Model. Bull. Volcanol. 73, 55–72. doi:10.1007/s00445-010-0403-6
Bebbington, M. S. (2015). Spatio-volumetric Hazard Estimation in the Auckland Volcanic Field. Bull. Volcanol. 77, 39. doi:10.1007/s00445-015-0921-3
Becerril, L., Bartolini, S., Sobradelo, R., Martí, J., Morales, J. M., and Galindo, I. (2014). Long-term Volcanic Hazard Assessment on El Hierro (Canary Islands). Nat. Hazards Earth Syst. Sci. 14, 1853–1870. doi:10.5194/nhess-14-1853-2014
Becerril, L., Cappello, A., Galindo, I., Neri, M., and Del Negro, C. (2013). Spatial Probability Distribution of Future Volcanic Eruptions at El Hierro Island (Canary Islands, Spain). J. Volcanol. Geotherm. Res. 257, 21–30. doi:10.1016/j.jvolgeores.2013.03.005
Beck, S. L., Zandt, G., Ward, K. M., and Scire, A. (2015). “Multiple Styles and Scales of Lithospheric Foundering beneath the Puna Plateau, Central Andes,” in Geodynamics of a Cordilleran Orogenic System: The Central Andes of Argentina and Northern Chile. Editors P. G. DeCelles, M. N. Ducea, B. Carrapa, and P. A. Kapp (McLean, VA: Geological Society of America Memoir), 212. doi:10.1130/2015.1212(03)
Bello-González, J. P., Contreras-Reyes, E., and Arriagada, C. (2018). Predicted Path for Hotspot Tracks off South America since Paleocene Times: Tectonic Implications of Ridge-Trench Collision along the Andean Margin. Gondwana Res. 64, 216–234. doi:10.1016/j.gr.2018.07.008
Bertin, D. (2017). 3-D Ballistic Transport of Ellipsoidal Volcanic Projectiles Considering Horizontal Wind Field and Variable Shape-dependent Drag Coefficients. J. Geophys. Res. Solid Earth 122 (2), 1126–1151. doi:10.1002/2016jb013320
Bertin, D., Lindsay, J. M., Becerril, L., Cronin, S. J., and Bertin, L. J. (2019). MatHaz: a Matlab Code to Assist with Probabilistic Spatio-Temporal Volcanic Hazard Assessment in Distributed Volcanic Fields. J. Appl. Volcanol. 8, 4. doi:10.1186/s13617-019-0084-6
Bertin, D., Lindsay, J. M., Cronin, S. J., de Silva, S., Connor, C., Caffe, P., et al. (2022). Volcanic Geospatial Database of the Chilean-Argentinian Segment (22.5-29°S) of the Central Volcanic Zone of the Andes. Auckland, NZ: The University of Auckland Dataset. doi:10.17608/k6.auckland.16894903.v3
Bevilacqua, A., Aravena, A., Neri, A., Gutiérrez, E., Escobar, D., Schliz, M., et al. (2021). Thematic Vent Opening Probability Maps and Hazard Assessment of Small-Scale Pyroclastic Density Currents in the San Salvador Volcanic Complex (El Salvador) and Nejapa-Chiltepe Volcanic Complex (Nicaragua). Nat. Hazards Earth Syst. Sci. 21, 1639–1665. doi:10.5194/nhess-21-1639-2021
Bevilacqua, A., Bursik, M., Bursik, M., Patra, A., Pitman, E., and Till, R. (2017). Bayesian Construction of a Long-Term Vent Opening Probability Map in the Long Valley Volcanic Region (CA, USA). Siv 31, 1–36. doi:10.5038/2163-338x.3.1
Bevilacqua, A., Isaia, R., Neri, A., Vitale, S., Aspinall, W. P., Bisson, M., et al. (2015). Quantifying Volcanic Hazard at Campi Flegrei Caldera (Italy) with Uncertainty Assessment: 1. Vent Opening Maps. J. Geophys. Res. Solid Earth 120 (4), 2309–2329. doi:10.1002/2014jb011775
Bianchi, M., Heit, B., Jakovlev, A., Yuan, X., Kay, S. M., Sandvol, E., et al. (2013). Teleseismic Tomography of the Southern Puna Plateau in Argentina and Adjacent Regions. Tectonophysics 586, 65–83. doi:10.1016/j.tecto.2012.11.016
Biass, S., Bonadonna, C., di Traglia, F., Pistolesi, M., Rosi, M., and Lestuzzi, P. (2016). Probabilistic Evaluation of the Physical Impact of Future Tephra Fallout Events for the Island of Vulcano, Italy. Bull. Volcanol. 78, 37. doi:10.1007/s00445-016-1028-1
Bird, D. K., Gisladottir, G., and Dominey-Howes, D. (2010). Volcanic Risk and Tourism in Southern Iceland: Implications for Hazard, Risk and Emergency Response Education and Training. J. Volcanol. Geotherm. Res. 189, 33–48. doi:10.1016/j.jvolgeores.2009.09.020
Bonadonna, C., and Costa, A. (2012). Estimating the Volume of Tephra Deposits: a New Simple Strategy. Geology 40, 415–418. doi:10.1130/g32769.1
Brandmeier, M., and Wörner, G. (2016). Compositional Variations of Ignimbrite Magmas in the Central Andes over the Past 26 Ma - A Multivariate Statistical Perspective. Lithos 262, 713–728. doi:10.1016/j.lithos.2016.07.011
Brunori, C. A., Bignami, C., Stramondo, S., and Bustos, E. (2013). 20 Years of Active Deformation on Volcano Caldera: Joint Analysis of InSAR and AInSAR Techniques. Int. J. Appl. Earth Observation Geoinformation 23, 279–287. doi:10.1016/j.jag.2012.10.003
Bustos, E., Báez, W., Norini, G., Arnosio, M., and de Silva, S. L. (2019). The Geological and Structural Evolution of the Long-Lived Miocene-Pleistocene La Hoyada Volcanic Complex in the Geodynamic Framework of the Central Andes, Argentina. J. Volcanol. Geotherm. Res. 385, 120–142. doi:10.1016/j.jvolgeores.2018.07.010
Calder, E. S., Sparks, R. S. J., and Gardeweg, M. C. (2000). Erosion, Transport and Segregation of Pumice and Lithic Clasts in Pyroclastic Flows Inferred from Ignimbrite at Lascar Volcano, Chile. J. Volcanol. Geotherm. Res. 104 (1-4), 201–235. doi:10.1016/S0377-0273(00)00207-9
Cappello, A., Ganci, G., Calvari, S., Pérez, N. M., Hernández, P. A., Silva, S. V., et al. (2016). Lava Flow Hazard Modeling during the 2014-2015 Fogo Eruption, Cape Verde. J. Geophys. Res. Solid Earth 121, 2290–2303. doi:10.1002/2015jb012666
Cappello, A., Neri, M., Acocella, V., Gallo, G., Vicari, A., and Del Negro, C. (2012). Spatial Vent Opening Probability Map of Etna Volcano (Sicily, Italy). Bull. Volcanol. 74, 2083–2094. doi:10.1007/s00445-012-0647-4
Casertano, L. (1963). Catalogue of the Active Volcanoes of the World, Including Solfatara Fields, Part XV, Chilean Continent. Rome, Italy: International Association of Volcanology, 55.
Charbonnier, S. J., Thouret, J.-C., Gueugneau, V., and Constantinescu, R. (2020). New Insights into the 2070calyrBP Pyroclastic Currents at El Misti Volcano (Peru) from Field Investigations, Satellite Imagery and Probabilistic Modeling. Front. Earth Sci. 8, 557788. doi:10.3389/feart.2020.557788
Charlton, D., Kilburn, C., and Edwards, S. (2020). Volcanic Unrest Scenarios and Impact Assessment at Campi Flegrei Caldera, Southern Italy. J. Appl. Volcanol. 9, 7. doi:10.1186/s13617-020-00097-x
Charrier, R., Pinto, L., and Rodríguez, M. P. (2007). “Tectonostratigraphic Evolution of the Andean Orogen in Chile,” in The Geology of Chile. Editors T. Moreno, and W. Gibbons (London: The Geological Society), 21–114.
Chen, J., Kufner, S. K., Yuan, X., Heit, B., Wu, H., Yang, D., et al. (2020). Lithospheric Delamination beneath the Southern Puna Plateau Resolved by Local Earthquake Tomography. J. Geophys. Res. Solid Earth 125, e2019JB019040. doi:10.1029/2019jb019040
Chiodi, A., Tassi, F., Báez, W., Filipovich, R., Bustos, E., Glok Galli, M., et al. (2019). Preliminary Conceptual Model of the Cerro Blanco Caldera-Hosted Geothermal System (Southern Puna, Argentina): Inferences from Geochemical Investigations. J. S. Am. Earth Sci. 94, 102213. doi:10.1016/j.jsames.2019.102213
Chmielowski, J., Zandt, G., and Haberland, C. (1999). The Central Andean Altiplano-Puna Magma Body. Geophys. Res. Lett. 26 (6), 783–786. doi:10.1029/1999gl900078
Clavero, J. E., Sparks, R. S. J., Pringle, M. S., Polanco, E., and Gardeweg, M. C. (2004). Evolution and Volcanic Hazards of Taapaca Volcanic Complex, Central Andes of Northern Chile. J. Geol. Soc. 161, 603–618. doi:10.1144/0016-764902-065
Coira, B., Kay, S. M., and Viramonte, J. (1993). Upper Cenozoic Magmatic Evolution of the Argentine Puna-A Model for Changing Subduction Geometry. Int. Geol. Rev. 35 (8), 677–720. doi:10.1080/00206819309465552
Comeau, M. J., Unsworth, M. J., and Cordell, D. (2016). New Constraints on the Magma Distribution and Composition beneath Volcán Uturuncu and the Southern Bolivian Altiplano from Magnetotelluric Data. Geosphere 12 (5), 1391–1421. doi:10.1130/ges01277.1
Connor, C. B., Connor, L. J., Germa, A., Richardson, J. A., Bebbington, M., and Saballos, J. A. (2018). How to Use Kernel Density Estimation as a Diagnostic and Forecasting Tool for Distributed Volcanic Vents. Statistics Volcanol. 4, 1–21. doi:10.5038/2163-338X.4.3
Connor, C. B., Connor, L. J., Jaquet, O., Wallace, L., Kiyosugi, K., Chapman, N., et al. (2013). “Spatial and Temporal Distribution of Future Volcanism in the Chuguku Region – a Partial Application of NUMO’s ITM and Topaz Probabilistic Tectonic Assessment Methodology,” in Technical Report NUMO-TR-13-03 (Tokyo: Nuclear Waste Organization of Japan), 83.
Connor, C. B., and Hill, B. E. (1995). Three Nonhomogeneous Poisson Models for the Probability of Basaltic Volcanism: Application to the Yucca Mountain Region, Nevada. J. Geophys. Res. 100, 10107–10125. doi:10.1029/95jb01055
Connor, L. J., Connor, C. B., Meliksetian, K., and Savov, I. (2012). Probabilistic Approach to Modeling Lava Flow Inundation: a Lava Flow Hazard Assessment for a Nuclear Facility in Armenia. J. Appl. Volcanol. 1, 3. doi:10.1186/2191-5040-1-3
Damaschke, M., Cronin, S. J., and Bebbington, M. S. (2018). A Volcanic Event Forecasting Model for Multiple Tephra Records, Demonstrated on Mt. Taranaki, New Zealand. Bull. Volcanol. 80, 9. doi:10.1007/s00445-017-1184-y
Daxberger, H., and Riller, U. (2015). Kinematics of Neogene to Recent Upper-Crustal Deformation in the Southern Central Andes (23°-28°S) Inferred from Fault-Slip Analysis: Evidence for Gravitational Spreading of the Puna Plateau. Tectonophysics 642, 16–28. doi:10.1016/j.tecto.2014.12.003
de Silva, S. L. (1989). Altiplano-Puna Volcanic Complex of the Central Andes. Geol 17, 1102–1106. doi:10.1130/0091-7613(1989)017<1102:apvcot>2.3.co;2
de Silva, S. L., and Francis, P. W. (1991). Volcanoes of the Central Andes. Berlin: Spinger-Verlag, 216.
de Silva, S. L., and Kay, S. M. (2018). Turning up the Heat: High-Flux Magmatism in the Central Andes. Elements 14 (4), 245–250. doi:10.2138/gselements.14.4.245
de Silva, S. L., Roberge, J., Bardelli, L., Báez, W., Ortiz, A., Viramonte, J. G., et al. (2022). Magmatic Evolution and Architecture of an Arc-Related, Rhyolitic Caldera Complex: The Late Pleistocene to Holocene Cerro Blanco Volcanic Complex, Southern Puna. Argentina: Geosphere.
DeCelles, P. G., Carrapa, B., Horton, B. K., McNabb, J., Gehrels, G. E., and Boyd, J. (2015). “The Miocene Arizaro Basin, Central Andean Hinterland: Response to Partial Lithospheric Removal?,” in Geodynamics of a Cordilleran Orogenic System: The Central Andes of Argentina and Northern Chile. Editors P. G. DeCelles, M. N. Ducea, B. Carrapa, and P. A. Kapp (McLean, VA: Geological Society of America Memoir), 212, 359–386. doi:10.1130/2015.1212(18)
Delph, J. R., Shimizu, K., and Ratschbacher, B. C. (2021). The Architecture of the Southern Puna Magmatic System: Integrating Seismic and Petrologic Observations with Geochemical Modeling. J. Geophys. Res. Solid Earth 126 (7). e2020JB021550. doi:10.1029/2020jb021550
Delph, J. R., Ward, K. M., Zandt, G., Ducea, M. N., and Beck, S. L. (2017). Imaging a Magma Plumbing System from MASH Zone to Magma Reservoir. Earth Planet. Sci. Lett. 457, 313–324. doi:10.1016/j.epsl.2016.10.008
Di Filippo, M., Di Nezza, M., Colombi, A., Viramonte, J. G., and Toro, B. (2008). Estructura gravimétrica del Complejo Volcánico Cerro Blanco, Puna Austral Argentina, 1. Jujuy: XVII Congreso Geológico Argentino, Actas, 203–204.
Díaz, D., Brasse, H., and Ticona, F. (2012). Conductivity Distribution beneath Lascar Volcano (Northern Chile) and the Puna, Inferred from Magnetotelluric Data. J. Volcanol. Geotherm. Res. 217-218, 21–29. doi:10.1016/j.jvolgeores.2011.12.007
Duong, T. (2005). Bandwidth Selectors for Multivariate Kernel Density Estimation (PhD Thesis). Perth, Australia: University of Western Australia, 173.
Elissondo, M., Farías, C., and Collini, E. (2016). Volcanic Risk Assessment in Argentina. Cities on Volcanoes, 09, Session 1.4. Chile: Sernageomin.
Fauqué, L., and Tchilinguirian, P. (2002). “Villavil Rockslides, Catamarca Province, Argentina,” in Catastrophic Landslides: Effects, Occurrence, and Mechanisms. Editors S. G. Evans, and J. V. DeGraff (Boulder, CO: Geological Society of America Reviews in Engineering Geology), XV, 303–324. doi:10.1130/REG15-p303
Fernández-Turiel, J. L., Pérez-Torrado, F. J., Rodríguez-González, A., Saavedra, J., Carracedo, J. C., Rejas, M., et al. (2019). The Large Eruption 4.2 Ka Cal BP in Cerro Blanco, Central Volcanic Zone, Andes: Insights to the Holocene Eruptive Deposits in the Southern Puna and Adjacent Regions. Estud. Geol. 75 (1), e088. doi:10.3989/egeol.43438.515
Fernandez-Turiel, J. L., Saavedra, J., Perez-Torrado, F. J., Rodriguez-Gonzalez, A., Rejas, M., Guillou, H., et al. (2021). New ages, morphometric and geochemical data on recent shoshonitic volcanism of the Puna, Central Volcanic Zone of Andes: San Jerónimo and Negro de Chorrillos volcanoes. J. S. Am. Earth Sci. 109, 103270. doi:10.1016/j.jsames.2021.103270
Fierstein, J., and Nathenson, M. (1992). Another Look at the Calculation of Fallout Tephra Volumes. Bull. Volcanol. 54, 156–167. doi:10.1007/bf00278005
Filipovich, R., Báez, W., Bustos, E., Villagrán, A., Chiodi, A., and Viramonte, J. (2019). Eruptive Styles Related to the Monogenetic Mafic Volcanism of Pasto Ventura Región, Southern Puna, Argentina. Andean Geol. 46, 2. doi:10.5027/andgeov46n2-3091
Filipovich, R., Báez, W., Groppelli, G., Ahumada, F., Aldega, L., Becchio, R., et al. (2020). Geological Map of the Tocomar Basin (Puna Plateau, NW Argentina). Implication for the Geothermal System Investigation. Energies 13 (20), 5492. doi:10.3390/en13205492
Folkes, C. B., Wright, H. M., Cas, R. A. F., de Silva, S. L., Lesti, C., and Viramonte, J. G. (2011). A Re-appraisal of the Stratigraphy and Volcanology of the Cerro Galán Volcanic System, NW Argentina. Bull. Volcanol. 73, 1427–1454. doi:10.1007/s00445-011-0459-y
Freymuth, H., Brandmeier, M., and Wörner, G. (2015). The Origin and Crust/mantle Mass Balance of Central Andean Ignimbrite Magmatism Constrained by Oxygen and Strontium Isotopes and Erupted Volumes. Contrib. Mineral. Pet. 169, 58. doi:10.1007/s00410-015-1152-5
Gallant, E., Cole, L., Connor, C., Donovan, A., Molisee, D., Morin, J., et al. (2021). Modelling Eruptive Event Sources in Distributed Volcanic Fields. Volcanica 4 (2), 325–343. doi:10.30909/vol.04.02.325343
Gao, Y., Tilmann, F., Herwaarden, D. P., Thrastarson, S., Fichtner, A., Heit, B., et al. (2021). Full Waveform Inversion beneath the Central Andes: Insight into the Dehydration of the Nazca Slab and Delamination of the Back‐Arc Lithosphere. JGR Solid Earth 126, e2021JB021984. doi:10.1029/2021JB021984
Gardeweg, M., Amigo, A., Matthews, S., Sparks, R. S. J., and Clavero, J. (2011). “Geología del volcán Láscar, Región de Antofagasta. Servicio Nacional de Geología y Minería, Carta Geológica de Chile,” in Serie Geología Básica (Santiago, Chile: Sernageomin), 131, 1. mapa escala 1:50,000.40
Gardeweg, M., and Amigo, A. (2015). “Peligros del volcán Láscar, Región de Antofagasta. Servicio Nacional de Geología y Minería, Carta Geológica de Chile,” in Serie Geología Ambiental (Santiago, Chile: Sernageomin), 22, 1. mapa escala 1:50,000.
Gardeweg, M., Clavero, J., Mpodozis, C., Pérez de Arce, C., and Villeneuve, M. (2000). “El Macizo Tres Cruces: un complejo volcánico longevo y potencialmente activo en la alta cordillera de Copiapó, Chile,” in IX Congreso Geológico Chileno. Puerto Varas, Chile: Sociedad Geológica de Chile, Servicio Nacional de Geología y Minería, Universidad de Chile, 291–295.
Gardeweg, M., and Medina, E. (1994). La erupción subpliniana del 19-20 Abril de 1993 del volcán Lascar, Norte de Chile. Concepción, Chile: VII Congreso Geológico Chileno, 299–304.
George, O. A., Malservisi, R., Govers, R., Connor, C. B., and Connor, L. J. (2016). Is Uplift of Volcano Clusters in the Tohoku Volcanic Arc, Japan, Driven by Magma Accumulation in Hot Zones? A Geodynamic Modeling Study. J. Geophys. Res. Solid Earth 121 (6), 4780–4796. doi:10.1002/2016jb012833
Germa, A., Connor, L. J., Cañon-Tapia, E., and Le Corvec, N. (2013). Tectonic and Magmatic Controls on the Location of Post-subduction Monogenetic Volcanoes in Baja California, Mexico, Revealed through Spatial Analysis of Eruptive Vents. Bull. Volcanol. 75, 782. doi:10.1007/s00445-013-0782-6
Global Volcanism Program (2016). “Report on Lascar (Chile) – July 2016,” in Bulletin of the Global Volcanism Network. Editors A. E. Crafford, and E. Venzke (Washington, DC: Smithsonian Institution), 41, 7.
Global Volcanism Program (1993a). “Report on Aracar (Argentina) – April 1993,” in Bulletin of the Global Volcanism Network. Editor E. Venzke (Washington, DC: Smithsonian Institution), 18, 4. doi:10.5479/si.GVP.BGVN199304-355160
Global Volcanism Program (1993b). “Report on Ojos del Salado (Chile-Argentina) – November 1993,” in Bulletin of the Global Volcanism Network. Editor R. Wunderman (Washington, DC: Smithsonian Institution), 18, 11. doi:10.5479/si.GVP.BGVN199311-355130
González-Ferrán, O., Baker, P. E., and Rex, D. C. (1985). Tectonic-volcanic Discontinuity at Latitude 27° South Andean Range, Associated with Nazca Plate Subduction. Tectonophysics 112, 423–441. doi:10.1016/0040-1951(85)90189-1
Goss, A. R., Kay, S. M., and Mpodozis, C. (2011). The Geochemistry of a Dying Continental Arc: the Incapillo Caldera and Dome Complex of the Southernmost Central Andean Volcanic Zone (∼28°S). Contrib. Mineral. Pet. 161, 101–128. doi:10.1007/s00410-010-0523-1
Grosse, P., Guzmán, S. R., Nauret, F., Orihashi, Y., and Sumino, H. (2022). Central vs. Lateral Growth and Evolution of the < 100 ka Peinado Composite Volcano, Southern Central Volcanic Zone of the Andes. J. Volcanol. Geotherm. Res. 425, 107532. doi:10.1016/j.jvolgeores.2022.107532
Grosse, P., Ochi Ramacciotti, M. L., Escalante Fochi, F., Guzmán, S., Orihashi, Y., and Sumino, H. (2020). Geomorphology, Morphometry, Spatial Distribution and Ages of Mafic Monogenetic Volcanoes of the Peinado and Incahuasi Fields, Southernmost Central Volcanic Zone of the Andes. J. Volcanol. Geotherm. Res. 401, 106966. doi:10.1016/j.jvolgeores.2020.106966
Grosse, P., Orihashi, Y., Guzmán, S. R., Sumino, H., and Nagao, K. (2018). Eruptive History of Incahuasi, Falso Azufre and El Cóndor Quaternary Composite Volcanoes, Southern Central Andes. Bull. Volcanol. 80, 44. doi:10.1007/s00445-018-1221-5
Guzmán, S., Grosse, P., Montero-López, C., Hongn, F., Pilger, R., Petrinovic, I., et al. (2014). Spatial-temporal Distribution of Explosive Volcanism in the 25-28˚S Segment of the Andean Central Volcanic Zone. Tectonophysics 636, 170–189. doi:10.1016/j.tecto.2014.08.013
Harpel, C. J., de Silva, S., and Salas, G. (2011). The 2 Ka Eruption of Misti Volcano, Southern Peru – the Most Recent Plinian Eruption of Arequipa’s Iconic Volcano, 484. McLean, VA: Geological Society of America Special Paper, 1–72. doi:10.1130/2011.2484
Haschke, M., Siebel, W., Günther, A., and Scheuber, E. (2002). Repeated Crustal Thickening and Recycling during the Andean Orogeny in North Chile (21°-26°S). J. Geophys. Res. Solid Earth 107 (B1). doi:10.1029/2001jb000328
Hauser, A. (1997). Catastro y caracterización de las fuentes de aguas minerales y termales de Chile, 50. Santiago, Chile: Servicio Nacional de Geología y Minería, Boletín, 89.
Henderson, S. T., and Pritchard, M. E. (2013). Decadal Volcanic Deformation in the Central Andes Volcanic Zone Revealed by InSAR Time Series. Geochem. Geophys. Geosystems 14, 5. doi:10.1002/ggge.20074
Hermanns, R. L., and Schellenberger, A. (2008). Quaternary Tephrochronology Helps Define Conditioning Factors and Triggering Mechanisms of Rock Avalanches in NW Argentina. Quat. Int. 178, 261–275. doi:10.1016/j.quaint.2007.05.002
Hoke, L., and Lamb, S. (2007). Cenozoic Behind-Arc Volcanism in the Bolivian Andes, South America: Implications for Mantle Melt Generation and Lithospheric Structure. J. Geol. Soc. 164, 795–814. doi:10.1144/0016-76492006-092
INDEC (2010). Censo Nacional de Población, Hogares y Viviendas 2010. Buenos Aires, Argentina: Instituto Nacional de Estadística y Censos. https://www.indec.gob.ar/indec/web/Nivel4-Tema-2-41-135.
INE Chile (2017). Censo de Población y Vivienda 2017: Resultados Censo 2017. Available at: https://ine-chile.maps.arcgis.com/apps/webappviewer/index.html?id=c2155cac57d04032bf6ca5f151cddd6d (Accessed September 7, 2021).
James, D. E., and Sacks, I. S. (1999). “Cenozoic Formation of the Central AndesA Geophysical Perspective,” in Geology and Ore Deposits of the Central Andes. Editor B. J. Skinner (Littleton, Colorado: Society of Economic Geologists, Special Publication No. 7), 1–25. doi:10.5382/sp.07.01
Jaquet, O., Lantuéjoul, C., and Goto, J. (2017). Probabilistic Estimation of Long-Term Volcanic Hazard under Evolving Tectonic Conditions in a 1 Ma Timeframe. J. Volcanol. Geotherm. Res. 345, 58–66. doi:10.1016/j.jvolgeores.2017.07.010
Jaquet, O., Lantuéjoul, C., and Goto, J. (2012). Probabilistic Estimation of Long-Term Volcanic Hazard with Assimilation of Geophysics and Tectonic Data. J. Volcanol. Geotherm. Res. 235-236, 29–36. doi:10.1016/j.jvolgeores.2012.05.003
Javidan, N., Kavian, A., Pourghasemi, H. R., Conoscenti, C., Jafarian, Z., and Rodrigo-Comino, J. (2021). Evaluation of Multi-Hazard Map Produced Using MaxEnt Machine Learning Technique. Sci. Rep. 11, 6496. doi:10.1038/s41598-021-85862-7
Jay, J. A., Welch, M., Pritchard, M. E., Mares, P. J., Mnich, M. E., Melkonian, A. K., et al. (2013). “Volcanic Hotspots of the Central and Southern Andes as Seen from Space by ASTER and MODVOLC between the Years 2000 and 2010,” in Geological Society, London, Special Publications. Editors D. M. Pyle, T. A. Mather, and J. Biggs (London, UK: Special Publication of the Geological Society of London), 380, 161–185. doi:10.1144/sp380.1
Jiménez, D., Becerril, L., Bartolini, S., Escobar, D., and Martí, J. (2020). Making a Qualitative Volcanic-Hazards Map by Combining Simulated Scenarios: An Example for San Miguel Volcano (El Salvador). J. Volcanol. Geotherm. Res. 395, 106837. doi:10.1016/j.jvolgeores.2020.106837
Jiménez, D., Becerril, L., Bartolini, S., and Martí, J. (2018). Spatio-temporal Hazard Estimation in San Miguel Volcano, El Salvador. J. Volcanol. Geotherm. Res. 358, 171–183. doi:10.1016/j.jvolgeores.2018.04.003
Johnston, D., Becker, J., Jolly, G., Potter, S., Wilson, T., Stewart, C., et al. (2011). Volcanic Hazards Management at Taranaki Volcano: Information Source Book. Lower Hutt, Wellington, NZ: Institute of Geological and Nuclear Sciences Limited, 108. GNS Science Report 2011/37.
Kawabata, E., Bebbington, M. S., Cronin, S. J., and Wang, T. (2013). Modeling Thickness Variability in Tephra Deposition. Bull. Volcanol. 75, 738. doi:10.1007/s00445-013-0738-x
Kay, S. M., Coira, B. L., Caffe, P. J., and Chen, C.-H. (2010). Regional Chemical Diversity, Crustal and Mantle Sources and Evolution of Central Andean Puna Plateau Ignimbrites. J. Volcanol. Geotherm. Res. 198, 81–111. doi:10.1016/j.jvolgeores.2010.08.013
Kay, S. M., and Coira, B. L. (2009). “Shallowing and Steepening Subduction Zones, Continental Lithospheric Loss, Magmatism, and Crustal Flow under the Central Andean Altiplano-Plateau,” in Backbone of the Americas: Plateau Uplift, Shallow Subduction and Ridge Collision. Editors S. M. Kay, V. A. Ramos, and W. R. Dickinson (McLean, VA: Geological Society of America Memoir), 229–259.
Kay, S. M., Coira, B., and Viramonte, J. (1994). Young Mafic Back Arc Volcanic Rocks as Indicators of Continental Lithospheric Delamination beneath the Argentine Puna Plateau, Central Andes. J. Geophys. Res. 99 (B12), 24323–24339. doi:10.1029/94jb00896
Kay, S. M., Coira, B., Wörner, G., Kay, R. W., and Singer, B. S. (2011). Geochemical, Isotopic and Single Crystal 40Ar/39Ar Age Constraints on the Evolution of the Cerro Galán Ignimbrites. Bull. Volcanol. 73, 1487–1511. doi:10.1007/s00445-010-0410-7
Kósik, S., Bebbington, M., and Németh, K. (2020). Spatio-temporal Hazard Estimation in the Central Silicic Part of Taupo Volcanic Zone, New Zealand, Based on Small to Medium Volume Eruptions. Bull. Volcanol. 82, 50. doi:10.1007/s00445-020-01392-6
Lamberti, M. C., Chiodi, A., Agusto, M., Filipovich, R., Massenzio, A., Baéz, W., et al. (2020). Carbon Dioxide Diffuse Degassing as a Tool for Computing the Thermal Energy Release at Cerro Blanco Geothermal System, Southern Puna (NW Argentina). J. S. Am. Earth Sci. 105, 102833. doi:10.1016/j.jsames.2020.102833
Lara, L. E., Orozco, G., Amigo, A., and Silva, C. (2011). “Peligros volcánicos de Chile. Servicio Nacional de Geología y Minería, Carta Geológica de Chile,” in Serie Geología Ambiental (Santiago, Chile: Sernageomin), 13, 34. 1 mapa escala 1:2.000.000.
Lerner, G. A., Cronin, S. J., Bebbington, M. S., and Platz, T. (2019). The Characteristics of a Multi-Episode Volcanic Regime: the Post-AD 960 Maero Eruptive Period of Mt. Taranaki (New Zealand). Bull. Volcanol. 81, 61. doi:10.1007/s00445-019-1327-4
Macedo, O., Taipe, E., Del Caripo, J., Ticona, J., Ramos, D., Puma, N., et al. (2016). Evaluación del riesgo volcánico en el sur del Perú, situación de la vigilancia actual y requerimientos de monitoreo en el futuro. Observatorio Vulcanológico del Sur, Observatorio Vulcanológico del INGEMMET. Arequipa, Perú: Observatorio Geofísico de la Universidad Nacional San Agustín, Informe técnico, 75.
Malin, M. C., and Sheridan, M. F. (1982). Computer-assisted Mapping of Pyroclastic Surges. Science 217, 637–640. doi:10.1126/science.217.4560.637
Maro, G., Caffe, P. J., Romer, R. L., and Trumbull, R. B. (2017). Neogene Mafic Magmatism in the Northern Puna Plateau, Argentina: Generation and Evolution of a Back-Arc Volcanic Suite. J. Petrology 58 (8), 1591–1617. doi:10.1093/petrology/egx066
Marrett, R. A., Allmendinger, R. W., Alonso, R. N., and Drake, R. E. (1994). Late Cenozoic Tectonic Evolution of the Puna Plateau and Adjacent Foreland, Northwestern Argentine Andes. J. S. Am. Earth Sci. 7 (2), 179–207. doi:10.1016/0895-9811(94)90007-8
Martin, A. J., Umeda, K., Connor, C. B., Weller, J. N., Zhao, D., and Takahashi, M. (2004). Modeling Long-Term Volcanic Hazards through Bayesian Inference: an Example from the Tohoku Volcanic Arc, Japan. J. Geophys. Res. Solid Earth 109, B10208. doi:10.1029/2004jb003201
Martinod, J., Gérault, M., Husson, L., and Regard, V. (2020). Widening of the Andes: An Interplay between Subduction Dynamics and Crustal Wedge Tectonics. Earth-Science Rev. 204, 103170. doi:10.1016/j.earscirev.2020.103170
Miller, C. D. (1989). “Potential Hazards from Future Volcanic Eruptions in California,” in U.S. Geological Survey Bulletin 1847. Vancouver, Washington: United States Geological Survey, 17, 2. tables, 1 plate, scale 1:500,000.
Morfulis, M., Báez, W., Retamoso, S., Bardelli, L., Filipovich, R., and Sommer, C. A. (2020). Quantitative Spatial Distribution Analysis of Mafic Monogenic Volcanism in the Southern Puna, Argentina: Implications for Magma Production Rates and Structural Control during its Ascent. J. S. Am. Earth Sci. 104, 102852. doi:10.1016/j.jsames.2020.102852
Mpodozis, C., Kay, C., Gardeweg, M., and Coira, B. (1996). in Geología de la región de Ojos del Salado (Andes Centrales, 27°S): implicancias de la migración hacia el este del frente volcánico Cenozoico Superior (Buenos Aires: XIII Congreso Geológico Argentino, Actas), 3, 539–548.
Mulcahy, P., Chen, C., Kay, S. M., Brown, L. D., Isacks, B. L., Sandvol, E., et al. (2014). Central Andean Mantle and Crustal Seismicity beneath the Southern Puna Plateau and the Northern Margin of the Chilean-Pampean Flat Slab. Tectonics 33 (8), 1636–1658. doi:10.1002/2013tc003393
Mullineaux, D. R. (1976). “Preliminary Overview Map of Volcanic Hazards in the 48 Conterminous United States. Scale 1:7,500,000,” in U.S. Geological Survey Miscellaneous Field Studies Map MF-786. Vancouver, Washington: United States Geological Survey.
Naranjo, J. A. (2010). “Geología del Complejo Volcánico Lastarria, Región de Antofagasta. Servicio Nacional de Geología y Minería, Carta Geológica de Chile,” in Serie Geología Básica. (Santiago, Chile: Sernageomin), 123, 33. 1 mapa escala 1:25,000.
Naranjo, J. A., Hevia, F., Arcos, R., and Polanco, E. (2019). “Geología de las áreas Nevado Ojos del Salado y Cerro El Fraile, Región de Atacama. Servicio Nacional de Geología y Minería, Carta Geológica de Chile,” in Serie Geología Básica. (Santiago, Chile: Sernageomin), 204-205, 1. mapa escala 1:100,000.96
Naranjo, J. A., Villa, V., Ramírez, C., and Pérez de Arce, C. (2018). Volcanism and Tectonism in the Southern Central Andes: Tempo, Styles, and Relationships. Geosphere 14 (2), 626–641. doi:10.1130/GES01350.110.1130/ges01350.1
Németh, K., and Kereszturi, G. (2015). Monogenetic Volcanism: Personal Views and Discussion. Int. J. Earth Sci. 104, 2131–2146. doi:10.1007/s00531-015-1243-6
Nieto-Torres, A., and Martin Del Pozzo, A. L. (2019). Spatio-temporal Hazard Assessment of a Monogenetic Volcanic Field, Near México City. J. Volcanol. Geotherm. Res. 371, 46–58. doi:10.1016/j.jvolgeores.2019.01.006
Norini, G., Bustos, E., Arnosio, M., Baez, W., Zuluaga, M. C., and Roverato, M. (2020). Unusual Volcanic Instability and Sector Collapse Configuration at Chimpa Volcano, Central Andes. J. Volcanol. Geotherm. Res. 393, 106807. doi:10.1016/j.jvolgeores.2020.106807
Norini, G., Cogliati, S., Baez, W., Arnosio, M., Bustos, E., Viramonte, J., et al. (2014). The Geological and Structural Evolution of the Cerro Tuzgle Quaternary Stratovolcano in the Back‐arc Region of the Central Andes, Argentina. J. Volcanol. Geotherm. Res. 285, 214–228. doi:10.1016/j.jvolgeores.2014.08.023
O’Driscoll, L. L., Richards, M. A., and Humphreys, E. D. (2012). Nazca-South America Interactions and the Late Eocene-Late Oligocene Flat-Slab Episode in the Central Andes. Tectonics 31 (2), TC2013. doi:10.1029/2011TC003036
Ogburn, S. E., Norgaard, D., Charlton, D., Calder, E. S., Wright, H. M., Lindsay, J., et al. (2020). Volcanic Hazard Maps Database, V. 1.1 (20 September 2020) IAVCEI Commission on Volcanic Hazards and Risk. Available at: https://volcanichazardmaps.org (Accessed December 06, 2021).
O’Hara, D., Karlstrom, L., and Ramsey, D. W. (2020). Time-evolving Surface and Subsurface Signatures of Quaternary Volcanism in the Cascades Arc. Geology 48 (11), 1088–1093. doi:10.1130/G47706.1
Papale, P. (2018). Global Time-Size Distribution of Volcanic Eruptions on Earth. Sci. Rep. 8, 6838. doi:10.1038/s41598-018-25286-y
Parada, M. A., López-Escobar, L., Oliveros, V., Fuentes, F., Morata, D., Calderón, M., et al. (2007). “Andean Magmatism,” in The Geology of Chile. Editors T. Moreno, and W. Gibbons (London: The Geological Society), 115–146. doi:10.1144/GOCH.4
Perucca, L. P., and Moreiras, S. M. (2009). Seismic and Volcanic Hazards in Argentina. Dev. Earth Surf. Process. 13, 267–300. doi:10.1016/S0928-2025(08)10014-1
Pesce, A. H., and Miranda, F. J. (2003). Catálogo de manifestaciones termales de la República Argentina, Volumen 1: Región Noroeste, 36. Buenos Aires: Instituto de Geología y Recursos Minerales, Servicio Geológico Minero Argentino, Anales, 165.
Petit-Breuilh, M. E. (2004). La historia eruptiva de los volcanes hispanoamericanos (Siglos XVI al XX). España: Servicio de Publicaciones del Exmo. Cabildo Insultar de Lanzarote – Casa de los Volcanes, 431.
Pritchard, M. E., de Silva, S. L., Michelfelder, G., Zandt, G., McNutt, S. R., Gottsmann, J., et al. (2018). Synthesis: PLUTONS: Investigating the Relationship between Pluton Growth and Volcanism in the Central Andes. Geosphere 14 (3), 954–982. doi:10.1130/ges01578.1
Pritchard, M. E., and Simons, M. (2002). A Satellite Geodetic Survey of Large-Scale Deformation of Volcanic Centres in the Central Andes. Nature 418, 167–171. doi:10.1038/nature00872
Pure, L. R., Leonard, G. S., Townsend, D. B., Wilson, C. J. N., Calvert, A. T., Cole, R. P., et al. (2020). A High Resolution 40Ar/39Ar Lava Chronology and Edifice Construction History for Tongariro Volcano, New Zealand. J. Volcanol. Geotherm. Res. 403, 106993. doi:10.1016/j.jvolgeores.2020.106993
Ramos, V. A. (2009). “Anatomy and Global Context of the Andes: Main Geologic Features and the Andean Orogenic Cycle,” in Backbone of the Americas: Plateau Uplift, Shallow Subduction and Ridge Collision. Editors S. M. Kay, V. A. Ramos, and W. R. Dickinson (McLean, VA: Geological Society of America Memoir), 204, 31–65. doi:10.1130/2009.1204(02)
Reyes-Hardy, M.-P., Aguilera Barraza, F., Sepúlveda Birke, J. P., Esquivel Cáceres, A., and Inostroza Pizarro, M. (2021). GIS-based Volcanic Hazards, Vulnerability and Risks Assessment of the Guallatiri Volcano, Arica Y Parinacota Region, Chile. J. S. Am. Earth Sci. 109, 103262. doi:10.1016/j.jsames.2021.103262
Richards, J. P., Ullrich, T., and Kerrich, R. (2006). The Late Miocene-Quaternary Antofalla Volcanic Complex, Southern Puna, NW Argentina: Protracted History, Diverse Petrology, and Economic Potential. J. Volcanol. Geotherm. Res. 152, 197–239. doi:10.1016/j.jvolgeores.2005.10.006
Richards, J. P., and Villeneuve, M. (2001). The Llullaillaco Volcano, Northwest Argentina: Construction by Pleistocene Volcanism and Destruction by Sector Collapse. J. Volcanol. Geotherm. Res. 105, 77–105. doi:10.1016/S0377-0273(00)00245-6
Risse, A., Trumbull, R. B., Coira, B., Kay, S. M., and Bogaard, P. v. d. (2008). 40Ar/39Ar Geochronology of Mafic Volcanism in the Back-Arc Region of the Southern Puna Plateau, Argentina. J. S. Am. Earth Sci. 26, 1–15. doi:10.1016/j.jsames.2008.03.002
Risse, A., Trumbull, R. B., Kay, S. M., Coira, B., and Romer, R. L. (2013). Multi-stage Evolution of Late Neogene Mantle-Derived Magmas from the Central Andes Back-Arc in the Southern Puna Plateau of Argentina. J. Petrology 54 (10), 1963–1995. doi:10.1093/petrology/egt038
Rodríguez, I., Páez, J., van Wyk de Vries, M., van Wyk de Vries, B., and Godoy, B. (2020). Dynamics and Physical Parameters of the Lastarria Debris Avalanche, Central Andes. J. Volcanol. Geotherm. Res. 402, 106990.
Runge, M. G., Bebbington, M. S., Cronin, S. J., Lindsay, J. M., Kenedi, C. L., and Moufti, M. R. H. (2014). Vents to Events: Determining an Eruption Event Record from Volcanic Vent Structures for the Harrat Rahat, Saudi Arabia. Bull. Volcanol. 76, 804. doi:10.1007/s00445-014-0804-z
Sampietro Vattuone, M. M., Peña Monné, J. L., Maldonado, M. G., Sancho Marcén, C., Báez, W., Sola, A., et al. (2018). Late Holocene Environmental Changes from Fluvio-Aeolian Morpho-Sedimentary Sequences (Santa María Valley, Northwest Argentina). Bgm 129 (4), 647–669. doi:10.21701/bolgeomin.129.4.004
Sampietro-Vattuone, M. M., Báez, W. A., Peña-Monné, J. L., and Sola, A. (2020). Chronological and Geomorphological Approach to the Holocene Tephras from Tafí and Santa María Valleys, NW Argentina. Quat. Res. 94, 14–30. doi:10.1017/qua.2019.78
Sandri, L., Thouret, J.-C., Constantinescu, R., Biass, S., and Tonini, R. (2014). Long-term Multi-Hazard Assessment for El Misti Volcano (Peru). Bull. Volcanol. 76, 771. doi:10.1007/s00445-013-0771-9
Sandri, L., Tierz, P., Costa, A., and Marzocchi, W. (2018). Probabilistic Hazard from Pyroclastic Density Currents in the Neapolitan Area (Southern Italy). J. Geophys. Res. Solid Earth 123, 3474–3500. doi:10.1002/2017jb014890
Schilling, F. R., Trumbull, R. B., Brasse, H., Haberland, C., Asch, G., Bruhn, D., et al. (2006). “Partial Melting in the Central Andean Crust: A Review of Geophysical, Petrophysical, and Petrologic Evidence,” in The Andes: Active Subduction Orogeny. Editors O. Oncken, G. Chong, G. Franz, P. Giese, H.-J. Gotze, and V. A. Ramos, M.R. Strecker, and P. Wigger (Berlin: Springer-Verlag), 459–474.
Schoenbohm, L. M., and Carrapa, B. (2015). “Miocene-Pliocene Shortening, Extension, and Mafic Magmatism Support Small-Scale Lithospheric Foundering in the Central Andes, NW Argentina,” in Geodynamics of a Cordilleran Orogenic System: The Central Andes of Argentina and Northern Chile. Editors P. G. DeCelles, M. N. Ducea, B. Carrapa, and P. A. Kapp (Geological Society of America Memoir), 212, 167–180. doi:10.1130/2015.1212(09)
Schoenbohm, L. M., and Strecker, M. R. (2009). Normal Faulting along the Southern Margin of the Puna Plateau, Northwest Argentina. Tectonics 28, TC5008. doi:10.1029/2008tc002341
Siebe, C., and Macías, J. L. (2003). Volcanic hazards in the Mexico City metropolitan area from eruptions at Popocatépetl, Nevado de Toluca, and Jocotitlán stratovolcanoes and monogenetic scoria cones in the Sierra Chichinautzin Volcanic Field, 402. McLean, VA: Geological Society of America Special Paper, 253–329.
Siebert, L., Simkin, T., and Kimberly, P. (2010). Volcanoes of the World. 3rd ed. Berkeley: University of California Press, 551.
Siebert, L., and Simkin, T. (2002-2012). Volcanoes of the World: An Illustrated Catalog of Holocene Volcanoes and Their Eruptions. Washington, DC: Smithsonian Institution, Global Volcanism Program Digital Information Series. GVP-3.
Sieron, K., Juárez Cerrillo, S. F., González-Zuccolotto, K., Córdoba-Montiel, F., Connor, C. B., Connor, L., et al. (2021). Morphology and Distribution of Monogenetic Volcanoes in Los Tuxtlas Volcanic Field, Veracruz, Mexico: Implications for Hazard Assessment. Bull. Volcanol. 83, 47. doi:10.1007/s00445-021-01467-y
Spang, A., Baumann, T. S., and Kaus, B. J. P. (2021). A Multiphysics Approach to Constrain the Dynamics of the Altiplano-Puna Magmatic System. J. Geophys. Res. Solid Earth 126 (7), e2021JB021725. doi:10.1029/2021jb021725
Stern, C. R., Moreno, H., López-Escobar, L., Clavero, J. E., Lara, L. E., Naranjo, J. A., et al. (2007). “Chilean Volcanoes,” in The Geology of Chile. Editors T. Moreno, and W. Gibbons (London, UK: Geological Society of London), 149–180.
Talchabhadel, R., Nakagawa, H., Kawaike, K., Yamanoi, K., and Thapa, B. R. (2021). Assessment of Vertical Accuracy of Open Source 30m Resolution Space-Borne Digital Elevation Models. Geomatics, Nat. Hazards Risk 12 (1), 939–960. doi:10.1080/19475705.2021.1910575
Tassi, F., Aguilera, F., Vaselli, O., Darrah, T., and Medina, E. (2011). Gas Discharges from Four Remote Volcanoes in Northern Chile (Putana, Olca, Irruputuncu and Alitar): a Geochemical Survey. Ann. Geophys. 54, 2. doi:10.4401/ag-5173
Tassi, F., Aguilera, F., Vaselli, O., Medina, E., Tedesco, D., Delgado Huertas, A., et al. (2009). The Magmatic- and Hydrothermal-Dominated Fumarolic System at the Active Crater of Lascar Volcano, Northern Chile. Bull. Volcanol. 71, 171–183. doi:10.1007/s00445-008-0216-z
Tibaldi, A., Bonali, F. L., and Corazzato, C. (2017). Structural Control on Volcanoes and Magma Paths from Local- to Orogen-Scale: The Central Andes Case. Tectonophysics 699, 16–41. doi:10.1016/j.tecto.2017.01.005
Trumbull, R. B., Riller, U., Oncken, O., Scheuber, E., Munier, K., and Hongn, F. (2006). “The Time-Space Distribution of Cenozoic Volcanism in the South-Central Andes: a New Data Compilation and Some Tectonic Implications,” in The Andes: Active Subduction Orogeny. Editors O. Oncken, G. Chong, G. Franz, P. Giese, H.-J. Gotze, V.A. Ramos, M.R. Strecker, and P. Wigger (Berlin: Springer-Verlag), 29–43.
Ureta, G., Aguilera, F., Németh, K., Inostroza, M., González, C., Zimmer, M., et al. (2020). Transition from Small-Volume Ephemeral Lava Emission to Explosive Hydrovolcanism: The Case of Cerro Tujle Maar, Northern Chile. J. S. Am. Earth Sci. 104, 102885. doi:10.1016/j.jsames.2020.102885
Ureta, G., Németh, K., Aguilera, F., Kósik, S., González, R., Menzies, A., et al. (2021). Evolution of a Magmatic to a Phreatomagmatic Volcanic System: The Birth of a Monogenetic Volcanic Field, Tilocálar Volcanoes, Northern Chile. J. Volcanol. Geotherm. Res. 414, 107243. doi:10.1016/j.jvolgeores.2021.107243
Valentine, G. A., and Gregg, T. K. P. (2008). Continental Basaltic Volcanoes - Processes and Problems. J. Volcanol. Geotherm. Res. 177, 857–873. doi:10.1016/j.jvolgeores.2008.01.050
van Alderwerelt, B. (2017). Diverse Monogenetic Volcanism across the Main Arc of the Central Andes, Northern Chile (Iowa City, Iowa: University of Iowa), 427. PhD Thesis.
van Wyk de Vries, B., Self, S., Francis, P. W., and Keszthelyi, L. (2001). A Gravitational Spreading Origin for the Socompa Debris Avalanche. J. Volcanol. Geotherm. Res. 105 (3), 225–247. doi:10.1016/S0377-0273(00)00252-3
Vélez, M. L., Bustos, E., Euillades, L., Blanco, M., López, J. F. S., Barbero, I., et al. (2021). Ground Deformation at the Cerro Blanco Caldera: A Case of Subsidence at the Central Andes Backarc. J. S. Am. Earth Sci. 106, 102941. doi:10.1016/j.jsames.2020.102941
Ward, K. M., Delph, J. R., Zandt, G., Beck, S. L., and Ducea, M. N. (2017). Magmatic Evolution of a Cordilleran Flare-Up and its Role in the Creation of Silicic Crust. Sci. Rep. 7, 9047. doi:10.1038/s41598-017-09015-510.1038/s41598-017-09015-5
Ward, K. M., Porter, R. C., Zandt, G., Beck, S. L., Wagner, L. S., Minaya, E., et al. (2013). Ambient Noise Tomography across the Central Andes. Geophys. J. Int. 194 (3), 1559–1573. doi:10.1093/gji/ggt166
Ward, K. M., Zandt, G., Beck, S. L., Christensen, D. H., and McFarlin, H. (2014). Seismic Imaging of the Magmatic Underpinnings beneath the Altiplano-Puna Volcanic Complex from the Joint Inversion of Surface Wave Dispersion and Receiver Functions. Earth Planet. Sci. Lett. 404, 43–53. doi:10.1016/j.epsl.2014.07.022
Keywords: Central Volcanic Zone, Chile, Argentina, MatHaz, volcanic hazards
Citation: Bertin D, Lindsay JM, Cronin SJ, de Silva SL, Connor CB, Caffe PJ, Grosse P, Báez W, Bustos E and Constantinescu R (2022) Probabilistic Volcanic Hazard Assessment of the 22.5–28°S Segment of the Central Volcanic Zone of the Andes. Front. Earth Sci. 10:875439. doi: 10.3389/feart.2022.875439
Received: 14 February 2022; Accepted: 31 May 2022;
Published: 27 June 2022.
Edited by:
Pablo Samaniego, UMR6524 Laboratoire Magmas et Volcans (LMV), FranceReviewed by:
Alvaro Aravena, Catholic University of the Maule, ChileSuzanne Kay, Cornell University, United States
Copyright © 2022 Bertin, Lindsay, Cronin, de Silva, Connor, Caffe, Grosse, Báez, Bustos and Constantinescu. This is an open-access article distributed under the terms of the Creative Commons Attribution License (CC BY). The use, distribution or reproduction in other forums is permitted, provided the original author(s) and the copyright owner(s) are credited and that the original publication in this journal is cited, in accordance with accepted academic practice. No use, distribution or reproduction is permitted which does not comply with these terms.
*Correspondence: Daniel Bertin, ZGFuaWVsLmJlcnRpbi51QGdtYWlsLmNvbQ==