 Wen Sun
 Zhanyu Wei
 Haoyue Sun
- State Key Laboratory of Earthquake Dynamics, Institute of Geology, China Earthquake Administration, Beijing, China
High-resolution topographic data are fundamental for active tectonics studies. Within the last 2 decades, the airborne light detection and ranging (LiDAR) system provided a solution for the accurate and efficient acquisition of detailed geomorphic features. The use of LiDAR data for the identification of microstructural and geomorphic features, fault zone activity analysis, and earthquake disaster assessment remains challenging and has been the focus of active tectonics studies. Based on the LiDAR data of Dushanzi anticline–a reverse fault zone in Xinjiang, China, our group carried out a significant number of active tectonic research studies. By reviewing the specific content of these works, we summarized the main application of LiDAR for a specific structure, the Dushanzi Reverse Fault in the northern Tianshan. In addition, other applications of LiDAR in active tectonics are summarized in this paper. These studies show that high-resolution LiDAR data facilitate detailed studies of the fault activity and paleoseismicity. We hope more researchers can realize the advantages of LiDAR technology in active tectonics research and apply LiDAR technology into their own practical work, so as to promote the development of active tectonics research.
Introduction
A moderate to large magnitude (M > 5.5) earthquake may break the ground surface and form various types of earthquake-related landforms, such as fault scarps, offset terraces, gullies, and alluvial fans, and other geomorphic markers (Hilley and Arrowsmith, 2008; Zhou et al., 2020a). These earthquake-related landforms provide valuable information about earthquakes that have occurred over hundreds to tens of thousands of years. Therefore, studies of earthquake-related landforms play a crucial role in gathering this type of information including the earthquake magnitude, recurrence time, and co-seismic slip distribution (Deng and Wen, 2008; Arrowsmith and Zielke, 2009; Zhang et al., 2013; Bi et al., 2016), especially considering the increasing availability of high-resolution topographic and imagery data for tectono-geomorphic interpretation (Shi et al., 2017; Brandenberg et al., 2020).
Among high-resolution topographic data, light detection and ranging (LiDAR)-derived digital elevation models (DEMs) represent one type of high-resolution basemaps that enable the detailed mapping and surveying of the fault geometry and displaced geomorphic markers. Because LiDAR can penetrate the surface vegetation, LiDAR-derived DEMs reveal the high-resolution “bare-earth” topography, which is one of the most desirable benefits of LiDAR data with respect to fault mapping, particularly in densely vegetated areas. Several fault scarps generated by surface rupture earthquakes, which were not identified in previous geological surveys and aerial imagery, could be identified in forest-covered areas by using airborne LiDAR data (Harding and Berghoff, 2000; Kondo et al., 2008).
Within the last 2 decades, the LiDAR data have been increasingly applied in active tectonics including fault zone mapping (Arrowsmith and Zielke, 2009), the reconstruction of surface deformation (Gold and Cowgill, 2011; Zielke et al., 2012), investigation of geomorphic deformation (Hurst et al., 2013), and quantification of near-field co-seismic displacements (Hudnut et al., 2002; Oskin et al., 2012). The results of these studies generally challenge prior research findings and greatly promote the progress of active tectonics research (Kondo et al., 2008; Zielke et al., 2010; ; Zhou et al., 2016). In particular, LiDAR is being used on a large scale in countries with active structures and relevant seismic hazards, such as the United States (Oskin et al., 2012; Zielke et al., 2012) and New Zealand (Clarke and Burbank, 2010; Langridge et al., 2014).
China is one of the most active seismic regions in the world and in recent decades, large-magnitude earthquakes have occurred frequently and abruptly, resulting in serious damage and numerous casualties, such as the 1976 Mw 7.8 Tangshan earthquake (Huang and Yeh, 1997), 2008 Mw 7.9 Wenchuan earthquake) (Xu et al., 2009), and 2021 Mw 7.4 Maduo earthquake (Yuan et al., 2022). Therefore, in China, LiDAR technology and surveys applied to investigate fault activity and earthquake surface deformation are crucial and will improve the country earthquake disaster assessment.
In recent years, Chinese scholars have carried out active fault mapping and fault activity studies in the Haiyuan and Altyn Tagh fault zones using LiDAR data (Zhang et al., 2013; Chen et al., 2014; Ren et al., 2015; Chen et al., 2018; Kang et al., 2019). Our research group carried out surveys in the Dushanzi anticline zone of the northern Tian Shan, including the morphological dating of terraces risers (Wei et al., 2015), paleoseismicity investigation using the fault scarp (Wei et al., 2019), and the automated mapping of landforms (Wei et al., 2017). In this paper, we summarized the application of LiDAR in active tectonics of China by reviewing the specific content of these works. In addition, some studies of high-resolution data in other aspects of active tectonics are generalized in this paper. Furthermore, we discussed the strategies to promote the application of the LiDAR technique in active tectonics studies of China as well as potential breakthroughs.
Airborne LiDAR System
Introduction to the LiDAR Technique
The LiDAR technique involves the calculation of the distance between a laser emission point and an observed object based on the time between the emission and reception of the laser beam according to Eq 1. It operates on the premises that the time is accurately recorded and the laser propagation speed is the speed of light (Axelsson, 1999; Wehr and Lohr, 1999).
where R is the distance between the laser emitter and the observed object surface (m), c is light speed of light (3 x 10⁸ m/s), and t is the difference between the laser emission and reception time (s).
The observation system consists of a laser scanner (with position and orientation system (POS)), global positioning system (GPS), and inertial navigation system (IMU). Depending on the application of the observation system, four measurement methods can be utilized, including satellite-borne, airborne, vehicle-mounted, and ground-based methods. The raw data obtained by LiDAR measurements contain elevation and laser echo intensity information in a point cloud format. And the raw data accuracy depends on the distance between the measurement system and measured landform, GPS measurement accuracy of the ground control points, and weather conditions. Current LiDAR measurement equipment is manufactured by large international companies and preprocessed with the manufacturer’s self-contained data processing algorithm and software. Preprocessing includes the calculation of the absolute coordinates of each measurement point, scanning angle, and GPS time, in reference to POS and GPS data of the aircraft as well as a ground reference point (Ackermann, 1999; Carter et al., 2007; Meigs, 2013). Generally, the most common data provided to the user are preprocessed and solved standard point cloud data (generally in Log ASCII Standard File format, LAS format). These point cloud data are surface data, including buildings and vegetation. The user can filter and classify the point cloud data based on the particular needs of a given study. And then, a Digital Surface Model (DSM) can be extracted from the data. If it is necessary to extract vegetation information from forest surveys, non-ground point (e.g., vegetation) information will be retained. To investigate active tectonics and earthquake records in the landscape, vegetation and “man-made” structures points are removed, so that the final product corresponds exclusively to the real topography (Cunningham et al., 2006). Finally, the classified point cloud data can be quantitatively analyzed and high-resolution DEM data can be extracted.
Advantages of Airborne LiDAR Data
At present, airborne LiDAR and Structure from Motion (SfM) technology are the two most common techniques for obtaining high-resolution DEM data in China.
Compared with the digital photogrammetry technology, the advantages of airborne LiDAR are as follows (Baltsavias, 1999). 1) LiDAR is a direct measurement of three-dimensional coordinates of the earth surface; while the traditional photogrammetry or Radar Interferometry (InSAR) obtain three-dimensional data of the surface through indirect methods. 2) LiDAR can partially transmit vegetation, and effectively remove the effect of the vegetation (Figure 1). As for the photogrammetry technology, the influence of vegetation can only be removed by estimating vegetation height, which greatly affects the accuracy of topography. 3) As an active sensor, the airborne LiDAR system has strong anti-interference ability, and is not affected by weather conditions such as light and clouds.
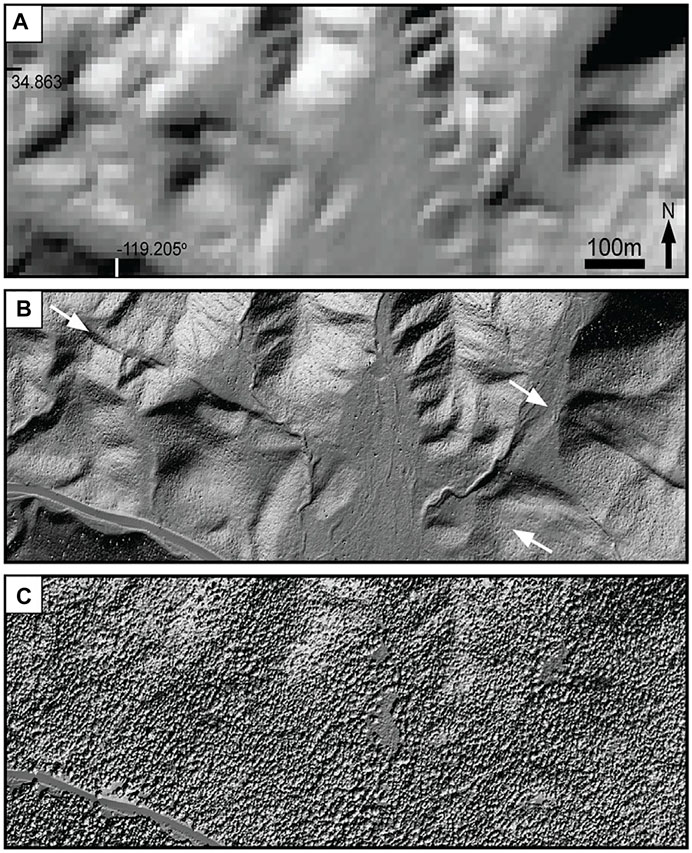
FIGURE 1. Comparison of different resolution data at the same location (Bevis et al., 2005). (A) 10 m resolution DEM. (B) 0.5 m resolution DEM; the elevation information obtained from the last pulse of LiDAR, represents the bare-earth DEM; the white arrows indicate fault trace. (C) 0.5 m resolution DEM; the elevation information obtained from the first pulse of LiDAR, represents the data obtained by UAV-SfM.
Structure from Motion (SfM), another technology of aerial photogrammetry, has developed rapidly due to its advantages of low cost, high flexibility and the ability of quickly acquiring high-precision 3D topographical data (Klinger et al., 2011). Especially in the arid areas or areas after crop harvesting or wilting, the point cloud data generated by the UAV-SfM technology can also accurately reflect the surface features (bare earth) (Wu et al., 2019; Ren et al., 2021). Therefore, the UAV-SfM technology has been an important complementary to LiDAR.
LiDAR Surveys in Dushanzi Reverse Fault, Xinjiang, China
Regional Background and the Data Acquisition
The east–west striking Tian Shan Mountains are one of the most active intracontinental mountain belts in the world (Figure 1A) (Molnar and Tapponnier, 1975; Burchfiel et al., 1999). The northern Tian Shan deformed rapidly because of the ∼S–N trending continental collision of India and Asia. The deformation caused by the ongoing collision is accommodated by a series of east–west trending, subparallel zones of reverse faulting and folding (I, II, and III in Figure 2B), deforming a significant part of the northern piedmont of the Tian Shan (Tapponnier and Molnar, 1979; Allen et al., 1991; Sobel et al., 2006). Because of the ongoing deformation, seismic activity in this region is frequent (Molnar and Ghose, 2000). Approximately 80 earthquakes with magnitude greater than M 5 (three of which exceeded M 7) have occurred in the region since 1716 (Wang et al., 2004).
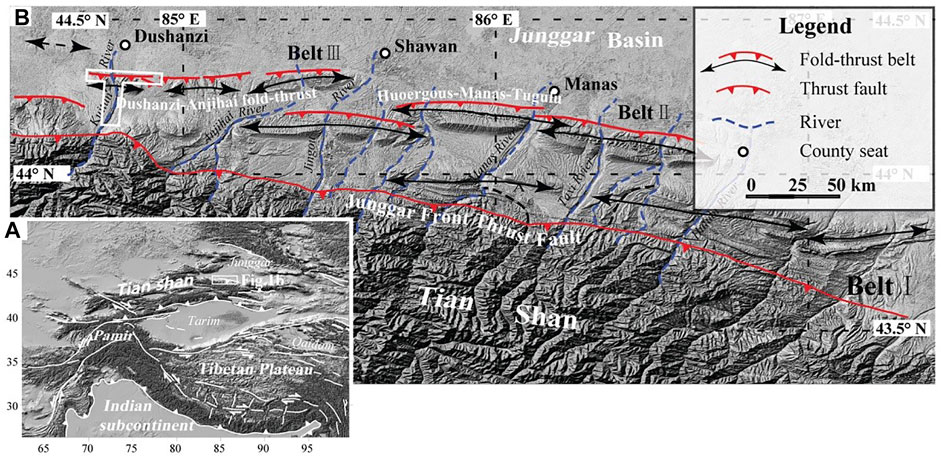
FIGURE 2. (A) Simplified tectonic map showing the location of the Tian Shan. Intracontinental regions within the Eurasian continent were deformed due to the collision between India and Eurasia; (B) Three approximately east–west stretching fold and fault zones (labeled Belts Ⅰ, Ⅱ, and Ⅲ) along the northern piedmont of the Tian Shan. The white rectangle represents the study area (Wei et al., 2019).
The Dushanzi Reverse Fault (DRF), which is located at the west end of the Dushanzi–Anjihai fold-thrust belt (Belt III), is the youngest reverse fault–fold belt. Imagery interpretation and field surveys showed that the DRF is ∼15 km long and 6 km wide. At the surface, the DRF can be divided into two segments (Deng et al., 1996a; Deng et al., 2000): 1) the main fault, which is a reverse fault, and 2) a secondary fault, which is a shallower dipping thrust fault with a right lateral oblique slip component. These fault segments cross through the Kuitun River and piedmont slope of the mountains, forming prominent north-facing, south-side-up fault scarps, which are 2–10 m high, on terraces and alluvial fans (Avouac and Peltzer, 1993; Deng et al., 2000).
Many rivers originate from active glaciers in the axial parts of the Tian Shan and flow north and across the anticline belt (Figure 2B) (Molnar et al., 1994). These rivers flow along very deep valleys, where several terraces are present and provide information about past changes of the climate and regional tectonics. The DRF area is characterized by continental arid climate, with an annual precipitation of <200 mm/yr and the structural and geomorphic features of the DRF are well preserved under such arid climatic conditions (Deng et al., 2000).
The data acquisition area was divided into two parts, representing a T shape. This area comprises the DRF as well as the fluvial terraces at the hanging wall of the thrust zone. The E–W area is 22 km long, 3 km wide, and includes the surface rupture zone of the northern piedmont. And the S-N area is about 25 km long, 4 km wide, and includes the Kuitun fluvial terraces.
The average shot density and mean point spacing of the acquired LiDAR data are 6.5 point per m2 and 0.39 m, respectively (Zhanyu et al., 2014). Firstly, 12 static GPS control points with mm-scale measurement accuracy was used to determine the relative vertical accuracy and mean square deviation, which are 0.12 and 0.078 m, respectively (Zhanyu et al., 2014). Subsequently, the optimal DEM resolution of the ground point cloud data was determined to be 0.5 m by using the inverse distance weighting algorithm (Zhanyu et al., 2014). At this resolution, the DEM data can be used to describe and characterize the geomorphological features of the DRF in detail.
Morphological Dating Using Fluvial Terrace Risers
Dating of the landforms displaced is essential to estimate the period associated to the measured offsets, allowing to quantify a fault slip rate and infer the occurrence patterns of large earthquakes (Zhang et al., 2013; Chen et al., 2014). However, in arid and semiarid regions, dating with 14C is challenging because of the lack of organic material or the material exceeds its dating range (older than 50ka). Despite the luminescence dating or cosmogenic nuclide dating are alternatives (Lal, 1991; Gosse and Phillips, 2001; Schaller et al., 2001; Cockburn and Summerfield, 2004), they are costly or time-consuming. Morphological dating, based on profile change, may provide estimates of the age of scarps developed in unconsolidated alluvial material (Culling, 1960; Nash, 1980; Hanks et al., 2000; Riebe et al., 2000; Crosby et al., 2004; Wei et al., 2015; Xu et al., 2021).
As shown in Figure 3A, the terrace riser separates adjacent terrace treads. When the low tread of a riser is abandoned, the riser is generally represented by nearly vertical slopes. Due to the gravitational collapse, the angle of the riser’s free face would be reduced to angle of repose (generally about 28–37°, depending on the deposition characteristics) (Pierce and Colman, 1986; Hsu and Pelletier, 2004; Harkins and Kirby, 2008). Following this short process, the riser degradation is dominated by less vigorous diffusive hillslope processes (Avouac, 1993). At this stage, the morphological age (kt) of the terrace riser is the sole measure of the profile morphology and a product of the time (t) because diffusive processes have become the active mechanisms for morphological change (Ren et al., 2015). Assuming the region’s transport coefficient (k) value is uniform, when we obtained the morphologic age (kt) of these risers and the absolute age of one of them, we can efficiently determine the other terrace riser’s relative age (Wallace, 1977; Harkins and Kirby, 2008).
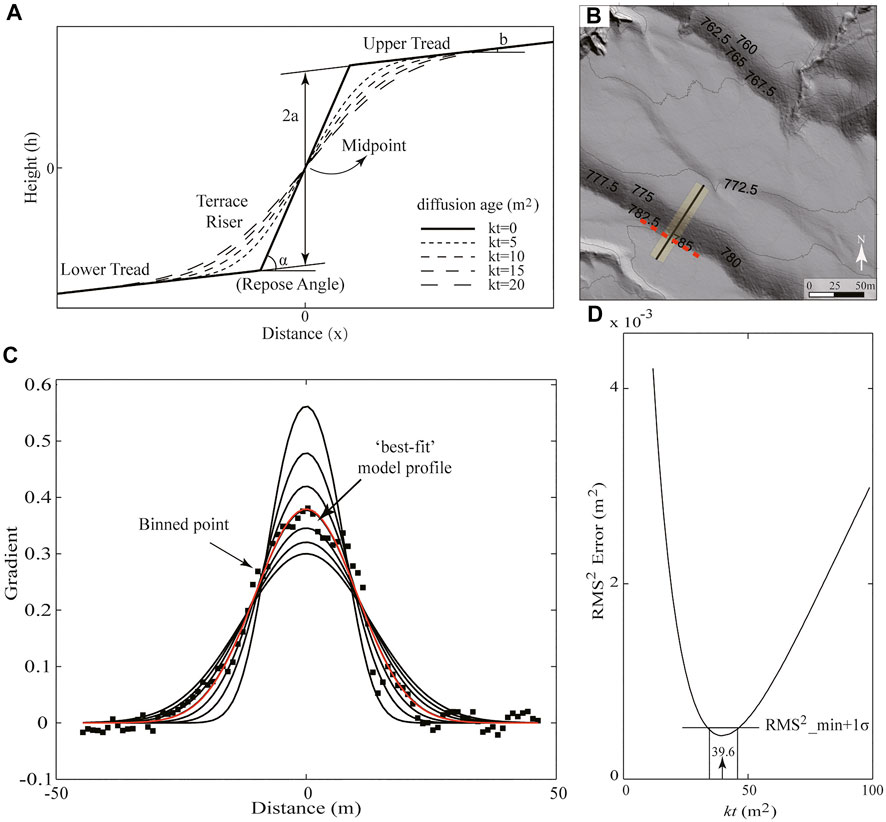
FIGURE 3. Usage of the DEM to conduct swath profile-based morphological dating (Wei et al., 2015). (A) Geometry and diffusive degradation of the terrace riser profile. (B) Hillshade plots were used to identify the terrace riser trace and determine the riser profile sites. (C) Full scarp modeling under a range of kt values was used for the gradient profile. (D) Calculated RMS2 misfits (errors) between the synthetic riser slopes and modeled slopes over a range of kt values.
Many geologists have extensively studied the general evolution of terrace risers (Pierce and Colman, 1986; Hsu and Pelletier, 2004; Clarke and Burbank, 2010). However, only a fraction of topographic profiles have been used for each location because the data acquisition largely depends on labor-intensive field surveys (Nash, 1980; Hanks et al., 2000). DEMs generated from airborne LiDAR allow us to collect and systematically analyze the scarp morphology without labor-consuming field surveys because of the detailed topographical resolution (resolution ≤0.5 m) and digital format (DuRoss et al., 2019; Crosby et al., 20202020; Bello et al., 2021). Based on the high-resolution LiDAR-derived DEMs, Wei et al. (2015) extracted 159 topographic profile swaths of terrace risers and analyzed to determine a range of best-fitting morphological age (Carter et al., 2007).
In every scarp site, Wei et al. (2015) collected a DEM swath with a width of 10 m that represents the terrace riser profile (Wei et al., 2015). Firstly, all grid points in the swath are projected onto the center line (black line in Figure 3B). Next, the above projected points are grouped at 1-m intervals, and constructed the center point of the binned data as a synthetic elevation profile, which represents the terrace riser’s morphology (Figure 3C). From this profile, the gradient profile is calculated and then compared with these gradient profiles to determine the terrace riser’s “best-fit” kt value (Figure 3D) (Wei et al., 2015).
Combined the morphological age (kt) of the T1/T2 riser and its independently absolute age (Molnar et al., 1994; Deng et al., 1996a; Deng et al., 2000), a locally applicable sediment transport coefficient (k) was determined (5.5 ± 1.6 m2/ky). Subsequently, the coefficient was used to estimate the age ranges of the terraces T2/T3, T3/T4, T4/T5, and T5/T6, which are 11.6 ± 3.4, 6.5 ± 1.4, 5.3 ± 1.1, and 4.2 ± 1.2 ka, respectively [Figure 4, 22]. It needs to be emphasized that the ages represent the lower terrace’s abandonment ages. Poisson et al. (Poisson and Avouac, 2004) mapped the fluvial terraces along the Kuitun River and obtained the abandonment ages of some terrace by optically stimulated luminescence (OSL) samples or radiocarbon samples, in which T3, T4 and T6 are 10–11 ka B.P, 6.8–7.5 ka B.P. and 3.3–3.5 ka B.P, respectively. Through comparison, the ages obtained by these two approaches are consistent (Wei et al., 2015). It demonstrates that the DEM-based morphological dating technique is reliable and it can be used to quickly estimate the abandonment age of landform terraces. This method can be applied to a variety of other areas for which high-resolution DEMs are available.
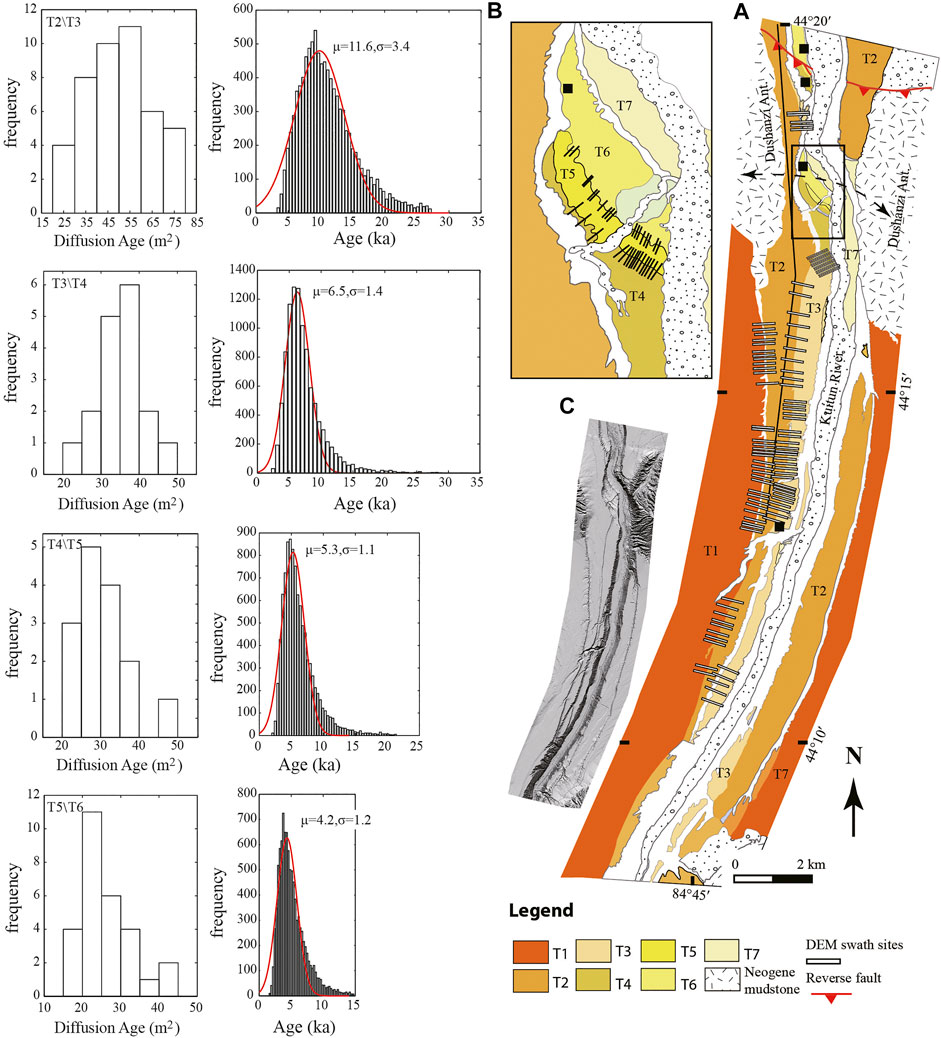
FIGURE 4. Diffusion ages of the terrace risers estimated based on the analysis of the riser diffusivity and its location of different terraces (Wei et al., 2015). The histograms on the left show the probability distribution of the diffusion ages and frequency distribution of ages, respectively. The map on the right indicate the location of different terrace risers. (A) Distribution of river terraces along the Kuitun River; (B) Enlarged view of the black box in (A); (C) Hillshade from LiDAR-derived DEM, the area is the same as (A).
Investigating Paleoseismicity Using Fault Scarp Morphology
Tectonic landforms, such as fault scarps and displaced channels, are the result of large magnitude earthquake surface ruptures overprinting surface processes. Fault scarp, as a typical seismic landform, is frequently used to indicate the fault location, estimate fault slip rate and infer past events characteristics (Wells and Coppersmith, 1994; Hilley and Arrowsmith, 2008).
Previous studies have employed the offset clustering distribution to identify the paleo-earthquake events and co-seismic displacements (McGill and Sieh, 1991; Grant and Sieh, 1994). Limited to the data accuracy, the identification and extraction of information from the tectonic landforms have led to persistent challenges (Chen et al., 2006). Within the last 2 decades, the DEM derived from airborne LiDAR enabled researchers to quickly obtain high-resolution three-dimensional (3D) topographic data. Therefore, the comprehensive information, including the scarp height and slope change, can be used to study the paleoseismic history (Wei et al., 2020).
To study the morphological characteristics of a fault scarp in unconsolidated material, Wei et al. (2018) selected a well-preserved scarp (∼2 km) of the DRF. Firstly, profiles of scarps normal to the fault were extracted from the DEM with lengths depending on the width of the surface deformation, generally spanning 40–160 m (Figure 5A). To measure the scarp heights, they fitted separate straight lines with a simple least squares regression to the profile segments on each side of the scarp slope as the original geomorphic surfaces and the vertical separation between the lines was measured as the vertical displacement at the midpoint of the scarp slope [Figure 5B, 23, 86].
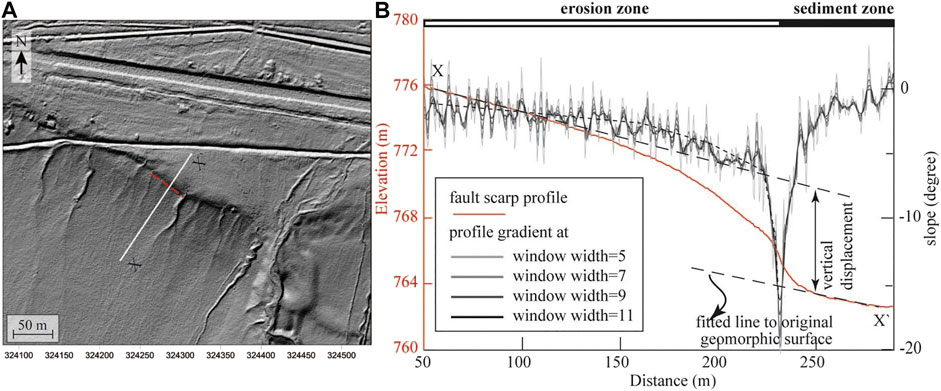
FIGURE 5. Vertical displacement measurement and slope breaks detection for a fault scarp (Wei et al., 2019). (A) Hillshade plots were used to identify the fault scarp and determine the profile site; (B) Measurement of vertical displacement and detection of slope breaks from scarp and gradient profiles, respectively.
As for the slope change of unconsolidated-sediment fault scarp, the generally evolution as follows. After one event occurred, the scarp morphology would be reset and lost its previous morphology consequently due to the gravitational collapse (Figure 6A). According to the degradation model, there are multiple slope breaks in the fault scarp morphology, and each slope break represents a surface rupture event for a compound fault scarp formed by multiple fault rupture [Figures 6D–F, 80, 81]. Different morphologies of the cumulative reverse fault scarps were obtained through the numerical models, and can be summed up in three overall cases (Carretier et al., 2002; Wei et al., 2019). To determine the slope breaks in profile, Wei et al. (2018) compute the gradient, the first derivative, along each elevation profiles and document the gradient changes. To avoid the over-interpretation of gradient changes, they identified these slope breaks by visually checking the gradient changes in the calculated profiles (Wei et al., 2019).
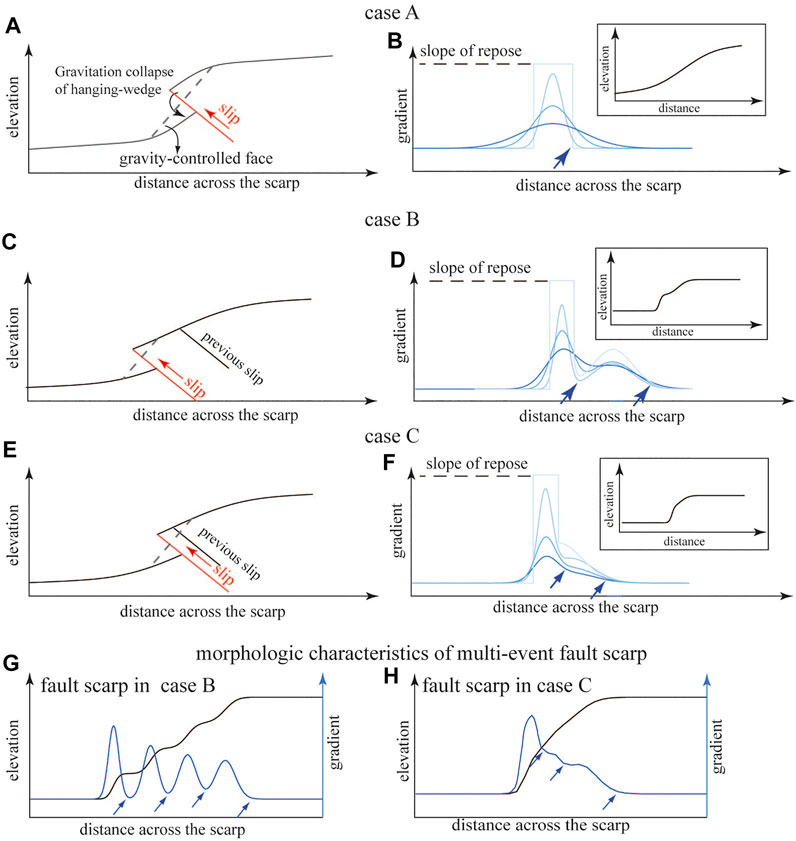
FIGURE 6. The thrust fault scarp morphologies in multiple seismic activities (Wei et al., 2019). In case A, (A) and (B) show the scarp morphology, the associated slope profiles and the profile of fault scarp (inset box) for faults cutting the surface roughly at the same place. In case B, (C) and (D) show the scarp morphology, the associated degraded slope profiles and the profile of fault scarp (inset box) for the successive faults are distant enough to preserve the morphology inherited from previous erosion period. In case C, (E) and (F) show the scarp morphology, the associated degraded slope profiles and the profile of fault scarp (inset box) for the distance between faults is moderate, and a portion of the previous scarp can be preserved from gravitational collapse. (G) and (H) show the fault scarps and corresponding slope profiles after multi-event earthquakes, as in Cases B and C (Wei et al., 2019).
Based on the 237 vertical displacements in various landform surfaces (Figure 7A), Wei et al. (2018) acquired the normal distribution of the along-strike scarp heights, expressed as a COPD (cumulative offset probability distribution) (Figure 7B). Due to the repeated surface-rupturing events exist on a fault, the offsets clusters with similar displacements are interpreted as the cumulative slip associated with successive paleoearthquakes (McGill and Sieh, 1991; Yeats et al., 1997; Zhou et al., 2020b). In addition, based on the gradient analysis of 94 scarp profiles, Wei et al. (2018) determined several slope breaks that account for several surface-faulting events in difference terraces [Figure 7B, 23]. Statistical analysis shows that the selected fault segment has most likely experienced four individual rupture events since the formation of terrace T2 and three events since the formation of T1 (Wei et al., 2019).
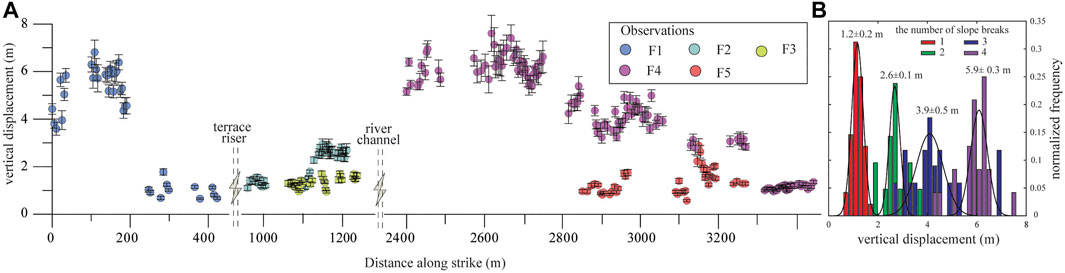
FIGURE 7. Distribution of the displacement along the fault segment (A) and its characteristics of vertical displacement clustering (B) (Wei et al., 2019).
Combining the surface rupture length (14–18 km), mean slip of single event (1.8 ±0.5 m) and the cascade rupture length (55–60 km), the magnitude of the DRF was estimated between Mw 6.5–6.7 (Wells and Coppersmith, 1994; Wei et al., 2019). In addition, based on the previous studies about the time frame for terraces along the Kuitun River (Deng et al., 2000; Poisson and Avouac, 2004; Yang et al., 2011) and the surface-rupturing event numbers, they further estimated the average recurrence interval of large earthquakes in DRF.
This study in Wei et al. (2019) demonstrated that fault scarps can be served as a geomorphic marker to quantify the number of surface-rupturing events and estimate cumulative and single-event vertical displacements (Wei et al., 2019). The results also highlight the importance of high-resolution LiDAR-derived DEM in paleoearthquake surveys.
Automated Geomorphological Mapping
Geomorphological maps, which are often used to describe topographic features, can provide information about the origin and evolution of landforms. In addition, in some tectonically active areas, geomorphological maps can also provide information about the risks associated with earthquakes and landslides (Vedder and Wallance, 1970; Arrowsmith and Zielke, 2009). In the past, mapping in geomorphic analysis generally depended on the stereoscopic interpretation of aerial photographs and time-consuming, laborious field surveys (Masoud and Koike, 2006). The results of geomorphologic analysis may be biased due to subjective experiences, especially in areas which are steep and difficult terrain (Williams et al., 2012).
Therefore, the demand for automatic geomorphological mapping based on DEM is increasing (MacMillan et al., 2000; Lohani and Mason, 2001; Ostaficzuk, 2005; Prima et al., 2006; Evans, 2012). The previous researches are usually used to obtain the large-scale topography, such as basins and ranges, because its resolution is generally about 20–80 m horizontally and 10 m vertically (Smith et al., 2006; Suwandana et al., 2012).
Within the last 2 decades, the explosion in sub-meter resolution airborne LiDAR data raises the reliability and practicality of geomorphological mapping (Nissen et al., 2012; Lin et al., 2013; Dong, 2015). Compared with large-scale DEM data mentioned above, DEMs derived from LiDAR are of great advantage with respect to the detailed description of microscopic topographic elements related to tectonic activities and surface processes. Therefore, Wei et al. (2017) utilized high-resolution LiDAR data from the Dushanzi anticline for automated landform mapping research (Wei et al., 2017).
After the data analysis, Wei et al. (Wei et al., 2017) utilized four types of morphometric attributes, including the relief variance, fractal dimension, area rate, and crossover length, to define the topographic features of specific terrains. The above-mentioned four morphometric attributes were used as morphometric variables in classification algorithms. The automated mapping process consists of four steps (Figure 8): 1) using the moving window routine to generate thematic raster maps of the terrain properties; 2) obtaining the feature vectors for different landform types by delineating the training areas; 3) computing the Mahalanobis distance between the predefined classes and each unclassified pixel; and 4) classifying each pixel of the thematic raster maps with the minimum Mahalanobis distance classifier and generating a map (Wei et al., 2017).
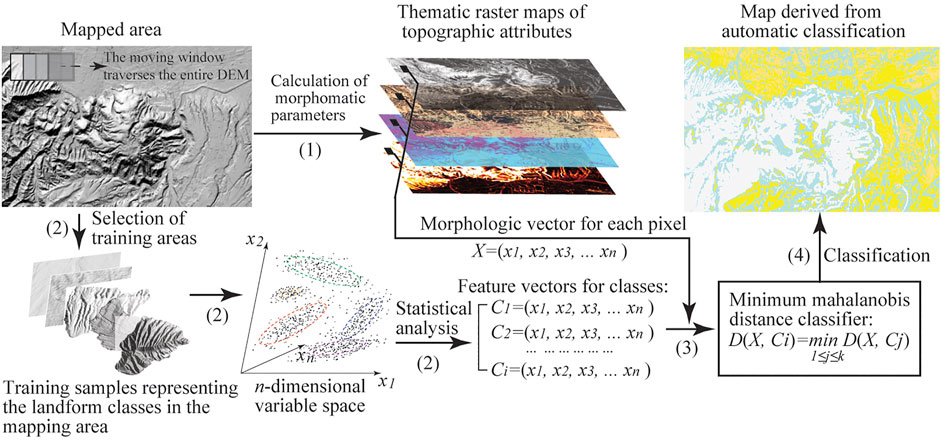
FIGURE 8. Schematic diagram of the automated geomorphological mapping (Wei et al., 2017).
Compared with the field mapping (Deng et al., 1995) and image interpretation, the automated landform classification method can be used to reconstruct a detailed geomorphological map with a classification accuracy of 72.9% and a kappa coefficient (κ) of 0.66 (Figure 9) (Wei et al., 2017). The results of the interpretation of the automatic classification reveal alluvial landforms with a notable east–west direction. This earthquake rupture zone is closely related to the thrust fault, which should be avoided in major engineering projects (Wei et al., 2017). With the increasing popularity of high-resolution digital terrain data, automatic landform classification is expected to be widely applied to geomorphological characterization and mapping analyses due to its high efficiency and accuracy.
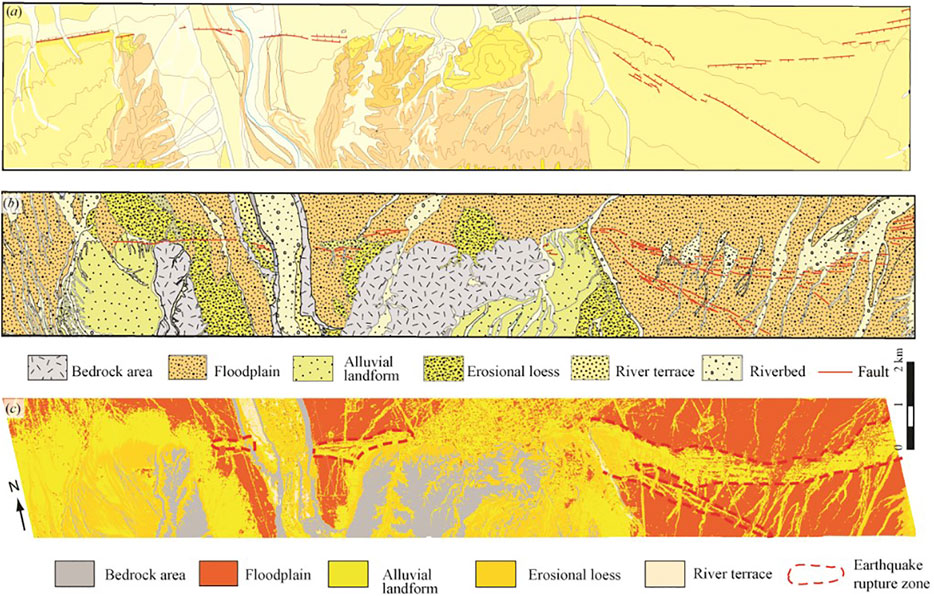
FIGURE 9. Comparison of the map obtained from supervised classification of landforms (automated classification) (C) with the field-based geomorphological map (A) and interpretation-based geomorphological map (B) (Wei et al., 2017).
LiDAR Application in Other Aspects of Active Tectonics
As mentioned, we reviewed our works which were based on the LiDAR data, including dating the terrace risers through its morphology, investigating paleoseismicity using fault scarp, and automated geomorphological mapping. In addition, in the field of active tectonics, LiDAR data also play a great role in co-seismic deformation, offset measurement, and the monitoring of inter-earthquake deformation.
Cumulative Displacement Measurements
The first application of LiDAR in active tectonics was a survey of surface rupture associated with the Hector Mine earthquake in southern California in 1999 (Hudnut et al., 2002). The results showed that the resolution and accuracy of data yielded by LiDAR exceeded what could be obtained by traditional methods (Meigs, 2013). Subsequently, based on the sub-meter topographic data using airborne LiDAR and UAV photogrammetry (UAV-SfM), the researchers successfully reconstructed the offset accumulation pattern of multiple faults from geomorphic evidence (Scharer et al., 2010; Zielke et al., 2010; Klinger et al., 2011; Zielke et al., 2015).
In China, Ren et al. (2015) used the Lidar data to measure the cumulative offsets along Haiyuan fault and reevaluate the single-event offsets of the 1920 Haiyuan Ms 8.5 earthquake (Ren et al., 2015). They found the previously reported maximum displacement of the 1920 earthquake might be the result of at least two earthquakes, which challenged our understanding of the Haiyuan Fault’s characteristic (Ren et al., 2015). And the approach has been applied on other large faults in China, such as the Altyn Tagh Fault (Ren et al., 2015), the Fuyun fault (Liang et al., 2021), the Tianjingshan fault (Li et al., 2017), and the Xianshuihe fault (Ma et al., 2022).
However, it has also been pointed out that the applicability of cumulative offset probability distribution (COPD) is an important topic. Lin et al. (2020) combined the statistical modeling with global historical coseismic surface rupture data to evaluate the conditions required for COPD (Zhou et al., 2020a; Zhou et al., 2020b). The results show that robust COPD interpretation on large fault needs low offset variability, sufficient offset measurements and other constraints like paleoseismic event sequence data (Ren et al., 2015; Zhou et al., 2020a). In addition, the results from LaDiCaoz (Zielke and Arrowsmith, 2012), a commonly used offset measurement software, often produces systematic errors in the offset measurement process because it requires the field survey or subjective determination of the strike of faults and displaced gullies. Thus, developing a fully-automatic repeatable and verifiable offset-measuring algorithm can be considered in the future.
Co-Seismic Deformation Detection Using Pre and Post-Earthquake LiDAR DEM
After the 2010 EL Mayor-Cucapah earthquake, Oskin et al. (2012) obtained the co-seismic deformation field by subtraction of pre-earthquake and post-earthquake Lidar data, providing a new idea for future co-seismic deformation research (Nissen et al., 2012; Oskin et al., 2012).
Chinese scholars have also noticed the advantages of LiDAR technology in coseismic deformation observation and applied it to practical work. After the 2010 Yushu Earthquake, Yuan et al. (2012) used ground-based terrestrial laser scanning surveys (TLS) to scan the Changusi segment, and obtained fine 3D data of the surface rupture zone at this point, and also obtained its vertical and horizontal amount of co-earthquake dislocations (Yuan et al., 2012).
After the 2021 Maduo Earthquake, Yuan et al [2022] used UAV-SfM to take photographs of the surface rupture of the Maduo Earthquake systematically, and quickly obtained the detailed surface rupture distribution and horizontal and vertical displacement distribution maps of the Maduo Earthquake (Yuan et al., 2022). This work has demonstrated great efficiency of UAV in processing post-earthquake emergency data, and also improves the precision and accuracy of co-earthquake dislocation measurements.
Based on the large-scale acquisition of high-resolution DEM data, it is possible to obtain more pre-earthquake data. Therefore, the study of co-seismic deformation based on Lidar data will be increasingly applied to active tectonics, and provide a basis for the study of earthquake occurrence mechanism and deformation mechanism.
Summary
Within the last 2 decades, the explosive development of LiDAR acquisition technology has pushed active tectonics research to a new level (Karabacak et al., 2011; Langridge et al., 2014; Ren et al., 2014). Compared with the conventional topographical data, LiDAR data has unique technical advantages.
Firstly, the main advantage of LiDAR is that it can obtain the actual surface topographic information by eliminating vegetation data even in densely vegetated areas (Meigs, 2013; Glennie et al., 2014). This property enables the LiDAR becomes applicably for tectono-geomorphic features analysis and the extraction of the detailed geometry and kinematics of the fault zone (Gold and Cowgill, 2011; Papanikolaou et al., 2015). Secondly, after the debut of LiDAR as a means for survey the co-seismic surface rupture, its stunning accuracy and resolution highlights the potential in active tectonic research (Hudnut et al., 2002). And since then, more and more studies employed LiDAR data and advanced our understanding of active tectonics, such as the co-seismic deformation field analysis using before and after earthquake differential LiDAR data (Nissen et al., 2014; Ren et al., 20182018), identifying both the on- and off-fault deformation along strike slip faults (Oskin et al., 2012; Ren et al., 2015; Zielke et al., 2015) or monitoring the after-slip (Wilkinson et al., 2010). In addition, compared with optical remote sensing satellite measurements, the airborne LiDAR is less affected by weather than, thus it can be applied for emergency works in the case of natural disasters, such as earthquakes and volcanoes. Thus, with the development of LiDAR surveying, numerous active fault systems in United States, New Zealand, and Japan have been extensively surveyed via airborne LiDAR, and a rapidly growing LiDAR datasets is now available (e.g., www.opentopography.org) (Zielke et al., 2015).
The ∼20 years of development of LiDAR survey in active tectonics have allowed an unprecedented improvement in this research field, promoting the active tectonics research from a qualitative to a more and more quantitative one (Zielke et al., 2015). And in China, based on the LiDAR data, the researchers have carried out the active faults mapping, fault activity studies, and the identification of earthquake recurrence behavior in Haiyuan, Dushanzi, and Altyn Tagh fault (Chen et al., 2010; Zhang et al., 2013; Chen et al., 2014; Ren et al., 2015; Wei et al., 2015; Chen et al., 2018; Kang et al., 2019). Nevertheless, the main foci of these studies were the interpretation of tectonic landforms and the extraction of the offsets, which have significant limitations with respect to innovative data analysis and data mining methods. In addition, the current problems of LiDAR include the high cost of LiDAR scanning, and the difficulty of implementing point cloud filtering in areas with steep slopes such as mountains and canyons.
Therefore, the efficient application of LiDAR technologies and data for the analysis of fault activity and earthquake disaster assessment should be the focus of future active tectonics studies. This is also critical for promoting studies of the evolution of the tectonic geomorphology, seismic fault rupture modes, and other related issues in China. We hope that more researchers will recognize the advantages of LiDAR technology in active tectonics studies and apply this technology to promote the development of active tectonics research.
Author Contributions
The overall idea of this article was provided by WZ and HH. The structure of this article was designed by SH and SW. The article was mainly written by SW. WZ and SH provided funding for the study. And all the authors contributed to manuscript revision and discussion and approved the submitted version.
Funding
This work was supported by the National Key Research and Development Program of China (2021YFC3000601); National Nonprofit Fundamental Research Grant of China (IGCEA1607); Fundamental Scientific Research Project of the Institute of Geology, China Earthquake Administration (IGCEA1801).
Conflict of Interest
The authors declare that the research was conducted in the absence of any commercial or financial relationships that could be construed as a potential conflict of interest.
Acknowledgments
We are especially grateful to PMF, OZ and Associate Editor M-TR-H for helpful suggestions and comments that substantially improved the original manuscript. Ian Pierce helped to edit the manuscript language.
Publisher’s Note
All claims expressed in this article are solely those of the authors and do not necessarily represent those of their affiliated organizations, or those of the publisher, the editors and the reviewers. Any product that may be evaluated in this article, or claim that may be made by its manufacturer, is not guaranteed or endorsed by the publisher.
References
Ackermann, F (1999). Airborne Laser Scanning-Present Status and Future Expectations. ISPRS J. Photogram Remote Sens. 54, 65–67. doi:10.1016/S0924-2716(99)00009-X
Allen, M. B., Windley, B. F., Chi, Z., Zhong-Yan, Z., and Guang-Rei, W. (1991). Basin Evolution within and Adjacent to the Tien Shan Range, NW China. J. Geol. Soc. 148 (2), 369–378. doi:10.1144/gsjgs.148.2.0369
Arrowsmith, J. R., and Zielke, O. (2009). Tectonic Geomorphology of the San Andreas Fault Zone from High Resolution Topography: an Example from the Cholame Segment. Geomorphology 2009. doi:10.1016/j.geomorph.2009.01.002
Avouac, J.-P. (1993). Analysis of Scarp Profiles: Evaluation of Errors in Morphologic Dating. J. Geophys. Res. 98 (B4), 6745–6754. doi:10.1029/92jb01962
Avouac, J.-P., and Peltzer, G. (1993). Active Tectonics in Southern Xinjiang, China: Analysis of Terrace Riser and Normal Fault Scarp Degradation along the Hotan-Qira Fault System. J. Geophys. Res. 98 (B12), 21773–21807. doi:10.1029/93jb02172
Axelsson, P. (1999). DEM Generation from Laser Scanner Data Using Adaptive TIN Model. Int. Archives Photoframmetry, Remote Sens. Spatial Inf. Sci. 33 (B4/1), 110–117.
Baltsavias, E. P. (1999). A Comparison between Photogrammetry and Laser Scanning. ISPRS J. photogrammetry Remote Sens. 54 (2-3), 83–94. doi:10.1016/s0924-2716(99)00014-3
Bello, S., Scott, C. P., Ferrarini, F., Brozzetti, F., Scott, T., Cirillo, D., et al. (2021). High-resolution Surface Faulting from the 1983 Idaho Lost River Fault Mw 6.9 Earthquake and Previous Events. Sci. Data 8 (68). doi:10.1038/s41597-021-00838-6
Bevis, M., Hudnut, K., Sanchez, R., Toth, C. K., Grejner-Brzezinska, D., Kendrick, E., et al. (2005). The B4 Project: Scanning the San Andreas and San Jacinto Fault Zones. Am. Geophys. Union Fall Meet. Abstr. 2005, H34B–H01.
Bi, H., Zheng, W., Ren, Z., Zeng, J., and Yu, J. (2016). Using an Unmanned Aerial Vehicle for Topography Mapping of the Fault Zone Based on Structure from Motion Photogrammetry. Int. J. Remote Sens. 2495–2510.doi:10.1080/01431161.2016.1249308
Brandenberg, S. J., Stewart, J. P., Wang, P., Chukwuebuka, C. N., Hudson, K., Goulet, C. A., et al. (2020). Ground Deformation Data from GEER Investigations of Ridgecrest Earthquake Sequence. Seismol. Res. Lett. 91 (4). doi:10.1785/0220190291
Burchfiel, B. C., Brown, E. T., Qidong, D., Xianyue, F., Jun, L., Molnar, P., et al. (1999). Crustal Shortening on the Margins of the Tien Shan, Xinjiang, China. Int. Geol. Rev. 41, 665–700. doi:10.1080/00206819909465164
Carretier, S., Lucazeau, F., Ritz, J. F., and Philip, H. (2002). Comparison of Morphological Dating Models for Cumulative Reverse Fault Scarps. J. Geophys. Res. 107 (B10), ETG 4-1–ETG 4-16. doi:10.1029/2000jb000028
Carter, W. E., Shrestha, R. L., and Slatton, K. C. (2007). Geodetic Laser Scanning. Phys. Today 60 (12), 41–47. doi:10.1063/1.2825070
Chen, G-H., Xi-wei, X., Xue-ze, W., Wang, Y-L., and Zheng, R-Z. (2006). Application of Digital Aerophotogrammetry in Active Tectonics. Earth Science-Journal China Univ. Geosciences 31 (3). (in Chinese with English abstract). doi:10.3321/j.issn:1000-2383.2006.03.020
Chen, L., Wang, H., Ran, Y., Sun, X., Su, G., Wang, J., et al. (2010). The M S7.1 Yushu Earthquake Surface Rupture and Large Historical Earthquakes on the Garzê-Yushu Fault. Chin. Sci. Bull. 55, 3504–3509. doi:10.1007/s11434-010-4079-2
Chen, T., Liu-Zeng, J., Shao, Y., Zhang, P., Oskin, M. E., Lei, Q., et al. (2018). Geomorphic Offsets along the Creeping Laohu Shan Section of the Haiyuan Fault, Northern Tibetan Plateau. Geosphere 14 (3), 1165–1186. doi:10.1130/ges01561.1
Chen, T., Zhang, P. Z., Liu, J., Li, C. Y., Ren, Z. K., and Hudnut, K. W. (2014). Quantitative Study of Tectonic Geomorphology along Haiyuan Fault Based on Airborne LiDAR. Chin. Sci. Bull. 59, 2396–2409. doi:10.1007/s11434-014-0199-4
Clarke, B. A., and Burbank, D. W. (2010). Evaluating Hillslope Diffusion and Terrace Riser Degradation in New Zealand and Idaho. J. Geophys. Res. Earth Surf. 115 (F2). doi:10.1029/2009jf001279
Cockburn, H. A. P., and Summerfield, M. A. (2004). Geomorphological Applications of Cosmogenic Isotope Analysis. Prog. Phys. Geogr. Earth Environ. 28 (1), 1–42. doi:10.1191/0309133304pp395oa
Crosby, C. J., Arrowsmith, J. R., and Nandigam, V. (2020). Zero to a Trillion: Advancing Earth Surface Process Studies with Open Access to High-Resolution Topography. Developments in Earth Surface Processes. doi:10.1016/B978-0-444-64177-9.00011-4
Crosby, C. J., Arrowsmith, J. R., Oldow, J. S., and Prentice, C. S. (2004). Exploiting LiDAR for Regional Morphologic Correlation and Dating of Wave-Cut and Fault-Controlled Landforms. San Francisco: AGU, Fall Meet. Suppl., G13B–G0810. Abstract.
Cunningham, D., Grebby, S., Tansey, K., Gosar, A., and Kastelic, V. (2006). Application of Airborne LiDAR to Mapping Seismogenic Faults in Forested Mountainous Terrain, Southeastern Alps, Slovenia. Geophys. Res. Lett. 33, L20308. doi:10.1029/2006GL027014
Deng, Q., and Wen, X. (2008). A Review on the Research of Active Tectonics: History, Progress and Suggestions (In Chinese). Seismol. Geol. 30 (1), 1–30. doi:10.2307/3403038
Deng, Q. D., Feng, X. Y., Zhang, P. Z., Xu, X. W., Yang, X. P., Peng, S. Z., et al. (1996a). Active Reverse Fault Fold-Zones and Earthquakes along Northern Tianshan, Xinjiang, China. Seismol. Geol. 18 (Suppl. l), 21–37.
Deng, Q., Feng, X., You, H., and Zhang, P. (1995). Geology Map of Active Reverse Fault and Fold Zone in North Tianshan Piedmont, Xinjiang in Chinese. Beijing: Seismological Press.
Deng, Q., Feng, X., and Zhang, P. (2000). Active Tectonics of the Tian-Shan. Beijing: Seismological Press, 1–339. (in Chinese with an English abstract).
Dong, P. (2015). Lidar Data for Characterizing Linear and Planar Geomorphic Markers in Tectonic Geomorphology. J. Geophys Remote Sens. 04, 1. doi:10.4172/2169-0049.1000136
DuRoss, C. B., Bunds, M. P., Gold, R. D., Briggs, R. W., Reitman, N. G., Personius, S. F., et al. (2019). Variable Normal-Fault Rupture Behavior, Northern Lost River Fault Zone, Idaho, USA. Geosphere 15 (6), 1869–1892. doi:10.1130/ges02096.1
Evans, I. S. (2012). Geomorphometry and Landform Mapping: What Is a Landform? Geomorphology 137 (1), 94–106. doi:10.1016/j.geomorph.2010.09.029
Glennie, C. L., Hinojosa-Corona, A., Nissen, E., Kusari, A., Oskin, M. E., Arrowsmith, J. R., et al. (2014). Optimization of Legacy Lidar Data Sets for Measuring Near-Field Earthquake Displacements. Geophys. Res. Lett. 41 (10), 3494–3501. doi:10.1002/2014gl059919
Gold, R. D., and Cowgill, E. (2011). Deriving Fault-Slip Histories to Test for Secular Variation in Slip, with Examples from the Kunlun and Awatere Faults. Earth Planet. Sci. Lett. 301 (1–2), 52–64. doi:10.1016/j.epsl.2010.10.011
Gosse, J. C., and Phillips, F. M. (2001). Terrestrial In Situ Cosmogenic Nuclides: Theory and Application. Quat. Sci. Rev. 20 (14), 1475–1560. doi:10.1016/s0277-3791(00)00171-2
Grant, L. B., and Sieh, K. (1994). Paleoseismic Evidence of Clustered Earthquakes on the San Andreas Fault in the Carrizo Plain, California. J. Geophys. Res. 99 (B4), 6819–6841. doi:10.1029/94jb00125
Hanks, T. C. (2000). “The Age of Scarplike Landforms from Diffusion Equation Analysis,” in Quaternary Geochronology, Methods and Applications. Editors J. S. Noller, J. M. Sowers, and W. R. Lettis (Washington, DC: American Geophysical Union), 313–338.
Harding, D. J., and Berghoff, G. S. (2000). Fault Scarp Detection beneath Dense Vegetation Cover: Airborne LiDAR Mapping of the Seattle Fault Zone, Bainbridge Island, Washington State. Washington, D, C.: Proceedings of the American Society of Photogrammetry and Remote Sensing Annual Conference, 1∼9.
Harkins, N., and Kirby, E. (2008). Fluvial Terrace Riser Degradation and Determination of Slip Rates on Strike-Slip Faults: an Example from the Kunlun Fault, China. Geophys. Res. Lett. 35 (5), L05406. doi:10.1029/2007gl033073
Hilley, G. E., and Arrowsmith, J. R. (2008). Geomorphic Response to Uplift along the Dragon's Back Pressure Ridge, Carrizo Plain, California. Geol 36 (5), 367–370. doi:10.1130/g24517a.1
Hsu, L., and Pelletier, J. D. (2004). Correlation and Dating of Quaternary Alluvial-Fan Surfaces Using Scarp Diffusion. Geomorphology 60 (3), 319–335. doi:10.1016/j.geomorph.2003.08.007
Huang, B-S., and Yeh, Y. T. (1997). The Fault Ruptures of the 1976 Tangshan Earthquake Sequence Inferred from Coseismic Crustal Deformation. Bull. Seismol. Soc. Am. 87 (4), 1046–1057. doi:10.1785/BSSA0870041046
Hudnut, K. W., Borsa, A., Glennie, C., and Minster, J. B. (2002). High-resolution Topography along Surface Rupture of the 16 October 1999 Hector Mine, California, Earthquake (Mw 7.1) from Airborne Laser Swath Mapping. Bull. Seismol. Soc. Am. 92, 1570–1576. doi:10.1785/0120000934
Hurst, M. D., MuddAttal, S. M. M., Attal, M., and Hilley, G. (2013). Hillslopes Record the Growth and Decay of Landscapes. Science 341, 868–871. doi:10.1126/science.1241791
Kang, W. J., Xu, X. W., Oskin, M. E., Yu, G. H., Luo, J. H., Chen, G. H., et al. (2019). Characteristic Slip Distribution and Earthquake Recurrence along the Eastern Altyn Tagh Fault Revealed by High-Resolution Topographic Data. Geosphere 16. doi:10.1130/ges02116.1
Karabacak, V., Altunel, E., and Cakir, Z. (2011). Monitoring Aseismic Surface Creep along the North Anatolian Fault (Turkey) Using Ground-Based LiDAR. Earth Planet. Sci. Lett. 304, 64–70. doi:10.1016/j.epsl.2011.01.017
Klinger, Y., Etchebes, M., Tapponnier, P., and Narteau, C. (2011). Characteristic Slip for Five Great Earthquakes along the Fuyun Fault in China. Nat. Geosci. 4 (6), 389–392. doi:10.1038/ngeo1158
Kondo, H., Toda, S., Okumura, K., Takada, K., and Chiba, T. (2008). A Fault Scarp in an Urban Area Identified by LiDAR Survey: A Case Study on the Itoigawa-Shizuoka Tectonic Line, Central Japan. Geomorphology 101, 731–739. doi:10.1016/j.geomorph.2008.02.012
Lal, D. (1991). Cosmic Ray Labeling of Erosion Surfaces: In Situ Nuclide Production Rates and Erosion Models. Earth Planet. Sci. Lett. 104, 424–439. doi:10.1016/0012-821x(91)90220-c
Langridge, R. M., Ries, W. F., Farrier, T., Barth, N. C., Khajavi, N., and De Pascale, G. P. (2014). Developing Sub 5-m LiDAR DEMs for Forested Sections of the Alpine and Hope Faults, South Island, New Zealand: Implications for Structural Interpretations. J. Struct. Geol. 64, 53–66. doi:10.1016/j.jsg.2013.11.007
Li, X., Li, C., Wesnousky, S. G., Zhang, P., Zheng, W., Pierce, I. K. D., et al. (2017). Paleoseismology and Slip Rate of the Western Tianjingshan Fault of NE Tibet, China. J. Asian Earth Sci. 146, 304–316. doi:10.1016/j.jseaes.2017.04.031
Liang, Z., Wei, Z., and Sun, W. (2021). Surface Slip Distribution and Earthquake Rupture Model of the Fuyun Fault, China, Based on High-Resolution Topographic Data. Lithosphere 2021 (Special 2), 7913554. doi:10.2113/2021/7913554
Lin, Z., Kaneda, H., Mukoyama, S., Asada, N., and Chiba, T. (2013). Detection of Subtle Tectonic-Geomorphic Features in Densely Forested Mountains by Very High-Resolution Airborne Lidar Survey. Geomorphology 182 (2), 104–115. doi:10.1016/j.geomorph.2012.11.001
Lohani, B., and Mason, D. C. (2001). Application of Airborne Scanning Laser Altimetry to the Study of Tidal Channel Geomorphology. ISPRS J. Photogrammetry Remote Sens. 56 (2), 100–120. doi:10.1016/S0924-2716(01)00041-7
Ma, J., Zhou, B., Wang, M., Guo, P., Liu, J., and Ha, G. (2022). Surface Rupture and Slip Distribution along the Zheduotang Fault in the Kangding Section of the Xianshuihe Fault Zone. Lithosphere 2021 (Special 2), 6500707. doi:10.2113/2022/6500707
MacMillan, R. A., Pettapiece, W. W., Nolan, S. C., and Goddard, T. W. (2000). A Generic Procedure for Automatically Segmenting Landforms into Landform Elements Using DEMs, Heuristic Rules and Fuzzy Logic. Fuzzy Sets Syst. 113, 81–109. doi:10.1016/s0165-0114(99)00014-7
Masoud, A., and Koike, K. (2006). Tectonic Architecture through Landsat-7 ETM+/SRTM DEMderived Lineaments and Relationship to the Hydrogeologic Setting in Siwa Region, NW Egypt. J. Afr. Earth Sci. 45 (4–5), 467–477. doi:10.1016/j.jafrearsci.2006.04.005
McGill, S. F., and Sieh, K. (1991). Surficial Offsets on the Central and Eastern Garlock Fault Associated with Prehistoric Earthquakes. J. Geophys. Res. 96 (B13), 21597–21621. doi:10.1029/91jb02030
Meigs, A. (2013). Active Tectonics and the LiDAR Revolution. Lithosphere 5 (2), 226–229. doi:10.1130/RF.L004.1
Molnar, P., Brown, E. T., Burchfiel, B. C., Deng, Q., Feng, X., Li, J., et al. (1994). Quaternary Climate Change and the Formation of River Terraces across Growing Anticlines on the North Flank of the Tien Shan, China. J. Geol. 102, 583–602. doi:10.1086/629700
Molnar, P., and Ghose, S. (2000). Seismic Moments of Major Earthquakes and the Rate of Shortening across the Tien Shan. Geophys. Res. Lett. 27 (16), 2377–2380. doi:10.1029/2000gl011637
Molnar, P., and Tapponnier, P. (1975). Cenozoic Tectonics of Asia: Effects of a Continental Collision: Features of Recent Continental Tectonics in Asia Can Be Interpreted as Results of the India-Eurasia Collision. Science 189, 419–426. doi:10.1126/science.189.4201.419
Nash, D. B. (1980). Morphologic Dating of Degraded Normal Fault Scarps. J. Geol. 88, 353–360. doi:10.1086/628513
Nissen, E., Krishnan, A. K., Arrowsmith, J. R., and Saripalli, S. (2012). Three-dimensional Surface Displacements and Rotations from Differencing Pre- and Post-earthquake Lidar Point Clouds. Geophys. Res. Lett. 39, L16301. doi:10.1029/2012gl052460
Nissen, E., Maruyama, T., Ramon Arrowsmith, J., Elliott, J. R., Krishnan, A. K., Oskin, M. E., et al. (2014). Coseismic Fault Zone Deformation Revealed with Differential Lidar: Examples from JapaneseMw∼7 Intraplate Earthquakes. Earth Planet. Sci. Lett. 405, 244–256. doi:10.1016/j.epsl.2014.08.031
Oskin, M. E., Arrowsmith, J. R., Corona, A. H., Elliott, A. J., Fletcher, J. M., Fielding, E. J., et al. (2012). Near-Field Deformation from the El Mayor-Cucapah Earthquake Revealed by Differential LIDAR. Science 335, 702–705705. doi:10.1126/science.1213778-
Ostaficzuk, S. R. (2005). The Current Role of Geological Mapping in Geosciences. Proc. NATO Adv. Res. Workshop Innovative Appl. GIS Geol. Cartogr. Kazimierz Dolny, Pol. , 56 Springer Science & Business Media, 24–26. doi:10.1007/1-4020-3551-9
Papanikolaou, I. D., Van Balen, R., Silva, P. G., and Reicherter, K. (2015). Geomorphology of Active Faulting and Seismic Hazard Assessment: New Tools and Future Challenges. Geomorphology 237, 1–13. doi:10.1016/j.geomorph.2015.02.024
Pierce, K. L., and Colman, S. M. (1986). Effect of Height and Orientation (Microclimate) on Geomorphic Degradation Rates and Processes, Late-Glacial Terrace Scarps in Central Idaho. Geol. Soc. Am. Bull. 97 (7), 869–885. doi:10.1130/0016-7606(1986)97<869:eohaom>2.0.co;2
Poisson, B., and Avouac, J. P. (2004). Holocene Hydrological Changes Inferred from Alluvial Stream Entrenchment in North Tian Shan (Northwestern China). J. Geol. 112, 231–249. doi:10.1086/381659
Prima, O. D. A., Echigo, A., Yokoyama, R., and Yoshida, T. (2006). Supervised Landform Classification of Northeast Honshu from DEM-Derived Thematic Maps. Geomorphology 78 (3–4), 373–386. doi:10.1016/j.geomorph.2006.02.005
Ren, G., Li, C., Wu, C., Zhang, H., Wang, S., Ren, Z., et al. (2021). Late Quaternary Slip Rate and Kinematics of the Baoertu Fault, Constrained by 10Be Exposure Ages of Displaced Surfaces within Eastern Tian Shan. Lithosphere 2021 (1), 7866920. doi:10.2113/2021/7866920
Ren, Z. K., Chen, T., Zhang, H. P., Zheng, W. J., and Zhang, P. Z. (2014). LiDAR Survey in Active Tectonics Studies: An Introduction and Overview. Acta Geol. Sin. 000 (006), 230–241. (in Chinese with an English abstract).
Ren, Z. K., Zhang, Z. Q., Chen, T., Yan, S. L., Yin, J. H., Zhang, P. Z., et al. (2015). Clustering of Offsets on the Haiyuan Fault and Their Relationship to Paleoearthquakes. Geol. Soc. Am. Bull. 128, 3–18. doi:10.1130/b31155.1
Ren, Z., Zielke, O., and Yu, J. (20182018). Active Tectonics in 4D High-Resolution. J. Struct. Geol. 117, 264–271. doi:10.1016/j.jsg.2018.09.015
Riebe, C. S., Kirchner, J. W., Granger, D. E., and Finkel, R. C. (2000). Erosional Equilibrium and Disequilibrium in the Sierra Nevada, Inferred from Cosmogenic 26Al and 10Be in Alluvial Sediment. Geology 28, 803–806. doi:10.1130/0091-7613(2000)028<0803:eeadit>2.3.co;2
Schaller, M., Von Blanckenburg, F., Hovius, N., and Kubik, P. W. (2001). Large-scale Erosion Rates from In Situ-produced Cosmogenic Nuclides in European River Sediments. Earth Planet. Sci. Lett. 188 (3), 441–458. doi:10.1016/s0012-821x(01)00320-x
Scharer, K. M., Biasi, G. P., Weldon, R. J., and Fumal, T. E. (2010). Quasi-periodic Recurrence of Large Earthquakes on the Southern San Andreas Fault. Geology 38 (6), 555–558. doi:10.1130/g30746.1
Shi, X., Yu, W., and Jing, L. Z. (2017). How Complex Is the 2016 Mw 7.8 Kaikoura Earthquake, South Island, New Zealand? Sci. Bull. 62 (005), 309–311. doi:10.1016/j.scib.2017.01.033
Smith, M. J., Rose, J., and Booth, S. (2006). Geomorphological Mapping of Glacial Landforms from Remotely Sensed Data: An Evaluation of the Principal Data Sources and an Assessment of Their Quality. Geomorphology 76, 148–165. doi:10.1016/j.geomorph.2005.11.001
Sobel, E., Chen, J., and Heermance, R. (2006). Late Oligocene-Early Miocene Initiation of Shortening in the Southwestern Chinese Tian Shan: Implications for Neogene Shortening Rate Variations. Earth Planet. Sci. Lett. 247, 70–81. doi:10.1016/j.epsl.2006.03.048
Suwandana, E., Kawamura, K., Sakuno, Y., Kustiyanto, E., and Raharjo, B. (2012). Evaluation of ASTER GDEM2 in Comparison with GDEM1, SRTM DEM and Topographic-Map-Derived DEM Using Inundation Area Analysis and RTK-dGPS Data. Remote Sens. 4, 2419–2431. doi:10.3390/rs4082419
Tapponnier, P., and Molnar, P. (1979). Active Faulting and Cenozoic Tectonics of the Tien Shan, Mongolia, and Baykal Regions. J. Geophys. Res. 84, 3425–3459. doi:10.1029/jb084ib07p03425
Vedder, J. G., and Wallance, R. E. (1970).Map Showing Recently Active Breaks along the San Andreas and Related Faults between Cholame Valley and Tejon Pass, California. Miscellanceous Geologic Inverstigations Map I-574. Washington, DC: Geological Survey.
Wallace, R. E. (1977). Profiles and Ages of Young Fault Scarps, North-Central Nevada. Geol. Soc. Am. Bull. 88 (9), 1267–1281. doi:10.1130/0016-7606(1977)88<1267:paaoyf>2.0.co;2
Wang, C. Y., Yang, Z. E., and Luo, H. (2004). Crustal Structure of the Northern Margin of the Eastern Tien Shan, China, and its Tectonic Implications for the 1906 M∼7.7 Manas Earthquake. Earth Planet. Sci. Lett. 223 (1-2), 187–202. doi:10.1016/j.epsl.2004.04.015
Wehr, A., and Lohr, U. (1999). Airborne Laser Scanning-An Introduction and Overview. ISPRS J. Photogrammetry Remote Sens. 54, 68–8282. doi:10.1016/s0924-2716(99)00011-8
Wei, Z., Arrowsmith, J. R., and He, H. (2015). Evaluating Fluvial Terrace Riser Degradation Using LiDAR-Derived Topography: An Example from the Northern Tian Shan, China. J. Asian Earth Sci. 105, 430–442. doi:10.1016/j.jseaes.2015.02.016
Wei, Z., He, H., Hao, H., and Gao, W. (2017). Automated Mapping of Landforms through the Application of Supervised Classification to lidAR-Derived DEMs and the Identification of Earthquake Ruptures. Int. J. Remote Sens. 38 (23), 7196–7219. doi:10.1080/01431161.2017.1372861
Wei, Z., He, H., Su, P., Zhuang, Q., and Sun, W. (2019). Investigating Paleoseismicity Using Fault Scarp Morphology of the Dushanzi Reverse Fault in the Northern Tian Shan, China. Geomorphology 327, 542–553. doi:10.1016/j.geomorph.2018.11.025
Wei, Z., He, H., Sun, W., Zhuang, Q., and Liang, Z. (2020). Investigating Thrust-Fault Growth and Segment Linkage Using Displacement Distribution Analysis in the Active Duzhanzi Thrust Fault Zone, Northern Tian Shan of China. J. Struct. Geol. 133, 103990. doi:10.1016/j.jsg.2020.103990
Wells, D. L., and Coppersmith, K. J. (1994). New Empirical Relationships Among Magnitude, Rupture Length, Rupture Width, Rupture Area, and Surface Displacement. Bull. Seismol. Soc. Am. 84 (4), 974–1002. doi:10.1007/BF00808290
Wilkinson, M., McCaffrey, K. J. W., Roberts, G., Cowie, P. A., Phillips, R. J., Michetti, A. M., et al. (2010). Partitioned Postseismic Deformation Associated with the 2009 Mw 6.3 L'Aquila Earthquake Surface Rupture Measured Using a Terrestrial Laser Scanner. Geophys. Res. Lett. 37, L10309. doi:10.1029/2010gl043099
Williams, M., Kuhn, W., and Painho, M. (2012). The Influence of Landscape Variation on Landform Categorization. J. Spatial Inf. Sci. 5, 51–73. doi:10.5311/josis.2012.5.107
Wu, C., Zheng, W., Zhang, P., Zhang, Z., Jia, Q., Yu, J., et al. (2019). Oblique Thrust of the Maidan Fault and Late Quaternary Tectonic Deformation in the Southwestern Tian Shan, Northwestern China. Tectonics 38, 2625–2645. doi:10.1029/2018TC005248
Xu, J., Arrowsmith, J. R., Chen, J., Schoenbohm, L. M., Li, T., Yuan, Z., et al. (20212021). Evaluating Young Fluvial Terrace Riser Degradation Using a Nonlinear Transport Model: Application to the Kongur Normal Fault in the Pamir, Northwest China. Earth Surf. Process. Landf. 46 (1), 280–295. doi:10.1002/esp.5022
Xu, X., Wen, X., Yu, G., Chen, G., Klinger, Y., Hubbard, J., et al. (2009). Coseismic Reverse- and Oblique-Slip Surface Faulting Generated by the 2008 Mw 7.9 Wenchuan Earthquake, China. Geology 37, 515–518. doi:10.1130/g25462a.1
Yang, X. P., Li, A., Huang, W. L., and Zhang, L. (2011). Paleoearthquake Events and Formation of River Terraces in Active Anticline Region, Northern Piedmont of Tian Shan Mountain, China. Seismol. Geol. 33 (4), 739–751. doi:10.3969/j.issn.0253-4967.2011.04.001
Yeats, R. S., Sieh, K. E., and Allen, C. R. (1997). The Geology of Earthquakes. New York: Oxford University Press, 568.
Yuan, X. X., Wang, X. Q., Dou, A. X., Dong, Y. F., Wang, L., and Jin, D. J. (2012). Terrestrial LiDAR-Based 3D Modeling Analysis of Surface Rupture Caused by Yushu Earthquake. Seismol. Geol. 34 (1), 39–46. (in Chinese). doi:10.3969/j.issn.0253-4967.2012.01.005
Yuan, Z., Li, T., Su, P., Sun, H., Ha, G., Guo, P., et al. (2022). Large Surface‐Rupture Gaps and Low Surface Fault Slip of the 2021 M W 7.4 Maduo Earthquake along a Low‐Activity Strike‐Slip Fault, Tibetan Plateau. Geophys. Res. Lett. 49, e2021GL096874. doi:10.1029/2021GL096874
Zhang, P., Ren, Z., Zheng, W., Liu, J., Sheng, C., Gan, W., et al. (2013). Illuminating the Active Haiyuan Fault, China by Airborne Light Detection and Ranging (In Chinese). Chin. Sci. Bull. 58, 41–45. doi:10.1360/972012-1526
Zhanyu, W., He, H., and Gao, W. (2014). Experimental Study on Geologic Mapping of Active Tectonics Based on Lidar Data - A Case of Dushanzi Anticline-Reverse Fault Zone in Xinjiang. (In Chinese). Seismol. Geol. 36 (3), 794–813. doi:10.3969/j.issn.0253-4967.2014.03.019
Zhou, L., Jing, L. Z., Weldon, R. J., Tian, J., Weldon, R. J., Weldon, R. J., et al. (2020). Modeling Repeated Coseismic Slip to Identify and Characterize Individual Earthquakes from Geomorphic Offsets on Strike-Slip Faults. Earth Planet. Sci. Lett. 545, 116313. doi:10.1016/j.epsl.2020.116313
Zhou, L., Liu-Zeng, J., and Ray, J. (2020). Weldon II, Jing Tian, Chao Ding, Yu DuModeling Repeated Coseismic Slip to Identify and Characterize Individual Earthquakes from Geomorphic Offsets on Strike-Slip Faults. Earth Planet. Sci. Lett. 545, 116313. doi:10.1016/j.epsl.2020.116313
Zhou, Y., Walker, R. T., Elliott, J. R., and Parsons, B. (2016). Mapping 3D Fault Geometry in Earthquakes Using High‐resolution Topography: Examples from the 2010 El Mayor‐Cucapah (Mexico) and 2013 Balochistan (Pakistan) Earthquakes. Geophys. Res. Lett. 43 (7), 3134–3142. doi:10.1002/2016gl067899
Zielke, O., and Arrowsmith, J. R. (2012). LaDiCaoz and LiDAR Imager: MATLAB GUIs for LiDAR Data Handling and Lateral Displacement Measurement. Geosphere 8 (1), 206–221. doi:10.1130/ges00686.1
Zielke, O., Arrowsmith, J. R., Grant Ludwig, L., and Akciz, S. O. (2012). High-Resolution Topography-Derived Offsets along the 1857 Fort Tejon Earthquake Rupture Trace, San Andreas Fault. Bull. Seismol. Soc. Am. 102, 1135–1154. doi:10.1785/0120110230
Zielke, O., Arrowsmith, J. R., Ludwig, L. G., and Akçiz, S. O. (2010). Slip in the 1857 and Earlier Large Earthquakes along the Carrizo Plain, San Andreas Fault. Science 327, 1119–1122. doi:10.1126/science.1182781
Keywords: high-resolution topography, LiDAR, active tectonics, earthquake, geomorphologic survey
Citation: Sun W, Wei Z, Sun H and He H (2022) Review on the Application of Airborne LiDAR in Active Tectonics of China: Dushanzi Reverse Fault in the Northern Tian Shan. Front. Earth Sci. 10:895758. doi: 10.3389/feart.2022.895758
Received: 14 March 2022; Accepted: 16 June 2022;
Published: 13 July 2022.
Edited by:
Maria-Teresa Ramirez-Herrera, National Autonomous University of Mexico, MexicoReviewed by:
Paula Marques Figueiredo, North Carolina State University, United StatesOlaf Zielke, King Abdullah University of Science and Technology, Saudi Arabia
Copyright © 2022 Sun, Wei, Sun and He. This is an open-access article distributed under the terms of the Creative Commons Attribution License (CC BY). The use, distribution or reproduction in other forums is permitted, provided the original author(s) and the copyright owner(s) are credited and that the original publication in this journal is cited, in accordance with accepted academic practice. No use, distribution or reproduction is permitted which does not comply with these terms.
*Correspondence: Zhanyu Wei, d2Vpemhhbnl1QGllcy5hYy5jbg==