 Simona Gabrielli1,2*
 Aybige Akinci1
 Guido Ventura1
 Ferdinando Napolitano3
 Edoardo Del Pezzo4,5
 Luca De Siena2,6
- 1Istituto Nazionale di Geofisica e Vulcanologia, Rome, Italy
- 2School of Geosciences, University of Aberdeen, Aberdeen, United Kingdom
- 3Dipartimento di Fisica “E.R. Caianiello”, Università degli Studi di Salerno, Fisciano, Italy
- 4Osservatorio Vesuviano, Istituto Nazionale di Geofisica e Vulcanologia, Napoli, Italy
- 5Istituto Andaluz de Geofisica, Universidad de Granada, Granada, Spain
- 6Institute of Geosciences, Johannes Gutenberg University, University of Mainz, Mainz, Germany
The Amatrice–Visso–Norcia seismic sequence struck Central Italy across the Apenninic normal fault system in 2016. Fluids likely triggered the sequence and reduced the stability of the fault network following the first earthquake (Amatrice, Mw 6.0), with their migration nucleating the Visso (Mw 5.9) and Norcia (Mw 6.5) mainshocks. However, both spatial extent and mechanisms of fluid migration and diffusion through the network remain unclear. High fluid content, enhanced permeability, and pervasive microcracking increase seismic attenuation, but different processes contribute to different attenuation mechanisms. Here, we measured and mapped peak delay time and coda attenuation, using them as proxies of seismic scattering and absorption before and during the sequence. We observed that the structural discontinuities and lithology control the scattering losses at all frequencies, with the highest scattering delineating carbonate formations within the Gran Sasso massif. The Monti Sibillini thrust marks the strongest contrasts in scattering, indicating a barrier for northward fracture propagation. Absorption does not show any sensitivity to the presence of these main geological structures. Before the sequence, low-frequency high-absorption anomalies distribute around the NW-SE-oriented Apennine Mountain chain. During the sequence, a high-absorption anomaly develops from SSE to NNW across the seismogenic zone but remains bounded north by the Monti Sibillini thrust. We attribute this spatial expansion to the deep migration of CO2-bearing fluids across the strike of the fault network from a deep source of trapped CO2 close to the Amatrice earthquake. Fluids expand SSE-NNW primarily during the Visso sequence and then diffuse across the fault zones during the Norcia sequence.
1 Introduction
Between August and October 2016, 25.600 earthquakes (0.1 < M < 6.5) struck the Central Apennine chain in Central Italy (Chiaraluce et al., 2017). Eight events had Mw > 5.0, with three mainshocks occurring near Amatrice (Mw 6.0, August 24, 2016), Visso (Mw 5.9, October 26, 2016), and Norcia (Mw 6.5, October 30, 2016). The Amatrice–Visso–Norcia sequence (AVN) developed on the NNW-SSE-trending normal fault systems of Mt. Vettore (north) and Mt. Gorzano (south), activating a 70 km × 10 km area trending parallel to the major axis of the Central Apennines (Improta et al., 2019) (Figure 1). The fault mechanisms were consistent with the extension of the Central Apennines, which coexists with the opening of the Tyrrhenian back-arc basin (Chiaraluce et al., 2017). Digital seismic networks were deployed immediately after the Amatrice earthquake, recording events with M > 0.1 and making the AVN the best-monitored earthquake sequence striking Italy. The AVN has been modeled as a cascading rupture triggered by fluids entering the fault systems (Walters et al., 2018). Multiple mainshock sequences are common features in the Apennines (Improta et al., 2019), as the 1980 Ms 6.9 of Irpinia (Bernard and Zollo, 1989), the 1997 Mw 6.0 of Umbria–Marche (Chiaraluce et al., 2004), the 2009 Mw 6.1 of L’Aquila (Valoroso et al., 2013), and the 2012 ML 5.0 of Pollino (De Matteis et al., 2021). This phenomenon is a consequence of the complex interactions between adjacent fault systems and triggering processes that include static and dynamic stress transfer between fault systems, pore pressure variations associated with fluid migration (Ventura and Di Giovambattista, 2013), and co-seismic release of a deep source of trapped CO2 (Miller et al., 2004; Chiarabba et al., 2009a; Malagnini et al., 2012).
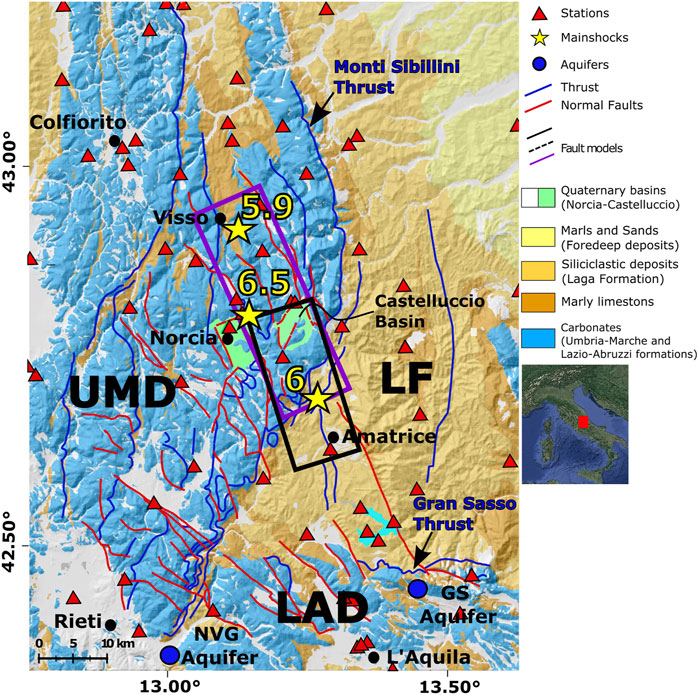
FIGURE 1. Simplified geological map of Central Italy (after Di Bucci et al., 2021). Blue: carbonates of the Umbria–Marche (UMD) and Lazio–Abruzzi (LAD) domains; yellow: foredeep domain (LF, Laga Formation). The seismic network used for the sequence period is represented with red triangles. Yellow stars correspond to the Amatrice (Mw 6), Visso (Mw 5.9), and Norcia (Mw 6.5) mainshocks. The black and purple boxes are the Mt. Gorzano (Amatrice) and Mt. Vettore (Norcia) fault planes, respectively. Blue circles are the Nuria–Velino–Giano (NVG) and Gran Sasso (GS) aquifers. The study area within the Italian Peninsula framework is shown in the inset on the right panel.
Waves attenuate due to scattering and absorption (Sato et al., 2012). The increase of seismic absorption relative to scattering losses and the frequency dependence of the attenuation measurements both support the inference of fluids permeating faults during the AVN (Akinci et al., 2020). The seismic waves yield energy when traveling through complex fluid-filled fault networks (Sketsiou et al., 2020). Seismic attenuation tomography has thus the potential to infer the effect of increased fluid content and migration. Chiarabba et al. (2009a) used P- and S-wave attenuation to track fluid migrations across the Central–Northern Apennine fault networks, identifying them as the driving mechanism of the cause of the 1997 Umbria–Marche seismic sequence (Mw 5.7 and 6.0). Sketsiou et al. (2020) imaged total attenuation across the Pollino range (Southern Italy), detecting two fluid reservoirs hosting fluids that laterally migrated at depth, producing the 2010–2014 Pollino seismic sequence (ML 4.3 and 5.0—Brozzetti et al. (2017) and references therein).
Scattering and absorption can be mapped in space using two seismic attributes:
1) The peak delay time, defined as the time difference between the S-wave arrival and the maximum amplitude of the event (Takahashi et al., 2007);
2) The attenuation of coda waves (Qc−1). Coda waves are wave-trains coming after the S-wave packet, and Qc quantifies the decay rate of the coda envelope with increasing lapse time from the origin time of the earthquake (Aki and Chouet, 1975).
At crustal-scale and in the far-field, the peak delay measures multiple forward scattering due to random inhomogeneities (Takahashi et al., 2007; Calvet et al., 2013). The Markov approximation (Saito et al., 2002) can model its variations in space and frequency at frequencies higher than 1.0 Hz. Takahashi et al. (2007) first used peak delay times to map volcanic areas in northeast Japan. High peak delays mark fractured volumes across the Pyrenees (Calvet et al., 2013), the eastern portion of the Siletz terrane in the Western US (De Siena et al., 2016), and the Vrancea region in Romania (Borleanu et al., 2017). Within fault networks, peak delay increases are visible at all frequencies when waves cross fractured geological volumes, as the carbonates of the Pollino seismic gap, in Southern Italy (Napolitano et al., 2020).
Single scattering, multiple scattering, and diffusion can model coda wave envelopes depending on frequency, lapse time, and scale of the heterogeneities encountered during propagation (Sato et al., 2012). Coda waves can enter the diffusive regime at late lapse times, where coda attenuation is theoretically equal to absorption (Qc ≈ Qi—Shapiro et al., 2000). Calvet and Margerin (2013) demonstrated that this assumption is valid for an onset time of the coda of 80 s and epicentral distances between 0 and 90 km across the Pyrenees. Qc−1 strongly depends on the frequency in active tectonic regions (Sato et al., 2012). At low frequencies, high Qc−1 anomalies map surface geology and sedimentary basins in the Pyrenees (Calvet et al., 2013), the Alps (Mayor et al., 2016), and Vrancea (Borleanu et al., 2017). At higher frequencies, the change in coda composition from surface to body waves can increase depth sensitivity (De Siena et al., 2016; Mayor et al., 2016; Gabrielli et al., 2020). This effect is dominant when measuring Qc−1 across volcanic structures, as documented along the Mount St. Helens volcano (US) where low-frequency waves allow to map the shallowest, most-heterogeneous volcanic structures, while deep feeding systems appear as high-Qc−1 anomalies at higher frequencies (De Siena et al., 2016; Gabrielli et al., 2020). Di Martino et al. (2022) recently obtained absorption maps using an active seismic experiment (∼100 m2 array with meter-scale station distance) at the Solfatara volcanic crater, in Southern Italy. This study demonstrates that absorption anomalies mark zones of high soil temperatures and CO2-bearing fluids migrating from an extended fault, whose features were reconstructed using peak delay maps.
High peak delays and high Qc−1 detect intrusions in mountain chains (Calvet et al., 2013) and magmatic systems (De Siena et al., 2016). These parameters are reliable markers of fluid-induced fracturing leading to earthquakes at the regional scale (Borleanu et al., 2017). In fault networks like those ruptured by the AVN, Napolitano et al. (2020) found that high-scattering and high-absorption patterns obtained by increasing frequencies map the migration of the historical seismic events from the 16th century until the Pollino seismic sequence. This work supported the view that lateral fluid diffusion drove the sequence (De Matteis et al., 2021; Napolitano et al., 2021). Focal mechanism tomography highlighted the excess of pore pressure in the hypocentral area, which affected the seismicity distribution during the seismic sequence (De Matteis et al., 2021). In the Alps, at low frequency, high-absorption regions correspond to Cenozoic and Mesozoic sedimentary basins (Mayor et al., 2016). The Qc−1 map of the western Tibet shows variations along the Karakoram fault, attributed to the heterogeneous crust, velocity variations, and mantle-derived fluids (Biswas and Singh, 2020).
However, the temporal potential of joint scattering and absorption mapping in fault networks is still unexplored.
This study measures and maps peak delays and Qc−1 in the 2D space. Due to the consistent spatial extent of the earthquakes, we repeat the mapping in time using data recorded:
1) Between 2013 and 2016 (hereafter, pre-sequence), before the first mainshock of August 24, 2016, Mw 6.0 Amatrice earthquake;
2) Between August 2016 and January 2017 (hereafter, sequence) using data from the entire AVN;
3) During three different periods starting from the three main shocks: Amatrice (August 24, 2016–October 26, 2016), Visso (October 26, 2016–October 30, 2016), and Norcia (October 30, 2016–January 18, 2017).
The results offer insight into fluid migration and expansion processes leading and controlling the seismic sequence using peak delay and coda attenuation as frequency-dependent proxies of scattering loss and absorption.
2 Geological and Seismological Background
The 2016 Central Italy seismic sequence started on August 24, 2016, with the Mw 6.0 Amatrice seismic event, at a depth of ∼8 km. Two months later, on October 26, 2016, this first mainshock was followed by the Mw 5.9 earthquake of Visso, ∼25 km northern of Amatrice and at a depth of ∼7 km. After 4 days, on October 30, the largest event of the sequence, Norcia (Mw 6.5), nucleated between Amatrice and Visso at a depth of ∼7.5 km. Overall, the seismic sequence lasted between August 2016 and January 2017, with more than ∼74,000 aftershocks, and covered a ∼70 km long, ∼10 km thick, and ∼8 km depth normal faulting system, also confirmed by the focal mechanisms of five Mw > 5, with a dip-slip motion striking N135°–N150° and with a dip of 45–55° toward SE (Chiaraluce et al., 2017; Brozzetti et al., 2019). The fault systems activated during the seismic sequence are the Mt. Vettore–Mt. Bove to the north and Mt. Gorzano to the south (Figure 1—Improta et al., 2019). The Norcia event is one of the strongest earthquakes recorded in Italy since the 1980 Mw 6.9 Irpinia earthquake and caused surface ruptures over an area >400 km2 (Villani et al., 2018).
The Central Apennine is governed by the opening of the back-arc Tyrrhenian basin to the west and the eastern migration of the compressive front associated with the lithospheric plate’s flexural retreat below the Italian peninsula (Malinverno & Ryan, 1986; Doglioni, 1991; Carminati et al., 2014). The western Tyrrhenian basin is marked by thin crust (<25 km), high heat (>200 mWm−2), and positive gravity anomalies. Most of the Quaternary volcanoes and geothermal areas (such as Larderello, Amiata, Campi Flegrei, and Vesuvius) are activated by the uprising of the mantle wedge between the Tyrrhenian Sea and the southwestern subducting Adriatic domain below the Apennines (Ventura et al., 2007). On the contrary, the Adriatic domain is characterized by low heat flow, negative gravity anomalies, and a crustal thickness of about 35 km (Carminati and Doglioni, 2012).
The Central Apennines were controlled by compressive tectonics (Galadini and Galli, 2000) up to Pleistocene times and later affected by an NE-SW extension. The Quaternary extension in the central sector of the chain is coeval with the eastward migration of the thrust fronts in the Adriatic foreland (Pizzi and Galadini, 2009). The NW-SE striking Central Apennine region is mainly composed of thrust sheets imbricated toward the Adriatic Sea (E-ENE direction) and creating a contact between the Meso-Cenozoic carbonate succession and the Miocenic flysch (Billi and Tiberti, 2009; Cosentino et al., 2010). The sequence of carbonate rocks and terrigenous units can be traced from the surface to an 8–10 km depth, moving from east to west (Billi and Tiberti (2009) and references therein). The Monti Sibillini thrust in the southern sector of the Umbrian Arc has an NNE-SSW trend. It is responsible for the overthrust of the Sabina Jurassic–Miocene pelagic sediments on the Lazio–Abruzzi carbonate platform (Billi and Tiberti, 2009). The Laga Formation (consisting of Messinian siliciclastic foredeep deposits) overlies both the Triassic–Miocene shallow water carbonates of the Lazio–Abruzzi platform and the Umbria–Marche pelagic successions (Figure 1) (Cosentino et al., 2010; Scisciani et al., 2014; Di Bucci et al., 2021, and references therein).
Further east, the contact between the Laga Formation and the carbonate platform coincides with the E-W thrust of the Gran Sasso massif, bounded by the Monti Sibillini thrust to the west (Billi and Tiberti, 2009). Large intermountain basins as those of Amatrice, Norcia, and Castelluccio are filled by Plio-Quaternary continental sediments (Figure 1). They formed in response to the activity of Plio-Quaternary NW-SE striking normal faults dissecting the Apennine chain and partly reactivating the pre-existing, older thrusts (Buttinelli et al., 2018; Scognamiglio et al., 2018; Improta et al., 2019, and references therein).
Seismicity in the Apennines concentrates along the chain axis and manifests itself through swarms and sequences with events of magnitudes up to 7 and depths shallower than 10–15 km (Chiarabba et al., 2005; Chiaraluce et al., 2004, 2017). The mainshocks have dip-slip, normal focal mechanisms consistent with ruptures along NW-SE striking fault planes moving in response to an NE-SW extension (Montone and Mariucci, 2016; Buttinelli et al., 2018; Scognamiglio et al., 2018). Although some mainshocks nucleate in the crystalline basement underlying the chain at about 10 km depth, there are records of earthquakes in the overlying carbonates and sedimentary sequences (Chiaraluce et al., 2017; Buttinelli et al., 2018). Although the seismicity of Apennines is related to the extensional tectonics affecting the chain from Plio-Pleistocene times, the release of deep-derived, CO2-rich fluids has been proposed as a possible concurrent triggering mechanism of earthquakes (Miller et al., 2004; Di Luccio et al., 2010; Malagnini et al., 2012; Chiodini et al., 2004, 2020). Chiodini et al. (2020) showed a record of 10 years (2009–2018) of tectonic CO2 release temporally correlated with the number and energy of earthquakes in the Central Apennines (Italy), where devastating historical earthquakes (such as the 1461 event of L’Aquila, the 1703 event of Norcia–Montereale–L’Aquila, and the 1915 Mw 7.0 event of Avezzano) occurred. Chiaraluce et al. (2007) and Collettini et al. (2008) reported over-pressurized fluids in the deep wells of San Donato and Santo Stefano in the Apennines. Miller et al. (2004) proposed that the 1997 Colfiorito aftershocks were caused by a co-seismic release of trapped high-pressure CO2. Chiarabba et al. (2009b) observed high Vp/Vs during the foreshocks and aftershocks of the L’Aquila 2009 sequence (Mw 6.1), suggesting high pore pressure and fluid storage zones at depth. Malagnini et al. (2012) and Di Luccio et al. (2010) showed the diffusion of fluids and pore fluid pressure variations during the L’Aquila earthquake through the spatial and temporal evolution of seismicity.
In the Apennines, earthquakes with M > 6.0 often rupture the surface, so fluids circulating in the shallower crust can rise and interact with the fault zones (Amoruso et al., 2011; Doglioni et al., 2014). The Central Apennines host large aquifers in the carbonate formations, such as the Gran Sasso (Amoruso et al., 2011) and Nuria–Velino–Giano (Devoti et al., 2018) aquifers. The Gran Sasso aquifer registered short- and mid-term changes in groundwater hydrodynamics (Amoruso et al., 2011) after the 2009 L’Aquila seismic event. The Gran Sasso aquifer extends 700 km2, bounded by the Laga Formation to the north and east and by low-permeability alluvial deposits to the west and south. The perennial groundwater reserves in this aquifer are estimated in the order of 1010 m3, with a mean thickness of 1 km (Amoruso et al. (2011) and references therein). The 2016 Amatrice–Norcia seismic sequence generated an uplift of the water level near Gran Sasso (∼1.8 m; Devoti et al., 2018) and 100 km away from the mainshock area (up to 80 cm; Barberio et al., 2017). The Mounts Nuria–Velino–Giano hydrological complex is located ∼40 km southwest of the Gran Sasso aquifer and has an outcropping area of about 1,000 km2 (Boni et al., 1987; Chiodini et al., 2011). It is bordered by low-permeability deposits (Cretaceous–Pliocene flysch formations) and the Mt. Sibillini thrust (Boni et al., 1987; Chiodini et al., 2011). Chiodini et al. (2011) performed a hydrogeochemical study of the Gran Sasso and Nuria–Velino–Giano aquifers to investigate the existence of a deep CO2 source in the epicentral area of the 2009 L’Aquila seismic sequence. Both aquifers showed an increased influx of fluids rich in deep CO2 before and during the seismic sequence. Thus, deep high-pressure gas traps played a role in triggering the L’Aquila seismic sequence, as previously modeled for the Colfiorito seismic event (Miller et al., 2004). Tomography images suggest that such traps occur at the base of the Apennine seismogenic layer, i.e., at the boundary between the upper and the lower crust at 10–15 km depth (Chiarabba et al., 2020a).
The AVN sector of the Central Apennines is ∼30 km north of the L’Aquila area and ∼50 km south of the hypocenter of 1997 Mw 6.0 Umbria–Marche seismic sequence. The seismicity of this sector is associated with the Mt. Vettore normal fault systems and the Mt. Gorzano fault (Monti della Laga fault system) (Buttinelli et al., 2018; Brozzetti et al., 2019; Carminati et al., 2020). The AVN ruptures fill the seismic gap between the 1997–98 Colfiorito (Chiaraluce et al., 2004) and 2009 L’Aquila seismic sequences (Chiaraluce et al., 2011).
3 Materials and Methods
3.1 Seismic Dataset
In the present study, we used a large set of seismograms merging weak- and strong-motion data from the AVN using earthquakes with magnitudes between 2.8 and 6.5. We selected earthquakes having a maximum depth of 20 km, keeping source–station distance within 100 km.
Strong ground motion data were registered by the accelerometric stations of the Italian Strong Motion Network (RAN). Broadband weak-motion seismological stations are part of the Digital Seismic Network run by Istituto Nazionale di Geofisica e Vulcanologia. The weak- and strong-motion accelerograms were downloaded from the ITalian ACcelerometric Archive (ITACA) website, the European Strong Motion (ESM) database, and the European Integrated Data Archive (EIDA) repository. The strong ground motion network is equipped with a three-component Kinemetrics EpiSensor (FBA-3200 Hz) with a full-scale range of 1 or 2 g, combined with ETNA 18 bits or K2-Makalu 24 bits digitizers. The weak-motion seismograms are corrected for instrument response. All the stations that registered only one seismic event were removed. The waveforms with P-wave travel times higher than 35 s were discarded from the database to constrain their propagation within the crust. Waveforms with spikes, telemetry gaps, and wave arrivals in the coda of the horizontal components of ground motion were manually removed. The dataset comprises seismograms with a signal-to-noise ratio (SNR) of the selected coda window higher than three. To estimate the noise level, a 3 s time window is considered before the P-wave arrival. The P- and S-wave arrivals were picked manually on each seismogram of the final dataset.
The final dataset comprises ∼3,200 waveforms for the pre-sequence (Figure 2A) recorded at 40 seismic stations and ∼13,600 recorded at 154 seismic stations (Figure 2B) for the AVN. The number of waveforms for the Qc−1 measurements decreased to ∼1,200 recorded at 39 stations for the pre-sequence and ∼5,800 recorded at ∼141 stations for the AVN due to the signal-to-noise selection. The number of stations working during the sequence is almost four times larger than the one recorded during the pre-sequence due to a temporary seismic network deployment just after the Amatrice mainshock of August 24. We selected similar locations of events and source–station pairs considering the expected resolution of our final maps to carry out an appropriate comparison of the analyses of the two datasets in different periods. In the following sections, we investigated and demonstrated that the location of source–station pairs or difference in the network configuration densified during the sequence does not significantly impact the spatial pattern of scattering and absorption in the studied area.
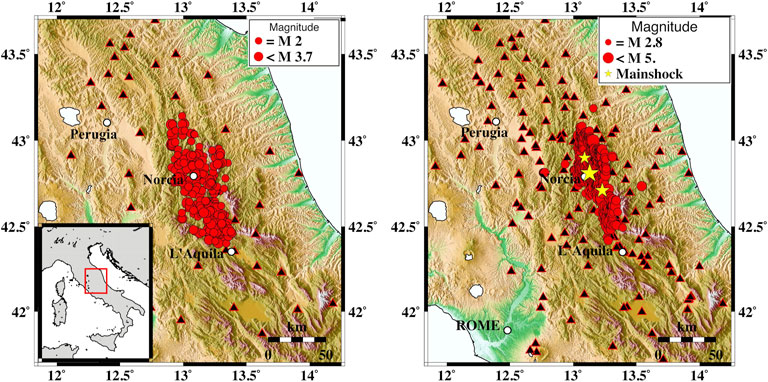
FIGURE 2. Dataset used for the analysis and the seismic network for the pre-sequence (left) and the Amatrice–Visso–Norcia sequence (right). Black triangles represent the stations; red circles represent the seismic events; stars indicate the main events (Amatrice–Visso–Norcia) of the 2016–2017 seismic sequence. The study area is in the lower-left panel in the Italian Peninsula framework.
The final AVN dataset was further divided into three time periods, each following a mainshock recorded in 2016:
1) Amatrice sequence, comprising ∼3,600 waveforms recorded between August 24 and October 25, 2016 (∼2040 after the SNR selection),
2) Visso sequence, comprising ∼1,600 waveforms recorded between October 26 and October 29, 2016 (∼600 after the SNR selection),
3) Norcia sequence, comprising ∼8,500 waveforms recorded between October 30 and January 18, 2017 (∼3,200 after the SNR selection).
Our study covers an area of 200 km × 220 km (lon: 11.85°–14.25°; lat: 41.7°–43.7°), and it is divided into regularly spaced nodes. The seismograms were filtered with a band-pass Butterworth filter (fourth order), forward and backward, in four frequency bands (1–2 Hz, 2–4 Hz, 4–8 Hz, and 8–16 Hz) centered at a frequency (fc) equal to 1.5, 3, 6, and 12 Hz. A Hilbert transform has been applied to compute the envelopes, which were then smoothed with a moving window of duration eight times the central frequency’s inverse.
The open-access code MuRAT, previously applied in volcanic (De Siena et al., 2016, De Siena et al., 2017; Gabrielli et al., 2020; Di Martino et al., 2022) and tectonic settings (Borleanu et al., 2017; Napolitano et al., 2020), is used to perform all the analyses. The code is applied to datasets spanning five time frames: the pre-sequence (2013–2016), the AVN, and the three sub-sequences after the mainshocks (from August 24, 2016, to January 18, 2017). Peak delay and Qc−1 parameters mapped in space using the MuRAT computer codes are then mapped using the Generic Mapping Tool, GMT (Wessel and Smith, 1998), and interpreted separately in their parameter space in the following sections.
3.2 Peak Delay Measurements and Mapping
Seismic waves broaden in heterogeneous media due to multiple forward scattering, with scattering attenuation affecting the earlier parts of seismic envelopes (Zhang et al., 2021). The delay between the S-wave onset and the maximum of the envelope, which increases with the source–receiver distance, is thus a proven marker of scattering attenuation (Takahashi et al., 2007; Calvet and Margerin, 2013). The dependence of the peak delay times (tPD(r), in seconds) on hypocentral distances (RHypo, in km) is expressed by
where A(f) and B(f) are the coefficients of the resulting linear fit (Gusev and Abubakirov, 1999).
We selected seismograms with an RHypo between 20 and 100 km and calculated empirical peak delay times against hypocentral distances in logarithmic scale for four frequency bands since the envelope broadening for waveforms close to the source (RHypo < 20 km) may be caused by the source duration and prevails over scattering effects (Takahashi et al., 2007). Measured peak delay times over the E-W horizontal component of the seismograms (black circles) and their dependence on hypocentral distances are presented for the frequency band 1–2 Hz in Figure 3 for all sequences analyzed in our study. While peak delays show significant scattering, they exhibit a linear trend and increase with distance. Red lines in Figure 3 mark the linear regression lines of peak delay times against hypocentral distance in the frequency band 1–2 Hz, which can be characterized as the theoretical peak delay manner. The difference between the measured peak delay time of the ith waveform
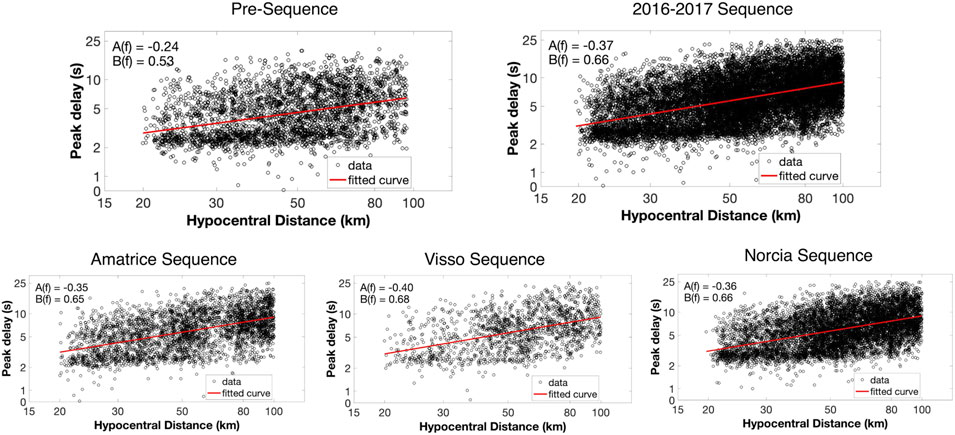
FIGURE 3. Log–log plot of peak delay (s) as a function of the hypocentral distances (km) for the pre-sequence, 2016–2017 sequence, and single sequences at 1.5 Hz. The red solid line represents the best linear fit for the peak delay measurement (black circles). A(f) and B(f) are the coefficients of the best linear fit.
Positive values of
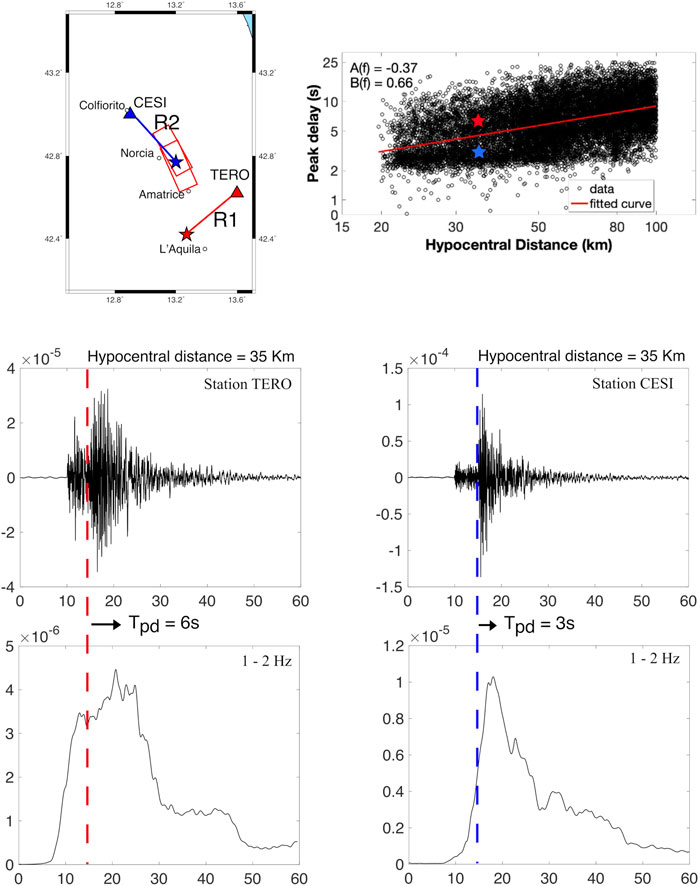
FIGURE 4. Example of E-W component velocity seismograms recorded at CESI and TERO stations at the exact hypocentral distances, 35 km (top and middle panels), and their smoothing root-mean-square envelopes in the 1–2 Hz band (bottom panels). The vertical blue and red dashed lines display the S-wave onset, and the horizontal black arrow expresses the peak delay time.
Peak delays thus indicate the presence of scattering in the rock volumes encompassed by the propagation of the primary shear waves. The size of such volumes depends on the wavelength and on the amount of scattering and should be estimated by appropriate sensitivity kernels. The assumption of a source–receiver sensitivity “on ray” produces a large underestimation of the size of these volumes, which in reality are larger than those associated with the primary waves, sometimes named “banana-doughnut” (Nolet, 2008). This on the one hand makes the space sensitivity of peak delay imaging lower than that of travel time imaging but on the other hand should reduce the bias introduced by changing the input data in the ordinary travel time and attenuation tomography. We are thus confident that peak delay mapping produces estimates of the true scattering attenuation patterns which should be more stable and robust than those obtained using ordinary methods.
To quantitatively portray the observed spatial variation in peak delay times at stations, we mapped the logarithmic deviation of S-wave peak delay time, assuming source–receiver sensitivity on rays and using a standard regionalization approach. We divided the study region into many small blocks of different sizes horizontally and in depth. So, we considered the spatial variation of medium heterogeneities by assigning the averaged value of
We performed several tests on the peak delay parameter and its sensitivity and variability to the location of source–station pairs or the network configurations, number of ray paths, and block size to select appropriate parameters and support our results’ resolutions in space and time. First, we divided the study area into 15 × 15 and 30 × 30 blocks, of which the size is 0.12° × 0.12° and 0.06° × 0.06° horizontally and 20 km in depth. We then changed the minimum number of ray paths that travel each block from at least 10 to 20 and more ray paths. We observed that both the grid size and the number of ray paths selected seem to have a negligible impact on its spatial pattern in the study region. The detailed presentations of these results can be found in the supplementary material in Supplementary Figure S1.
In addition, to investigate the peak delay parameter variation in depth, we split the Norcia dataset into two subsets: one between 0 and 5 km depth (∼4,000 waveforms) and a second between 6 and 18 km depth (∼3,500 waveforms), and compare the peak delay spatial variations from the two different datasets to investigate potential differences in the depth extent of the seismicity in different phases (Supplementary Figure S2). We stress that these events have been relocalized by Waldhauser et al. (2021). The results show minimal differences in peak delay mapping between the two datasets.
Finally, the station variability between the events registered during the pre-sequence and sequence is also examined in this section. To do so, we selected the same dataset of Norcia and reorganized the events recorded by the 40 stations of the pre-sequence and the 154 stations of the entire sequence. We compared the spatial distribution of peak delay determined from different databases, decreasing 20% of the primarily selected events recorded during the sequence. However, Supplementary Figure S3 reveals how the peculiarities of peak delay are nearly identical in the two maps and qualify the robustness of our results and comparisons accomplished in space and time.
We also analyzed peak delay distributions during the Norcia sequence for the three components of motions at all the frequencies to study possible alterations that the anisotropy may cause. In Supplementary Figure S4, we compare the distribution of logarithmic deviation of S-wave peak delay time
We prepared our final maps for detailed and better visualization of peak delay variation in the area by dividing the study area into 30 × 30 regularly spaced nodes and considering at least ten ray paths that travel each block. Supplementary Figure S5 shows the hit count maps where the blocks crossed by ten or more ray paths are colored in black for the pre-sequence, 2016–2017 sequence, and three sub-sequence datasets. Since our study focuses primarily on 2D spatial variation of S-waves’ peak delay time, we considered all events to have depths between 0 and 20 km, entirely within the crust above the Moho, with no depth dependence for the resultant peak delay mapping. The results obtained based on the preferred parameters are given and discussed in Section 4.1 and Section 5.1 in detail.
3.3 Coda Attenuation Measurements and Mapping
The latter part of a seismogram is primarily sensitive to seismic absorption (Zhang et al., 2021). Aki and Chouet (1975) showed that the power spectral energy density (E(t,f)) is a function of the lapse time from the earthquake’s origin time (t):
where S(f) includes both source and site terms and Qc−1 is the frequency-dependent inverse coda quality factor. α is equal to 3/2 if propagation is constrained within a single layer characterized by an anisotropic multiple scattering regime (Paasschens, 1997; Calvet et al., 2013). Qc−1 is computed by linearizing Eq. 3. The linearization is computationally faster than non-linear grid-search algorithms (e.g., Napolitano et al., 2020). The two approaches provide equivalent results when the signal-to-noise ratio is higher than three and for coda windows longer than 10 s (Sketsiou et al. (2020) and references therein).
Taking the logarithm of Eq. 3 and rearranging the terms, we can measure Qc−1 using a straight-line fitting:
The Qc−1 analysis window starts at twice the arrival time of the S-wave arrival (tS) and lasts 20 s (length of the coda window), meaning that the central coda lapse time is on average higher than 3tS. To assess if this lapse time is sufficient to consider the waveforms as late coda, we determined the mean free time (MFT) considering the values of B0 and Le−1 previously calculated by Akinci et al. (2020) through the multi-lapse time window analysis (MLTWA). Having the scattering coefficient ηs = B0/Le, the mean free path (MFP) = 1/ηs, and MFT = MTP/Vs, we obtained a value of MFT = 9.8 s for 1.5 Hz and MFT = 26 s for 6.0 Hz. In the calculation, we assumed an average S-wave velocity in the crust of Vs = 3.5 km s−1. The average S-wave arrival time of the dataset is 39 s, with a minimum of 8 s and a maximum of 65 s: a coda window starting at 2tS thus contains primarily diffuse waves, allowing us to interpret Qc as a marker of absorption. The MFT can be calculated with more accuracy using the code Qopen (Eulenfeld and Wegler, 2016), which separates intrinsic and scattering attenuation for each event and station by envelope inversion. However, the comparison between Qopen and the MLTWA made by van Laaten et al. (2021) shows that both methods give the same values within their error bars.
Figure 5 shows source–station measurements (black dots) and fitted (red line) Qc−1 obtained using the AVN dataset at two filtered frequency bands of 1–2 Hz and 4–8 Hz. It recalls the selected lapse time and epicentral distances and demonstrates that Qc−1 is almost independent and stable in the preferred distance between 20 and 100 km. This selection and trend are essential to enable the physical understanding of Qc, where its estimation is not interfered with by the transient regime emerging at shorter lapse times. Finally, to image seismic absorption in the 2D space, we applied an inversion scheme (De Siena et al., 2017) based on sensitivity kernel functions valid in the multiple scattering regime (Del Pezzo et al., 2018, Pacheco and Snieder, 2005—see Supplementary Figure S6). We discuss the uncertainties relative to the onset of diffusion, the theoretical background, and assumptions behind the use of coda sensitivity kernels, the inversion strategy, and resolution tests in the Supplementary Material Text and Supplementary Figures S7, S8, S9.
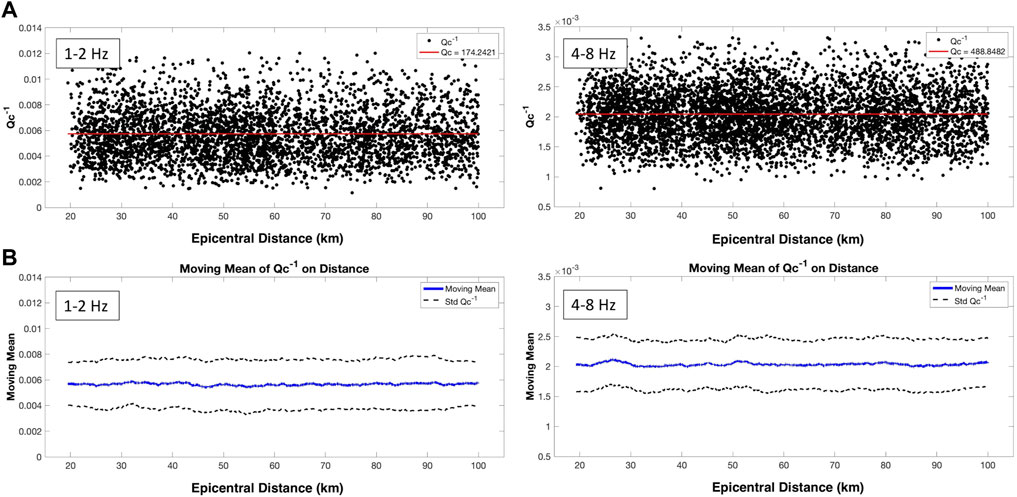
FIGURE 5. (A) Qc−1 as a function of epicentral distance at fc = 1.5 and 6 Hz in the Central Apennines obtained from the 2016–2017 dataset. The length of the coda window is fixed to 20 s, and its onset time starts at twice the arrival time of the S-wave arrival, 2tS. (A) Black dots are for each waveform obtained from the linear approach approximation in Eq. 4. The red line represents the average Qc−1. (B) The blue line is the moving mean of the Qc−1 in (A), the black lines are its standard deviation.
In addition, in this section, we presented results from several potential sources of variability included in the data, such as the difference in the network configuration, which was densified during the sequence. We used the same dataset of Norcia applying the identical criteria adopted previously for the peak delay parameter: considering events recorded by 1) the 40 stations of the pre-sequence and 2) the 154 stations of the entire sequence in our analysis. This process caused a decrease of waveforms from 3,200 to 2,300. However, Supplementary Figure S10 shows how the anomalies are essentially the same, allowing us to continue comparing the two time periods without excluding the temporary stations of the AVN dataset.
The depth variability of Qc−1 is also given in Supplementary Figure S11 from earthquakes distributed primarily across the seismogenic area, between 42.6° and 43° lat, for both the depth subdivisions. The seismogenic areas are dominated by a high attenuation anomaly, which appears more concentrated at higher depths rather than in the surficial dataset (Supplementary Figure S11). This behavior can be ascribed to a more fractured shallow crust and a more compact and less fractured deep crust. Nevertheless, high coda attenuation is still focused in the central area independently of depth, so we excluded a dependence on the earthquake depth variations in this study.
4 Results
The results are shown between 12.5°E–13.7°E and 42.15°N–43.48°N for the peak delay spatial variation and between 12.7°E–13.52°E and 42.37°N–43.48°N for the Qc−1 spatial distribution, as a zoom of the earthquake-damaged and the fractured area in Figures 2A,B. Areas of high resolution for peak delays and Qc−1 are defined using hit counts (Supplementary Figure S5) and the results of the checkerboard tests (Supplementary Figures S8, S9), respectively. We presented the individual spatial variations of peak delay and Qc−1 using different sets of maps. The final results and interpretations focus on how the scattering and absorption parameters vary in time and space in the study area.
4.1 Spatial Variations of Peak Delays
Figure 6 shows the spatial variations of the peak delay parameter (scattering losses, as defined in Eq. 2) obtained at 1.5 Hz for the pre-sequence, the AVN, and the three sub-sequences. The final peak delay maps are frequency-dependent and assume no dependence on depth, thus mapping heterogeneities of different dimensions. The earthquake dataset is entirely within the crust, between 0 and 20 km depth, so above the Moho (∼35–40 km depth, Piana Agostinetti, and Amato, 2009), and the wave propagation is constrained above the primary horizontal interface. The maps show the absolute value of the frequency-dependent peak delay,
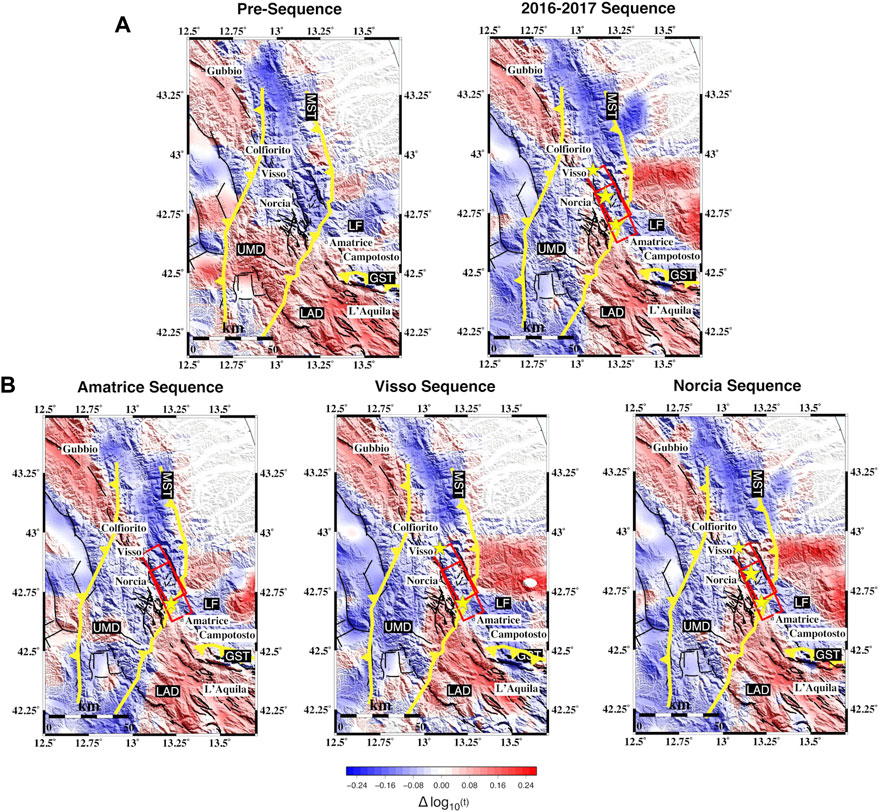
FIGURE 6. Spatial and temporal variation of peak delay at fc = 1.5 Hz over the (A) pre-sequence and 2016–2017 sequence and (B) three individual sequence time frames. Red boxes are the fault plane for the Amatrice and Norcia earthquakes, and black lines are the faults from the ITHACA catalog. Yellow lines are the main thrust of the area. The stars indicate the mainshocks of each 2016–2017 sequence. The maps have been restricted to the area of interest. The main geological features are highlighted: LF, Laga Formation; UMD, Umbria–Marche domain; LAD, Lazio–Abruzzi domain; MST, Monti Sibillini thrust; GST, Gran Sasso thrust.
We observed variations in scattering attenuation over different periods. During the pre-sequence, the location of the Colfiorito earthquake of 1997 in the northernmost portion of the maps is predominantly low scattering. High-scattering attenuation characterizes the area during the Amatrice and Visso sequences, and the area becomes progressively low scattering during the Norcia sequence. This area is delimited to the south parallel to the Monti Sibillini thrust (MST) (Figures 1, 6). Before the Amatrice earthquake, the area intersected by the AVN was marked by low-scattering values. During the Amatrice sequence, the southeastern part of the epicentral area becomes a low-scattering region, while scattering increases northwest. In general, scattering losses increase and expand toward the epicentral area during the AVN. This behavior is evident when comparing the pre-sequence with the entire AVN (Figure 6A). The low-scattering anomalies progressively reach the southwestern patch of the Amatrice fault rupture area, spreading across the dense fault network west of Norcia during the Visso and Norcia sequences (Figure 6B). At higher frequencies, a high-scattering anomaly appears west of the mountain range (Supplementary Figures S12, S13, S14).
4.2 Average and Spatially Varying Qc−1
We report the frequency-dependent average Qc−1 and their relative standard deviation for the pre-sequence and the AVN datasets in Table 1. These values are obtained from the best fit line of Eq. 4. Qc−1 decreases with frequency, as expected in tectonically active regions (de Lorenzo et al., 2013; Akinci et al., 2020). Assuming a frequency-dependence given by Qc−1 = Q0−1f−η, Qc−1=(0.0075 ± 0.0005)f(−0.73±0.05) for the pre-sequence and Qc−1=(0.0078 ± 0.0006)f(−0.75±0.06) for the AVN. While these values are comparable with those reported across the Apennines (de Lorenzo et al., 2013; Sketsiou et al., 2020), the frequency-dependent η parameter is at the upper limit of the range found by de Lorenzo et al. (2013) for the Central Apennines (0.65–0.75). In the assumption that Qc−1 = Qi−1 at late lapse time (Calvet and Margerin, 2013), we compare the results of Table 1 with the Qi calculated with the MLTWA by Akinci et al. (2020), who estimated Qi(f) = (110 ± 13)f(0.9±0.2). Both Q0 and η are within the uncertainties obtained with our method: Qc(f) = (128 ± 10)f(0.75±0.06).
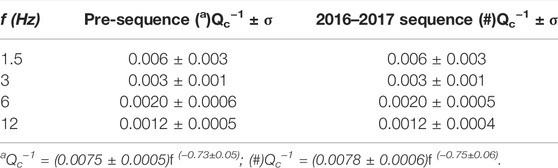
TABLE 1. Qc−1 for the two main datasets, with their associated standard deviation σ, was obtained from linear regression (Figure 5) at each frequency band. a and # are the dependence of Qc−1 vs frequency for the pre-sequence and 2016–2017 sequence, respectively.
Figure 7 presents the spatial distribution of Qc−1 at 1.5 Hz obtained over the five periods. The average Qc−1 decreases with increasing frequency using all datasets, showing more intense spatial variations at lower frequencies. The maximum Qc−1 values are 0.011 at 1.5 Hz and 0.003 at 12 Hz. At lower and intermediate frequencies (1.5–3 Hz), there is a clear difference in the anomaly patterns between the pre-sequence and the 2016–2017 dataset and the individual seismic sequences (Figure 7 and Supplementary Figure S15). High-absorption anomalies are widespread before the Amatrice mainshock and focus on the fault zones during the AVN. The L’Aquila–Gran Sasso sector, GST, shows a drastic decrease in attenuation during the AVN. High absorption concentrates on the lower fault plane during the pre-sequence, shifting further north after the Amatrice mainshock (red rectangles in Figure 7). High absorption marks the dense fault network south of Norcia and the fault planes after the Visso mainshock. After the Norcia mainshock, the NNW-SSE-trending high-absorption anomaly expands across the Central Apennine range, bounded north and south by the Monti Sibillini thrust (MST) and Gran Sasso thrust (GST), respectively. The dense fault network south of Norcia shows a substantial absorption decrease at the end of the AVN compared to the Amatrice and Visso periods. We identify a similar trend at high frequencies (3, 6, and 12 Hz), with a more focused high anomaly during each seismic sequence (Supplementary Figures S15, S16, S17).
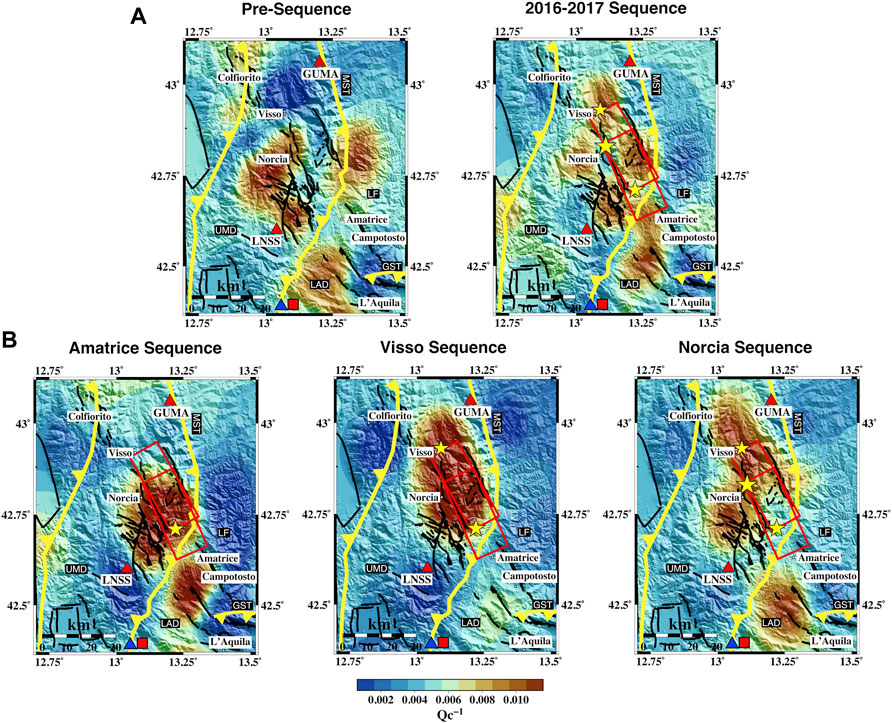
FIGURE 7. Spatial variation of Qc−1 at fc = 1.5 Hz for the (A) pre-sequence and 2016–2017 sequence and (B) three individual sequence time frames. Red boxes are the fault plane activated during the AVN, and the black lines are the fault lines from the ITHACA catalog. Yellow lines are the main thrust of the area. The main thrusts are highlighted: MST, Monti Sibillini thrust; GST, Gran Sasso thrust. The red square and the blue triangle are the Velino and Canetra springs’ locations, respectively. The stars indicate the mainshocks of each 2016–2017 sequence. The maps have been restricted to the area of interest covered by the checkerboard tests.
4.2.1 Analysis for the Temporal Evaluation of the Qc−1 Parameter
To demonstrate the robustness of our interpretation of temporal evaluation of absorption at a smaller scale and to examine the distribution of the anomalies as a function of time, we divided the Norcia dataset into two subsets: the first subset between October 30 and November 7, 2016, and the second between November 7, 2016, and January 18, 2017. Each dataset contains 245 events.
As demonstrated in Figure 8, the distribution of the earthquakes between the two datasets is similar, apart from the southernmost area, more covered by the events during the second subsequence (below 42.6° lat). The locations of the absorption pattern anomalies are different between the first and the second subset of the dataset and change with time, even during the Norcia sequence. This analysis reveals that coda attenuation evolves in the seismogenic zones independently of earthquake distribution, allowing us to interpret the maps in terms of temporal processes. This is expected as coda waves become progressively independent of source–station locations at late lapse times.
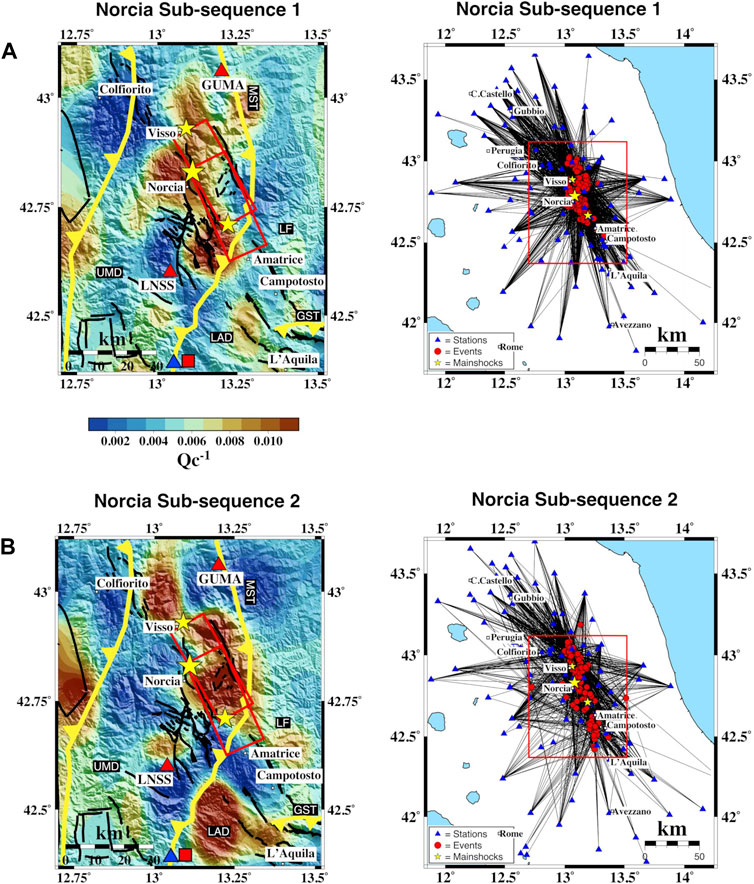
FIGURE 8. Spatial variation of Qc−1 at fc = 1.5 Hz for (A) Norcia Subsequence-1 and (B) Subsequence-2. Red boxes on the left are the fault plane activated during the AVN, and the black lines are the fault lines from the ITHACA catalog. Yellow lines are the main thrust of the area. The main thrusts are highlighted: MST, Monti Sibillini thrust; GST, Gran Sasso thrust. The red square and the blue triangle are the Velino and Canetra springs’ locations, respectively. The stars indicate the 2016–2017 mainshock. On the right, blue triangles are the seismic stations and red circles are the seismic events. Red boxes show the restricted area on the left.
Other than mapping inverted Qc−1 value deviation in time and space, we also compared the averaged Qc−1 at two seismic stations (GUMA and LNSS) located in the northern and southern sections of the ruptured fault area, respectively, where substantial changes in absorption were found between January 2013 and 2017. In Figure 9, we plot averaged Qc−1 values calculated at two stations together with the magnitude of the seismic events of our dataset during the same period and the deeply derived carbon (Cdeep) at the Canetra spring and the dissolved CO2 in the groundwaters of the Velino aquifer (FCO2), both measured by Chiodini et al. (2020). Figure 9A denotes an apparent change of absorption before and after the mainshock of Amatrice, while Figure 9B better highlights these changes during the sequence period. During the pre-sequence (from January 2013 to August 2016), absorption fluctuates between 0.0050 and 0.0070 at both stations (Figure 9A). However, it varies more rapidly and significantly (between 0.0035 and 0.0080) during the sequence period (approximately 5 months) (Figure 9B). Although the most abrupt changes in absorption correspond to the three mainshocks (quick drops and peaks), the general trend is different at two stations, decreasing or increasing over the whole time of the sequence. Notably, the absorption always decreases quickly a few days after the Amatrice mainshock at station LNSS, located in the southwestern part of Amatrice; on the contrary, it increases at station GUMA, located in the northeastern part of the faulting area, closer to Visso. There is also a quick drop in Qc−1 after the Amatrice earthquake, followed by a rapid increase till October 26 and 30 at station GUMA. After the Norcia earthquake, a reduction in absorption is evident at both stations.
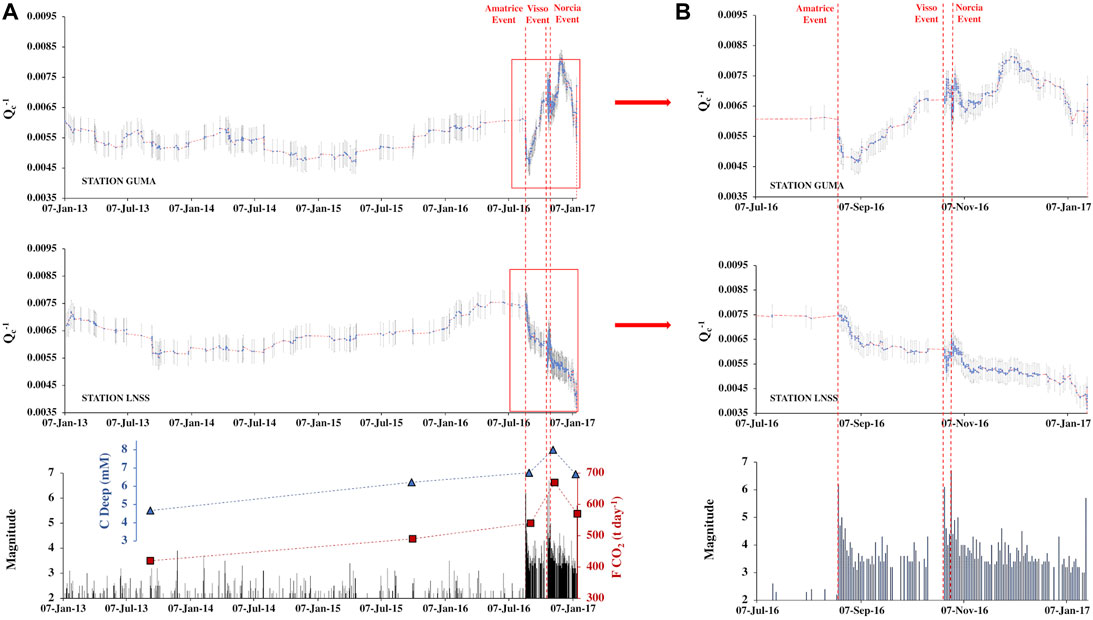
FIGURE 9. (A) Timelines of the averaged Qc−1 calculated at 1.5 Hz from the waveforms recorded by stations GUMA and LNNS during the time period of January 2013–January 2017. The red dashed line is the moving mean, and the gray lines are the standard error bars for the Qc−1. Time series of the magnitude of the seismic pre-sequence and sequence used in this work, compared with, in blue, the deep-CO2 monitored at Canetra spring and, in red, the daily measurement at the Velino aquifer of the deeply derived CO2 dissolved in the groundwaters (from Chiodini et al., 2020); (B) the same as (A), the variations of the averaged Qc−1 values at two stations observed during the sequence period (from July 2016 to January 2017).
5 Discussions
In the following, we discussed peak delay and Qc−1 variations in space and time separately (Figure 6 and Figure 7). These variations are investigated as a function of time and space for the pre-seismic and seismic periods. Spatial differences between the pre-seismic and the seismic phases occur because of different processes, which include fluid flow, crack opening/closure and crack density, pore pressure variations (compaction/dilatation), lithological contrasts, and existing fault networks. These processes produce different attenuation mechanisms.
5.1 Peak Delay (Scattering) Patterns in Space and Time
At all frequencies and for all sequences, a low-scattering NNE-SSW directed anomaly coincides with the Monti Sibillini thrust, including the flysch of Laga Formation. Thus, the thrust appears as a low-scattering barrier for northern propagation of fluid-induced seismicity (Improta et al., 2019). High-scattering losses correspond to the carbonatic Gran Sasso massif and the L’Aquila basin (Chiaraluce et al., 2011), where the 2009 L’Aquila seismic sequence nucleated. These losses mark high velocity and density contrasts, high density of cracks and fractures, and basins in the upper part of the crust (Borleanu et al., 2017). The correspondence between high scattering and carbonate rocks fractured by historical sequences is analogous to that observed across the Lauria Mountains in Southern Italy (Napolitano et al., 2020).
Considering the correlation with the Gran Sasso and the Monti Sibillini thrust (GST and MST; Figure 6), peak delays appear primarily sensitive to the existing structural elements as the pre-existing thrust and active faults (Calvet et al., 2013; De Siena et al., 2016). This inference is supported by the spatial correlation with the velocity model of the Central Apennines of Chiarabba et al. (2020a). The authors show lateral heterogeneity across the Monti Sibillini thrust, with high VP and VP/VS anomalies consistent with the high-scattering Lazio–Abruzzi domain and low VP and VP/VS in the northern portion corresponding to the low-scattering Umbria–Marche domain. The Vp peculiarities characterize a primary discontinuity between the Monti Sibillini and Laga thrust units, with the uplifted sedimentary deposits forming along distinguishable thrust faults (Centamore et al., 2009).
Peak delay patterns change less than Qc−1 patterns in time and frequency (Figure 6 and Supplementary Figures S12, S13, S14). However, while high-scattering anomalies appear diffuse before the AVN at 1.5 Hz, they focus on a narrow NW-SE striking band just south of the fault planes during the sequence. Moving from the Amatrice to the Norcia sequences, the high-scattering anomaly progressively expands from the southern fault plane to comprise the dense fault network located immediately to the W-SW of the modeled faults (red boxes in Figure 6). We interpret this change in scattering attenuation as evidence of micro-fracturing processes within the fault network, lacking evidence of significant lithological changes. This inference is supported by the higher-frequency peak delay maps (Supplementary Figures S13, S14) and by the high-anisotropy values measured by Pastori et al. (2019) in the same area and interpreted as heavily fractured, stressed, and over-pressurized by channeled fluids during the AVN.
5.2 Coda Q (Absorption) Patterns in Space and Time
The sparse distribution of the high-absorption anomalies during the pre-sequence becomes a continuous NW-SE striking pattern focused on the seismogenic zone during the AVN (Figure 7A). Spatial variations of high-absorption patterns are the manifestation of increased fluid content, with fluids expanding across the seismogenic zone with each sequence (Figure 7B). Fluids migrate across the faults at seismogenic depths (8–12 km), where the main events of the AVN have occurred. Absorption is higher in the southern part of the ruptured area during the Amatrice earthquake sequence; then, the high-absorption pattern moves north during the Visso sequence and extends along the fractured zone during the Norcia sequence. The high-absorption pattern thus points to northern migrations of fluids and across tectonic structures associated with fracturing up to the Norcia epicenter. At the end of the sequence, absorption has decreased on average, especially in the southern section of the fault zone where the Amatrice earthquake occurred. The images suggest that the fluids had abandoned the area by the end of the seismic sequences.
In fluid-filled fault networks, high absorption marks regions with the highest concentrations of CO2-bearing fluids (Di Martino et al., 2022). Our absorption patterns evolve during the sequence as expected for high-absorption deep CO2-bearing fluids previously trapped in the fault systems (Miller et al., 2004). The development of a high-pressure front allows fluids to propagate through the seismogenic zone and create aftershocks. The absorption patterns show the evolution of this front from the location of the Amatrice earthquake toward the north and south when fluids diffuse across the fault planes (Figure 7). Northern migration happened primarily during the Visso sequence when Monti Sibillini acted as a barrier (Improta et al., 2019). The Norcia sequence is the manifestation of the expansion of the over-pressurized trapped fluids across the fractured region (Pastori et al., 2019), marked by an expanded absorption anomaly.
The structural models confirm that fluid pathways follow the maximum horizontal stress direction (Sibson, 2000), which in the Central Apennines is NW-SE-oriented and parallel to the strike of the active normal faults (Di Luccio et al., 2010). The rock formations on the western side of the fault system are heavily fractured, and apparently, they channeled and trapped fluids. High-absorption anomalies focus primarily west of the activated fault system during the AVN (Figure 7). They mark the extension of the highly fractured and fluid-filled zones and the area of maximum displacement recognized by Brozzetti et al. (2019) for the Monte Vettore fault. This pattern is even more evident in Figures 8A,B, where after less than 1 month from the Norcia mainshock, the high attenuation anomaly is all focused east of the sequence fault plane (Figure 8B).
Our observations are consistent with the results from geochemical and geophysical studies that infer the critical role of CO2-rich deep fluids in the seismogenesis and evolution of seismic sequences across the Apennines (Chiodini et al., 2004, 2020; Miller et al., 2004; Di Luccio et al., 2010; Terakawa et al., 2010; Malagnini et al., 2012; Barberio et al., 2017; Chiarabba et al., 2020b). These studies highlight a relation between CO2 release and seismicity rates and locations (Miller et al., 2004; Chiodini et al., 2020). Such CO2 is supposedly released mainly from the mantle (Chiodini et al., 2004, 2020; Frezzotti et al., 2009) and accumulates at the lower and upper crust boundaries. Here, over-pressurized reservoirs develop, sealed by 10–12 km deep evaporitic levels (Chiodini et al., 2004, 2020), and by the multilayered carbonate succession in the inherited thrust (Chiarabba et al., 2020b; Carminati et al., 2020). Chiarabba et al. (2020b) provided temporal evidence of a reduction of the Vp in the vicinity of the mainshock nucleation. They associated this variation with increasing fluid pressure, lubrication, and weakening of the fault, as confirmed by laboratory experiments (Di Toro et al., 2011).
Soldati et al. (2019) investigated the temporal and spatial variation of the crustal velocity during the seismic sequence from noise cross-correlation. They observed a sudden drop in the seismic velocity at each mainshock, followed by a quick recovery. After the sequence, the co-seismic velocity gradually returned to the pre-sequence level, with a 75% perturbation recovered by the end of 2017. In space and time, this velocity drop was interpreted as the effect of the fast circulation of fluids, more abundant in the L’Aquila area, where the carbonate platform is located. The velocity drop distribution fluctuates with time and space, with the highest variation along the NE direction, corresponding to the sandstones of the foredeep deposits, highly hydrated and porous. These deposits increase pore pressure during the seismic sequence, decreasing the effective relative velocity.
Indeed, an increase in the concentration of mineralized endogenic fluids corresponds to seismic sequences (Barberio et al., 2017). The source of these fluids has been identified in rocks located at a depth of about 10 km (Figure 1). The influx of deep CO2 could favor their formation and ascent to the surface. According to Di Luccio et al. (2010), these deep fluids mainly migrate along the NW-SE striking faults and fractures of the Central Apennines. However, our results do not exclude those fluids moving in the shallower portion of the crust, especially where the permeability is higher, as within carbonates and basin filling deposits. Regardless, the maximum recorded water level variation in the Apennine aquifers during the AVN (e.g., Gran Sasso aquifer) is only 1.8 m (Devoti et al., 2018).
The timelines in Figure 9 show the time evolution of averaged Qc−1 variation next to the main fault(s) or at those locations (stations GUMA to the north and LNSS to the south) where the most striking changes are observed. Figure 9 helps evaluate the critical variations over the pre-sequence time and remark the details during the sequence period. In general, we observed a smooth and steady absorption trend over the three and a half years of pre-sequence. This variation is followed by a rapid rise and drop of the absorption starting from the Amatrice mainshock, which increased and diminished after a few days. Significant absorption changes are mainly detected before and after the three mainshocks of the sequence.
A similar pattern was observed by Chiodini et al. (2020) in the temporal evolution of deep CO2 degassing. Furthermore, Soldati et al. (2019) investigated the velocity perturbations from cross-correlation of ambient seismic noise associated with the Central Italy seismic sequence of 2016–2017. According to the individual of the three main shocks of the sequence, they observed an abrupt reduction of seismic velocity, followed by a quick recovery in the short term. They associated these fluctuations with fluid migrations and pore pressure changes and their effect on crack dynamics (opening–closure). The rapid change of absorption between Visso (October 26) and Norcia (October 30) is also identified in the 4D velocity tomography of Chiarabba et al. (2020b), where a decrease in Vp/Vs occurred near the Norcia hypocenter.
Our findings on the absorption behavior in time and space are consistent and comparable to those documented from independent studies using multi-parametric data in the same region. The decrease in absorption at the LNSS station and the increase at GUMA right after the Amatrice earthquake may emulate the fluid movements from south to north over the ruptured area. After the Amatrice earthquake, fluids moved to the north and triggered Visso, where we observed a significant increase in absorption at GUMA while a significant decrease in absorption at LNSS where the fluids have abandoned the area moving to the north.
6 Conclusion
The main results of this study are the following:
1) Peak delay analysis delineates and characterizes the structural (e.g., Monti Sibillini thrust) and lithological (e.g., fractured carbonate rocks) domains of the Central Apennines over all the studied frequency bands. High-scattering patterns highlight fracturing occurring during the AVN, with high-scattering anomalies focusing south and west of the seismogenic zone.
2) Coda-Q mapping marks the concentration of fluids across the seismogenic zone during the sequence. It detects a progression in time associated with fluid expansion from the Amatrice epicenter, mapping the migrations of deep CO2-rich fluids across the fractures and the fault networks of the Central Apennines.
These results point to a common feature for earthquake sequences across the Central Apennines: the deep migration and expansion of CO2-bearing fluids along the NW-SE elongated seismogenic zone. The front and area of expansion of these processes can be detected by mapping different seismic attenuation mechanisms in time and space. Knowing their variations also profoundly impacts assessing seismic hazards from earthquake triggering to earthquake ground motion to mitigate risks.
Mapping scattering and absorption in the 3D space through seismic sequences could give us unprecedented sensitivity to structures and processes leading to mainshocks and aftershocks in fault networks and so the deep understanding of seismic wave attenuation mechanisms.
Data Availability Statement
Publicly available datasets were analyzed in this study. These data can be found here: European Integrated Data Archive (EIDA) repository: http://www.orfeus-eu.org/data/eida/; Italian Accelerometric Archive: http://itaca.mi.ingv.it/ItacaNet_30; The ITHACA catalogue used in this paper can be found at: http://www.isprambiente.gov.it/it/progetti/suolo-e-territorio-1/ithaca-catalogo-delle-faglie-capaci.
Author Contributions
SG, AA, and LD conceptualized the research idea. SG, ED, and FN performed the methodology. SG and FN ran the software. SG, AA, and FN wrote the original draft. AA curated the data. ED validated the data. SG, AA, GV, and LD reviewed the paper. SG and AA edited the paper.
Funding
This work has been carried out in the framework of the project Pianeta Dinamico/2020–2021 supported by Ministero dell'Istruzione, dell'Università e della Ricerca (MIUR).
Conflict of Interest
The authors declare that the research was conducted in the absence of any commercial or financial relationships that could be construed as a potential conflict of interest.
Publisher’s Note
All claims expressed in this article are solely those of the authors and do not necessarily represent those of their affiliated organizations, or those of the publisher, the editors, and the reviewers. Any product that may be evaluated in this article, or claim that may be made by its manufacturer, is not guaranteed or endorsed by the publisher.
Acknowledgments
The workspace used to perform analyses with the open-access MuRAT2D MATLAB© code is available at https://doi.org/10.5281/zenodo.5121429. Many of the plots were generated using the Generic Mapping Tools, version 4.2.1 (http://www.soest.hawaii.edu/gmt; Wessel and Smith, 1998), and using the Scientific Color Maps (Crameri 2018; http://doi.org/10.5281/zenodo.1243862).
Supplementary Material
The Supplementary Material for this article can be found online at: https://www.frontiersin.org/articles/10.3389/feart.2022.909698/full#supplementary-material
References
Aki, K., and Chouet, B. (1975). Origin of Coda Waves: Source, Attenuation, and Scattering Effects. J. Geophys. Res. 80, 3322–3342. doi:10.1029/JB080i023p03322
Akinci, A., Pezzo, E. D., and Malagnini, L. (2020). Intrinsic and Scattering Seismic Wave Attenuation in the Central Apennines (Italy). Phys. Earth Planet. Interiors 303, 106498. doi:10.1016/j.pepi.2020.106498
Amoruso, A., Crescentini, L., Petitta, M., Rusi, S., and Tallini, M. (2011). Impact of the 6 April 2009 L'Aquila Earthquake on Groundwater Flow in the Gran Sasso Carbonate Aquifer, Central Italy. Hydrol. Process. 25 (11), 1754–1764. doi:10.1002/hyp.7933
Barberio, M. D., Barbieri, M., Billi, A., Doglioni, C., and Petitta, M. (2017). Hydrogeochemical Changes before and during the 2016 Amatrice-Norcia Seismic Sequence (Central Italy). Sci. Rep. 7 (1), 1–12. doi:10.1038/s41598-017-11990-8
Bernard, P., and Zollo, A. (1989). The Irpinia (Italy) 1980 Earthquake: Detailed Analysis of a Complex Normal Faulting. J. Geophys. Res. 94 (B2), 1631–1647. doi:10.1029/jb094ib02p01631
Billi, A., and Tiberti, M. M. (2009). Possible Causes of Arc Development in the Apennines, Central Italy. Geol. Soc. Am. Bull. 121, 1409–1420. doi:10.1130/B26335.1
Bigi, S., Casero, P., and Ciotoli, G. (2011). Seismic Interpretation of the Laga Basin; Constraints on the Structural Setting and Kinematics of the Central Apennines. J. Geol. Soc. 168 (1), 179–190. doi:10.1144/0016-76492010-084
Biswas, R., and Singh, C. (2020). An Investigation of Regional Variations of Coda Wave Attenuation in Western Tibet. J. Seismol. 24 (6), 1235–1254. doi:10.1007/s10950-020-09929-0
Boni, C. F., Bono, P., and Capelli, G. (1987). Schema Idrogeologico dell'Italia Centrale. Soc. Geol. Ital.
Borleanu, F., De Siena, L., Thomas, C., Popa, M., and Radulian, M. (2017). Seismic Scattering and Absorption Mapping from Intermediate-Depth Earthquakes Reveals Complex Tectonic Interactions Acting in the Vrancea Region and Surroundings (Romania). Tectonophysics 706-707, 129–142. doi:10.1016/j.tecto.2017.04.013
Brozzetti, F., Boncio, P., Cirillo, D., Ferrarini, F., Nardis, R., Testa, A., et al. (2019). High‐Resolution Field Mapping and Analysis of the August-October 2016 Coseismic Surface Faulting (Central Italy Earthquakes): Slip Distribution, Parameterization, and Comparison with Global Earthquakes. Tectonics 38 (2), 417–439. doi:10.1029/2018tc005305
Brozzetti, F., Cirillo, D., de Nardis, R., Cardinali, M., Lavecchia, G., Orecchio, B., et al. (2017). Newly Identified Active Faults in the Pollino Seismic Gap, Southern Italy, and Their Seismotectonic Significance. J. Struct. Geol. 94, 13–31. doi:10.1016/j.jsg.2016.10.005
Buttinelli, M., Pezzo, G., Valoroso, L., De Gori, P., and Chiarabba, C. (2018). Tectonics Inversions, Fault Segmentation, and Triggering Mechanisms in the Central Apennines Normal Fault System: Insights from High‐Resolution Velocity Models. Tectonics 37, 4135–4149. doi:10.1029/2018TC005053
Calvet, M., and Margerin, L. (2013). Lapse-time Dependence of Coda Q: Anisotropic Multiple-Scattering Models and Application to the Pyrenees. Bull. Seismol. Soc. Am. 103, 1993–2010. doi:10.1785/0120120239
Calvet, M., Sylvander, M., Margerin, L., and Villaseñor, A. (2013). Spatial Variations of Seismic Attenuation and Heterogeneity in the Pyrenees: Coda Q and Peak Delay Time Analysis. Tectonophysics 608, 428–439. doi:10.1016/j.tecto.2013.08.045
Carminati, E., Bignami, C., Doglioni, C., and Smeraglia, L. (2020). Lithological Control on Multiple Surface Ruptures during the 2016-2017 Amatrice-Norcia Seismic Sequence. J. Geodyn. 134, 101676. doi:10.1016/j.jog.2019.101676
Carminati, E., and Doglioni, C. (2012). Alps vs. Apennines: the Paradigm of a Tectonically Asymmetric Earth. Earth-Science Rev. 112, 67–96. doi:10.1016/j.earscirev.2012.02.004
Carminati, E., Fabbi, S., and Santantonio, M. (2014). Slab Bending, Syn-Subduction Normal Faulting, and Out-Of-Sequence Thrusting in the Central Apennines. Tectonics 33, 530–551. doi:10.1002/2013tc003386
Centamore, E., Rossi, D., and Tavarnelli, E. (2009). Geometry and Kinematics of Triassic-to-Recent Structures in the Northern-Central Apennines: a Review and an Original Working Hypothesis. Boll. Soc. Geol. 128 (2), 419–432. doi:10.3301/IJG.2009.128.2.419
Chiarabba, C., Amato, A., Anselmi, M., Baccheschi, P., Bianchi, I., Cattaneo, M., et al. (2009b). The 2009 L'Aquila (Central Italy) MW6.3 Earthquake: Main Shock and Aftershocks. Geophys. Res. Lett. 36. doi:10.1029/2009GL039627
Chiarabba, C., De Gori, P., Cattaneo, M., Spallarossa, D., and Segou, M. (2018). Faults Geometry and the Role of Fluids in the 2016–2017 Central Italy Seismic Sequence. Geophys. Res. Lett. 45 (14), 6963–6971. doi:10.1029/2018GL077485
Chiarabba, C., Buttinelli, M., Cattaneo, M., and De Gori, P. (2020a). Large Earthquakes Driven by Fluid Overpressure: The Apennines Normal Faulting System Case. Tectonics 39. doi:10.1029/2019TC006014
Chiarabba, C., De Gori, P., Segou, M., and Cattaneo, M. (2020b). Seismic Velocity Precursors to the 2016 Mw 6.5 Norcia (Italy) Earthquake. Geology 48 (9), 924–928. doi:10.1130/g47048.1
Chiarabba, C., Jovane, L., and DiStefano, R. (2005). A New View of Italian Seismicity Using 20 Years of Instrumental Recordings. Tectonophysics 395 (3-4), 251–268. doi:10.1016/j.tecto.2004.09.013
Chiarabba, C., Piccinini, D., and De Gori, P. (2009a). Velocity and Attenuation Tomography of the Umbria Marche 1997 Fault System: Evidence of a Fluid-Governed Seismic Sequence. Tectonophysics 476 (1-2), 73–84. doi:10.1016/j.tecto.2009.04.004
Chiaraluce, L., Amato, A., Cocco, M., Chiarabba, C., Selvaggi, G., Di Bona, M., et al. (2004). Complex Normal Faulting in the Apennines Thrust-and-fold Belt: The 1997 Seismic Sequence in Central Italy. Bull. Seism. Soc. Am. 94. doi:10.1785/0120020052
Chiaraluce, L., Chiarabba, C., Collettini, C., Piccinini, D., and Cocco, M. (2007). Architecture and Mechanics of an Active Low-Angle Normal Fault: Alto Tiberina Fault, Northern Apennines, Italy. J. Geophys. Res. 112 (B10). doi:10.1029/2007JB005015
Chiaraluce, L., Chiarabba, C., De Gori, P., Di Stefano, R., Improta, L., Piccinini, D., et al. (2011). The 2009 L’Aquila (Central Italy) Seismic Sequence. Boll. Geofis. Teor. Appl. 52, 367–387. doi:10.4430/bgta0019
Chiaraluce, L., Di Stefano, R., Tinti, E., Scognamiglio, L., Michele, M., Casarotti, E., et al. (2017). The 2016 Central Italy Seismic Sequence: A First Look at the Mainshocks, Aftershocks, and Source Models. Seismol. Res. Lett. 88, 757–771. doi:10.1785/0220160221
Chiodini, G., Cardellini, C., Di Luccio, F., Selva, J., Frondini, F., Caliro, S., et al. (2020). Correlation between Tectonic CO2 Earth Degassing and Seismicity Is Revealed by a 10-year Record in the Apennines, Italy. Sci. Adv. 6 (35), eabc2938. doi:10.1126/sciadv.abc2938
Chiodini, G., Caliro, S., Cardellini, C., Frondini, F., Inguaggiato, S., and Matteucci, F. (2011). Geochemical Evidence for and Characterization of CO2 Rich Gas Sources in the Epicentral Area of the Abruzzo 2009 Earthquakes. Earth Planet. Sci. Lett. 304 (3-4), 389–398. doi:10.1016/j.epsl.2011.02.016
Chiodini, G., Cardellini, C., Amato, A., Boschi, E., Caliro, S., Frondini, F., et al. (2004). Carbon Dioxide Earth Degassing and Seismogenesis in Central and Southern Italy. Geophys. Res. Lett. 31 (7), a–n. doi:10.1029/2004GL019480
Collettini, C., Cardellini, C., Chiodini, G., De Paola, N., Holdsworth, R. E., and Smith, S. A. F. (2008). Fault Weakening Due to CO2 Degassing in the Northern Apennines: Short- and Long-Term Processes. Geol. Soc. Lond. Spec. Publ. 299 (1), 175–194. doi:10.1144/SP299.11
Cosentino, D., Cipollari, P., Marsili, P., and Scrocca, D. (2010). Geology of the Central Apennines: a Regional Review. J. Virt. Expl. 36 (11), 1–37. doi:10.3809/jvirtex.2010.00223
de Lorenzo, S., Del Pezzo, E., and Bianco, F. (2013). Qc, Qβ, Qi and Qs Attenuation Parameters in the Umbria-Marche (Italy) Region. Phys. Earth Planet. Interiors 218, 19–30. doi:10.1016/j.pepi.2013.03.002
De Matteis, R., Convertito, V., Napolitano, F., Amoroso, O., Terakawa, T., and Capuano, P. (2021). Pore Fluid Pressure Imaging of the Mt. Pollino Region (Southern Italy) from Earthquake Focal Mechanisms. Geophys. Res. Lett. 48 (22), e2021GL094552. doi:10.1029/2021gl094552
De Siena, L., Calvet, M., Watson, K. J., Jonkers, A. R. T., and Thomas, C. (2016). Seismic Scattering and Absorption Mapping of Debris Flows, Feeding Paths, and Tectonic Units at Mount St. Helens Volcano. Earth Planet. Sci. Lett. 442, 21–31. doi:10.1016/j.epsl.2016.02.026
De Siena, L., Amoruso, A., Pezzo, E. D., Wakeford, Z., Castellano, M., and Crescentini, L. (2017). Space-weighted Seismic Attenuation Mapping of the Aseismic Source of Campi Flegrei 1983-84 Unrest. Geophys. Res. Lett. 44, 1740–1748. doi:10.1002/2017GL072507
Del Pezzo, E., De La Torre, A., Bianco, F., Ibanez, J., Gabrielli, S., and De Siena, L. (2018). Numerically Calculated 3d Space-Weighting Functions to Image Crustal Volcanic Structures Using Diffuse Coda Waves. Geosciences 8, 175. doi:10.3390/geosciences8050175
Devoti, R., Riguzzi, F., Cinti, F. R., and Ventura, G. (2018). Long-term Strain Oscillations Related to the Hydrological Interaction between Aquifers in Intra-mountain Basins: A Case Study from Apennines Chain (Italy). Earth Planet. Sci. Lett. 501, 1–12. doi:10.1016/j.epsl.2018.08.014
Di Bucci, D., Buttinelli, M., D’Ambrogi, C., Scrocca, D., Anzidei, M., Basili, R., et al. (2021). RETRACE-3D Project: a Multidisciplinary Collaboration to Build a Crustal Model for the 2016-2018 Central Italy Seismic Sequence. Boll. Geofis. Teor. Appl. 2021. doi:10.4430/bgta0343
Di Luccio, F., Ventura, G., Di Giovambattista, R., Piscini, A., and Cinti, F. R. (2010). Normal Faults and Thrusts Reactivated by Deep Fluids: The 6 April 2009Mw6.3 L'Aquila Earthquake, Central Italy. J. Geophys. Res. 115. doi:10.1029/2009JB007190
Di Martino, M. D. P., De Siena, L., Serlenga, V., and De Landro, G. (2022). Reconstructing Hydrothermal Fluid Pathways and Storage at the Solfatara Crater (Campi Flegrei, Italy) Using Seismic Scattering and Absorption. Front. Earth Sci. 10. doi:10.3389/feart.2022.852510
Di Toro, G., Han, R., Hirose, T., De Paola, N., Nielsen, S., Mizoguchi, K., et al. (2011). Fault Lubrication during Earthquakes. Nature 471 (7339), 494–498. doi:10.1038/nature09838
Doglioni, C. (1991). A Proposal for the Kinematic Modelling of W-Dipping Subductions - Possible Applications to the Tyrrhenian-Apennines System. Terra nova. 3, 423–434. doi:10.1111/j.1365-3121.1991.tb00172.x
Doglioni, C., Barba, S., Carminati, E., and Riguzzi, F. (2014). Fault On-Off versus Coseismic Fluids Reaction. Geosci. Front. 5, 767–780. doi:10.1016/j.gsf.2013.08.004
Eulenfeld, T., and Wegler, U. (2016). Measurement of Intrinsic and Scattering Attenuation of Shear Waves in Two Sedimentary Basins and Comparison to Crystalline Sites in Germany. Geophys. J. Int. 205 (2), 744–757. doi:10.1093/gji/ggw035
Frezzotti, M. L., Peccerillo, A., and Panza, G. (2009). Carbonate Metasomatism and CO2 Lithosphere-Asthenosphere Degassing beneath the Western Mediterranean: An Integrated Model Arising from Petrological and Geophysical Data. Chem. Geol. 262, 108–120. doi:10.1016/j.chemgeo.2009.02.015
Gabrielli, S., De Siena, L., Napolitano, F., and Del Pezzo, E. (2020). Understanding Seismic Path Biases and Magmatic Activity at Mount St Helens Volcano before its 2004 Eruption. Geophys. J. Int. 222 (1), 169–188. doi:10.1093/gji/ggaa154
Gusev, A. A., and Abubakirov, I. R. (1999). Vertical Profile of Effective Turbidity Reconstructed from Broadening of Incoherent Body-Wave Pulses-I. General Approach and the Inversion Procedure. Geophys. J. Int. 136 (2), 295–308. doi:10.1046/j.1365-246x.1999.00740.x
Improta, L., Latorre, D., Latorre, D., Margheriti, L., Nardi, A., Marchetti, A., et al. (2019). Multi-segment Rupture of the 2016 Amatrice-Visso-Norcia Seismic Sequence (Central Italy) Constrained by the First High-Quality Catalog of Early Aftershocks. Sci. Rep. 9. doi:10.1038/s41598-019-43393-2
Malagnini, L., Lucente, F. P., De Gori, P., Akinci, A., and Munafo', I. (2012). Control of Pore Fluid Pressure Diffusion on Fault Failure Mode: Insights from the 2009 L'Aquila Seismic Sequence. J. Geophys. Res. 117, a–n. doi:10.1029/2011JB008911
Malinverno, A., and Ryan, W. B. F. (1986). Extension in the Tyrrhenian Sea and Shortening in the Apennines as Result of Arc Migration Driven by Sinking of the Lithosphere. Tectonics 5, 227–245. doi:10.1029/tc005i002p00227
Mayor, J., Calvet, M., Margerin, L., Vanderhaeghe, O., and Traversa, P. (2016). Crustal Structure of the Alps as Seen by Attenuation Tomography. Earth Planet. Sci. Lett. 439, 71–80. doi:10.1016/j.epsl.2016.01.025
Miller, S. A., Collettini, C., Chiaraluce, L., Cocco, M., Barchi, M., and Kaus, B. J. P. (2004). Aftershocks Driven by a High-Pressure CO2 Source at Depth. Nature 427 (6976), 724–727. doi:10.1038/nature02251
Montone, P., and Mariucci, M. T. (2016). The New Release of the Italian Contemporary Stress Map. Geophys. J. Int. 205 (3), 1525–1531. doi:10.1093/gji/ggw100
Napolitano, F., Amoroso, O., La Rocca, M., Gervasi, A., Gabrielli, S., and Capuano, P. (2021). Crustal Structure of the Seismogenic Volume of the 2010–2014 Pollino (Italy) Seismic Sequence from 3D P-And S-Wave Tomographic Images. Front. Earth Sci. 2021. doi:10.3389/feart.2021.735340
Napolitano, F., De Siena, L., Gervasi, A., Guerra, I., Scarpa, R., and La Rocca, M. (2020). Scattering and Absorption Imaging of a Highly Fractured Fluid-Filled Seismogenetic Volume in a Region of Slow Deformation. Geosci. Front. 11, 989–998. doi:10.1016/j.gsf.2019.09.014
Paasschens, J. C. J. (1997). Solution of the Time-dependent Boltzmann Equation. Phys. Rev. E 56, 1135–1141. doi:10.1103/PhysRevE.56.1135
Pacheco, C., and Snieder, R. (2005). Time-lapse Travel Time Change of Multiply Scattered Acoustic Waves. J. Acoust. Soc. Am. 118, 1300–1310. doi:10.1121/1.2000827
Pastori, M., Baccheschi, P., and Margheriti, L. (2019). Shear Wave Splitting Evidence and Relations with Stress Field and Major Faults from the "Amatrice‐Visso‐Norcia Seismic Sequence". Tectonics 38, 3351–3372. doi:10.1029/2018TC005478
Piana Agostinetti, N., and Amato, A. (2009). Moho Depth and Vp/Vs Ratio in Peninsular Italy from Teleseismic Receiver Functions. J. Geophys. Res. 114 (B6). doi:10.1029/2008jb005899
Pizzi, A., and Galadini, F. (2009). Pre-Existing Cross-Structures and Active Fault Segmentation in the Northern-Central Apennines (Italy). Tectonophysics 476 (1–2), 304–319. doi:10.1016/j.tecto.2009.03.018
Saito, T., Sato, H., and Ohtake, M. (2002). Envelope Broadening of Spherically Outgoing Waves in Three‐dimensional Random Media Having Power Law Spectra. J. Geophys. Res. 107 (B5), ESE-3. doi:10.1029/2002jb002063
Sato, H., Fehler, M. C., and Maeda, T. (2012). Seismic Wave Propagation and Scattering in the Heterogeneous Earth. Second Edition. New York, USA: Springer.
Scisciani, V., Agostini, S., Calamita, F., Pace, P., Cilli, A., Giori, I., et al. (2014). Positive Inversion Tectonics in Foreland Fold-And-Thrust Belts: A Reappraisal of the Umbria-Marche Northern Apennines (Central Italy) by Integrating Geological and Geophysical Data. Tectonophysics 637, 218–237. doi:10.1016/j.tecto.2014.10.010
Scognamiglio, L., Tinti, E., Casarotti, E., Pucci, S., Villani, F., Cocco, M., et al. (2018). Complex Fault Geometry and Rupture Dynamics of the M W 6.5, 30 October 2016, Central Italy Earthquake. J. Geophys. Res. Solid Earth 123 (4), 2943–2964. doi:10.1002/2018jb015603
Shapiro, N. M., Campillo, M., Margerin, L., Singh, S. K., Kostoglodov, V., and Pacheco, J. (2000). The Energy Partitioning and the Diffusive Character of the Seismic Coda. Bull. Seismol. Soc. Am. 90 (3), 655–665. doi:10.1785/0119990021
Sibson, R. H. (2000). Fluid Involvement in Normal Faulting. J. Geodyn. 29 (3–5), 469–499. doi:10.1016/S0264-3707(99)00042-3
Sketsiou, P., Napolitano, F., Zenonos, A., and De Siena, L. (2020). New Insights into Seismic Absorption Imaging. Phys. Earth Planet. Interiors 298, 106337. doi:10.1016/j.pepi.2019.106337
Soldati, G., Zaccarelli, L., and Faenza, L. (2019). Spatio-temporal Seismic Velocity Variations Associated to the 2016-2017 Central Italy Seismic Sequence from Noise Cross-Correlation. Geophys. J. Int. 219 (3), 2165–2173. doi:10.1093/gji/ggz429
Takahashi, T., Sato, H., Nishimura, T., and Obara, K. (2007). Strong Inhomogeneity beneath Quaternary Volcanoes Revealed from the Peak Delay Analysis ofS-Wave Seismograms of Microearthquakes in Northeastern Japan. Geophys. J. Int. 168 (1), 90–99. doi:10.1111/j.1365-246x.2006.03197.x
Valoroso, L., Chiaraluce, L., Piccinini, D., Di Stefano, R., Schaff, D., and Waldhauser, F. (2013). Radiography of a Normal Fault System by 64,000 High-Precision Earthquake Locations: The 2009 L'Aquila (Central Italy) Case Study. J. Geophys. Res. Solid Earth 118 (3), 1156–1176. doi:10.1002/jgrb.50130
van Laaten, M., Eulenfeld, T., and Wegler, U. (2021). Comparison of Multiple Lapse Time Window Analysis and Qopen to Determine Intrinsic and Scattering Attenuation. Geophys. J. Int. 228 (2), 913–926.
Ventura, G., and Di Giovambattista, R. (2013). Fluid Pressure, Stress Field and Propagation Style of Coalescing Thrusts from the Analysis of the 20 May 2012 ML5.9 Emilia Earthquake (Northern Apennines, Italy). Terra Nov. 25, 72–78. doi:10.1111/ter.12007
Ventura, G., Cinti, F. R., Di Luccio, F., and Pino, N. A. (2007). Mantle Wedge Dynamics Versus Crustal Seismicity in the Apennines (Italy). Geochem. Geophys. 8 (2). doi:10.1029/2006GC001421
Villani, F., Civico, R., Pucci, S., Pizzimenti, L., Nappi, R., and De Martini, P. M. (2018). A Database of the Coseismic Effects Following the 30 October 2016 Norcia Earthquake in Central Italy. Sci. Data 5 (1), 180049. doi:10.1038/sdata.2018.49
Waldhauser, F., Michele, M., Chiaraluce, L., Di Stefano, R., and Schaff, D. P. (2021). Fault Planes, Fault Zone Structure and Detachment Fragmentation Resolved With High‐Precision Aftershock Locations of the 2016–2017 Central Italy Sequence. Geophys. Res. Lett. 48 (16), e2021GL092918. doi:10.1029/2021GL092918
Walters, R. J., Gregory, L. C., Wedmore, L. N. J., Craig, T. J., McCaffrey, K., Wilkinson, M., et al. (2018). Dual Control of Fault Intersections on Stop-Start Rupture in the 2016 Central Italy Seismic Sequence. Earth Planet. Sci. Lett. 500, 1–14. doi:10.1016/j.epsl.2018.07.043
Wessel, P., and Smith, W. H. (1998). New, Improved Version of Generic Mapping Tools Released. Geophys. Res. Lett. 79 (47), 579–579. doi:10.1029/98EO00426
Keywords: seismic attenuation, scattering, fluid, earthquake sequence, Central Italy
Citation: Gabrielli S, Akinci A, Ventura G, Napolitano F, Del Pezzo E and De Siena L (2022) Fast Changes in Seismic Attenuation of the Upper Crust due to Fracturing and Fluid Migration: The 2016–2017 Central Italy Seismic Sequence. Front. Earth Sci. 10:909698. doi: 10.3389/feart.2022.909698
Received: 31 March 2022; Accepted: 17 May 2022;
Published: 29 June 2022.
Edited by:
Andrea Billi, National Research Council (CNR), ItalyReviewed by:
Manuel Curzi, University of Bologna, ItalyTim Greenfield, University of Cambridge, United Kingdom
Copyright © 2022 Gabrielli, Akinci, Ventura, Napolitano, Del Pezzo and De Siena. This is an open-access article distributed under the terms of the Creative Commons Attribution License (CC BY). The use, distribution or reproduction in other forums is permitted, provided the original author(s) and the copyright owner(s) are credited and that the original publication in this journal is cited, in accordance with accepted academic practice. No use, distribution or reproduction is permitted which does not comply with these terms.
*Correspondence: Simona Gabrielli, c2ltb25hLmdhYnJpZWxsaUBpbmd2Lml0