 Jong-Sik Ryu
 Hyoun Soo Lim2
 Hye-Bin Choi
 Ji-Hoon Kim
 Nathalie Vigier
- 1Department of Earth and Environmental Sciences, Pukyong National University, Busan, South Korea
- 2Department of Geological Sciences, Pusan National University, Busan, South Korea
- 3Research Center for Geochronology and Isotope Analysis, Korea Basic Science Institute, Cheongju-si, South Korea
- 4Petroleum and Marine Research Division, Korea Institute of Geoscience and Mineral Resources, Daejeon, South Korea
- 5Division of Polar Life Sciences, Korea Polar Research Institute, Incheon, South Korea
- 6LOV, CNRS, UPMC, UMR 7093, Villefranche-Sur-Mer, France
Lithium (Li) has two stable isotopes, 6Li and 7Li, whose large relative mass difference is responsible for significant isotopic fractionation during physico-chemical processes, allowing Li isotopes to be a good tracer of continental chemical weathering. Although physical erosion is dominant in the Polar regions due to glaciers, increasing global surface temperature may enhance chemical weathering, with possible consequences on carbon biogeochemical cycle and nutriment flux to the ocean. Here, we examined elemental and Li isotope geochemistry of meltwaters, suspended sediments, soils, and bedrocks in the Barton Peninsula, King George Island, Antarctica. Li concentrations range from 8.7 nM to 23.3 μM in waters, from 0.01 to 1.43 ppm in suspended sediments, from 9.56 to 36.9 ppm in soils, and from 0.42 to 28.3 ppm in bedrocks. δ7Li values are also variable, ranging from +16.4 to +41.1‰ in waters, from −0.4 to +13.4‰ in suspended sediments, from −2.5 to +6.9‰ in soils, and from −1.8 to +11.7‰ in bedrocks. Elemental and Li isotope geochemistry reveals that secondary phase formation during chemical weathering mainly control dissolved δ7Li values, rather than a mixing with sea salt inputs from atmosphere or ice melting. Likewise, δ7Li values of suspended sediments and soils lower than those of bedrocks indicate modern chemical weathering with mineral neoformation. This study suggests that increasing global surface temperature enhances modern chemical weathering in Antarctica, continuing to lower δ7Li values in meltwater with intense water-rock interactions.
1 Introduction
Chemical weathering of silicate rocks consumes atmospheric CO2, releases solutes to ocean via river, and controls temporal variations in seawater chemistry. Therefore, understanding of silicate weathering has been highlighted to elucidate the global carbon cycle on a geological timescale (Walker et al., 1981; Berner, 2003). Lithium (Li) has two stable isotopes, 6Li and 7Li, whose large relative mass difference is responsible for significant isotopic fractionation during physico-chemical processes. The formation of secondary phases, especially clay minerals, preferentially takes up light isotope (i.e., 6Li), driving residual waters isotopically heavy (Pistiner and Henderson, 2003; Vigier et al., 2008; Pogge von Strandmann et al., 2010; Wimpenny et al., 2010a), while mineral dissolution is associated with little isotope fractionation (Pistiner and Henderson, 2003; Wimpenny et al., 2010b; Verney-Carron et al., 2011). In this context, Li isotopes have proved to be the most useful proxy for tracing the type and intensity of silicate weathering because Li is little in carbonates and Li isotopes are not affected by biological processes (Huh et al., 1998; Huh et al., 2001; Rudnick et al., 2004; Teng et al., 2004; Pogge von Strandmann et al., 2006; Lemarchand et al., 2010; Millot et al., 2010a; Liu et al., 2015). Ryu et al. (2014) assessed various factors controlling Li isotopes in soils developed along a 4 million year humid-environment chronosequence in the Hawaiian Islands, in which basalt weathering and secondary mineral formation mainly controls Li isotopes in these soil profiles.
Increasing global surface temperatures due to rising greenhouse gas levels for the Polar regions will enhances glacial melting, sea ice reduction, and organic matter decomposition in thawed permafrost as well as weathering of rocks (Kling et al., 1991; Oechel et al., 1993; Freeman et al., 2001; Jacobson and Blum, 2003; Serreze and Francis, 2006; Zimov et al., 2006; Schuur et al., 2008; Serreze et al., 2009; Ryu and Jacobson, 2012). Increased river runoff during glacial melting can promote chemical weathering and therefore negative feedbacks occur because chemical weathering of rocks regulates global carbon cycle on both human—and geological-timescales (Sharp et al., 1995). Many previous studies have long emphasized the impact of physical components of the Earth system, such as albedo, sea level, and possibly, ocean circulation (ACIA, 2005; IPCC, 2007). Recently, studies focusing on geochemical aspect have emphasized on the Arctic (Anderson et al., 2000; Tranter, 2003; Lee et al., 2004; Fortner et al., 2005; Bhatia et al., 2010; Wimpenny et al., 2010a; Wimpenny et al., 2011; Ryu and Jacobson, 2012). For example, the geochemistry of Greenland rivers has been examined to characterize dissolved organic matter associated with the ice sheet (Bhatia et al., 2010), to address the behaviors of Mg and Li isotopes during glacial weathering (Wimpenny et al., 2010a; Wimpenny et al., 2011), and to identify carbon cycle feedbacks in the present and future (Ryu and Jacobson, 2012). However, a few studies have been conducted in Antarctica (Lyons et al., 1999; Lyons et al., 2005; Harris et al., 2007; Welch et al., 2010; Witherow et al., 2010). The Barton Peninsula of King George Island, which is the focus of this study, is located in the marginal area of West Antarctica, where climate is warmer and more humid than in other parts of Antarctica (e.g., Campbell and Claridge, 1987), and will be much more sensitive to increasing global surface temperatures. Although previous studies have suggested little chemical weathering occurs in the Barton Peninsula (Lee et al., 2004; Santos et al., 2007), recent studies have indicated that chemical weathering may affect to some extent the water chemistry and soil formation (Lim et al., 2014; Lopes et al., 2019; Lopes et al., 2021).
This study focuses on Li isotopes for various types of samples (i.e., meltwater, lake, seawater, suspended sediment, soil, and bedrock) collected in the Barton Peninsula, in order to identify the various factors affecting water chemistry and then to examine if, how, and to what extent chemical weathering may occur in this area. Results will be compared with Li isotope data previously reported in the Polar regions.
2 Materials and Methods
2.1 Study Area
Detailed descriptions of the study area are given in previous studies (e.g., Lee et al., 2004; Lim et al., 2014; Choi et al., 2022). In short, its surface area is approximately 1,310 km2 and its 92% is covered with glaciers with a maximum thickness of 395 m. The snow cover depth ranges from 2 to 73 cm, and mainly melts in summer (November–March; Jiahong et al., 1998). Ice-free area is exposed only along the shorelines in restricted area but has expanded with an increase of surface temperature (Park et al., 1998), in which relatively various vegetation such as flowering plant, bryophytes and lichens grow (Kim et al., 2007). According to climatic data collected at the King Sejong Station in the Barton Peninsula from 1988 to 1996, the climate is warmer and more humid than other Antarctic areas with an average annual temperature of −1.8°C, relative humidity of 89%, precipitation of 437.6 mm and wind velocity of 7.9 m/s from the northwest and southwest (Lim et al., 2009).
The Barton Peninsula consists mainly of lavas, pyroclastics, and Paleocene to Eocene hypabyssal and plutonic rocks. The Sejong Formation, existing at the lowestmost part, consists of mostly volcaniclastic sediments, which is distributed along the southern and southwestern coastal area of the Barton Peninsula. Most volcanic rocks over the Sejong Formation are widely distributed in the Barton Peninsula, ranging from basalt to andesite. Granodiorite is exposed in the southwestern region of Noel Hill and hydrothermal alteration is observed at the boundary between the volcanic rock and the granodiorite in the central part of the Barton Peninsula (Lim et al., 2014 and references therein).
2.2 Samples Collection and Field Measurements
A total of 36 water and 34 suspended sediment samples were collected in January 2015 at the Barton Peninsula, which are supraglacial streams, adjacent lakes, and seawater. A total of 29 surface soil samples were collected from the uppermost 10 cm of the active layer in the soil on the Barton Peninsula, avoiding soils on altered bedrocks (Figure 1). All sample locations were documented with a Garmin GPSMAP 60CSx handheld GPS meter. Temperature, pH, and electrical conductivity (EC) were measured in-situ using an ORION 5-STAR meter equipped with an ORION Combination epoxy pH electrode and DuraProbe 4-Electrode conductivity cells. Total alkalinity was measured using a Mettler Toledo T50A titrator with 0.01 M HCl acidmetric titration to an endpoint of pH = 4.5. Samples for dissolved cations, and Sr and Li isotopes were passed through 0.2 μm filter, collected in I-CHEM LDPE bottles, and acidified to pH = 2 using ultrapure HNO3. Samples for dissolved anions were passed through 0.2 μm filter and collected in acid-cleaned Nalgene LDPE bottles. About 500 ml of water sample was filtered in the laboratory using pre-weighed 0.2 μm filter, which were later dried at T = 60°C and reweighed in order to calculate the amount of suspended sediment (SS) per liter of meltwater.
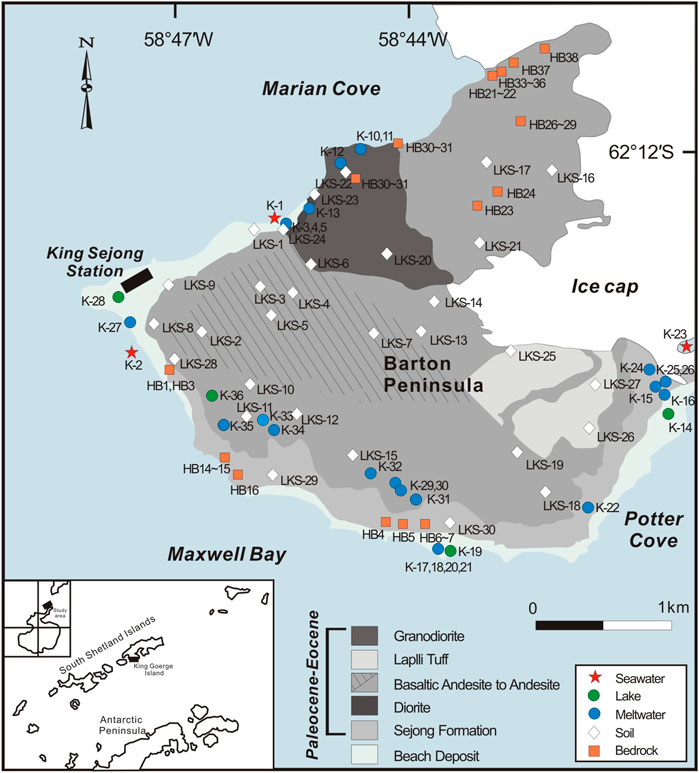
FIGURE 1. Map showing sampling locations on Barton Peninsula, King George Island, West Antarctica. The sampling locations for suspended sediment are the same as those for water sample.
2.3 Preparation of Soil, Rock, and Suspended Sediment Samples
A total of 32 rock samples were the residual splits of bulk rock powders collected at the Barton Peninsula (Figure 1; Hur et al., 2001). About 0.1 g of soil and rock samples was completely digested in a 5:3 mixture of HF and HNO3. The samples were dried, refluxed several times in 6.0 M HCl to remove fluorides, and re-dissolved in 5% HNO3. Also, suspended sediment samples were processed in the same way as rock and soil samples.
2.4 Chemical and Isotopic Analyses
Cation and trace element concentrations were measured using a Thermo Scientific iCAP™ Q ICP–MS and a Perkin Elmer Optima 8300 ICP–AES at the Korea Basic Science Institute (KBSI). Anion concentrations were measured using a Dionex ICS–1100 ion chromatograph at the KBSI.
For water samples, strontium isotope ratios (87Sr/86Sr) were measured using a Neptune MC–ICP–MS upgraded with a large dry interface pump at the KBSI. Before the measurements, samples were dried in Teflon vessels, re-dissolved in 8 M HNO3, and separated from matrix elements using an Eichrom Sr resin. The 87Sr/86Sr ratios were normalized to 86Sr/88Sr = 0.1194, and the mean 87Sr/86Sr ratio of the NBS987 standard during analysis was 0.710248 ± 0.000053 (2σ, n = 32).
Lithium was separated from matrix elements using an AG 50W−X8 resin (200–400 mesh), dried, and re-dissolved in 5% HNO3 (∼40 ppb Li). Lithium isotope ratios were also measured using a Neptune MC–ICP–MS at the KBSI. Samples were analyzed using a blank-standard-blank-sample-blank-standard-blank external bracketing method, in which sample intensities were matched to within 10% of the intensity of the standard. The sensitivity was ∼90 V/ppm on mass 7 at a typical uptake rate of 100 μl/min, and blank values were low (∼30 mV for 7Li; 0.8%). Prior to the Li isotope measurement, each sample was checked for yield, which were greater than 99%. The Li isotopic composition is reported in delta notation (‰) relative to L-SVEC, where δ7Li = [(7Li/6Li)sample/(7Li/6Li)L-SVEC − 1] × 1000. The accuracy and reproducibility of the whole method was validated using the USGS rock reference materials (BCR-2 and BHVO-2) and seawater standard (IAPSO). BCR-2 yielded + 3.2 ± 0.6‰ (2σ, n = 10), BHVO-2 yielded +4.5 ± 0.0‰ (2σ, n = 2), and IAPSO yielded + 31.5 ± 0.8‰ (2σ, n = 6), which were all in good agreement with reported values (e.g., You and Chan, 1996; Moriguti and Nakamura, 1998; Tomascak et al., 1999; Nishio and Nakai, 2002; Magna et al., 2004; Huang et al., 2010; Ludwig et al., 2011; Ryu et al., 2014).
3 Results
Table 1 presents physicochemical and isotopic compositions of water samples. Elemental and isotopic compositions of suspended sediment, soil and rock samples are given in Tables 2–4, respectively.
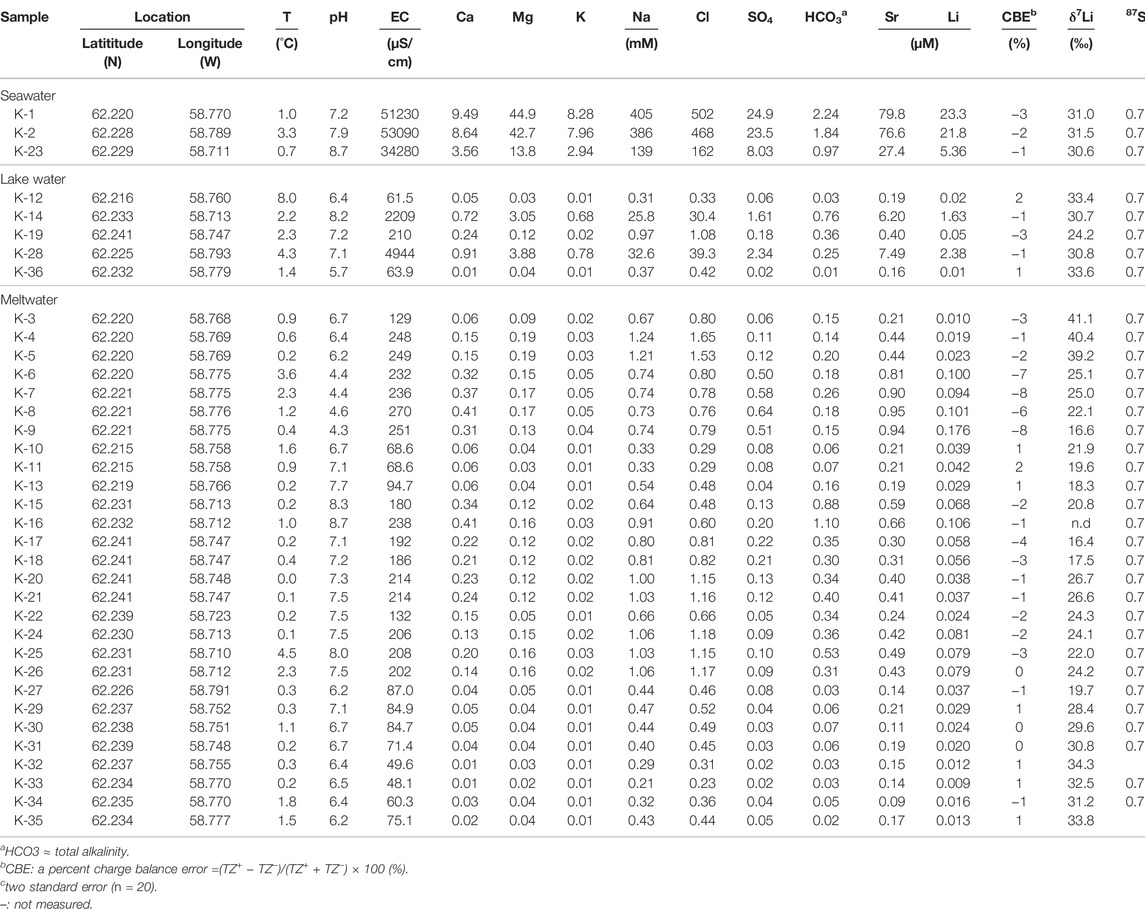
TABLE 1. Physicochemical and isotopic compositions for water samples.
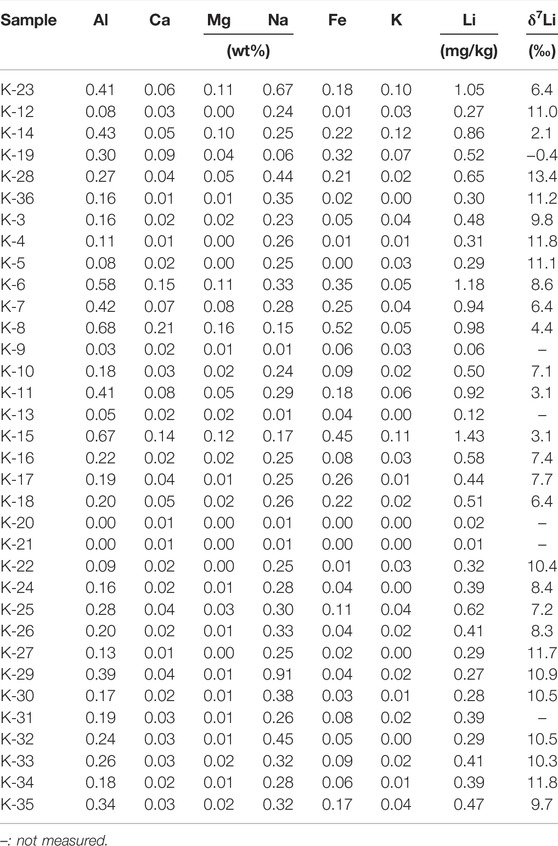
TABLE 2. Elemental and isotopic compositions for the suspended sediments.
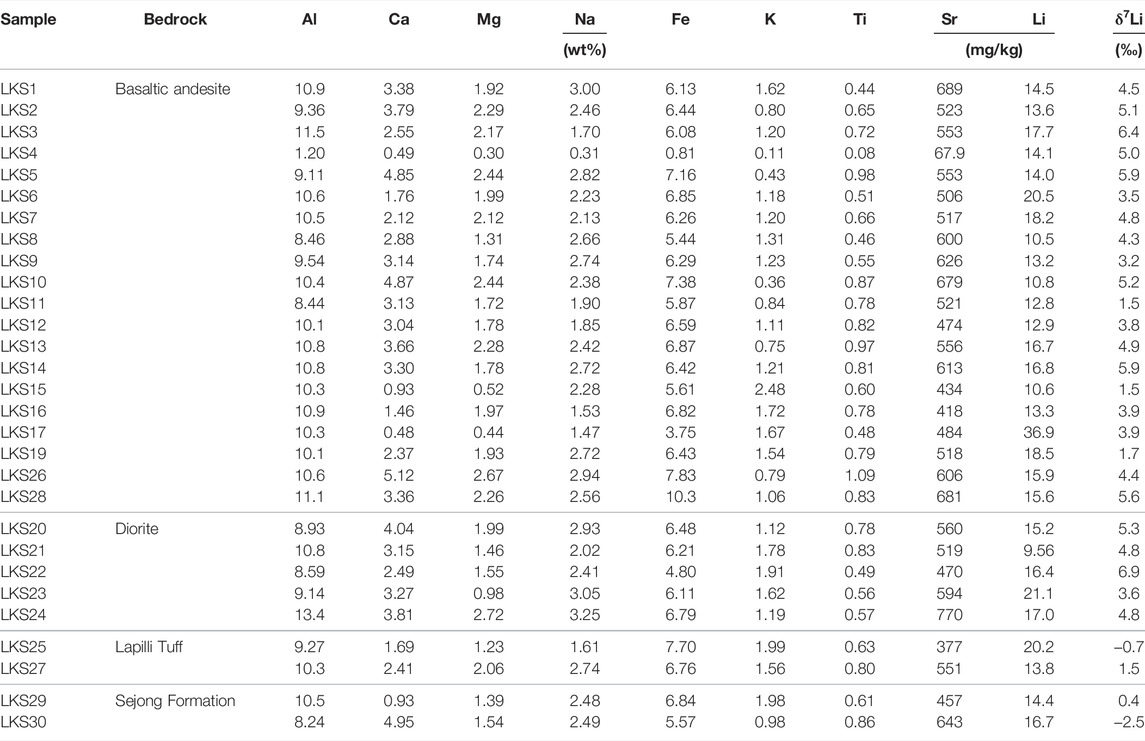
TABLE 3. Elemental and isotopic compositions for soils.
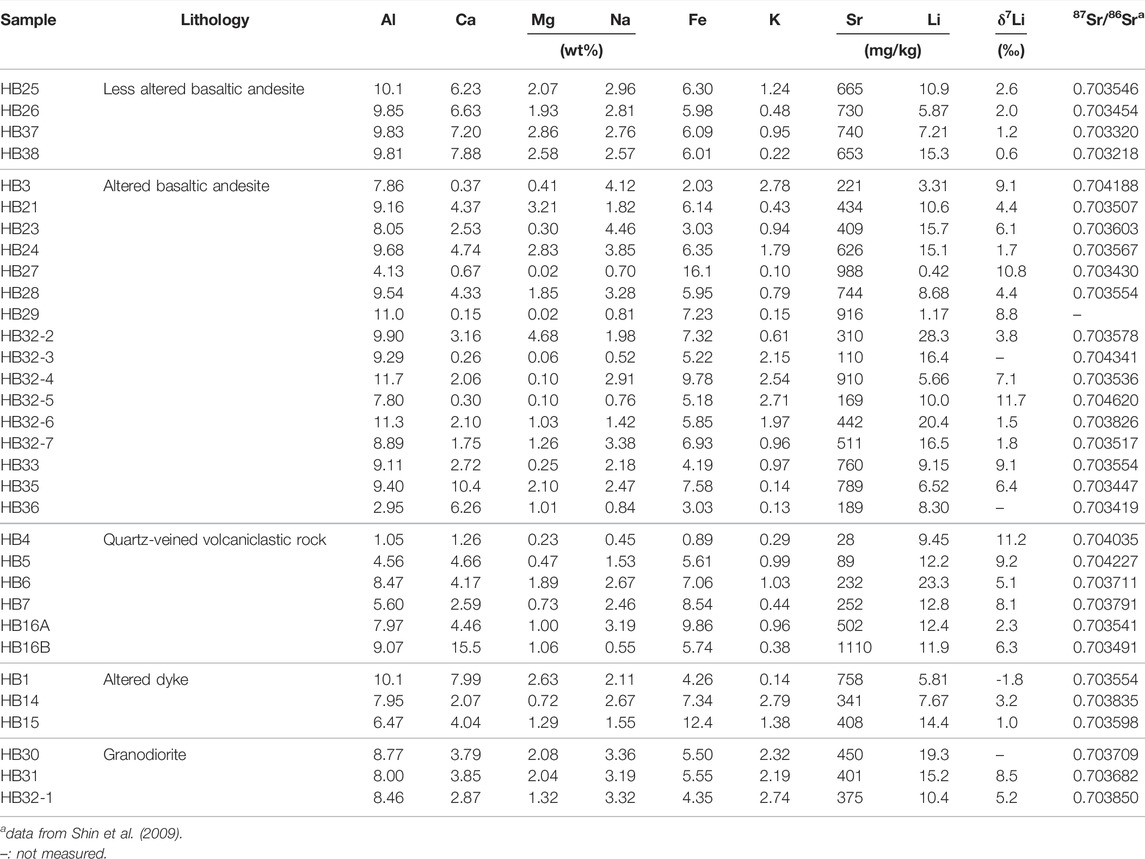
TABLE 4. Elemental and isotopic compositions for bedrocks.
3.1 General and Major Element Chemistry of Water Samples
The pH of most of water samples ranges from 5.69 to 8.72 except for four meltwater samples (K−6–9), which display much low pH (∼4.41). The EC of meltwaters (n=28) and lake waters (n=5) ranges from 48.1 to 269.9 μs/cm and from 61.5 to 4,944 μs/cm, respectively. On an average molar basis (Figure 2), major cation abundances of meltwater samples follow the order of Na+ (74%) > Ca2+ (15%) > Mg2+ (10%) > K+ (2%), while lake samples follow the order of Na+ (81%) > Mg2+ (9%) > Ca2+ (8%) > K+ (2%). Major anion abundances of meltwater samples follow the order of Cl− (69%) > HCO3− (19%) > SO42− (13%), whereas lake samples follow the order of Cl− (85%) > SO42− (8%) > HCO3− (7%). The high abundances of Na+ and Cl−, and the strong correlation between them (r2 = 0.99) suggest that water chemistry is mainly controlled by marine aerosol.
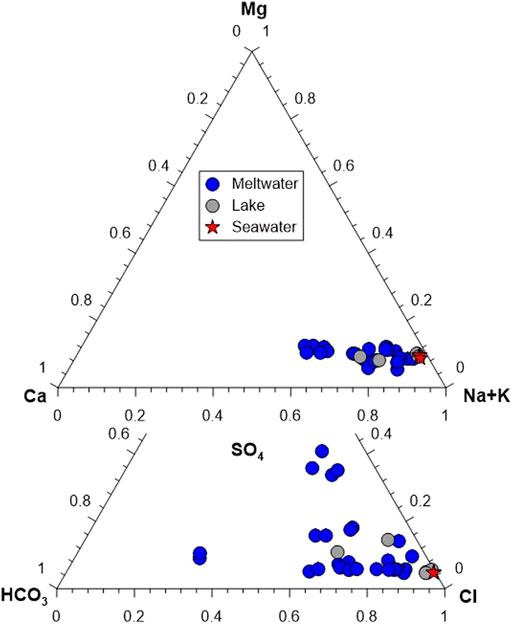
FIGURE 2. Ternary diagrams showing the relative molar abundances of cation and anion in the water samples.
3.2 Major Element Chemistry of Solid Phases
The compositions of the suspended sediment samples are, on average, different from those of rock (Hur et al., 2001) and soil samples. Based on the average wt%. (Tables 2–4), major cation abundances of the suspended sediment samples collected in meltwater follow the order of Na (37%) > Al (33%) > Fe (16%) > Ca (6%) > Mg (4%) = K (4%), whereas rocks and soils follow the order of Al (35%) > Fe (27%) > Ca (17%) > Na (10%) > Mg (6%) > K (5%), and Al (40%) > Fe (26%) > Ca (12%) > Na (10%) > Mg (7%) > K (5%), respectively.
3.3 Strontium and Lithium Isotopes
The 87Sr/86Sr ratios of meltwater, lake and seawater samples range from 0.704554 to 0.707716 with an average of 0.706004 (n = 26), from 0.706274 to 0.709006 with an average of 0.707822 (n = 5), and from 0.709025 to 0.709397 with an average of 0.709186 (n = 3), respectively (Table 1). Previous study showed that rock samples display the 87Sr/86Sr ratios, ranging from 0.703218 to 0.704620 with an average of 0.703685 (Shin et al., 2009).
The rock samples display Li concentrations ranging from 0.42 to 28.3 mg/kg (11.6 mg/kg, n=32) and δ7Li values ranging from −1.8 to +11.7‰ (+5.2‰, n = 29). Compared to rock samples, the soil samples show higher Li concentrations ranging from 9.56 to 36.9 mg/kg (15.9 mg/kg, n = 28) but lower δ7Li values ranging from −2.5 to +6.9‰ (+3.8‰, n = 28). The suspended sediment samples have much lower Li concentrations ranging from 0.011 to 1.4 mg/kg (0.50 mg/kg, n = 28) but higher δ7Li values than soil and rocks, ranging from −0.4 to +13.4‰ (+8.3‰, n = 23). On the contrary, meltwater samples have the lowest Li concentrations ranging from 8.69 to 176 nM (50.6 nM, n = 28) but much higher δ7Li values ranging from +16.4 to +41.1‰ (+26.4‰, n = 27). Lake samples display Li concentrations ranging from 13.1 nM to 2.38 μM (819 nM, n = 5) and also higher δ7Li values ranging from +24.2 to +33.6‰ (+30.5‰, n = 5). Seawater samples have Li concentrations ranging from 5.36 to 23.3 μM (16.8 μM, n = 3) and δ7Li values ranging from +30.6 to +31.5‰ (+31.1‰, n = 3), consistent with reported δ7Li value for seawater (+31‰; Millot et al., 2004) (Figure 3).
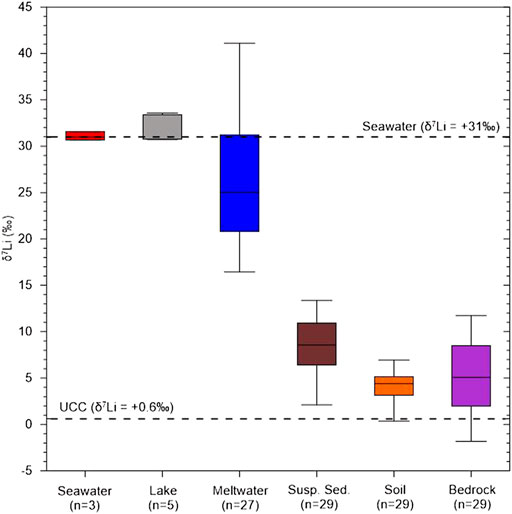
FIGURE 3. Li isotopic compositions in different types of samples collected in this study. Seawater and UCC δ7Li are from Millot et al. (2004) and Sauzéat et al. (2015), respectively.
3.4 Correction of Atmospheric Inputs
In order to constrain the controls on the dissolved Li isotope signatures, it is important to first determine the sources of dissolved Li. Because Li concentrations of meltwater samples are relatively low, it is critical to evaluate the atmospheric contribution before considering either rock or mineral inputs in waters, especially in maritime regions. Given the proximity of the study area to the ocean, it can be assumed that atmospheric input has the same chemical composition as seawater, as shown in other regions (Millot et al., 2010a; Millot et al., 2010b). Solute concentrations in meltwaters were corrected for atmospheric input using the equation as follows:
where
4 Discussion
4.1 Sources of Dissolved Lithium
4.1.1 Atmospheric Inputs
Based on major water chemistry, it is critical to evaluate the atmospheric contribution before considering the effect of either rock or mineral dissolution on meltwater chemistry. The atmospheric contribution to dissolved Li was calculated using Eq. 1 and the average molar ratio of 1000*Li to Cl− in two seawater samples (K−1 & 2; 0.047) as described in Section 3.4. Interestingly, corrected Li concentrations in one sample (K−36) among five lake samples, and eleven samples (K−3–5, K−20–22, K−31–35) among twenty-eight meltwater samples display negative values, highlighting a Li loss. Indeed, this result suggests that dissolved Li was preferentially sorbed into/onto secondary phases. On the contrary, corrected Li in the other samples account for 4%–79% (mean 46%, n = 17) of measured dissolved Li, indicating Li may come from other sources.
4.1.2 Rock Weathering
Several studies have suggested that both phosphatization and sulfurization enhance chemical weathering in Maritime Antarctica (Lopes et al., 2019; Lopes et al., 2021). As it can be assumed that anthropogenic effects on major dissolved ions are negligible in Maritime Antarctica, the major sources for Li corrected from atmospheric input should be related to rock weathering.
A linear correlation between (Ca* + Mg*) and (HCO3* + SO4*) in meltwater samples suggests that these ions are mostly derived from chemical weathering by carbonic and sulphuric acids (Figure 4A). Interestingly, four samples plotted on high SO4 (K−6–9) display low pH (∼4.4), indicating that the sulphuric acid produced by sulphide oxidation is a major agent. Likewise, a plot of Mg/Na and Ca/Na ratios shows that meltwater samples plot near the silicate end member (Figure 4B), likely indicating that silicate weathering is dominant with a little carbonate weathering.
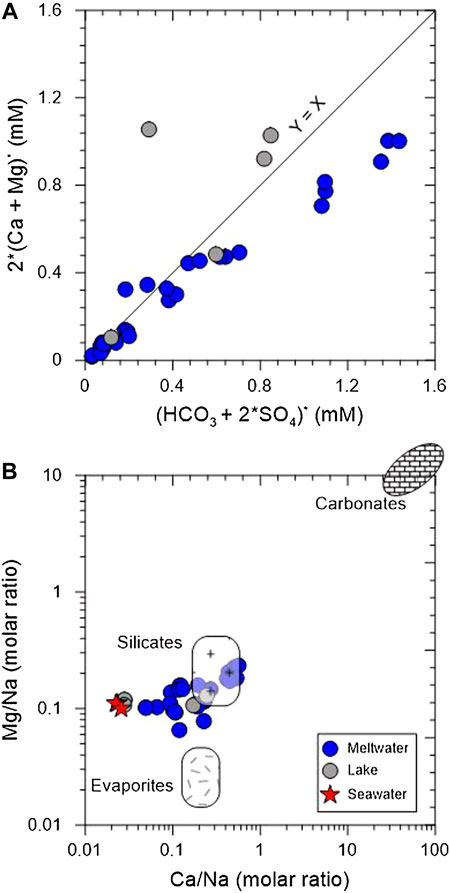
FIGURE 4. Plots of (Ca + Mg)* and (HCO3 + SO4)* (A) and Mg/Na versus Ca/Na (B). Asterisk represents the concentration corrected for atmospheric input. Bedrock endmembers are from Gaillardet et al. (1999).
It has been shown that Li is correlated to Mg in world river waters due to similar ionic radii between Li+ (0.78Å) and Mg2+ (0.72Å), allowing Li to substitute for Mg in silicate minerals (Huh et al., 1998). Corrected Li concentrations in meltwater are in general proportional to Mg/Na ratios but poorly correlated with K/Na ratios even though K comes from silicate weathering (not shown). This suggests the tendency of Li to be preferentially retained in secondary phases, substituting for Mg2+ or occupying the vacancy generated by Mg2+ substitution of Al3+ (Huh et al., 1998). In contrast, K preferentially remain in the dissolved phase.
4.2 Li Isotope Fractionation During Weathering
4.2.1 High δ7Li in Meltwaters
The incorporation of Li into/onto secondary phases may results in Li isotope fractionation explaining the enrichment of 7Li in the meltwater samples. However, as sea salt may also have high δ7Li values, it is important to elucidate whether high δ7Li values in meltwater result from isotope fractionation or source effects with high δ7Li value.
The meltwater δ7Li values ranging from +16.4 to +41.1‰ (26.4‰, n = 27) are significantly higher than those of suspended sediments, rocks, and soils. As described in Section 3.3, there is a clear difference in 87Sr/86Sr ratios among water samples. Furthermore, the negative correlation between 87Sr/86Sr ratios and Sr/Na (molar ratio) reflects that water chemistry is mainly controlled by a simple binary mixing between seawater and silicate weathering (Figure 5A). Likewise, it might be expected that a binary mixing affects both Li concentrations and δ7Li values in meltwater samples because Li contents in carbonates are negligible. As shown in the correlation between 87Sr/86Sr ratios and Sr/Na, it seems that the correlation between δ7Li and Li/Na (molar ratio) also reflect a binary mixing between seawater and silicate weathering (Figure 5B). However, there is a little correlation between δ7Li and 87Sr/86Sr ratios (Figure 5C), indicating a simple binary mixing cannot explain Li isotopic compositions in meltwater.
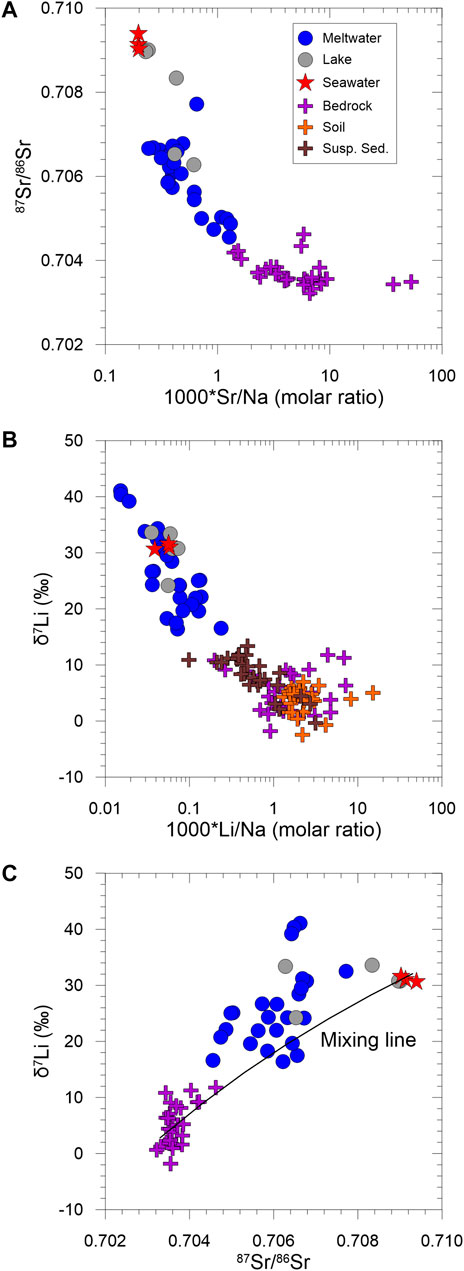
FIGURE 5. Plots of 87Sr/86Sr ratios versus Sr/Na (molar ratio) (A), δ7Li versus Li/Na (molar ratio) (B) and δ7Li versus 87Sr/86Sr ratios (C). Bedrock 87Sr/86Sr ratios are from Shin et al. (2009).
If a binary mixing controls δ7Li values in meltwater samples, one lake and eleven meltwater samples showing negative Li concentration after atmospheric input correction should have seawater δ7Li value because all Li comes from seawater. However, their δ7Li values range from +24.3‰ to +41.1‰ with an average of +32.9‰ (n = 12), which is higher than seawater δ7Li value (31.3‰; K−1 & 2). The other meltwater samples having excess Li after sweater correction display δ7Li values ranging from +16.4‰ to +29.6‰ with an average of +22.0‰ (n = 16), which is much lower than seawater δ7Li, suggesting a non-negligible contribution from silicate weathering.
As described above, we can assume that the dissolved Li is essentially explained by a binary mixing as follows:
where fsw is a fraction of seawater in total Li concentration and δ7Liweathering is an average δ7Li value of bedrock (+5.2‰; Table 4). The differences in between measured and calculated δ7Li values range from −7.0 to +10.2‰, with an average of +2.3‰ (n = 16), implying that conservative mixing is not a dominant control on δ7Li and process-related fractionation occurs in this system. Below, multiple process-controlled fractionations are considered in more detail.
4.2.2 Rock Weathering and Soil Formation in This Region
Experimental studies have demonstrated that Li isotopes fractionate significantly during weathering processes, mostly during secondary phase neoformation (Vigier et al., 2008; Hindshaw et al., 2019; Zhang et al., 2021). Indeed, rock/mineral dissolution or leaching is a congruent process, not fractionating Li isotopes, except for small and temporary effects related to diffusion (e.g., Verney-Carron et al., 2011). In contrast, Li uptake by secondary phases, such as smectite, kaolinite and Fe-oxides, induce significant isotopic fractionations, resulting in 6Li-enriched secondary phases (Maffre et al., 2020).
As reported in previous studies, if chemical weathering in Barton Peninsula is insignificant (Lee et al., 2004; Lee et al., 2019), Li isotopic compositions of rock and soil should be consistent due to dominant physical weathering and thus little secondary phase formation. However, δ7Li values of bedrock samples (mean +5.2‰, n = 29) are higher than those of soil samples (+3.8‰, n = 28), indicating the existence of secondary phases in soil (Figure 3) with lower δ7Li values. Previous soil study in the Barton Peninsula also showed that interstratified phyllosilicates, such as smectite and vermiculite, and crystalline Fe-oxides (goethite), occur in soil profiles (Lopes et al., 2019). Recent study on soil chronosequences in Hawaii (Ryu et al., 2014) showed that the mineralogical evolution of soil profiles through time is accompanied by progressive δ7Li decrease, resulting from sequestration of Li into 6Li-rich secondary phases. Taken together, this result suggests that secondary mineral formation and sorption into/onto them are the major processes controlling isotope fractionation during soil formation even if the extent of Li isotope fractionation is different from minerals (Vigier et al., 2008).
Although soil samples plot near igneous rock endmember on a plot of Na/Al versus Li/Al (Figure 6A), they plot outside a weathering trend between igneous rocks and shales endmembers on a plot of δ7Li versus Li/Al (Figure 6B), displaying lower δ7Li values than igneous rocks. It clearly supports that a significant modern chemical weathering occurs with mineral neoformation in the Maritime Antarctica.
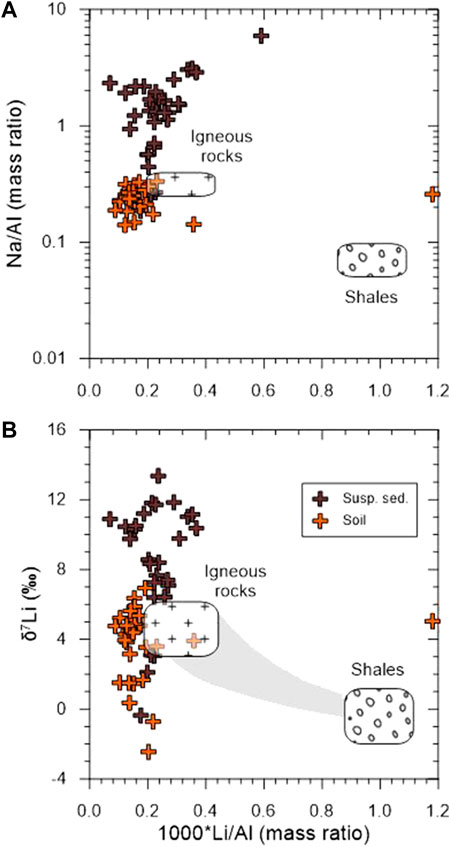
FIGURE 6. Plots of Na/Al (mass ratio) (A) and δ7Li (B) versus Li/Al (mass ratio) in the suspended sediment and soil samples. Bedrock endmembers are from Dellinger et al. (2014).
4.2.3 Suspended Sediments
The δ7Li values of the suspended sediment samples ranging from –0.4 to +13.4‰ (mean +8.3‰, n = 20, Table 2) are higher than those of bedrock (mean +5.2‰) and soil (mean +3.8‰) samples, but much lower than meltwater samples (mean +26.4‰). Due to the high solubility of Na during chemical weathering compared to immobile Al, the Na/Al ratio can be regarded as “a weathering index” (Millot et al., 2010) or an index of the leaching intensity, such as the K/Mg (Bastian et al., 2017; Bastian et al., 2021). A positive correlation between Na/Al and Li/Al ratios suggests that Al-rich phases, such as clays, mainly controls Li concentrations in the suspended sediment (Figure 6A), which conforms observations from the dissolved δ7Li (see previous section). Also, a positive correlation observed in δ7Li and Na/Li ratio shows that the low Na/Li ratios are associated with low δ7Li values (not shown). Applying the modelling developed in previous studies (e.g., Bouchez et al., 2013; Dellinger et al., 2014; Dellinger et al., 2017), this is consistent with the fact that the particle δ7Li values depend on the ratio of dissolution/neoformation. In this context, low δ7Li values could be best explained by either lower dissolution rates or higher neoformation rate. However, more detailed investigations are needed to confirm it.
The fact that δ7Li values of the suspended sediments are higher than those of bedrock and soil samples suggests additional Li input with high δ7Li values. Interestingly, eight suspended sediment samples (mean +10.7‰; K–3–5, 22, and 32–35) collected from meltwater showing a Li loss have much higher δ7Li values than the other samples (+7.4‰). Also, they do not show any correlation between δ7Li and Na/Li ratio with relatively constant δ7Li values regardless of Na/Li ratios. The differences in δ7Li between meltwater and suspended sediment samples (Δ7Liwater-sed) are clearly distinct from between suspended sediments affected by high sea salt input and the others. That is, Δ7Liwater-sed of the former and latter samples are +23.9‰ and +15.5‰, respectively. The results could be explained by the fact that meltwater Li entirely coming from sea salt input is sorbed onto/into secondary phases present in the glaciers, allowing the suspended sediments to be δ7Li higher than those less affected by sea salt input as well as soils and rocks. That is, δ7Li values in the suspended sediments are not simply controlled by incorporating light 6Li that would result in lower δ7Li than rock/soil samples. Instead, they incorporate Li from sea salt with higher δ7Li that finally results in higher δ7Li in the suspended sediments relative to rock/soils.
Although it is difficult to estimate the partitioning of Li transported in the dissolved and particulate load in this study because chemical weathering process is not at steady-state (Vigier et al., 2001), this study clearly suggests that both dissolved and suspended sediment samples reflect Li isotope fractionation occurring presently during chemical weathering which is operating despite icy conditions.
4.3 Comparison With Other Studies in the Polar Regions
Lithium isotope studies have been conducted in the Arctic regions (Vigier et al., 2009; Millot et al., 2010; Wimpenny et al., 2010a) although there is only one study in the Antarctica (Witherow et al., 2010). In order to understand the factors controlling Li isotope fractionation in the dissolved phases, all data plotted on a plot of δ7Li vs. Li/Na (molar ratio) (Figure 7). At first glance, all δ7Li values negatively correlate with Li/Na ratios. Interestingly, three studies (Iceland rivers, Dry Valley, and this study) are distinguished from the others (Mackenzie and Greenland rivers) based on 1000*(Li/Na) = 1, and δ7Li values in the Mackenzie rivers are relatively lower than other studies. This indicates that the stages of chemical weathering control dissolved Li isotopic compositions. That is, either poorly crystalline or short-range order (SRO) minerals, such as Fe-(oxyhydr)oxides, during the incipient stages of chemical weathering could cause fluids to be more 7Li-enriched as shown in Greenland (Wimpenny et al., 2010a) and the Mackenzie basin (Millot et al., 2010), while crystalline secondary phases, such as clays, during relatively late stages could induce relatively low 7Li-enriched fluids as shown in the low-lying plains of the Mackenzie basin (Millot et al., 2010).
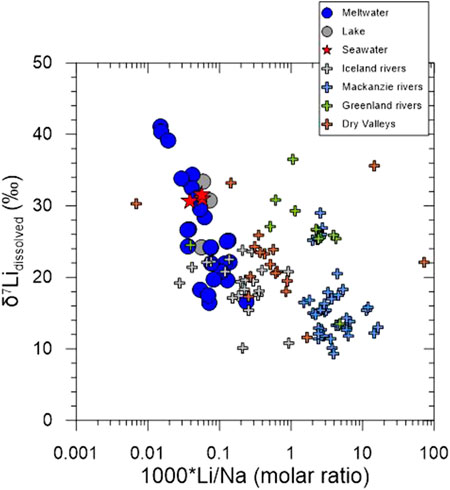
FIGURE 7. Plot of δ7Li versus Li/Na (molar ratio) in the water samples. Data for Iceland, Mackenzie and Greenland rivers, and the McMurdo Dry Valley are from Vigier et al. (2009), Millot et al. (2010), Wimpenny et al. (2010a), and Witherow et al. (2010), respectively.
Although Vigier et al. (2009) suggested that δ7Li values in Icelandic rivers closely correlated with basalt chemical erosion rates where high δ7Li values are associated with low chemical erosion rates but low δ7Li values with greater chemical erosion rates, Millot et al. (2010) argued that δ7Li values in the Mackenzie River Basin are controlled by the weathering regime where incipient weathering in the Rocky Mountains and Shield areas causes high 7Li enrichment in the fluid resulting from the Li uptake by oxyhydroxide phases, whereas relatively low 7Li enrichment is associated with groundwater experienced more intense water-rock interactions forming the secondary phases in the lowlands. On the contrary, δ7Li values in Greenland rivers (both non-glacial and glacial rivers) are mainly controlled by Fe-oxyhydroxides with preferential uptake of 6Li on their surface, where Fe-oxyhydroxides are formed under the ice as a product of sulphide oxidation in the glacial rivers (Wimpenny et al., 2010a). Compared to the Arctic rivers, the McMurdo Dry Valley study suggested dissolved Li isotopic compositions are affected by a mixture of different sources with different δ7Li values (Witherow et al., 2010). Whatever processes controlling dissolved Li isotopic compositions are different in each study, it is consistent that dissolved Li isotopic compositions are enriched in 7Li compared to those of suspended sediment and bedrock due to preferential 6Li uptake by secondary phases. However, relatively higher δ7Li in this study suggest that sea salt Li is sorbed into/onto secondary phases formed during incipient weathering, resulting in much higher dissolved Li isotopic compositions than seawater δ7Li.
Overall, given that the increase in global surface temperature enhances chemical weathering in Antarctica, it is expected that the increase in temperature causes a decrease in Δ7Lisolution–solid (δ7Lisolution – δ7Lisolid) as chemical weathering of bedrocks becomes congruent.
5 Conclusion
Elemental and Li isotope geochemistry of meltwaters, suspended sediments, soils and bedrocks in the Barton Peninsula, King George Island, Antarctica are investigated in order to elucidate the processes controlling Li isotopes in meltwaters. Li concentrations and isotopic compositions are quite variable in the samples, where dissolved phases display the lowest Li concentration but the highest Li isotopic composition. Correlation between elemental and Li isotope geochemistry reveals that dissolved Li isotopic compositions are mainly controlled by incongruent dissolution with secondary neoformation, rather than sea salt inputs from atmosphere or ice melting. Likewise, δ7Li values of soils also are affected by a modern chemical weathering with mineral neoformation rather than a binary weathering between igneous rocks and shales. However, the sorption of sea salt Li into/onto the suspended sediments causes δ7Li values higher than soils and bedrocks. Compared to other studies in polar regions, this study suggests that increasing global surface temperature enhances modern chemical weathering in Antarctica, which cause dissolved Li isotopic compositions to be as low as those in the Arctic rivers.
Data Availability Statement
The original contributions presented in the study are included in the article/supplementary material, further inquiries can be directed to the corresponding author.
Author Contributions
J-SR designed the study, analyzed the samples, interpreted the data, and wrote the manuscript. H-BC and J-HK analyzed the samples. HL and O-SK designed the study and conducted the fieldwork. NV interpreted the data, wrote and reviewed the manuscript. All authors assisted with interpretation.
Funding
J-SR was funded by the National Research Foundation of Korea (NRF) grants funded by the Korea government (MSIT) (No. NRF-2019R1A2C2085973), the Polar Academic Program (PAP; PD14010 and PE15020) of the Korea Polar Research Institute (KOPRI) research grant, and the Korea Basic Science Institute (National research Facilities and Equipment Center) grant funded by the Ministry of Education (No. 2021R1A6C101A415). J-HK was funded by the Korea Ministry of Oceans and Fisheries (NP 2011-040).
Conflict of Interest
The authors declare that the research was conducted in the absence of any commercial or financial relationships that could be construed as a potential conflict of interest.
Publisher’s Note
All claims expressed in this article are solely those of the authors and do not necessarily represent those of their affiliated organizations, or those of the publisher, the editors and the reviewers. Any product that may be evaluated in this article, or claim that may be made by its manufacturer, is not guaranteed or endorsed by the publisher.
References
ACIA (2005). Impacts of a Warming Arctic: Arctic Climate Impact Assessment. Cambridge, UK: Cambridge University Press.
Anderson, S. P., Drever, J. I., Frost, C. D., and Holden, P. (2000). Chemical Weathering in the Foreland of a Retreating Glacier. Geochim. Cosmochim. Acta 64, 1173–1189. doi:10.1016/s0016-7037(99)00358-0
Bastian, L., Mologni, C., Vigier, N., Bayon, G., Lamb, H., Bosch, D., et al. (2021). Co-Variations of Climate and Silicate Weathering in the Nile Basin During the Late Pleistocene. Quat. Sci. Rev. 264, 107012. doi:10.1016/j.quascirev.2021.107012
Bastian, L., Revel, M., Bayon, G., Dufour, A., and Vigier, N. (2017). Abrupt Response of Chemical Weathering to Late Quaternary Hydroclimate Changes in Northeast Africa. Sci. Rep. 7, 44231. doi:10.1038/srep44231
Berner, R. A. (2003). The Long-Term Carbon Cycle, Fossil Fuels and Atmospheric Composition. Nature 426, 323–326. doi:10.1038/nature02131
Bhatia, M. P., Das, S. B., Longnecker, K., Charette, M. A., and Kujawinski, E. B. (2010). Molecular Characterization of Dissolved Organic Matter Associated with the Greenland Ice Sheet. Geochim. Cosmochim. Acta 74, 3768–3784. doi:10.1016/j.gca.2010.03.035
Bouchez, J., Von Blanckenburg, F., and Schuessler, J. A. (2013). Modeling Novel Stable Isotope Ratios in the Weathering Zone. Am. J. Sci. 313, 267–308. doi:10.2475/04.2013.01
Campbell, I. B., and Claridge, G. G. C. (1987). “Antarctica: Soils, Weathering Processes and Environment,” in Developments in Soil Sciences (Amsterdam: Elsevier), 16.
Choi, H.-B., Lim, H. S., Yoon, Y.-J., Kim, J.-H., Kim, O.-S., Yoon, H. I., et al. (2022). Impact of Anthropogenic Inputs on Pb Content of Moss Sanionia Uncinata (Hedw.) Loeske in King George Island, West Antarctica Revealed by Pb Isotopes. Geosci. J. 26, 225–234. doi:10.1007/s12303-021-0032-4
Dellinger, M., Bouchez, J., Gaillardet, J., Faure, L., and Moureau, J. (2017). Tracing Weathering Regimes Using the Lithium Isotope Composition of Detrital Sediments. Geology 45 (5), 411–414. doi:10.1130/g38671.1
Dellinger, M., Gaillardet, J., Bouchez, J., Calmels, D., Galy, V., Hilton, R. G., et al. (2014). Lithium Isotopes in Large Rivers Reveal the Cannibalistic Nature of Modern Continental Weathering and Erosion. Earth Planet. Sci. Lett. 401, 898 359–372. doi:10.1016/j.epsl.2014.05.061
Feth, J. H. (1981). Chloride in Natural Continental Water-A Review. Washington, D.C.: USGS Water Supply Paper, 2176.
Fortner, S. K., Tranter, M., Fountain, A., Lyons, W. B., and Welch, K. A. (2005). The Geochemistry of Supraglacial Streams of Canada Glacier, Taylor Valley (Antarctica), and Their Evolution into Proglacial Waters. Aquat. Geochem. 11, 391–412. doi:10.1007/s10498-004-7373-2
Freeman, C., Evans, C. D., Monteith, D. T., Reynolds, B., and Fenner, N. (2001). Export of Organic Carbon from Peat Soils: Warmer Conditions May be to Blame for the Exodus of Peatland Carbon to the Oceans. Nature 412, 785. doi:10.1038/35090628
Gaillardet, J., Dupré, B., Louvat, P., and Allègre, C. J. (1999). Global Silicate Weathering and CO2 Consumption Rates Deduced from the Chemistry of Large Rivers. Chem. Geol. 159, 3–30. doi:10.1016/s0009-2541(99)00031-5
Harris, K. J., Carey, A. E., Lyons, W. B., Welch, K. A., and Fountain, A. G. (2007). Solute and Isotope Geochemistry of Subsurface Ice Melt Seeps in Taylor Valley, Antarctica. Geol. Soc. Am. Bull. 119, 548–555. doi:10.1130/b25913.1
Hindshaw, R. S., Tosca, R., Goût, T. L., Farnan, I., Tosca, N. J., and Tipper, E. T. (2019). Experimental Constraints on Li Isotope Fractionation During Clay Formation. Geochim. Cosmochim. Acta 250, 219–237. doi:10.1016/j.gca.2019.02.015
Huang, K.-F., You, C.-F., Liu, Y.-H., Wang, R.-M., Lin, P.-Y., and Chung, C.-H. (2010). Low-Memory, Small Sample Size, Accurate and High-Precision Determinations of Lithium Isotopic Ratios in Natural Materials by MC-ICP-MS. J. Anal. At. Spectrom. 25, 1019–1024. doi:10.1039/b926327f
Huh, Y., Chan, L.-H., and Edmond, J. M. (2001). Lithium Isotopes as a Probe of Weathering Processes: Orinoco River. Earth Planet. Sci. Lett. 194, 189–199. doi:10.1016/s0012-821x(01)00523-4
Huh, Y., Chan, L.-H., Zhang, L., and Edmond, J. M. (1998). Lithium and its Isotopes in Major World Rivers: Implications for Weathering and the Oceanic Budget. Geochim. Cosmochim. Acta 62, 2039–2051. doi:10.1016/s0016-7037(98)00126-4
Hur, S.-D., Lee, J.-I., Hwang, J., and Choe, M.-Y. (2001). K-Ar Age and Geochemistry of Hydrothermal Alteration in the Barton Peninsula, King George Island, Antarctica. Ocean. Polar Res. 23, 11–21. (In Korean with English Abstract).
Jacobson, A. D., and Blum, J. D. (2003). Relationship Between Mechanical Erosion and Atmospheric CO2 Consumption in the New Zealand Southern Alps. Geology 31, 865–868. doi:10.1130/g19662.1
Jiahong, W., Jiancheng, K., Jiankang, H., Zichu, X., Leibao, L., and Dali, W. (1998). Glaciological Studies on King George Island Ice Cap, South Shetland Islands, Antarctica. Ann. Glaciol. 27, 105–109.
Kim, J. H., Ahn, I.-Y., Lee, K. S., Chung, H., and Choi, H.-G. (2007). Vegetation of Barton Peninsula in the Neighbourhood of King Sejong Station (King George Island, Maritime Antarctic). Polar Biol. 30, 903–916. doi:10.1007/s00300-006-0250-2
Kling, G. W., Kipphut, G. W., and Miller, M. C. (1991). Arctic Lakes and Streams as Gas Conduits to the Atmosphere: Implications for Tundra Carbon Budgets. Science 251, 298–301. doi:10.1126/science.251.4991.298
Lee, Y. I., Choi, T., and Lim, H. S. (2019). Petrological and Geochemical Compositions of Beach Sands of the Barton and Weaver Peninsulas of King George Island, West Antarctica: Implications for Provenance and Depositional History. Episodes 42, 149–164. doi:10.18814/epiiugs/2019/019012
Lee, Y. I., Lim, H. S., and Yoon, H. I. (2004). Geochemistry of Soils of King George Island, South Shetland Islands, West Antarctica: Implications for Pedogenesis in Cold Polar Regions. Geochim. Cosmochim. Acta 68, 4319–4333. doi:10.1016/j.gca.2004.01.020
Lemarchand, E., Chabaux, F., Vigier, N., Millot, R., and Pierret, M.-C. (2010). Lithium Isotope Systematics in a Forested Granitic Catchment (Strengbach, Vosges Mountains, France). Geochim. Cosmochim. Acta 74, 4612–4628. doi:10.1016/j.gca.2010.04.057
Lim, H. S., Han, M. J., Seo, D. C., Kim, J. H., Lee, J. I., Park, H., et al. (2009). Heavy Metal Concentrations in the Fruticose Lichen Usnea Aurantiacoatra from King George Island, South Shetland Islands, West Antarctica. J. Korean Soc. Appl. Bi. 52, 503–508. doi:10.3839/jksabc.2009.086
Lim, H. S., Park, Y., Lee, J.-Y., and Yoon, H. I. (2014). Geochemical Characteristics of Meltwater and Pondwater on Barton and Weaver Peninsulas of King George Island, West Antarctica. Geochem. J. 48, 409–422. doi:10.2343/geochemj.2.0316
Liu, X.-M., Wanner, C., Rudnick, R. L., and McDonough, W. F. (2015). Processes Controlling δ7Li in Rivers Illuminated by Study of Streams and Groundwaters Draining Basalts. Earth Planet. Sci. Lett. 409, 212–224. doi:10.1016/j.epsl.2014.10.032
Lopes, D. D. V., Schaefer, C. E. G. R., Souza, J. J. L. L. D., Oliveira, F. S. D., Simas, F. N. B., Daher, M., et al. (2019). Concretionary Horizons, Unusual Pedogenetic Processes and Features of Sulfate Affected Soils from Antarctica. Geoderma 347, 13–24. doi:10.1016/j.geoderma.2019.03.024
Lopes, D. D. V., Souza, J. J. L. L. D., Simas, F. N. B., Oliveira, F. S. D., and Schaefer, C. E. G. R. (2021). Hydrogeochemistry and Chemical Weathering in a Periglacial Environment of Maritime Antarctica. Catena 197, 104959. doi:10.1016/j.catena.2020.104959
Ludwig, T., Marschall, H. R., Pogge von Strandmann, P. A. E., Shabaga, B. M., Fayek, M., and Hawthorne, F. C. (2011). A Secondary Ion Mass Spectrometry (SIMS) Re-Evaluation of B and Li Isotopic Compositions of Cu-Bearing Elbaite from Three Global Localities. Mineral. Mag. 75, 2485–2494. doi:10.1180/minmag.2011.075.4.2485
Lyons, W. B., Frape, S. K., and Welch, K. A. (1999). History of McMurdo Dry Valley Lakes, Antarctica, from Stable Chlorine Isotope Data. Geology 27, 527–530. doi:10.1130/0091-7613(1999)027<0527:homdvl>2.3.co;2
Lyons, W. B., Welch, K. A., Snyder, G., Olesik, J., Graham, E. Y., Marion, G. M., et al. (2005). Halogen Geochemistry of the McMurdo Dry Valleys Lakes, Antarctica: Clues to the Origin of Solutes and Lake Evolution. Geochim. Cosmochim. Acta 69, 305–323. doi:10.1016/j.gca.2004.06.040
Maffre, P., Goddéris, Y., Vigier, N., Moquet, J.-S., and Carretier, S. (2020). Modelling the Riverine δ7Li Variability Throughout the Amazon Basin. Chem. Geol. 532, 119336. doi:10.1016/j.chemgeo.2019.119336
Magna, T., Wiechert, U. H., and Halliday, A. N. (2004). Low-Blank Isotope Ratio Measurement of Small Samples of Lithium Using Multiple-Collector ICPMS. Int. J. Mass Spectrom. 239, 67–76. doi:10.1016/j.ijms.2004.09.008
Millot, R., Guerrot, C., and Vigier, N. (2004). Accurate and High-Precision Measurement of Lithium Isotopes in Two Reference Materials by MC-ICP-MS. Geostand. Geoanal. Res. 28, 153–159. doi:10.1111/j.1751-908x.2004.tb01052.x
Millot, R., Petelet-Giraud, E., Guerrot, C., and Négrel, P. (2010b). Multi-Isotopic Composition (δ7Li–δ11B–δD–δ18O) of Rainwaters in France: Origin and Spatio-Temporal Characterization. Appl. Geochem. 25, 1510–1524. doi:10.1016/j.apgeochem.2010.08.002
Millot, R., Vigier, N., and Gaillardet, J. (2010a). Behaviour of Lithium and its Isotopes During Weathering in the Mackenzie Basin, Canada. Geochim. Cosmochim. Acta 74, 3897–3912. doi:10.1016/j.gca.2010.04.025
Moriguti, T., and Nakamura, E. (1998). Across-Arc Variation of Li Isotopes in Lavas and Implications for Crust/Mantle Recycling at Subduction Zones. Earth Planet. Sci. Lett. 163, 167–174. doi:10.1016/s0012-821x(98)00184-8
Nishio, Y., and Nakai, S. i. (2002). Accurate and Precise Lithium Isotopic Determinations of Igneous Rock Samples Using Multi-Collector Inductively Coupled Plasma Mass Spectrometry. Anal. Chim. Acta 456, 271–281. doi:10.1016/s0003-2670(02)00042-9
Oechel, W. C., Hastings, S. J., Vourlrtis, G., Jenkins, M., Riechers, G., and Grulke, N. (1993). Recent Change of Arctic Tundra Ecosystems from a Net Carbon Dioxide Sink to a Source. Nature 361, 520–523. doi:10.1038/361520a0
Park, B.-K., Chang, S.-K., Yoon, H. I., and Chung, H. (1998). Recent Retreat of Ice Cliffs, King George Island, South Shetland Islands, Antarctic Peninsula. Ann. Glaciol. 27, 633–635. doi:10.3189/1998aog27-1-633-635
Pistiner, J. S., and Henderson, G. M. (2003). Lithium-Isotope Fractionation During Continental Weathering Processes. Earth Planet. Sci. Lett. 214, 327–339. doi:10.1016/s0012-821x(03)00348-0
Pogge von Strandmann, P. A. E., Burton, K. W., James, R. H., van Calsteren, P., and Gislason, S. R. (2010). Assessing the Role of Climate on Uranium and Lithium Isotope Behaviour in Rivers Draining a Basaltic Terrain. Chem. Geol. 270, 227–239. doi:10.1016/j.chemgeo.2009.12.002
Pogge von Strandmann, P. A. E., Burton, K. W., James, R. H., van Calsteren, P., Gíslason, S. R., and Mokadem, F. (2006). Riverine Behaviour of Uranium and Lithium Isotopes in an Actively Glaciated Basaltic Terrain. Earth Planet. Sci. Lett. 251, 134–147. doi:10.1016/j.epsl.2006.09.001
Rudnick, R. L., Tomascak, P. B., Njo, H. B., and Gardner, L. R. (2004). Extreme Lithium Isotopic Fractionation During Continental Weathering Revealed in Saprolites from South Carolina. Chem. Geol. 212, 45–57. doi:10.1016/j.chemgeo.2004.08.008
Ryu, J.-S., and Jacobson, A. D. (2012). CO2 Evasion from the Greenland Ice Sheet: A New Carbon Climate Feedback. Chem. Geol. 320-321, 80–95. doi:10.1016/j.chemgeo.2012.05.024
Ryu, J.-S., Vigier, N., Lee, S.-W., Lee, K.-S., and Chadwick, O. A. (2014). Variation of Lithium Isotope Geochemistry During Basalt Weathering and Secondary Mineral Transformations in Hawaii. Geochim. Cosmochim. Acta 145, 103–115. doi:10.1016/j.gca.2014.08.030
Santos, I. R., Fávaro, D. I. T., Schaefer, C. E. G. R., and Silva-Filho, E. V. (2007). Sediment Geochemistry in Coastal Maritime Antarctica (Admiralty Bay, King George Island): Evidence from Rare Earths and Other Elements. Mar. Chem. 107, 464–474. doi:10.1016/j.marchem.2007.09.006
Sauzéat, L., Rudnick, R. L., Chauvel, C., Garçon, M., and Tang, M. (2015). New Perspectives on the Li Isotopic Composition of the Upper Continental Crust and its Weathering Signature. Earth Planet. Sci. Lett. 428, 181–192. doi:10.1016/j.epsl.2015.07.032
Schuur, E. A. G., Bockheim, J., Canadell, J. G., Euskirchen, E., Field, C. B., Goryachkin, S. V., et al. (2008). Vulnerability of Permafrost Carbon to Climate Change: Implications for the Global Carbon Cycle. BioScience 58, 701–714. doi:10.1641/b580807
Serreze, M. C., Barrett, A. P., Stroeve, J. C., Kindig, D. N., and Holland, M. M. (2009). The Emergence of Surface-Based Arctic Amplification. Cryosphere 3, 11–19. doi:10.5194/tc-3-11-2009
Serreze, M. C., and Francis, J. A. (2006). The Arctic Amplification Debate. Clim. Chang. 76, 241–264. doi:10.1007/s10584-005-9017-y
Sharp, M., Tranter, M., Brown, G. H., and Skidmore, M. (1995). Rates of Chemical Denudation and CO2 Drawdown in a Glacier-Covered Alpine Catchment. Geology 23, 61–64. doi:10.1130/0091-7613(1995)023<0061:rocdac>2.3.co;2
Shin, D., Lee, J.-I., Hwang, J., and Hur, S.-D. (2009). Hydrothermal Alteration and Isotopic Variations of Igneous Rocks in Barton Peninsula, King George Island, Antarctica. Geosci. J. 13, 103–112. doi:10.1007/s12303-009-0009-1
IPCC (2007). Climate Change 2007: The Physical Science Basis. Contribution of Working Group I to the Fourth Assessment Report of the Intergovernmental Panel on Climate Change. Editors S. Solomon, D. Qin, M. Manning, Z. Chen, M. Marquis, K. B. Averytet al. (Cambridge, United Kingdom and New York, USA: Cambridge University Press).
Teng, F. Z., McDonough, W. F., Rudnick, R. L., Dalpé, C., Tomascak, P. B., Chappell, B. W., et al. (2004). Lithium Isotopic Composition and Concentration of the Upper Continental Crust. Geochim. Cosmochim. Acta 68, 4167–4178. doi:10.1016/j.gca.2004.03.031
Tomascak, P. B., Tera, F., Helz, R. T., and Walker, R. J. (1999). The Absence of Lithium Isotope Fractionation During Basalt Differentiation: New Measurements by Multicollector Sector ICP-MS. Geochim. Cosmochim. Acta 63, 907–910. doi:10.1016/s0016-7037(98)00318-4
Tranter, M. (2003). “Geochemical Weathering in Glacial and Proglacial Environments,” in Treatise on Geochemistry (Oxford: Pergamon), 189–205. doi:10.1016/b0-08-043751-6/05078-7
Verney-Carron, A., Vigier, N., and Millot, R. (2011). Experimental Determination of the Role of Diffusion on Li Isotope Fractionation During Basaltic Glass Weathering. Geochim. Cosmochim. Acta 75, 3452–3468. doi:10.1016/j.gca.2011.03.019
Vigier, N., Bourdon, B., Turner, S., and Allègre, C. J. (2001). Erosion Timescales Derived from U-Decay Series Measurements in Rivers. Earth Planet. Sci. Lett. 193, 549–563. doi:10.1016/s0012-821x(01)00510-6
Vigier, N., Decarreau, A., Millot, R., Carignan, J., Petit, S., and France-Lanord, C. (2008). Quantifying Li Isotope Fractionation During Smectite Formation and Implications for the Li Cycle. Geochim. Cosmochim. Acta 72, 780–792. doi:10.1016/j.gca.2007.11.011
Vigier, N., Gislason, S. R., Burton, K. W., Millot, R., and Mokadem, F. (2009). The Relationship Between Riverine Lithium Isotope Composition and Silicate Weathering Rates in Iceland. Earth Planet. Sci. Lett. 287, 434–441. doi:10.1016/j.epsl.2009.08.026
Walker, J. C. G., Hays, P. B., and Kasting, J. F. (1981). A Negative Feedback Mechanism for the Long-Term Stabilization of Earth's Surface Temperature. J. Geophys. Res. 86, 9776–9782. doi:10.1029/jc086ic10p09776
Welch, K. A., Lyons, W. B., Whisner, C., Gardner, C. B., Gooseff, M. N., Mcknight, D. M., et al. (2010). Spatial Variations in the Geochemistry of Glacial Meltwater Streams in the Taylor Valley, Antarctica. Antarct. Sci. 22, 662–672. doi:10.1017/s0954102010000702
Wimpenny, J., Burton, K. W., James, R. H., Gannoun, A., Mokadem, F., and Gíslason, S. R. (2011). The Behaviour of Magnesium and its Isotopes During Glacial Weathering in an Ancient Shield Terrain in West Greenland. Earth Planet. Sci. Lett. 304, 260–269. doi:10.1016/j.epsl.2011.02.008
Wimpenny, J., Gíslason, S. R., James, R. H., Gannoun, A., Pogge von Strandmann, P. A. E., and Burton, K. W. (2010b). The Behaviour of Li and Mg Isotopes During Primary Phase Dissolution and Secondary Mineral Formation in Basalt. Geochim. Cosmochim. Acta 74, 5259–5279. doi:10.1016/j.gca.2010.06.028
Wimpenny, J., James, R. H., Burton, K. W., Gannoun, A., Mokadem, F., and Gíslason, S. R. (2010a). Glacial Effects on Weathering Processes: New Insights from the Elemental and Lithium Isotopic Composition of West Greenland Rivers. Earth Planet. Sci. Lett. 290, 427–437. doi:10.1016/j.epsl.2009.12.042
Witherow, R. A., Lyons, W. B., and Henderson, G. M. (2010). Lithium Isotopic Composition of the McMurdo Dry Valleys Aquatic Systems. Chem. Geol. 275, 139–147. doi:10.1016/j.chemgeo.2010.04.017
You, C.-F., and Chan, L.-H. (1996). Precise Determination of Lithium Isotopic Composition in Low Concentration Natural Samples. Geochim. Cosmochim. Acta 60, 909–915. doi:10.1016/0016-7037(96)00003-8
Zhang, X., Saldi, G. D., Schott, J., Bouchez, J., Kuessner, M., Montouillout, V., et al. (2021). Experimental Constraints on Li Isotope Fractionation During the Interaction Between Kaolinite and Seawater. Geochim. Cosmochim. Acta 292, 333–347. doi:10.1016/j.gca.2020.09.029
Keywords: Li isotopes, chemical weathering, meltwater, mineral neoformation, Antarctica
Citation: Ryu J-S, Lim HS, Choi H-B, Kim J-H, Kim O-S and Vigier N (2022) Lithium Isotope Geochemistry in the Barton Peninsula, King George Island, Antarctica. Front. Earth Sci. 10:913687. doi: 10.3389/feart.2022.913687
Received: 06 April 2022; Accepted: 21 June 2022;
Published: 22 July 2022.
Edited by:
Kang-Jun Huang, Northwest University, ChinaReviewed by:
Zhangdong Jin, Institute of Earth Environment (CAS), ChinaShijun Jiang, Hohai University, China
Copyright © 2022 Ryu, Lim, Choi, Kim, Kim and Vigier. This is an open-access article distributed under the terms of the Creative Commons Attribution License (CC BY). The use, distribution or reproduction in other forums is permitted, provided the original author(s) and the copyright owner(s) are credited and that the original publication in this journal is cited, in accordance with accepted academic practice. No use, distribution or reproduction is permitted which does not comply with these terms.
*Correspondence: Jong-Sik Ryu, am9uZ3Npa3J5dUBwa251LmFjLmty