 Hongyu Chen
 Bo Zhou*
- College of Architecture and Environment, Sichuan University, Chengdu, China
The wind-driven rain model based on the Eulerian multiphase model is the most widely used in engineering applications of green buildings. In this study, a real-world case of wind-driven rain was simulated using a wind-driven rain solver based on the Eulerian multiphase model developed by OpenFOAM. Separation of flow was observed at the front edges of the top of the building in the numerical simulation results, and the separated flow lines reconnected in the middle region of the roof. This type of corner flow with separation produces an accelerated horizontal airflow and increases the catch ratio; hence, there is often a larger catch ratio at the windward facades near the roof. The simulation results show that the Eulerian model used in this study possesses adequate capability and accuracy for wind-driven rain simulation.
Introduction
Sustainable utilization of water resource has been a urgent topic around world (Zhang et al., 2021a; Zhang et al., 2021b). Wind-driven rain is a natural phenomenon in which raindrops fall with a nonzero horizontal velocity due to the influence of the wind field to form oblique rain. This oblique rain affects the water and heat exchange properties and material durability of building facades when acting on buildings and is a significant source of moisture for building facades. Its destructive consequences can take many forms, including moisture accumulation in porous materials leading to water seepage, frost damage, moisture-induced salt migration, weathering and discoloration, and cracking of structures due to thermal and moisture gradients. Runoff following wind-driven rain is also a contributing factor to the appearance of surface contamination patterns on facades. Moreover, it has been noted in the literature that the combination of wind and rain has a non-negligible effect on the load effect on the building structure as additional rain loads are generated by raindrops striking building facades (Blocken et al., 2013). Therefore, the study of the wind-driven rain phenomenon is of great significance to the performance design of buildings. Raindrops are constantly in a state of non-equilibrium motion due to gravity and viscous drag during their descent as well as the variation of wind speed, resulting in uncertainty in the velocity of raindrops; this is one of the complexities of the wind-driven rain problem.
Early wind-driven rain studies were based on a semi-empirical approach combining a theoretically derived form with field measurements (Lacy, 1971; Rydock, et al., 2005). The standard meteorological data measured at weather stations were wind speed, wind direction, and horizontal rainfall, and wind-driven rainfall was not usually measured. Therefore, researchers have established semi-empirical relationships between wind-driven rain loads and meteorological parameters (wind speed, wind direction, and horizontal rainfall). The development of the relationships has been guided by experimental observations in which both free wind-driven rain and wind-driven rain on buildings increase in approximate proportion to wind speed and horizontal rainfall. These formulae are semi-empirical in that there is a theoretical basis for their form, but free parameters are chosen to fit the experimental data. The many limitations of this approach, including the difficulties in fully revealing the intrinsic complexity of the wind-driven rain problem associated with using experimental and semi-empirical methods, have led to the increased use of numerical methods in recent research efforts.
Choi (1993) introduced the first Euler–Lagrange method to solve the raindrop trajectory and conducted a wind-driven rain study on two-dimensional and three-dimensional buildings. He proposed a numerical method to simulate wind-driven rain around buildings. This model is made up of two components. The flow around the building is calculated by solving
The discrete model in the Euler–Lagrangian system proposed by previous scholars was once the main method for wind-driven rain studies. However, the disadvantages of this method are obvious: only the relative values at the physical level can be obtained, various field maps such as velocity and pressure fields of low buildings in continuous phase wind fields cannot be obtained similarly, and the pre-processing calculation and post-processing work of the simulation are time-consuming.
Huang and Li (2010) conducted the first numerical simulation study of buildings under the coupling effect of wind and rain using a multiphase model in the Eulerian–Eulerian system. They proposed a new numerical simulation method for wind-driven rain based on the Eulerian multiphase model and verified its accuracy for wind-driven rain coupled with the measured data of windward facades of isolated low-rise buildings reported by Blocken et al. (2013). This model divides the raindrops into several different phases according to their particle size, and, when combined with the wind phase, flow control equations can be established for each phase in the model. The coupling effect of the interacting forces between wind and rain and the gravitational effect of raindrops are incorporated into the model in the form of a term at the right end of the equation, thereby simplifying the setting of the model’s boundary conditions. Kubilay et al. (2013) simulated the wind-driven rain field of a high-rise tower based on the Eulerian multiphase model, then compared and analyzed the calculated results with the field measured data to validate the model, and found that the calculation time required by the Eulerian multiphase model was reduced about 10 times compared with that of the earlier Lagrangian model. Compared with the earlier Eulerian–Lagrangian method, the biggest advantage of wind-driven rain simulation using the Eulerian multiphase model is that the setting of rain phase boundary conditions is simplified; only the volume fraction and the corresponding velocity components of the rain phase are required to be set at the boundary, and the wind-driven rain parameters are relatively easier to obtain (Kubilay et al., 2015a; Kubilay et al., 2015b; Pettersson, 2016). This model also has better method robustness, and the computational time can be reduced significantly. Wang et al. (2020) analyzed the wind-driven rain distribution characteristics of low-rise buildings under typhoons using the Eulerian multiphase model and field measurement, verifying the reliability of the model and the important effects of wind speed, wind direction, and horizontal rainfall intensity. He also found that the wind-driven rain effect received by the windward facade of the building under extreme meteorological conditions is higher than that of the building roof. In recent years, the numerical simulation method based on the Eulerian multiphase model has become extensively used in the field of wind-driven rain research.
In this study, the wind-driven rain solver based on the Eulerian multiphase model developed by OpenFOAM was used to analyze the model solution process and applied to the simulation of a wind-driven rain instance. The numerical results were then compared with experimentally measured results to verify the accuracy and effectiveness of the model and to lay the foundation for future research and development.
Control Equations for Wind-Driven Rain
In this study, the three-dimensional steady-state Reynolds-averaged Navier–Stokes (RANS) equations were used for the wind field control equations, and the renormalization group (RNG)
where
Characterization Parameters of Wind-Driven Rain
The intensity of wind-driven rain is usually expressed in terms of the specific catch ratio
where
Boundary Conditions
The velocity profile of the wind speed at the entrance boundary is determined according to the logarithmic law using the following equation:
where
where
As for the solid wall boundary, the standard wall function (Launder and Spalding, 1983) is used for the simulation, and the wall roughness is corrected by the gravel roughness (Cebeci and Bradshaw, 1977). The relationship between the gravel roughness height
where
The rain phase boundary conditions of the Eulerian model are simpler to set than those of the Lagrangian method, requiring only the volume fraction and initial velocity of the raindrops at the entrance boundary and top boundary. The horizontal velocity of the raindrops is assumed to be equal to the wind speed at the entrance boundary and top boundary; therefore, the relative horizontal velocity of the wind phase and the rain phase at the entrance boundary are zero. The vertical velocity of the rain phase is the vertical landing terminal velocity
The two sides of the computational domain are set as symmetric boundaries, and the exit boundary is set as the pressure exit boundary.
Materials and Methods
A real-world case of wind-driven rain was simulated using a wind-driven rain solver based on the Eulerian multiphase model developed by OpenFOAM (Kubilay et al., 2015a; Kubilay et al., 2015b). The geometric shape of the calculations was as shown in Figure 1. There were two rectangular buildings of 6 m in length and 2 m in width within the computational domain. The height of the upstream building was 2.17 m, the height of the downstream building was 4.29 m, and the distance between the two buildings was 2 m. To obtain calculation results with adequate accuracy, a locally scaled grid was used. The grid was placed on both the top and sides of the windward facades of the building, with a minimum grid size of 0.004 m and a total grid size of about three million.
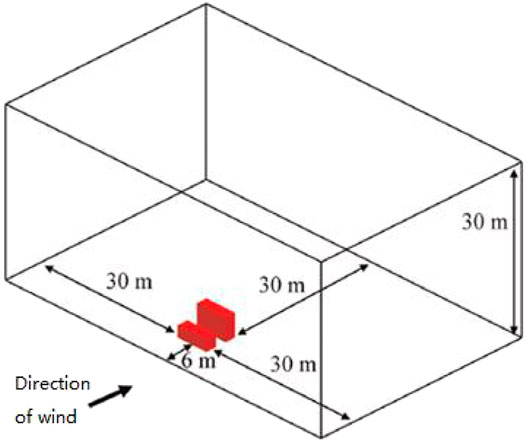
FIGURE 1. Diagram of the computational domain.
The constant wind phase flow field around the building was the first to be simulated in the numerical simulation. A coupled pressure–velocity approach was used for the wind field simulation with the SIMPLE algorithm as the solution algorithm, and the second-order discrete format was used for both the convective and viscous terms in the wind field control equations. In this study, three different inflow velocity conditions were simulated, corresponding to wind speeds of
Results and Discussion
The normalized velocity distribution and flow line distribution of the wind field at different reference velocities were as shown in Figure 2. It can be seen that the normalized velocity at the various locations of the wind field was affected by the reference velocity. The greater the reference velocity, the greater the normalized velocity at the corresponding location of the wind field. The reason for this is that the parameter used here for the normalized velocity is the reference velocity
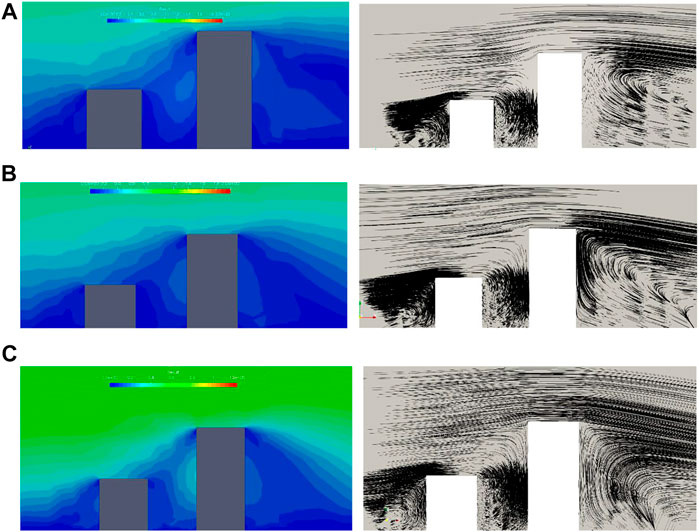
FIGURE 2. Normalized velocity
Figure 3 shows the catch ratio distribution of the building facades at different reference velocities. It can be seen for all wind velocity cases that the catch ratio of the upstream and downstream building facades at the same height was smaller than that of the upstream building at the same location, and the reason for this can be identified by analyzing the flow characteristics of the wind field and rain phase field. It can be seen from the velocity cloud diagrams and flow line diagrams in Figure 2 that the vortex generated in the area between the two buildings extended mainly in the vertical direction, whereas the vortex before the upstream building extended mainly in the horizontal direction. For this reason, the catch ratio of the windward facades of the downstream building was smaller than that of the upstream building at the same height.
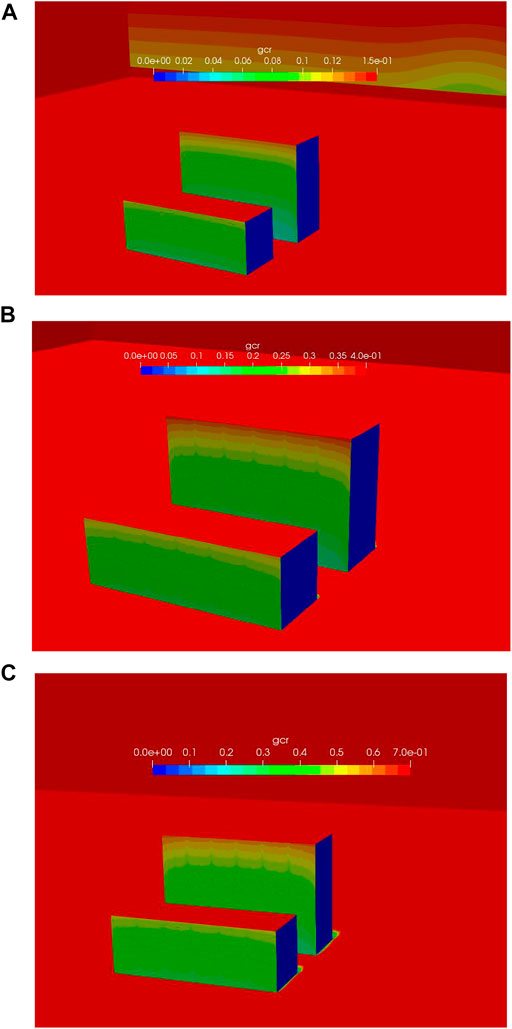
FIGURE 3. Catch ratio distribution of building facades at different reference velocities: (A)
Figure 4 shows the catch ratio distributions of the windward building facades at different reference velocities. It can be seen that all of the catch ratio distributions were high at the top and low at the bottom. This is mainly because the airflow was accelerated near the roof, where corner flow is formed, resulting in greater horizontal velocity and a greater catch ratio, whereas further down the building, the horizontal wind speed became smaller due to obstruction by the building, giving a smaller catch ratio.
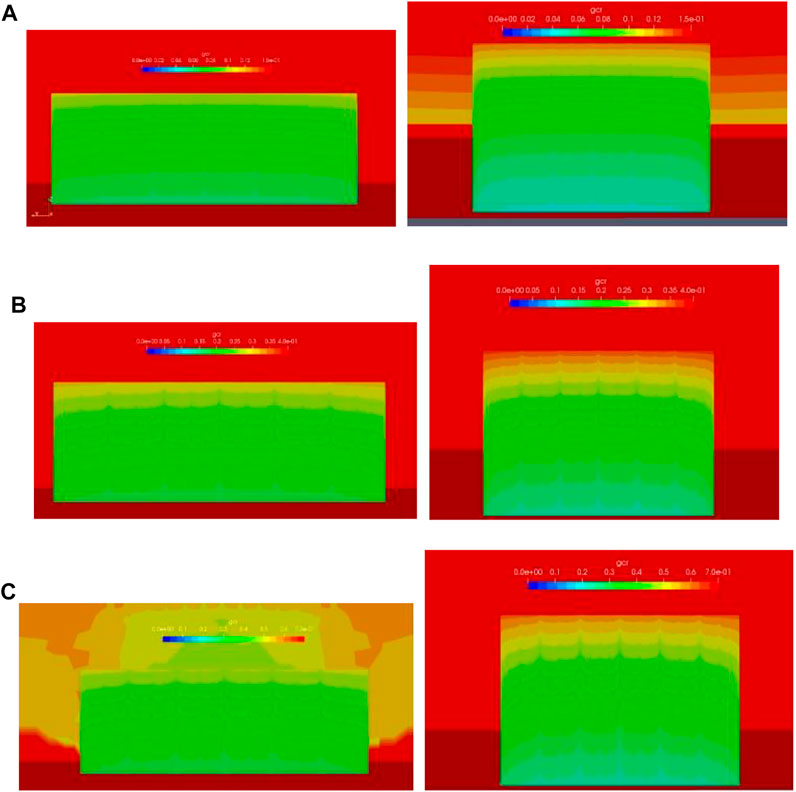
FIGURE 4. Catch ratio distribution of windward building facades at different reference velocities: (A)
The wind-driven rain model developed based on OpenFOAM provided numerical simulation results that model the case study well. Separation of flow was observed at the front edges of the top of the building, and the separated flow lines reconnected in the middle region of the roof. This type of corner flow with separation produces an accelerated horizontal airflow and increases the catch ratio; hence, there is often a larger catch ratio at the windward facades near the roof. Compared with previous work, our work simplified the rain-phase boundary conditions, made it easier to obtain the wind-driven rain parameters, and significantly reduced the computational time. In addition, our simulation results can be a guide for the design of buildings. There was also some limitation in our numerical models. As with most numerical models, our work involves simplifying boundary conditions and material properties during the analysis process, which ignores some factors that may affect the accuracy of the results.
Conclusion
In this study, a numerical simulation of a specific case was performed using a wind-driven rain model developed based on OpenFOAM. The main conclusions are as follows:
1) Separation of flow was observed at the front edges of the top of the two buildings, and the separated flow lines reconnected in the middle region of the roof. Different reference velocities had little effect on the vortex structure of the flow field regardless of the size or location of the vortex.
2) The vortex generated in the area between the two buildings extended mainly in the vertical direction, whereas the vortex before the upstream building extended mainly in the horizontal direction. As a result, the catch ratio of the windward facade of the downstream building is smaller than that of the upstream building at the same height.
3) The airflow was accelerated near the roof, where corner flow was formed, resulting in greater horizontal velocity and a greater catch ratio, whereas further down the building, the horizontal wind speed became smaller due to obstruction by the building, giving a smaller catch ratio.
4) The simulation results suggest that the Eulerian model utilized in this study is capable and accurate enough to simulate wind-driven rain.
Data Availability Statement
The raw data supporting the conclusion of this article will be made available by the authors, without undue reservation.
Author Contributions
HC: Investigation, Methodology, Writing-Original draft preparation. BZ: Validation, Supervision.
Conflict of Interest
The authors declare that the research was conducted in the absence of any commercial or financial relationships that could be construed as a potential conflict of interest.
Publisher’s Note
All claims expressed in this article are solely those of the authors and do not necessarily represent those of their affiliated organizations, or those of the publisher, the editors and the reviewers. Any product that may be evaluated in this article, or claim that may be made by its manufacturer, is not guaranteed or endorsed by the publisher.
References
Best, A. C. (1950). The Size Distribution of Raindrops. Q.J R. Met. Soc. 76 (327), 16–36. doi:10.1002/qj.49707632704
Blocken, B., and Carmeliet, J. (2000a). Driving Rain on Building Envelopes I. Numerical Estimation and Full-Scale Experimental Verification. J. Therm. Envel. Build. Sci. 24 (1), 61–85. doi:10.1106/UJ12-PFHK-VQFP-8GAL
Blocken, B., and Carmeliet, J. (2000b). Driving Rain on Building Envelopes- II. Representative Experimental Data for Driving Rain Estimation. J. Therm. Envelope Build. Sci. 24 (2), 89–110. doi:10.1106/EGXC-T4CL-E8VN-9JRL
Blocken, B., Stathopoulos, T., and Carmeliet, J. (2007). CFD Simulation of the Atmospheric Boundary Layer: Wall Function Problems. Atmos. Environ. 41 (2), 238–252. doi:10.1016/j.atmosenv.2006.08.019
Blocken, B., Derome, D., and Carmeliet, J. (2013). Rainwater Runoff from Building Facades: A Review. Build. Environ. 60 (1), 339–361. doi:10.1016/j.buildenv.2012.10.008
Cebeci, T., and Bradshaw, P. (1977). Momentum Transfer in Boundary Layers. Washington, DC: Hemisphere.
Choi, E. C. C. (1993). Simulation of Wind-Driven-Rain Around a Building. J. Wind Eng. Ind. Aerodyn. 46, 721–729. doi:10.1016/b978-0-444-81688-7.50080-2
Choi, E. C. C. (1999). Wind-driven Rain on Building Faces and the Driving-Rain Index. J. Wind Eng. Ind. Aerodyn. 79 (1), 105–122. doi:10.1016/S0167-6105(97)00296-1
Huang, S. H., and Li, Q. S. (2010). Numerical Simulations of Wind-Driven Rain on Building Envelopes Based on Eulerian Multiphase Model. J. Wind Eng. Industrial Aerodynamics 98 (12), 843–857. doi:10.1016/j.jweia.2010.08.003
Kubilay, A., Derome, D., Blocken, B., and Carmeliet, J. (2013). CFD Simulation and Validation of Wind-Driven Rain on a Building Facade with an Eulerian Multiphase Model. Build. Environ. 61 (1), 69–81. doi:10.1016/j.buildenv.2012.12.005
Kubilay, A., Derome, D., Blocken, B., and Carmeliet, J. (2015a). Numerical Modeling of Turbulent Dispersion for Wind-Driven Rain on Building Facades. Environ. Fluid Mech. 15 (1), 109–133. doi:10.1007/s10652-014-9363-2
Kubilay, A., Derome, D., Blocken, B., and Carmeliet, J. (2015b). Wind-driven Rain on Two Parallel Wide Buildings: Field Measurements and CFD Simulations. J. Wind Eng. Industrial Aerodynamics 146, 11–28. doi:10.1016/j.jweia.2015.07.006
Lacy, R. E. (1971). “An Index of Exposure to Driving Rain,” in Services and Environmental Engineering. Essential Information from the Building Research Establishment (Garston: Construction Press), 232–239.
Launder, B. E., and Spalding, D. B. (1983). “The Numerical Computation of Turbulent Flows,” in Numerical Prediction of Flow, Heat Transfer, Turbulence and Combustion (Pergamon), 96–116. doi:10.1016/b978-0-08-030937-8.50016-7
Ooi, C., Ge, Z., Poh, H. J., and Xu, G. (2020). Assessing Effectiveness of Physical Barriers against Wind-Driven Rain for Different Raindrop Sizes. Eng. Analysis Bound. Elem. 111, 186–194. doi:10.1016/j.enganabound.2019.11.007
Pettersson, K., Krajnovic, S., Kalagasidis, A. S., and Johansson, P. (2016). Simulating Wind-Driven Rain on Building Facades Using Eulerian Multiphase with Rain Phase Turbulence Model. Build. Environ. 106, 1–9. doi:10.1016/j.buildenv.2016.06.012
Rydock, J. P., Lisø, K. R., Førland, E. J., Nore, K., and Thue, J. V. (2005). A Driving Rain Exposure Index for Norway. Build. Environ. 40 (11), 1450–1458. doi:10.1016/j.buildenv.2004.11.018
Wang, X. J., Li, Q. S., and Li, J. C. (2020). Field Measurements and Numerical Simulations of Wind-Driven Rain on a Low-Rise Building during Typhoons. J. Wind Eng. Industrial Aerodynamics 204, 104274. doi:10.1016/j.jweia.2020.104274
Yakhot, V., Orszag, S. A., Thangam, S., Gatski, T. B., and Speziale, C. G. (1992). Development of Turbulence Models for Shear Flows by a Double Expansion Technique. Phys. Fluids A Fluid Dyn. 4 (7), 1510–1520. doi:10.1063/1.858424
Zhang, Y., Dai, Y., Wang, Y., Huang, X., Xiao, Y., and Pei, Q. (2021a). Hydrochemistry, Quality and Potential Health Risk Appraisal of Nitrate Enriched Groundwater in the Nanchong Area, Southwestern China. Sci. Total Environ. 784, 147186. doi:10.1016/J.Scitotenv.2021.147186
Keywords: building design, building facades, wind-driven rain, numerical simulation, catch ratio
Citation: Chen H and Zhou B (2022) Numerical Simulation of Wind-Driven Rain Based on the Eulerian Model. Front. Earth Sci. 10:917514. doi: 10.3389/feart.2022.917514
Received: 11 April 2022; Accepted: 30 May 2022;
Published: 20 June 2022.
Edited by:
Yunhui Zhang, Southwest Jiaotong University, ChinaReviewed by:
Qili Hu, Chengdu University of Technology, ChinaLiting Hao, Beijing University of Civil Engineering and Architecture, China
Copyright © 2022 Chen and Zhou. This is an open-access article distributed under the terms of the Creative Commons Attribution License (CC BY). The use, distribution or reproduction in other forums is permitted, provided the original author(s) and the copyright owner(s) are credited and that the original publication in this journal is cited, in accordance with accepted academic practice. No use, distribution or reproduction is permitted which does not comply with these terms.
*Correspondence: Bo Zhou, enh0MDAxQDE2My5jb20=