 Yun Zhou
 Lisheng Xu1*
 Chunlai Li
 Lihua Fang
 Zhengyang Pan
- 1Institute of Geophysics, China Earthquake Administration, Beijing, China
- 2Institute of Earthquake Forecasting, China Earthquake Administration, Beijing, China
The Xiaojiang fault zone (XJF), located at the southeastern margin of the Tibetan plateau, has been frequently struck by destructive earthquakes throughout history. Some studies showed that repeating earthquakes may be used to estimate fault slip rates and even to monitor the pre-slip prior to large asperity. This study focuses on the repeating earthquakes recorded by a high-density seismic array in the northern section of the XJF, a segment ruptured by the 1733 Dongchuan M7.8 earthquake. Using the waveform cross-correlation and relocation techniques, we processed the continuous seismic recordings from seismic stations of the array and confirmed 27 clusters of repeating earthquakes. The repeaters are located in three relatively independent sub-areas, areas A, B, and C. Area A is close to the source areas of the 2014 Ludian Ms6.5 and the 2020 Qiaojia Ms5.0 earthquakes; by analyzing the recurrence intervals of repeating clusters, we found that the Ludian earthquake had an insignificant triggering effect on surrounding events, while the triggering effect from the Qiaojia earthquake was obvious. The clusters in area B were located very close to the northernmost tip of the XJF, which should be associated with an asperity preparing for a large earthquake on the northern XJF. Together with a repeating cluster identified in a previous study and the seismicity pattern revealed by our seismic array, we determined the geometry of the asperity and slip rate, which further helps to estimate a potential Mw7.1 earthquake for the asperity, where no M>7 earthquakes have occurred since the 1733 Dongchuan M7.8 earthquake. The clusters in area C are more like human-induced earthquakes because they are concentrated during the daytime when local people are at work, and, thus, they cannot be used for the study of tectonic deformation. This study clearly indicates that the repeating earthquakes can be triggered by a moderate earthquake nearby and also that repeating earthquakes can be used to estimate fault slip rates and outline locked asperities.
Introduction
The northward thrusting of the Indian plate has led to the uplift of the Tibetan plateau and lateral extrusion of materials (Molnar and Tapponnier, 1975), and GPS observations indicate that the southeastern plateau is moving eastward and simultaneously rotating clockwise around the Eastern Himalaya Syntaxis (Shen et al., 2005). There are complex tectonics and frequent activity of strong earthquakes in the southeastern boundary of the Tibet Plateau (Wang and Burchfiel, 2000; Xu et al., 2003). The Xiaojiang fault (XJF) zone, one of the segments of the boundary, has played an important role in regulating regional tectonic movement (Wang and Burchfiel, 2000). This active fault is connected to the Zemuhe fault at its northern end and extends more than 400 km to the south (Li, 1993). On the basis of field observations, the fault can be divided into three parts: the northern, central, and southern segments. The northern segment has a strike of approximately 335° and is represented by a single fracture, while in the middle segment, the fault begins to separate into two north–south-striking fault strands from Dongchuan (Li, 1993; Figure 1). In history, XJF has produced a number of middle-to-large earthquakes since 1500 (Shen et al., 2003; Zhang et al., 2003; Wen et al., 2008). For example, the 1733 Dongchuan M7.8 earthquake occurred on the northern XJF, resulting in thousands of casualties (Wang et al., 2017); the 1833 Songming M8 earthquake took place in the middle section of the XJF, which killed more than 6,700 people and injured at least 5,000 people (Li J. et al., 2021). During the nearly 300 years that have transpired since the M7.8 event in 1733, no M>7.0 shock has occurred in the northern XJF zone (Department of Earthquake Disaster Prevention and State Seismological Bureau, 1995).
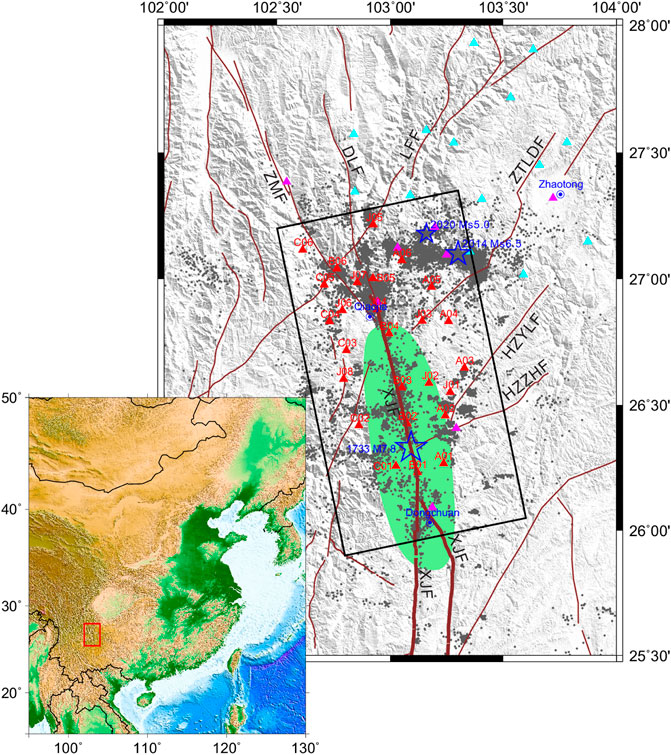
FIGURE 1. Broadband seismic array and the seismic events recorded in the northern XJF, which is emphasized with thick brown lines. The black rectangle represents the study area. Red, cyan, and magenta triangles are seismic stations of Qiaojia array, Zhaotong array, and regional network (Fu et al., 2021), respectively; in the hypoDD-relocated process, we used data from all these stations, but only the waveforms recorded from Qiaojia array are used in the waveform correlations. The red rectangle in the inset at the lower-left corner shows the location of the main plot. Gray dots are the hypoDD-relocated events recorded from March 2012 to July 2021. The blue stars represent the epicenters of the 1733 Dongchuan M7.8 earthquake, the 2014 Ludian Ms6.5 earthquake, and the 2020 Qiaojiang Ms5.0 earthquakes, and the main rupture area of the 1733 Dongchuan M7.8 earthquake (Wen et al., 2008) is indicated with green color. The cities Qiaojia and Dongchuan are marked with blue circled dots. Note: the region of the northern XJF zone is defined by the big black box. Abbreviations: XJF, Xiaojiang fault; ZMF, Zemuhe fault; DLF, Daliangshan fault; LFF, Lianfeng fault; ZTLDF, Zaotong–Ludian fault; The information of Huize–Yiliang fault (HZYLF) and Huize–Zhehai fault (HZZHF) is from Zhuang et al. (2019).
Owing to the tectonic significance and the potential seismic hazard, the slip rate of the XJF has been one of the concerns of geo-scientists for recent decades (Chen and Li, 1988; He et al., 2002; Shen et al., 2005; Wang et al., 2008; Fu et al., 2020). For example, He et al. (2002) gave the whole XJF an estimate of 13.0–16.5 mm/a, and Wen et al. (2011) pointed out that the northern, north-middle, south-middle, and southern segments of the XJF had slip rates of 10 mm/a, 8–9 mm/a, 8 mm/a, and 4 mm/a, respectively, and Jin et al. (2019) estimated a slip rate of 9.5 ± 1.2 mm/a for the whole XJF. However, most of these results are from the observation and analysis of the earth’s surface in space, and the results can only reflect the movement of the surface but lack the slip rate from a certain depth underground. So, it is not enough to analyze the information on tectonic strain accumulation activity at different depths of the fault, especially at a certain depth of the seismogenic zone.
The discovery of repeating earthquakes has provided a new technique to detect the deformation, aseismic slip, and stress accumulation in a fault zone (Vidale et al., 1994; Nadeau and McEvilly, 1999; Turner et al., 2013). Repeating earthquakes are a group of earthquakes that occur at the same fault location with nearly identical magnitudes and highly similar waveforms and source mechanisms (Schaff and Beroza, 2004). Repeating earthquakes may optionally occur on fault planes (Nadeau et al., 1995; Igarashi et al., 2003) or off faults (Igarashi, 2020); however, they reflect a common physical process, that is, silent deformation of the fault zone. Nadeau and Johnson (1998) proposed a mechanism for the occurrence of repeating earthquakes as the repeated rupture of small asperities surrounded by creeping regions, and this mechanism has been verified by some numerical simulation and experimental studies (Anooshehpoor and Brune, 2001; Sammis and Rice, 2001); so, the coseismic strain release of these repeaters can be used in estimation of the strain accumulation or fault slip in fault zones (Vidale et al., 1994; Beeler et al., 2001). Therefore, these repeaters have been called virtual creep-meter (Turner et al., 2013).
Additionally, different from conventional surface observation such as GPS, InSAR, and geological investigations, repeating earthquakes are able to facilitate the direct observation of the deep behavior of fault zones (Nadeau and McEvilly, 2004; Waldhauser et al., 2004). Nadeau and McEvilly (1999) successfully estimated the slip rates of faults at different depths to describe the deformation behavior of deep faults by using seismic moments and intervals of repeating earthquakes in the Parkfield area of the SanAndreas fault. Also, the slip rates in the depth of the fault zone revealed by repeating earthquakes were about 2–3 times those from GPS and geological investigations in the Longmenshan fault zone, where the 2008 Wenchuan M7.9 earthquake occurred unexpectedly (Li et al., 2011). More importantly, repeating earthquakes were often found in proximity with the potential large-size asperities surrounded by stable creeping regions (Lay and Kanamori, 1980; Vidale et al., 1994; Kato and Hirasawa, 1997; Sammis and Rice, 2001).
The repeating earthquakes along the XJF were investigated by Li et al. (2013). In their study, the 1999–2011 seismic recordings from the Yunnan Seismic Network (YSN) were processed, and 29 groups of repeaters were selected by the techniques of waveform correlation and precise earthquake location. The estimates of the slip rates at depths of 3–12 km based on the repeating earthquakes ranged from 1.6–10.1 mm/a, indicating a variation with depths. These results were an important reference for us to continue the work on repeating earthquakes of XJF. However, the seismic stations used in this study were quite sparse, which may lead to missing some of the micro-earthquakes, large errors of event locations, or incomplete statistics of repeaters. In addition, due to the lack of seismic stations in the northern XJF, this study has not yet identified repeating earthquakes that can be used to estimate slip rates in the northern XJF (Li et al., 2013).
To understand the present deformation characteristics of the northern XJF, we set up a broadband seismic array (Qiaojia array) with around 15 km spacing between stations in 2012 (Figure 1). Since then, the array has been kept in good operation and has recorded more than 20,000 earthquakes. In this study, we have focused on the seismicity of the repeating earthquakes which have occurred since 2012, after which no research works involved repeating earthquakes following Li et al. (2013), and discussed their possible implications.
Data and methods
Since March 2012, the Qiaojia array has comprised 26 broadband stations (Figure 1) and has been kept in good operation. The array produced continuous 3-component recordings at a 100 Hz sampling rate. In this study, we processed the continuous recordings from March 2012 to July 2021, during which a total of 26,836 events were recorded, with magnitudes ranging from ML -0.7 to 6.5. Combined with the data recorded from seismic stations of the Zhaotong array and regional network (Figure 1), 22,093 events were successfully relocated using the double-difference location method (Waldhauser and Ellsworth, 2000), with 18,969 events appearing within the black box (Figure 1). The relocation improved the uncertainties of latitude, longitude, and depth to be less than 0.257, 0.241, and 0.424 km, respectively.
The identification and confirmation of repeating earthquakes usually depend on waveform similarity (Uchida, 2019). Therefore, we approximate the time window when candidate phases could appear using the theoretical arrival time of P waves calculated using the TAUP program (Crotwell et al., 1999) and on the local velocity model (Wang et al., 2003). We filtered the vertical component between 1 and 10 Hz as used in previous studies (Li et al., 2011; Schmittbuhl et al., 2016). In order to select high-quality waveforms, we used the recording between 1 and 6 s after the P wave arrival time as the signal and the recording between 1 and 6 s before the P wave arrival time as the noise, calculated the SNR (signal-to-noise ratio), and selected the data with SNR >5 for subsequent processing.
On the basis of the abovementioned works, we selected repeating earthquakes by using the technique of cross-correlation (CC). In this process, we used waveform data recorded from 26 stations of the Qiaojia array. We performed the CC-analysis of all the event signals from the same station, and the event pairs would be identified as repeaters only when the normalized CC value exceeded 0.8. Considering that the P and S phases both are generally included to pass through the CC analysis (Uchida et al., 2003) and that the epicentral distances involved are less than 150 km (Figure 1), we windowed the event signals to be 1s before and 14s after P arrivals and allowed a time shift of no more than 0.5s because of the time errors of P arrivals. After the repeaters were identified, we applied the Hierarchical Clustering algorithm to group the repeaters into clusters and ensured the CC between two repeaters in the same cluster reached a certain threshold (Myhill et al., 2011). In particular, referring to the threshold used in a relevant study (Zhang et al., 2022), we set the thresholds conditionally. The CC values must be either no less than 0.8 at two stations or more than 0.9 at one station. In addition, we guaranteed the time interval between the first and final events in each of the clusters to be more than one year so that the slip rates would be calculated as exactly as possible.
Confirmation of the repeaters
The repeating clusters obtained according to the abovementioned steps still require further quality control. In order to certify the events in the same cluster are real repeaters, we adopted the simplified technique proposed by Li et al. (2011). According to the technique, two repeaters should meet the condition of
In this way, we confirmed 27 multiplets, including a total of 132 events (Figure 2). We checked the CC values among the repeaters in the same cluster and found that all of them are larger than 0.91, and most of them are larger than 0.93. Figure 3 shows a comparison of the complete P and S arrivals at station J07 from cluster R14, which is composed of seven repeaters. The waveforms of all 27 clusters are shown in Supplementary Figures S1–S3.
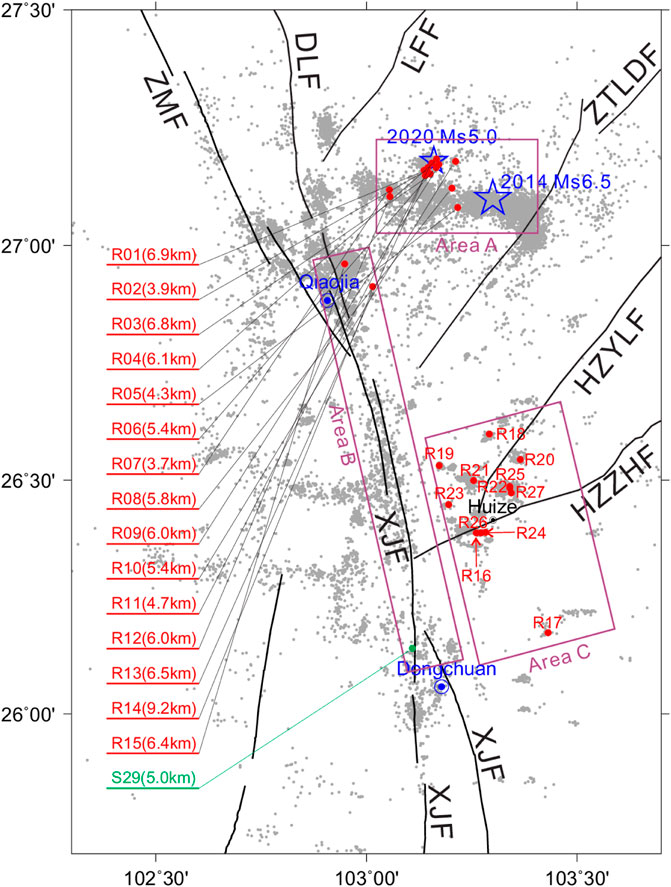
FIGURE 2. Distribution of the repeaters identified from the seismic recordings since 2012. The red dots indicate the clusters of the repeaters, and the numbers in brackets show the depths. The repeaters in area A seem to be related to the 2014 Ludian Ms6.5 earthquake and the 2020 Qiaojiang Ms5.0 earthquake, the repeaters in area B are likely to be associated with the main part of the northern XJF, and the repeaters in area C are related with human activity very probably. The S29 shows the cluster location of the repeaters from Li et al. (2013).
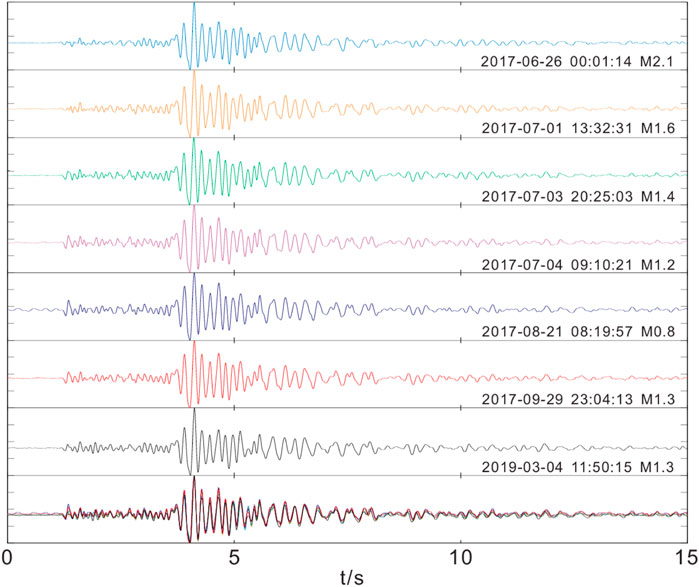
FIGURE 3. Comparison of the seismic recordings (only vertical components) of cluster R14 recorded at station J07. Each of them was normalized by its maximum amplitude. On the bottom are all the recordings of seven repeating earthquakes overlapped together to show how different they are.
The confirmed repeaters appear to be distributed in three sub-areas, A, B, and C, as shown in Figure 2. The repeaters in area A seem to be related to the 2014 Ludian Ms6.5 earthquake and the 2020 Qiaojia Ms5.0 earthquake, the two clusters in area B could be related to the northern XJF, and those in area C may be associated with the two nearby secondary faults, which, however, are eventually interpreted to be induced by human activity (see Discussion section).
After the confirmation of the repeaters, we estimated the slip rates for repeating earthquakes. The estimation of the slip rate based on repeating earthquakes with magnitudes has been conducted in previous studies (Nadeau and McEvilly, 1999; Igarashi et al., 2003; Li et al., 2011; Li et al., 2013). First, the seismic moment was calculated using the magnitude in accordance with an empirical relationship (Abercrombie, 1996):
where M0 is seismic moment and ML is magnitude. Next, the rupture size r was estimated by seismic moment and static stress drop with the circular model (Eshelby, 1957; Kanamori and Anderson, 1975):
where Δσ is static stress drop. Here, we gave the stress drop as 3 Mpa, same as the previous study used in the XJF zone (Li et al., 2013). The slip value d was calculated on the basis of the standard crack model:
where μ is shear modulus, set at 3×10¹⁰N/m2. Finally, the slip rate of the fault was estimated by linearly fitting the cumulative slip amounts of the repeating earthquake sequences. Considering that clusters R01–R13 in the source areas are related to the 2014 Ludian Ms6.5 and 2020 Qiaojia Ms5.0 earthquakes, and our main purpose in area A was to observe the effect of these two mainshocks on the recurrence intervals of repeating clusters; clusters R16–R27 are probably induced by human activity, so we only estimate the slip rates of clusters R14 and R15. Figure 4 presents an example of how to solve the slip rate using the repeating earthquakes, Figure 5 shows the occurrence dates of the repeating earthquakes in various clusters, and Table 1 displays the information of the various clusters. It is of note that the average depth of all the repeaters in the same cluster was adopted because they had overlapped rupture areas but different depths.
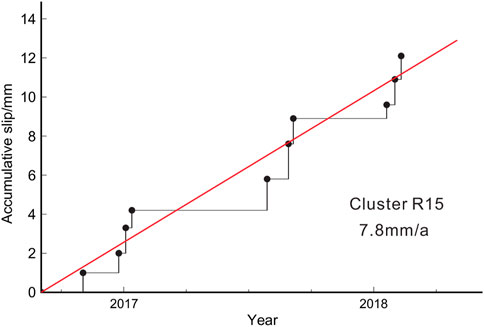
FIGURE 4. An example to illustrate how to estimate the slip rate using repeating earthquakes. The vertical axis shows the cumulative slip amounts calculated using the repeating earthquakes from cluster R15, and the horizontal axis shows the occurrence dates of the repeating earthquakes. Linearly fitting the cumulative slip values produces the red line. Note: the first event is set at the origin point.
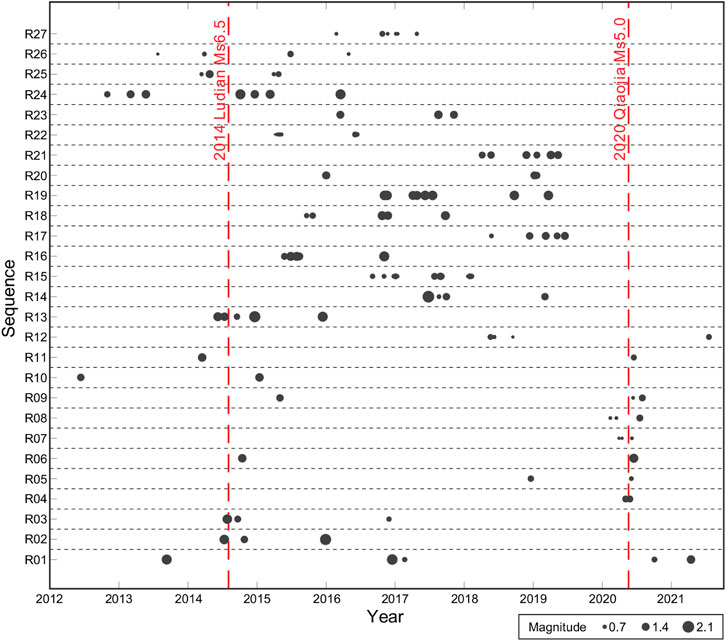
FIGURE 5. Occurrence times of the repeating earthquakes in various clusters. Two discontinuous lines indicate the dates of the 2014 Ludian Ms6.5 earthquake and the 2020 Qiaojia Ms5.0 earthquake.
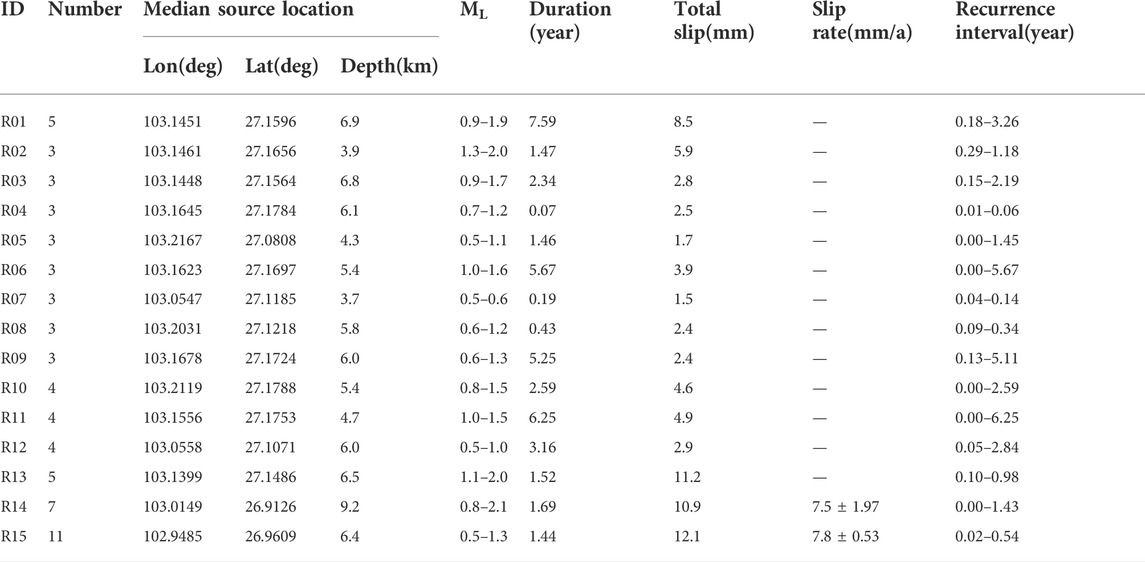
TABLE 1. Information on the clusters of repeating earthquakes in areas A and B.
Discussion
Relationship with the 2014 Ludian Ms6.5 and 2020 Ms5.0 Qiaojia earthquakes
On 3 August 2014, an Ms6.5 earthquake occurred in Ludian, a county of Yunnan province, China. The distribution of aftershocks and the finite fault inversion (Zhang et al., 2015) both showed that this was event caused by two branches of conjugate faults, with one branch having a nearly east–west orientation, whereas the other having a nearly north–south orientation, and the major slip took place on the north–south branch and concentrated in a 15 km area, while only a minor slip occurred on the west–east branch. After that, on 18 May 2020, an Ms5.0 earthquake occurred in Qiaojia, ∼20 km west of the 2014 Ludian Ms6.5 earthquake, which was located on an unmapped fault, and the aftershocks indicated a rupture length of ∼5 km (Fu et al., 2021). Chen et al. (2010) studied the triggering relationship of M4-5 earthquakes on repeating events nearby, and in this research, we also investigated the triggering effect of these two earthquakes on the surrounding repeaters. Chen et al. (2010) considered five recurrence elements (Supplementary Figure S4) for analyses: 1) dt+, the time difference between a major earthquake and the first subsequent recurrence of a repeating event; 2) dt-, the time difference between a major earthquake and the most recent repeating event; 3) Trcos, the recurrence interval spanning the major event (the sum of dt+ and dt-); 4) Trpost, the duration of the first full recurrence interval following the major event; and 5) Trpre, the last recurrence interval just preceding the potential trigger. These elements are divided by the average recurrence interval of a given repeating cluster to obtain the normalized values of dt+*, dt-*, Tr*cos, Tr*post, and Tr*pre. We selected six repeating clusters within 45 km of the Ludian earthquake and nine repeating clusters within 15 km of the Qiaojia earthquake, as the influence zone caused by the mainshock is about 3–5 times its rupture dimension (Chen et al., 2010). Since the numbers of events in each cluster are generally too small to calculate some values of Tr*post and Tr*pre, we mainly studied the variation of dt+* and dt-*. Tables 2, 3 show the results.
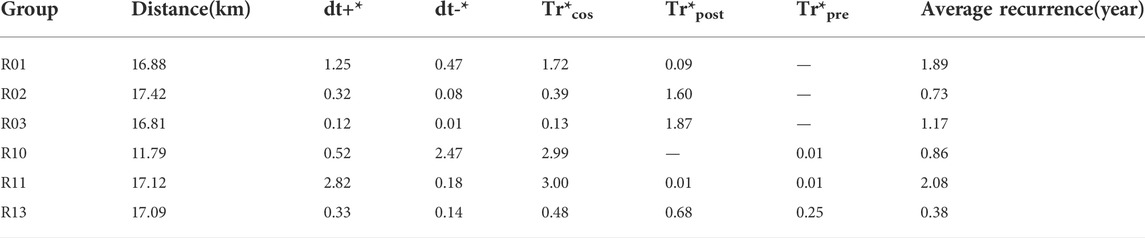
TABLE 2. Parameters (dt+*, dt-*, Tr*cos, Tr*post, and Tr*pre) of 6 clusters related to the Ludian earthquake.
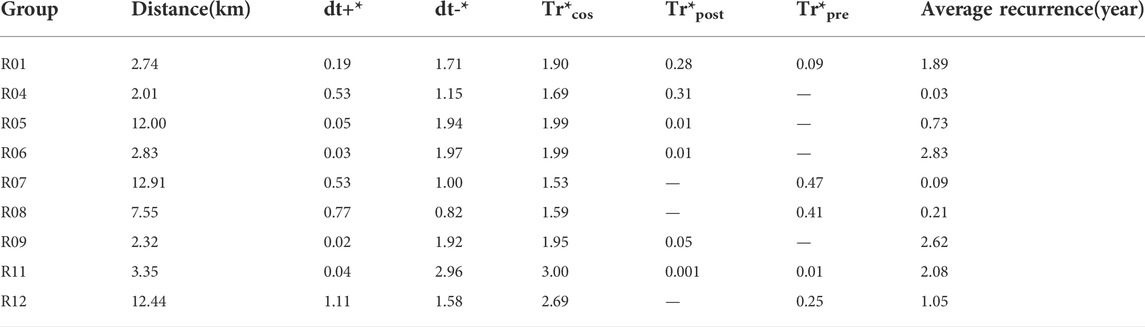
TABLE 3. Parameters (dt+*, dt-*, Tr*cos, Tr*post, and Tr*pre) of 9 clusters related to the Qiaojia earthquake.
Table 2 and Figure 6A show that five of six repeating clusters within 45 km from the Ludian earthquake are at a distance of ∼17 km. The cluster R10 is 11.8 km away from the Ludian earthquake, and the dt+* and dt-* are 0.5 and 2.5, respectively. Chen et al. (2010) believe that a short dt+* along with a high dt-* indicates an obvious triggering effect and also indicates that an event occurred in a late stage of the seismic cycle, so it seems that the triggering effect of the mainshock on the nearest cluster R10 is obvious. But we have to admit that there may be some chance factors here because of the fact that cluster R10 contains four events (Table 1 and Figure 5), and three events occurred in two days (20120614–20120615). For the other five clusters, however, Figure 6B shows that the values of dt+* are greater than the values of dt-*, which indicates that the triggering effect is not obvious.
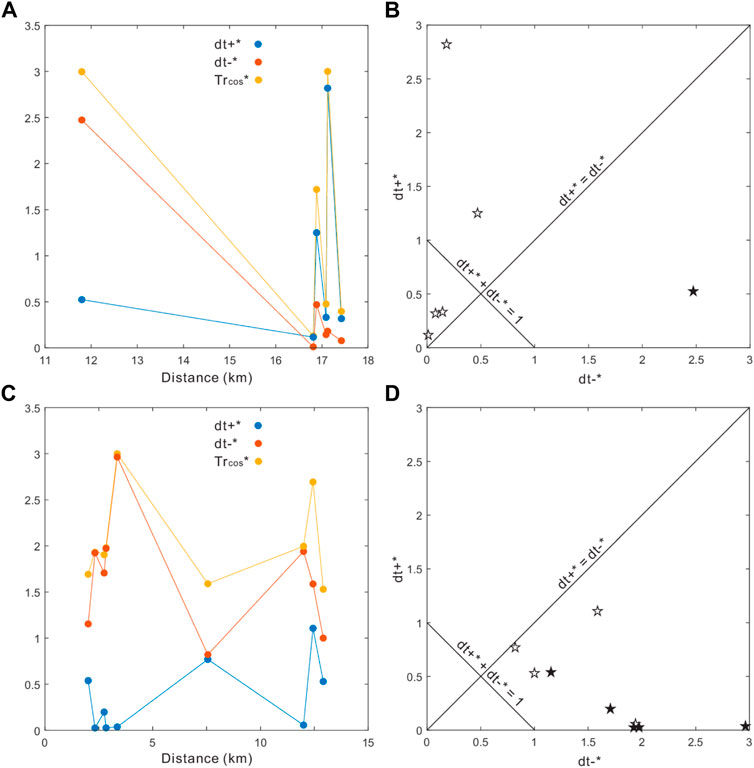
FIGURE 6. Relationship of the dt+*, dt-*, Tr*cos and the distances from the main shock. (A) The parameters dt+*, dt-*, Tr*cos of 6 clusters as a function of distance from the Ludian earthquake. (B) Plot of dt+* versus dt-* for the clusters close to the Ludian earthquake, black filled and open stars indicate the cluster R10 closest to the Ludian earthquake and the other five clusters, respectively. (C) The parameters dt+*, dt-*, Tr*cos of six clusters as a function of distance from the Qiaojia earthquake. (D) Plot of dt+* versus dt-* for the clusters close to the Qiaojia earthquake, black filled and open stars indicate the clusters for the distance range of <5 km and 5–15 km, respectively.
The insignificant triggering effect of the Ludian earthquake on the surrounding repeating clusters may be caused by the following reasons: 1) The epicenter of the Ludian earthquake is at the edge of our study area (Figure 1), leading us to count only the clusters in the western side; 2) The number of the clusters is relatively small (only 6) and few events in each cluster, leading to a higher chance factor in the final statistics; and 3) The clusters are relatively far away from the mainshock and are not located in the direction of the rupture caused by the mainshock, which is not conducive to triggering action.
There are nine repeating clusters within 15 km of the 2020 Qiaojia Ms5.0 earthquake. Calculations show that the pre- and post-seismic recurrence periods for these clusters are 0.40s and 0.11 years, respectively. This suggests that the Qiaojia earthquake significantly shortened the recurrence period of clusters nearby and had a triggering effect on these repeating events. Figure 5 shows that the values of dt-of four clusters (R05, R06, R09, and R11) are all greater than 1 year, but the repeating events occurred immediately after the Qiaojia earthquake, which also indicates an obvious triggering effect. Figure 6C shows that the distributions of dt+* of four in five clusters with a distance < 5 km are below 0.2, and three of them are less than 0.05. However, the distributions of dt+* of three in four clusters with a distance > 5 km are above 0.5. This indicates that the triggering effect on repeaters in the near field is generally greater than that in the far field. Figure 6D shows that the values of dt+* are all smaller than the values of dt-*, combined with the fact that the values of Tr*cos are all greater than 1 (Table 3 and Figure 6C), and we can say that only events relatively late in their respective earthquake cycle get triggered, which is similar to the results of Chen et al. (2010).
Implication to the potential seismic risk on the northern XJF
Since the 1733 Dongchuan M7.8 earthquake, no M>7 earthquakes have occurred on the northern XJF, so significant attention has been paid to this section. Based on the recurrence interval and the elapsed time of the historical strong earthquakes, Wen et al. (2008) delineated the northern XJF (Qiaojia–Dongchuan) as a seismic gap. By means of a three-dimensional finite element model, using the constraints of the GPS observations, the seismological crust and upper mantle models, the data of earthquake activities, tectonic stress field and fault slip rates, and the rheological property of the Sichuan–Yunnan lithosphere, and considering the influence of historically strong earthquakes since A.D. 1327, Zhu et al. (2016) solved for the stress distribution along the Anninghe–Zemuhe–Xiaojiang fault zone and pointed out the northern XJF (Qiaojia–Dongchuan) was one of the high-stress cumulated segments. Coincidently, as shown in Figure 7, the newest seismicity monitored by our high-density seismic array exhibited relatively sparse earthquakes on the fault plane of the northern XJF. In contrast, there is significantly more seismicity to the north, including two repeating clusters (R14 and R15). In the south, Li et al. (2013) identified a repeating earthquake swarm (S29, Figure 7). According to previous studies, repeating earthquakes usually concentrate on the fault segments with high seismicity; therefore, few repeating earthquakes were distributed on the fault segments which are locked and relatively aseismic (Peng and Zhao, 2009; Deng et al., 2020; Li L. et al., 2021). Additionally, it has been found that repeating earthquakes often appear on the outer edge of asperities related to large potential earthquakes (Uchida and Bürgmann, 2019; Li L. et al., 2021). These observations are similar to the scenario exhibited in this study. Owing to the excellent monitoring capability of our seismic array, which is capable to detect and locate an event with magnitude down to Mw-0.7, we judged that the majority part of the northern XJF has been locked as an asperity, where no repeaters are identified and the seismic activity is rather weak. It was found that clusters of repeating earthquakes had once taken place in the vicinity of the rupture areas of the 2008 Wenchuan Mw7.9 and the 2013 Lushan M7.0 earthquakes on the Longmenshan fault zone (Li et al., 2011; Li, 2017), so we believe that the next large earthquake may take place between the clusters of repeating earthquakes to the north and south of the asperity.
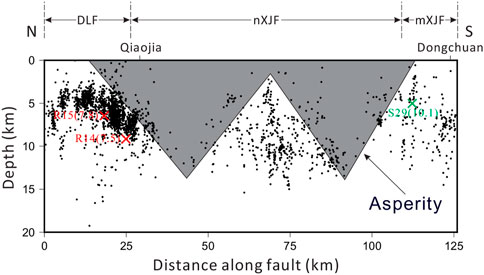
FIGURE 7. Seismicity in a 3 km-thick zone along the northern XJF. The red crosses indicate the clusters R14 and R15 of repeating earthquakes, while the black dots show the hypocenters of all the relocated events. The green cross denotes cluster S29 of repeating earthquakes identified by Li et al. (2013). Abbreviation: DLF, Daliangshan fault; nXJF, northern Xiaojiang fault; mXJF, middle Xiaojiang fault. The possible asperity is shown as an irregular shape.
To estimate the magnitude of the potential earthquake on the northern XJF, we defined the locked asperity, as shown in Figure 7, on the basis of the seismic distribution and the seismicity of both the repeaters and others. Based on geodetic observations, Li Y. et al. (2021) have outlined an asperity on northern XJF, which is generally consistent with our asperity. The slip rate north of the asperity in Figure 7, as clusters R14 and R15 revealed, was 7.7 mm/a (an average of 7.8 mm/a and 7.5 mm/a), which basically agrees with the rate of 6.8 mm/a estimated from near-field GPS observation (Fu et al., 2020). According to the formula of seismic moment
where
The repeating clusters in the east secondary structure zone
A total of 12 clusters of repeaters are confirmed across the junction area of secondary faults southeastern to the northern XJF (area C in Figure 2). We present the earthquake waveforms of these repeating clusters (R16–R27) in Supplementary Figures S2, S3. Compared with the waveforms of other clusters (Supplementary Figures S1, S2), the waveforms of clusters R01–R15 clearly show both P and S phase arrivals, while waveforms of clusters R16–R27 do not. Also, the vertical initial motions of P waves from clusters R16–R27 are all upward, and this is the characteristic of manual blasting. Previous studies have shown that natural and artificial earthquakes can be identified by spectral analysis (Ursino et al., 2001; Allmann et al., 2008). We have also performed spectral analysis of seismic waveforms (Supplementary Figures S5–S10). The three selected events in each figure share similar magnitudes and have similar epicentral distances to the selected stations. Supplementary Figure S5 show that the waveforms of the events in the clusters from area C are richer in low frequencies compared to the waveforms of the events in other clusters, and similar characteristics are also found in S10. However, this phenomenon is less obvious in Supplementary Figures S6–S9. Cattaneo et al. (2014) believed that studying the frequency of daytime and nighttime seismic events could provide a good reference for determining whether an earthquake is artificial or not. We also drew on this analytical approach. First, we paid attention to the occurring times of the events across this area and found a large percentage of the events occurred during daytime (UTC 0200–1200 h), as Figure 8 shows. Specifically, a total of 12 clusters of repeaters were confirmed; however, 9 clusters of them all and most of the events in the other two clusters (R09 and R17) occurred during the daytime. Cluster R27 can be taken as an example. The information in Supplementary Table S1 is from the original earthquake catalogue, and it shows the occurring time of the events in cluster R27; it can be seen that cluster R27 includes six repeating events, and five events occurred almost at UTC 09:50, and this is almost impossible for natural repeating earthquakes. Meanwhile, Supplementary Figure S11 is the histogram showing the hourly distribution of the number of events in area C, and the events were concentrated in two time periods (UTC 0300–0500h; 0900–1200 h), which corresponded to the working hours. All these seem more like an artificially set blast time. In addition, from the photos taken in the field, Supplementary Figure S12 shows the location where the cave was blasted near cluster R22, and Supplementary Figure S13 shows a stone quarry near cluster R24 (Longitude: 103.2720°; Latitude: 26.3873°) and R16 (Longitude: 103.2608°; Latitude: 26.3874°). These photos can be used as evidence for artificial earthquakes. Overall, from the waveform features and occurring times of the events in clusters (R16–R27), we believe that these events are probably induced by human activity. Or, at least, we do not think there are sufficient reasons to judge these repeating events as natural earthquakes because natural earthquakes are evenly distributed in 24 h, which is inconsistent with the phenomenon we observed.
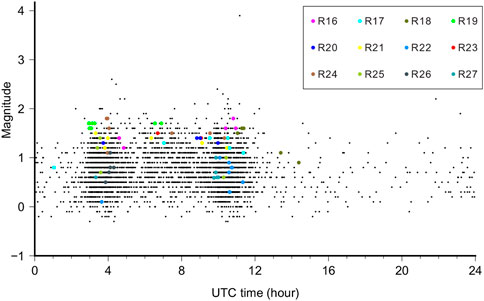
FIGURE 8. Occurrence times of the seismic events since 2012 in area C. The clusters R16–R27 are marked in various colors. Note: the UTC times plus 8 h are the local times.
Conclusion
By the methods of waveform cross-correlation analysis and precise seismic location, we systematically identified and confirmed the repeating earthquakes from the seismic data recorded by a high-density array from March 2012 to July 2021 in the northern XJF and reached the following conclusions:
1) A total of 27 clusters of repeaters, including 132 events, were identified and confirmed; 13 of the clusters are close to the 2014 Ludian Ms6.5 and the 2020 Qiaojia Ms5.0 earthquakes, and 2 of the clusters were located very close to the northernmost tip of the northern XJF. Furthermore, 12 of the clusters appeared off the main fault of the northern XJF and were judged to be probably caused by human activities (mining explosions). No repeaters were identified on the central part of the northern XJF.
2) Through the analysis of the relationship between the recurrence intervals of the clusters and two mainshocks, we found that the triggering effect on repeaters from the Ludian earthquake is not obvious, while the triggering effect from the Qiaojia earthquake is significant. Also, the results show that the triggering effect on repeaters in the near field is generally greater than that in the far field, and only events relatively late in their respective earthquake cycle get triggered.
3) No repeaters have occurred on the central part of the northern XJF. However, two clusters of the repeaters, confirmed in this study, together with one cluster of repeaters identified in a previous study, delineate a locked asperity. This asperity is capable of producing an Mw7.1 earthquake, as estimated on a basis of the slip rate contributed by the clusters of repeating earthquakes.
4) It is necessary to remove man-made repeaters when using seismicity for tectonic activity studies.
Data availability statement
The original contributions presented in the study are included in the article/Supplementary Material; further inquiries can be directed to the corresponding author.
Author contributions
YZ carried out data analysis and wrote the manuscript. LX conceptualized the problem and validation and participated in discussions of all aspects of the manuscript. JW and CL relocated the earthquakes. LF participated in the discussion section. ZP was involved in the analysis of the results.
Funding
This research work was supported by the National Natural Science Foundation of China (Project: 41904050 and U2139205), the Special Fund of the Institute of Geophysics, China Earthquake Administration (Grant Number: DQJB19B33) and the Special Fund of the Institute of Earthquake Forecasting, China Earthquake Administration (Grant Number: CEAIEF2022010100).
Conflict of interest
The authors declare that the research was conducted in the absence of any commercial or financial relationships that could be construed as a potential conflict of interest.
Publisher’s note
All claims expressed in this article are solely those of the authors and do not necessarily represent those of their affiliated organizations, or those of the publisher, the editors, and the reviewers. Any product that may be evaluated in this article, or claim that may be made by its manufacturer, is not guaranteed or endorsed by the publisher.
Supplementary material
The Supplementary Material for this article can be found online at: https://www.frontiersin.org/articles/10.3389/feart.2022.917635/full#supplementary-material
References
Abercrombie, R. E. (1996). The magnitude-frequency distribution of earthquakes recorded with deep seismometers at Cajon Pass, southern California. Tectonophysics 261, 1–7. doi:10.1016/0040-1951(96)00052-2
Allmann, B. P., Shearer, P. M., and Hauksson, E. (2008). Spectral discrimination between quarry blasts and earthquakes in southern California. Bull. Seismol. Soc. Am. 98 (4), 2073–2079. doi:10.1785/0120070215
Anooshehpoor, A., and Brune, J. N. (2001). Quasi-static slip-rate shielding by locked and creeping zones as an explanation for small repeating earthquakes at Parkfield. Bull. Seismol. Soc. Am. 91, 401–403. doi:10.1785/0120000105
Beeler, N., Lockner, D., and Hickman, S. (2001). A simple stick-slip and creep-slip model for repeating earthquakes and its implication for microearthquakes at Parkfield. Bull. Seismol. Soc. Am. 91, 1797–1804. doi:10.1785/0120000096
Cattaneo, M., Caffagni, E., Carannante, S., and D'Alema, E. (2014). A catalogue of non-tectonic earthquakes in central-eastern Italy[J]. Ann. Geophys. 57 (3), 1. doi:10.4401/ag-6434
Chen, K. H., Bürgmann, R., and Nadeau, R. M. (2010). Triggering effect of M 4-5 earthquakes on the earthquake cycle of repeating events at Parkfield, California. Bull. Seismol. Soc. Am. 100 (2), 522–531. doi:10.1785/0120080369
Chen, R., and Li, P. (1988). Slip rates and earthquake recurrence intervals of the western branch of the Xiaojiang Fault Zone. Seismol. Geol. 10, 1–13.
Crotwell, H. P., Owens, T. J., and Ritsema, J. (1999). The TauP Toolkit: Flexible seismic travel-time and ray-path utilities. Seismol. Res. Lett. 70, 154–160. doi:10.1785/gssrl.70.2.154
Deng, Y., Peng, Z., and Liu-Zeng, J. (2020). Systematic search for repeating earthquakes along the Haiyuan fault system in northeastern Tibet. J. Geophys. Res. Solid Earth 125, e2020JB019583. doi:10.1029/2020jb019583
Department of Earthquake Disaster Prevention and State Seismological Bureau (1995). The catalogue of Chinese historical strong earthquakes. Beijing: Seismological Press, 1–514. (in Chinese).
Eshelby, J. D. (1957). The determination of the elastic field of an ellipsoidal inclusion, and related problems[J]. Proc. R. Soc. Lond. Ser. A. Math. Phys. Sci. 241 (1226), 376–396.
Fu, Z., Jiang, C., Yin, F., Zhang, L., Shen, X., Fang, L., et al. (2021). Preliminary report on the 18 may 2020 Ms 5.0 Qiaojia earthquake, yunnan, China. Seismol. Res. Lett. 92, 2122–2133. doi:10.1785/0220200233
Fu, Z., Xu, L., and Wang, Y. (2020). Seismic risk on the northern Xiaojiang fault implied by the latest and nearest GPS observations. Pure Appl. Geophys. 177, 661–679. doi:10.1007/s00024-019-02347-5
He, H., Yasutaka, I., Song, F., and Dong, X. (2002). Late quaternary slip rate of the Xiaojiang fault and its implication. Seismol. Geol. 24, 14–26.
Igarashi, T. (2020). Catalog of small repeating earthquakes for the Japanese Islands. Earth Planets Space 72, 73. doi:10.1186/s40623-020-01205-2
Igarashi, T., Matsuzawa, T., and Hasegawa, A. (2003). Repeating earthquakes and interplate aseismic slip in the northeastern Japan subduction zone. J. Geophys. Res. 108, 1. doi:10.1029/2002jb001920
Jin, H., Gao, Y., Su, X., and Fu, G. (2019). Contemporary crustal tectonic movement in the southern Sichuan-Yunnan block based on dense GPS observation data. Earth Planet. Phys. 3, 53–61. doi:10.26464/epp2019006
Kanamori, H., and Anderson, D. L. (1975). Theoretical basis of some empirical relations in seismology. Bull. Seismol. Soc. Am. 65, 1073–1095.
Kato, N., and Hirasawa, T. (1997). A numerical study on seismic coupling along subduction zones using a laboratory-derived friction law. Phys. Earth Planet. interiors 102, 51–68. doi:10.1016/s0031-9201(96)03264-5
Lay, T., and Kanamori, H. (1980). Earthquake doublets in the Solomon Islands. Phys. Earth Planet. Interiors 21, 283–304. doi:10.1016/0031-9201(80)90134-x
Li, J., Böse, M., Feng, Y., and Yang, C. (2021a). Real-time characterization of finite rupture and its implication for earthquake early warning: Application of FinDer to existing and planned stations in southwest China. Front. Earth Sci. (Lausanne). 9, 699560. doi:10.3389/feart.2021.699560
Li, L., Chen, Q., Niu, F., He, J., and Fu, H. (2013). Estimates of deep slip rate along the Xiaojiang fault with repeating microearthquake data. Chin. J. Geophysics- Chin. Ed. 56, 3373–3384.
Li, L., Chen, Q., and Niu, F. (2021b). Repeating microearthquakes and deep deformation along the major faults in the Sichuan-Yunnan region, China. Chin. J. Geophys. 64, 4308–4326.
Li, L., Chen, Q., Niu, F., and Su, J. (2011). Deep slip rates along the Longmen Shan fault zone estimated from repeating microearthquakes. J. Geophys. Res. 116, B09310. doi:10.1029/2011jb008406
Li, L. (2017). Depth-dependence of post-seismic velocity changes in and near source area of the 2013 M 7.0 Lushan earthquake revealed by S coda of repeating events. Tectonophysics 717, 302–310. doi:10.1016/j.tecto.2017.08.017
Li, Y., Nocquet, J. M., Shan, X., and Jian, H. (2021c). Heterogeneous interseismic coupling along the xianshuihe‐Xiaojiang fault system, eastern Tibet. JGR. Solid Earth 126 (11), e2020JB021187. doi:10.1029/2020jb021187
Molnar, P., and Tapponnier, P. (1975). Cenozoic Tectonics of Asia: Effects of a Continental Collision: Features of recent continental tectonics in Asia can be interpreted as results of the India-Eurasia collision. Science 189, 419–426. doi:10.1126/science.189.4201.419
Myhill, R., McKenzie, D., and Priestley, K. (2011). The distribution of earthquake multiplets beneath the southwest Pacific. Earth Planet. Sci. Lett. 301, 87–97. doi:10.1016/j.epsl.2010.10.023
Nadeau, R. M., and Johnson, L. R. (1998). Seismological studies at Parkfield VI: Moment release rates and estimates of source parameters for small repeating earthquakes[J]. Bull. Seismol. Soc. Am. 88 (3), 790–814.
Nadeau, R. M., and McEvilly, T. V. (2004). Periodic pulsing of characteristic microearthquakes on the san Andreas fault. Science 303 (5655), 220–222. doi:10.1126/science.1090353
Nadeau, R. M., Foxall, W., and McEvilly, T. (1995). Clustering and periodic recurrence of microearthquakes on the San Andreas fault at Parkfield, California. Science 267, 503–507. doi:10.1126/science.267.5197.503
Nadeau, R. M., and McEvilly, T. V. (1999). Fault slip rates at depth from recurrence intervals of repeating microearthquakes. Science 285, 718–721. doi:10.1126/science.285.5428.718
Peng, Z., and Zhao, P. (2009). Migration of early aftershocks following the 2004 Parkfield earthquake. Nat. Geosci. 2, 877–881. doi:10.1038/ngeo697
Sammis, C. G., and Rice, J. R. (2001). Repeating earthquakes as low-stress-drop events at a border between locked and creeping fault patches. Bull. Seismol. Soc. Am. 91, 532–537. doi:10.1785/0120000075
Schaff, D. P., and Beroza, G. C. (2004). Coseismic and postseismic velocity changes measured by repeating earthquakes. J. Geophys. Res. 109 (B10). doi:10.1029/2004jb003011
Schmittbuhl, J., Karabulut, H., Lengliné, O., and Bouchon, M. (2016). Long-lasting seismic repeaters in the central basin of the main marmara fault. Geophys. Res. Lett. 43, 9527–9534. doi:10.1002/2016gl070505
Shen, J., Wang, Y., and Song, F. (2003). Characteristics of the active Xiaojiang fault zone in Yunnan. J. Asian Earth Sci. 21, 1085–1096.
Shen, Z., Lü, J., Wang, M., and Bürgmann, R. (2005). Contemporary crustal deformation around the southeast borderland of the Tibetan Plateau. J. Geophys. Res. 110 (B11). doi:10.1029/2004jb003421
Turner, R. C., Nadeau, R. M., and Bürgmann, R. (2013). Aseismic slip and fault interaction from repeating earthquakes in the Loma Prieta aftershock zone. Geophys. Res. Lett. 40, 1079–1083. doi:10.1002/grl.50212
Uchida, N., and Bürgmann, R. (2019). Repeating earthquakes. Annu. Rev. Earth Planet. Sci. 47, 305–332. doi:10.1146/annurev-earth-053018-060119
Uchida, N. (2019). Detection of repeating earthquakes and their application in characterizing slow fault slip. Prog. Earth Planet. Sci. 6, 40–21. doi:10.1186/s40645-019-0284-z
Uchida, N., Matsuzawa, T., Hasegawa, A., and Igarashi, T. (2003). Interplate quasi-static slip off Sanriku, NE Japan, estimated from repeating earthquakes. Geophys. Res. Lett. 30. doi:10.1029/2003gl017452
Ursino, A., Langer, H., Scarfì, L., and Di Grazia, G. (2001). Discrimination of quarry blasts from tectonic microearthquakes in the hyblean plateau (southeastern sicily)[J]. Ann. Geophys. 44 (4), 703–722.
Vidale, J., ElIsworth, W., Cole, A., and Marone, C. (1994). Variations in rupture process with recurrence interval in a repeated small earthquake. Nature 368, 624–626. doi:10.1038/368624a0
Waldhauser, F., Ellsworth, W. L., Schaff, D. P., and Cole, A. (2004). Streaks, multiplets, and holes: High-resolution spatio-temporal behavior of Parkfield seismicity. Geophys. Res. Lett. 31 (18), L18608. doi:10.1029/2004gl020649
Waldhauser, F., and Ellsworth, W. L. (2000). A double-difference earthquake location algorithm: Method and application to the northern Hayward fault, California. Bull. Seismol. Soc. Am. 90, 1353–1368. doi:10.1785/0120000006
Wang, C., Chan, W. W., and Mooney, W. D. (2003). Three-dimensional velocity structure of crust and upper mantle in southwestern China and its tectonic implications. J. Geophys. Res. 108, 1. doi:10.1029/2002jb001973
Wang, E., and Burchfiel, B. C. (2000). Late Cenozoic to Holocene deformation in southwestern Sichuan and adjacent Yunnan, China, and its role in formation of the southeastern part of the Tibetan Plateau. Geol. Soc. Am. Bull. 112, 413–423. doi:10.1130/0016-7606(2000)112<413:lcthdi>2.0.co;2
Wang, Y., Wang, E., Shen, Z., Wang, M., Gan, W., Qiao, X., et al. (2008). GPS-constrained inversion of present-day slip rates along major faults of the Sichuan-Yunnan region, China. Sci. China Ser. D-Earth. Sci. 51, 1267–1283. doi:10.1007/s11430-008-0106-4
Wang, Y., Zhang, X., Zhang, J., Yang, S., Han, L., and Yan, S. (2017). Seismic mountainous geo-hazard investigation of Dongchuan Ms7.8 earthquake in 1733. South-to-North Water Transfers Water Sci. Technol. 15, 138–144.
Wen, X., Du, F., Long, F., Fan, J., and Zhu, H. (2011). Tectonic dynamics and correlation of major earthquake sequences of the Xiaojiang and Qujiang-Shiping fault systems, Yunnan, China. Sci. China Earth Sci. 54, 1563–1575. doi:10.1007/s11430-011-4231-0
Wen, X., Ma, S., Xu, X., and He, Y. (2008). Historical pattern and behavior of earthquake ruptures along the eastern boundary of the Sichuan-Yunnan faulted-block, southwestern China. Phys. Earth Planet. Interiors 168, 16–36. doi:10.1016/j.pepi.2008.04.013
Xu, X., Wen, X., Zheng, R., Ma, W., Song, F., and Yu, G. (2003). Pattern of latest tectonic motion and its dynamics for active blocks in Sichuan-Yunnan region, China. Sci. China Ser. D Earth Sci. 46, 210–226.
Zhang, L., Su, J., Wang, W., Fang, L., and Wu, J. (2022). Deep fault slip characteristics in the Xianshuihe-Anninghe-Daliangshan Fault junction region (eastern Tibet) revealed by repeating micro-earthquakes. J. Asian Earth Sci. 227, 105115. doi:10.1016/j.jseaes.2022.105115
Zhang, P., Deng, Q., Zhang, G., Ma, J., Gan, W., Min, W., et al. (2003). Active tectonic blocks and strong earthquakes in the continent of China. Sci. China Ser. D Earth Sci. 46, 13–24.
Zhang, Y., Yuntai, C., Xu, L., Wei, X., Jin, M., and Zhang, S. (2015). The 2014 Mw6.1 ludian, yunnan, earthquake: A complex conjugated ruptured earthquake. Chin. J. Geophys. 58, 153–162.
Zhu, A., Zhang, D., and Jiang, C. (2016). Numerical simulation of the segmentation of the stress state of the Anninghe-Zemuhe-Xiaojiang faults. Sci. China Earth Sci. 59, 384–396. doi:10.1007/s11430-015-5157-8
Keywords: repeating earthquakes, asperity, Xiaojiang fault, seismic risk, slip rate
Citation: Zhou Y, Xu L, Wu J, Li C, Fang L and Pan Z (2022) Seismicity of the repeating earthquake clusters in the northern Xiaojiang fault zone and its implications. Front. Earth Sci. 10:917635. doi: 10.3389/feart.2022.917635
Received: 11 April 2022; Accepted: 11 August 2022;
Published: 01 September 2022.
Edited by:
Andrea Cannata, University of Catania, ItalyReviewed by:
Tim Greenfield, University of Cambridge, United KingdomWei Peng, National Taiwan Normal University, Taiwan
Copyright © 2022 Zhou, Xu, Wu, Li, Fang and Pan. This is an open-access article distributed under the terms of the Creative Commons Attribution License (CC BY). The use, distribution or reproduction in other forums is permitted, provided the original author(s) and the copyright owner(s) are credited and that the original publication in this journal is cited, in accordance with accepted academic practice. No use, distribution or reproduction is permitted which does not comply with these terms.
*Correspondence: Lisheng Xu, eHVsc0BjZWEtaWdwLmFjLmNu