 Jung-Hun Song
 Seongryong Kim
 Junkee Rhie
 Donghee Park1,3
- 1School of Earth and Environmental Sciences, Seoul National University, Seoul, South Korea
- 2Department of Earth and Environmental Sciences, Korea University, Seoul, South Korea
- 3Central Research Institute, Korea Hydro & Nuclear Power Co., Ltd., Daejeon, South Korea
Precise estimates of earthquake source properties are crucial for understanding earthquake processes and assessing seismic hazards. Seismic waveforms can be affected not only by individual event properties, but from the Earth’s interior heterogeneity. Therefore, for accurate constraints on earthquake source parameters, the effects of three-dimensional (3D) velocity heterogeneity on seismic wave propagation need evaluation. In this study, regional moment tensor solutions for earthquakes around the southern Korean Peninsula were constrained based on the spectral-element moment tensor inversion method using a recently developed high-resolution regional 3D velocity model with accurate high-frequency waveform simulations. Located at the eastern margin of the Eurasian plate, the Korean Peninsula consists of complex geological units surrounded by thick sedimentary basins in oceanic areas. It exhibits large lateral variations in crustal thickness (> 10 km) and seismic velocity (>10% dlnVs) at its margins in the 3D model. Seismic waveforms were analyzed from regional earthquakes with local magnitudes > 3.4 that occurred within and around the peninsula recorded by local broadband arrays. Moment tensor components were inverted together with event locations using the numerically calculated Fréchet derivatives of each parameter at periods ≥ 6 s. The newly determined solutions were compared with the results calculated from the one-dimensional (1D) regional velocity model, revealing a significant increase in a double-couple component of > 20% for earthquakes off of the coastal margins. Further, compared to initial solutions, ≤ 5 km change in depth was observed for earthquakes near the continental margin and sedimentary basins. The combination of a detailed 3D crustal model and accurate waveform simulations led to an improved fit between data and synthetic seismograms. Accordingly, the present results provide the first confirmation of the effectiveness of using 3D velocity structures for accurately constraining earthquake source parameters and the resulting seismic wave propagation in this region. We suggest that accurate 3D wave simulations, together with improved source mechanisms, can contribute a reliable assessment of seismic hazards in regions with complex continental margin structures and sedimentary basins from offshore earthquakes whose seismic waveforms can be largely affected by 3D velocity structures.
Introduction
Accurate determination of earthquake source parameters (e.g., hypocenter, focal mechanisms, and moment tensors) is important for understanding earthquake processes, elastic responses of a medium to tectonic stresses, and strong ground motions affected by the sources (Talwani, 2014; Gallovič et al., 2019). Notably, seismic waveforms have been routinely used to improve source property estimates (Ekström et al., 2012), as they contain more information due to the superposition of different seismic signals across amplitudes and phases (Dreger and Helmberger, 1993; Kim et al., 2011). Seismic waveforms are responses to wave propagation through the Earth’s structure, as well as earthquake processes. Though averaged one-dimensional (1D) structural models are useful in most practices (Dreger and Helmberger, 1993; Ford et al., 2009), constrained source properties can often be biased from unaccounted for three-dimensional (3D) structural heterogeneity (Hejrani et al., 2017; Li et al., 2018), such as thick sedimentary basins, or sharp lateral variations in crustal thickness at the continental margin (Tape et al., 2010). Additionally, signals from small-to-moderate regional earthquakes (moment magnitude (Mw) ∼3.0–5.5) are generally detected by regional arrays (epicentral distance < 500 km) over relatively shorter period bands (< 40 s), in which seismic wave propagation becomes increasingly sensitive to smaller volumetric or sharp interfacial structures in the crust and upper mantle (e.g., Fichtner and Tkalčić, 2010). Therefore, for more precise constraints on earthquake source parameters across various magnitudes, the effects of 3D velocity heterogeneity on seismic wave propagation require evaluation.
With recent advancements in computational capacity, the calculation of 3D seismic wave simulations has become more readily attainable and has been successfully applied for synthesizing full seismic waveforms and ground shaking with the inclusion of more accurate 3D Earth structures (Liu et al., 2004; Lee et al., 2022). Indeed, 3D velocity model analyses have shown to improve moment tensor solutions for a more accurate alignment with actual regional tectonic features (Hejrani et al., 2017; Takemura et al., 2020). Further, accurate wave simulations enabled with a 3D velocity model show that slip processes can be resolved more precisely at higher frequencies (> 0.1 Hz) for earthquakes at shallow depths (< 2 km; Hejrani and Tkalčić, 2020) or complex tectonic systems (Julian et al., 1997; Vavryčuk, 2011). Despite the effectiveness of considering 3D velocity structures, the number of local and regional studies constraining earthquake source parameters based on the calculations of 3D wave propagations is limited to Iceland (Fichtner and Tkalčić, 2010), Taiwan (Lee et al., 2010), the Australian region (Hingee et al., 2011; Hejrani and Tkalčić, 2020), Papua New Guinea and the Solomon Islands (Hejrani et al., 2017), the Kanto region (Takemura et al., 2020), Los Angeles region (Wang and Zhan, 2020), Groningen Field (Willacy et al., 2018), and the southern Sichuan Basin (Huo et al., 2021). In part, this limitation is due to the lack of regional 3D velocity models with reasonable resolutions and/or insufficient computational resources to accommodate accurate 3D wave simulations.
Here, we present a newly estimated moment tensor catalog based on 3D full-waveform simulations in the southern Korean Peninsula (KP). The combined presence of a regional high-resolution 3D velocity model and accelerated processing through advanced graphical processing units (GPUs) allow for the more efficient calculation of synthetic waveforms reflecting the 3D heterogeneity. The KP is a continental part at the eastern margin of the Eurasian plate. Tectonically, the KP is under a stable intraplate regime, with compressive tectonic forces controlled by the convergence of the Eurasian plate (EP), Philippine Sea plate (PSP), and the Pacific plate (PP; Figure 1). Although this region has been classified as a tectonically stable intraplate area, several small-to-moderate sized earthquakes (Mw ∼3–5) occur annually, with two of the largest earthquakes (Mw > 5.4) in instrumentally recorded history (generating ground shaking-caused damages near the epicenters and felt throughout the southern KP) occurring within the last 5 years, (Kim Y. et al., 2016; Kim K. H. et al., 2018). Previous studies have applied various techniques for estimating detailed earthquake moment tensors and resultant ground shaking based on 1D regional velocity models (Rhie and Kim, 2010; Kim et al., 2011; Hong and Choi, 2012; Hong et al., 2020; Park et al., 2020). With increasing concern of possible damaging earthquakes, several seismic stations have been deployed over the past decade in the southern KP (Figure 1A). The accumulated continuous waveform records from these stations have enabled the development of high-resolution crust and upper mantle velocity models through ambient noise tomography for the southern KP and northeast Asia, resolving lateral structures down to ∼20 km (Lee et al., 2015; Kim. et al., 2016b; Rhie et al., 2016). Elsewhere, a regional 3D velocity model has successfully enhanced the accuracy of hypocenter locations of the 2017 Pohang earthquake sequences (Jung et al., 2022). Further, seismic wave propagation simulations calculated with the 3D velocity model have shown that local amplification of ground motions caused by complex wave propagation effects can be reproduced accurately up to 1 Hz, with improved predictive accuracy (Lee et al., 2022). These results support that 3D models well represent fine details of velocity heterogeneity in this region. Furthermore, GPUs were employed here to accelerate the spectral element wavefield simulation (Komatitsch et al., 2010), as they can reduce the computational time of synthetic wave propagation by ≤ 20-times compared to CPU clusters (Komatitsch et al., 2010). Synthetics and their Fréchet derivatives were computed for six moment tensor components and three location parameters (longitude, latitude, and depth) to be used for the inversion of earthquake source parameters for each earthquake. In particular, shorter period waveforms (6–30 s) were incorporated to better resolve source complexities and reduce moment tensor dependencies in source depth (Julian et al., 1997; Mustać et al., 2020). The inversion results and synthetic waveforms obtained with the regional 3D and 1D velocity models were compared, ultimately revealing that the more accurate waveform simulation technique with the 3D velocity model resulted in generally better fits between data and synthetic seismograms, with more reliable focal mechanism solutions in this region.
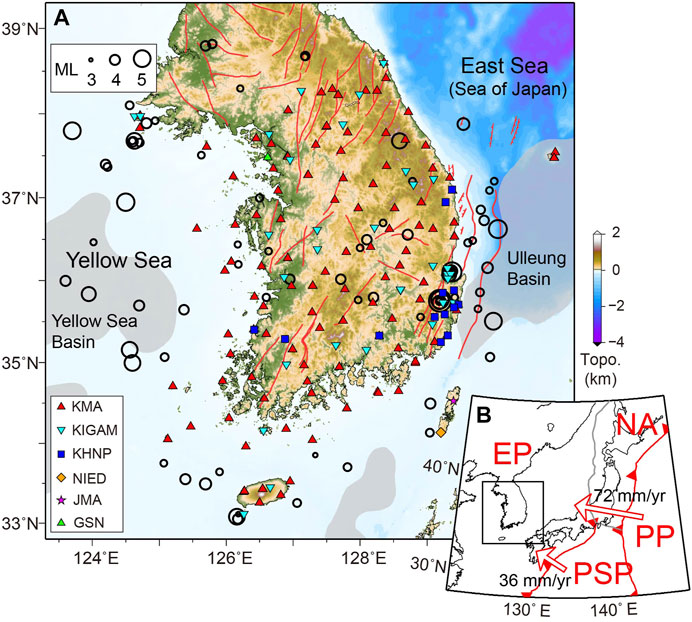
FIGURE 1. Distribution of seismic stations and earthquakes within the study area. (A) Stations are indicated by solid symbols, with different colors and shapes for different networks—KMA, Korea Meteorological Administration; KIGAM, Korea Institute of Geoscience and Mineral Resources, KHNP, Korea Hydro & Nuclear Power; NIED, National Research Institute for Earth Science and Disaster Resilience; JMA, Japan Meteorological Agency; GSN, Global Seismic Network. Black circles indicate local events (ML > 3.4) occurring between 2003 and 2021, with corresponding circle sizes indicating magnitude. Red lines delineate major faults (Chough et al., 2018), whereas gray shaded regions indicate sedimentary basins with a thickness > 1 km (Straume et al., 2019). (B) a regional tectonic setting, where subduction boundaries are indicated by red saw-toothed lines, while other convergent plate boundaries are indicated by gray lines (Bird, 2003). Red arrows indicate the movement direction of the Philippine Sea and Pacific plates with respect to the Eurasian Plate (velocities indicated). The study area is indicated by the black square. EP, Eurasian Plate; PP, Pacific Plate; PSP, Philippine Sea Plate; NA, North American Plate.
Data and Method
Event Data and Initial Solutions
Regional earthquakes with local magnitudes (ML) > 3.4 occurring between 2003 and 2021 within and around the southern KP (33.0°–38.2° N, 123.8°–130.3° E) were identified from the event catalog of the Korean Meteorological Agency (KMA; N = 73 events). Further, we obtained three-component seismic waveforms for these events recorded by broadband seismometers from various networks (Figure 1A). The raw seismogram data were deconvolved from instrument responses and converted to displacement. Two horizontal components (E and N components) were rotated to radial (R) and tangential (T) components based on the KMA-provided event locations. Station orientations were corrected based on the measurement of seismometer misorientation by teleseismic P-wave polarization (Son et al., 2021). To obtain initial earthquake moment tensor solutions for the subsequent 3D analysis and reject earthquakes with poor data quality, we performed 1D time-domain moment tensor inversions (TDMT, Dreger and Helmberger, 1993) with a regional 1D velocity model (Kim et al., 2011). Green’s functions were calculated using a frequency-wavenumber integration method (Saikia, 1994) based on the actual epicentral distances of each station. For larger earthquakes, we applied a 20–40 s band-pass filter, and for smaller events (Mw < 4), a relatively short-period band of 10–30 s was used to account for frequency contents of corresponding earthquakes and to increase signal-to-noise ratios of the observed waveforms (Rhie and Kim, 2010). We inverted for deviatoric moment tensor solutions of each event with varying centroid depths, while fixing lateral locations (i.e., longitude and latitude), as provided by the earthquake catalog. The event depth varied between 0 and 30 km at increments of 0.5 km, and the final depth was determined to have the lowest misfit between the synthetic and observed waveforms. During the inversion process, time shifts of each station were determined for the alignment of synthetic seismograms with the observed waveforms based on cross-correlations to account for unmodeled propagation effects. Ultimately, 45 events were obtained for which both moment tensors and centroid depths could be stably determined, with variance reductions > 60% and the number of stations showing clear three-component waveforms > 10. Events that occurred in the northern KP were excluded due to limited regional resolution of 1D and 3D velocity structures. The chosen events were analyzed further in the moment tensor inversion via the 3D waveform simulation.
Three-Dimensional Velocity Model
The 3D regional velocity model of the southern KP was constructed based on ambient noise tomography (Figure 2). The model data were obtained from multiple regional ambient noise datasets with different spatial scales. In the southern KP, the velocity model was constructed using 1–6 s group velocity data measured at 150 accelerometer stations and 5–30 s group and phase velocity data estimated at 37 regional broadband stations (Rhie et al., 2016). The velocity model outside the southern KP was constrained by 25–40 s phase velocity data collected at broadband stations in northeast Asia (Kim. et al., 2016b). The lateral variations of phase and group velocity for period ranges ≤ 1 Hz were calculated based on the trans-dimensional and hierarchical Bayesian inversion technique (Kim. et al., 2016a; Rhie et al., 2016). The 1D depth profiles from surface-wave dispersions were inverted via a Bayesian approach and used to construct the 3D shear velocity model (Kim et al., 2017). Based on the lateral variation of the compressional to shear-wave velocity ratio (Vp/Vs) estimated from the receiver function method (Chang and Baag, 2007), 3D modeled P-wave velocities were converted from the shear velocity. A simple empirical relationship between seismic velocity and density (Christensen and Mooney, 1995) was employed to construct a density model covering the southern KP and its coastal regions, including the western part of the East Sea (Sea of Japan) and the eastern Yellow Sea, extending to depths of 120 km. For the crust and uppermost mantle, the horizontal resolution of the 3D model extended to 25–30 km within the continental area and 50–75 km in the offshore regions. These resolutions were determined based on synthetic recovery test results using checkerboard and structural patterns (Kim. et al., 2016b; Rhie et al., 2016). We confirmed that the modeled region successfully recovered the original input pattern. The velocity grids in the continental and oceanic regions were sampled at horizontal intervals of 5 and 25 km, respectively, with a common depth spacing of 0.5 km.
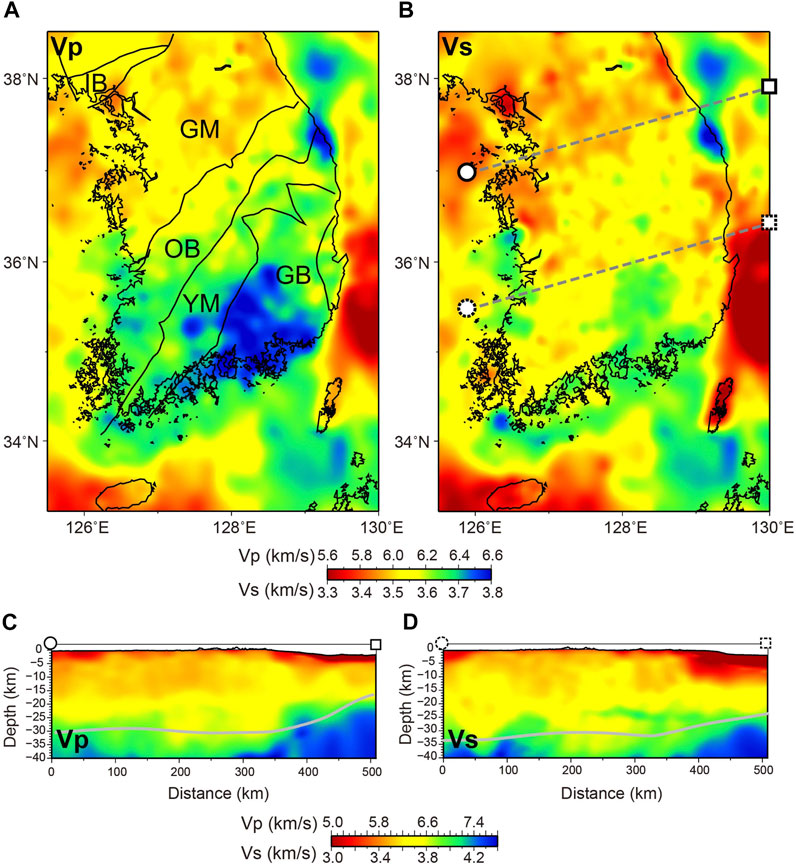
FIGURE 2. Regional three-dimensional seismic velocity model of the southern Korean Peninsula: (A) Horizontal cross-section of P-wave velocity at 10 km depth. Black solid lines indicate the boundaries of different geologic provinces; (B) Horizontal cross-section of S-wave velocity at 10 km depth; (C,D) represent vertical cross-sections of P- and S-wave velocities, respectively. Gray solid curves are Moho depths from receiver function studies (e.g., Chang and Baag, 2007; Kim et al., 2015). Locations of vertical profiles are indicated in B: GB, Gyeongsang Basin; GM, Gyeonggi Massif; IB, Imjingang Belt; OB, Okcheon Belt; YM, Yeongnam Massif.
Waveform Simulations Using Spectral-Element Method
The spectral-element method implemented in the SPECFEM3D Cartesian software package (Komatitsch and Tromp, 1999) was used for the accurate calculation of 3D elastic wave propagation. This method has previously been used to simulate seismic wave propagation on both global and regional scales with 3D Earth structures (Komatitsch and Tromp, 2002; Tape et al., 2009). Further, this method exploits the geometric flexibility of the finite-element method with an accurate representation of the wave fields based on high-degree Lagrange polynomials via pseudospectral techniques (Komatitsch et al., 2004). Surface topography, bathymetry, and internal discontinuities (e.g., Moho) can be accommodated into the spectral element mesh. We constructed a mesh that covers 817.1 x 713.4 km (123.5°–132.5° E and 32.8°–39.3° N) and extends to 85 km depth. The mesh encompasses all stations and earthquakes in the southern KP, as well as its coastal regions (Figure 1A). Spectral elements were defined to maintain a regular spacing of ∼3 km in the model domain, which contained 1.89 x 10⁶ elements with 1.19 x 10⁸ grid points. We applied a free surface condition at the topographic surface and the Stacey absorbing boundary condition at the bottom and sides (Komatitsch and Tromp, 2003). Based on the minimum shear wave velocity of the regional velocity model and spacing of spectral elements, synthetic seismograms could be resolved up to 0.5 Hz. We employed a GPU-enabled spectral-element solver of the seismic wave equation.
Moment Tensor Inversion
A seismic moment tensor and event location were determined using the regional 3D velocity model based on the spectral-element moment tensor inversion method (Liu et al., 2004). This method uses spectral-element simulations to calculate the sensitivity of seismic waveforms to source parameters (i.e., the Fréchet derivatives). For each earthquake, we inverted six moment tensor components (Mrr, Mtt, Mpp, Mrt, Mrp, and Mtp) and three location components (longitude, latitude, and depth). Accordingly, a total of 10 simulations were conducted, of which 9 consisted of calculating synthetics for the Fréchet derivatives, and the remaining simulation constructed synthetic seismograms with an initial moment tensor solution determined by the TDMT method. As the synthetics (s) can be represented by linear combinations of the moment tensor elements (m), the derivatives
The Fréchet derivatives of location parameters can be constructed based on the differences between synthetic seismograms computed with a moment tensor, that is, spatially separated from the initial location and the initial synthetic seismograms. In contrast to the moment tensor components, the synthetic waveforms have a nonlinear relationship with location parameters. Assuming that the initial solution was close to the true solution, a linear gradient calculated with step lengths of 1 km for depth, and 250 m for latitude and longitude, was applied from the initial location. Step lengths were determined based on the numerical test results showing the quasi-linearity of gradients around the initial location (Liu et al., 2004). Using the initial point-source parameters as the starting solution
where
where
We applied a band-pass filter with a period range from 6 to 30 s for the synthetic seismograms, their derivatives, and observed data. Time windows of waveforms were selected to be used for the inversion process via an automated time-window selection software (FLEXWIN, Maggi et al., 2009). This program automatically selects time windows around potential seismic phases based on quantities evaluating waveform shape (e.g., amplitudes, signal-to-noise ratio, short-term-average/long-term averages) for comparing synthetic and observed seismograms. Selected time windows were manually checked for all seismograms. Only those that included waveforms showing high similarities (cross-correlation coefficients > 0.7, log amplitude ratios < 1.5) between the observed and synthetics generated by the initial focal mechanism were incorporated. During the inversion process, time shifts of the synthetics with respect to the data were applied to obtain the optimal correlation between the two, as such calculations help extract the contributions of the 3D velocity structure to seismic waveforms and source parameters by removing time shifts originating from errors in event origin time, location, or derived from inaccuracies in the 3D velocity structure due to limited resolution (Komatitsch et al., 2004; Hejrani et al., 2017). Although the application of time shifts has been demonstrated to be useful for reducing travel time effects of lateral velocity heterogeneity (Zhao and Helmberger, 1994), they cannot fully account for the complex nature of 3D wave propagation effects in regions where seismic phases and amplitudes can be distorted (Liu et al., 2004).
Bootstrap analyses were conducted to assess uncertainties of the determined source parameters and the reliability of reduction of an amplitude misfit following inversion. We generated 100 solutions based on randomly selected seismograms of each event and calculated averages and standard deviations of locations, moment tensor components, a percentage of a double couple (DC) component, and the misfit between synthetic and observed waveforms.
Results
We compared the inversion results obtained with waveform simulations using the 3D and the 1D velocity models, and Figure 3 shows focal mechanism solutions and percentages of the DC component for each event. The results indicated general increases in the proportion of DC components (3–25%) for the earthquakes in the continental southern KP, as well as the continental margin off the east coast when the 3D velocity model was used (Figure 3A). The continental events exhibited high DC proportions overall (> 80%) in both models (Figures 3A,B), with small increases (3–7%) in the 3D model. These increases in the DC component were considered reliable given that the moment tensor components were determined with small uncertainties (< 3%) (Figure 4B). Relatively large increases in DC components (15–25%) were found for earthquakes in the offshore southeastern continental margin, and these increments were deemed reliable given that the uncertainty of a DC component was determined to be < 10% for these earthquakes (Figure 4B). Meaningful increases in the percentage of DC components also exist for earthquakes in the Yellow Sea and the northwestern continental margin of the southern KP. The mainshock (Mw = 5.4) of the earthquake sequences in the Pohang area (Figure 3, top of the blue box) and a moderate-sized (Mw ∼5) earthquake offshore of Uljin in the eastern continental margin show comparably low DC percentage than other earthquakes in the 3D model.
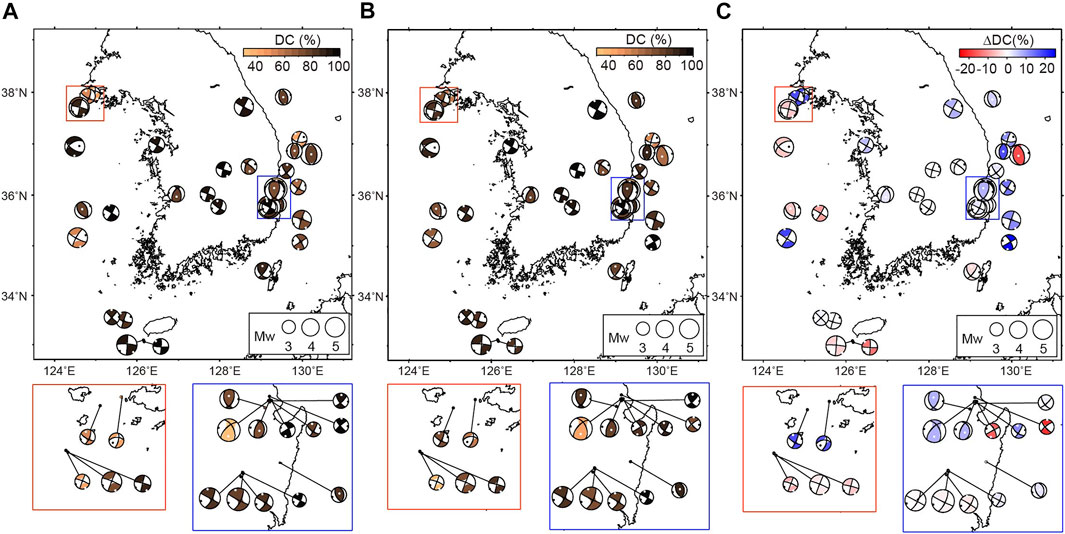
FIGURE 3. Moment tensor solutions obtained with the: (A) regional 1D velocity model and (B) regional 3D velocity model. Beach balls in A and B indicate focal mechanisms, with the projection of the fault orientation and slip on the lower half of a sphere surrounding the hypocenter, and the colored (non-colored) quadrants indicating motion towards (away) those quadrants. Colors of each beachball indicate the proportion of a double couple component (DC %). (C) Differences in the DC component proportions between 3D and 1D focal mechanisms. Black and white circles on each beach ball indicate the directionality of the maximum and minimum principal compressive stresses P and T axes, respectively. Colored boxes at the bottom are enlarged maps of regions indicated by orange and blue squares.
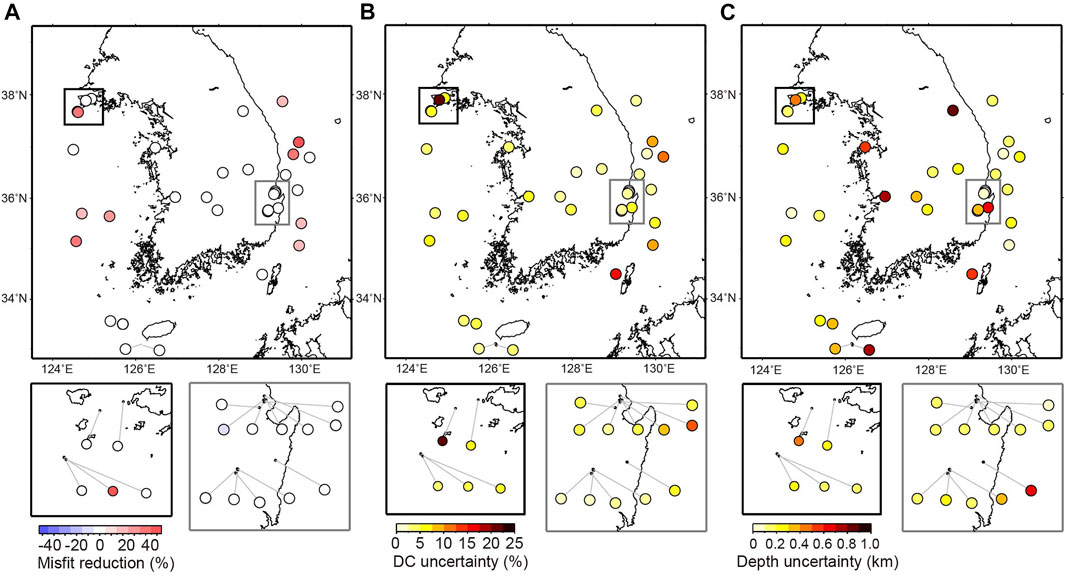
FIGURE 4. (A) Reduction of amplitude misfits between the observed and synthetic seismograms for the wave simulations using source parameters constrained by the 3D vs. 1D velocity models. The misfit reduction was calculated as
All comparisons between the observed and synthetic waveforms calculated using the 1D and 3D models were made after applying a band pass filter to each dataset within a common period range. A meaningful decrease in waveform misfit (∼5–50%) between synthetic and observed waveforms was found when the 3D velocity model was used (Figure 4). Notable improvements (> 30%) in waveform fitting were found for the events in the offshore eastern and western coastal margins. There were notable differences in amplitudes and arrival times of surface waves for the synthetic waveforms between the 1D and 3D velocity models when assessing offshore earthquakes (Figure 5), where 3D model synthetic waveforms showed a better fit with observations.
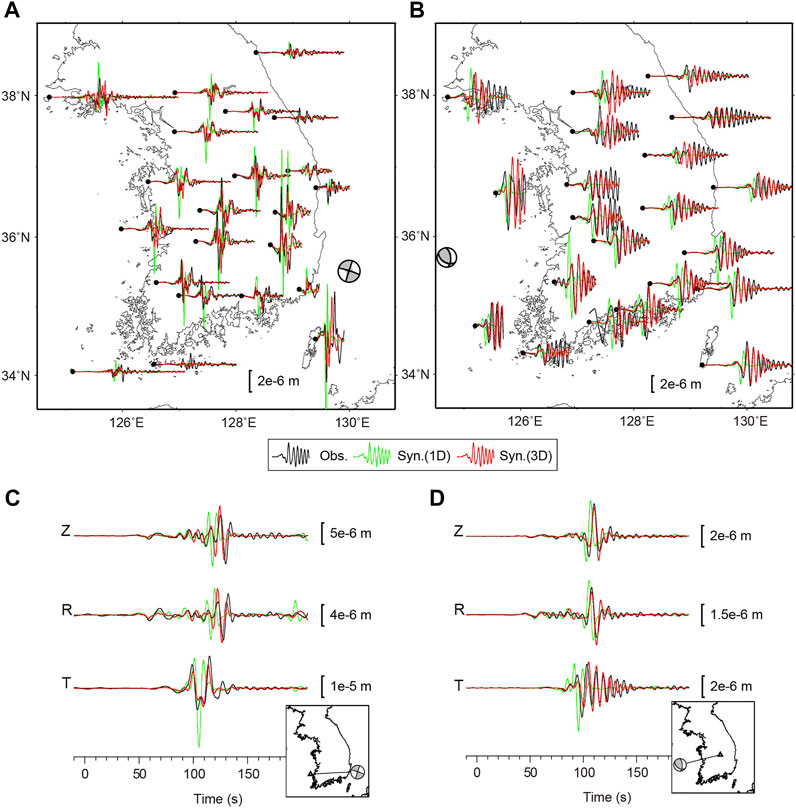
FIGURE 5. Example comparisons of synthetic seismograms and observations: (A,C) Waveforms of the event (moment magnitude (Mw) 4.7) that occurred along the southeastern offshore of the Korean Peninsula at 11:33:03 (UTC) on 7-5-2016, and (B,D) Waveforms of the event (Mw 4.1) that occurred in the Yellow Sea at 00:40:40 (UTC) on 8-21-2021. A and B show tangential component waveforms, where wiggles in black are the observed seismograms, while those in green are the synthetic seismograms calculated with moment tensor solutions constrained by time-domain moment tensor inversions (TDMTs) via the regional 1D velocity model. Red seismograms are the synthetics of 3D waveform simulation calculated with moment tensor solutions obtained from the regional 3D velocity model. Beach balls in gray indicate focal mechanisms of each event. Frequency bands for the waveforms in A and C ranged from 0.033 to 0.33 Hz, whereas those in B and D ranged from 0.033 to 0.18 Hz.
Figure 6 shows the changes in centroid depths for source parameters determined with the 3D velocity model as compared to the initial solutions, revealing an overall increase in depth (∼1–5 km) for the offshore events along the eastern continental margin. Given that uncertainties in centroid depth were estimated as ∼0.3 km (Figure 4C), the observed depth changes were significant. The determined centroid depths here for events at the offshore eastern coastal margins extended deeply to ∼19 km (Figure 6A, cross-section a-a’).
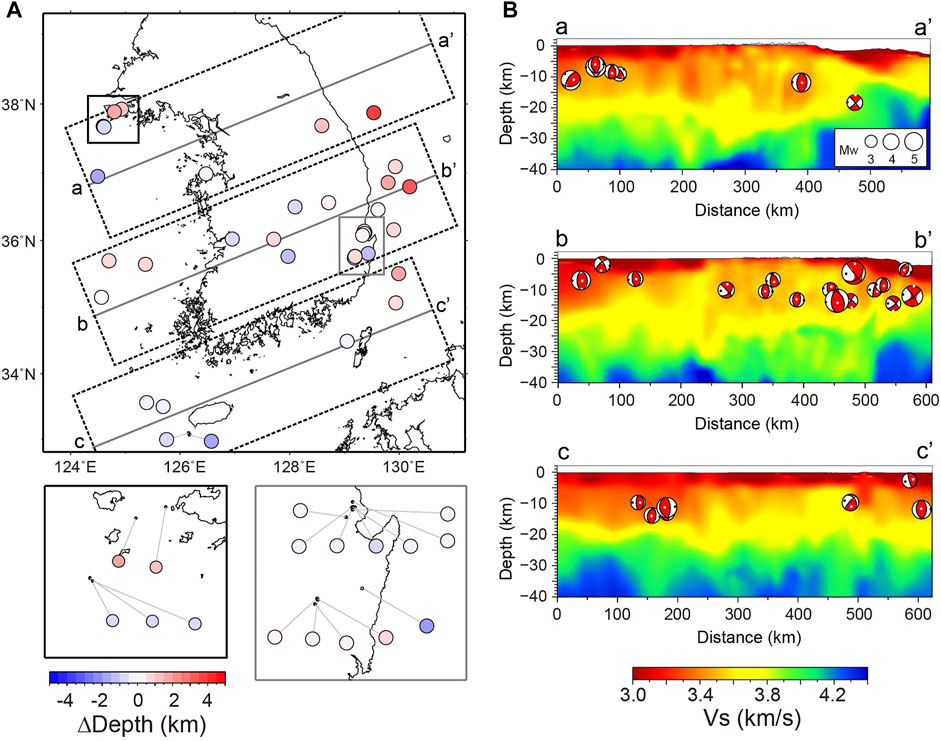
FIGURE 6. (A) Variation in centroid depth of events constrained with the 3D velocity model compared to the initial solutions determined using the TDMT method (Dreger and Helmberger, 1993). (B) Event locations with moment tensor solutions constrained by the 3D velocity model at different cross-sections. Locations of velocity profiles are shown as gray lines in A, with the range of plotted focal mechanisms indicated by dashed rectangles.
Figure 7 compares the moment magnitude (Mw) constrained with 3D and 1D velocity models. Generally, the magnitude values showed a 1:1 correlation between estimates. Relatively large discrepancies (∼0.05–0.1) were found for those that occurred in the offshore continental margin.

FIGURE 7. Comparisons of event magnitude determined via the 3D and 1D velocity models. Circles indicate the magnitudes of the analyzed events. Gray solid and dashed lines indicate a 1:1 correlation between the magnitudes, and its two standard deviations (∼0.05), as calculated based on the uncertainties of moment tensor components from bootstrap analyses averaged over all events. Blue, green, and red circles indicate events (Mw > 4) whose magnitude differences exceeded the uncertainty ranges, and the corresponding focal mechanisms are shown in the inset map in the lower right.
Discussions
The overall high DC values (>80%) of continental earthquakes indicated that the moment tensor of earthquakes was well represented by shear slip on a planar fault. Most of the regional earthquakes in the southern KP exhibited shear slip on a planar fault with a high DC percentage (>80%) (e.g., Rhie and Kim, 2010; Kim Y. et al., 2016), which can be reasonably considered as point sources with minimal fault geometry and slip history complexity, owing to their small magnitudes (Mw < 5). Therefore, additional increases in DC values with the 3D model potentially suggest that the moment tensor solutions can be more precisely constrained via the calculation of accurate wave propagations.
Except for some earthquakes (especially in volcanic and geothermal areas) or explosions, rupture processes of most small-to-moderate sized tectonic earthquakes can be represented by shear faulting on a planar fault, in which the moment tensor components are composed solely of DC components (i.e., DC = 100%; Julian et al., 1998); however, the moment tensors constrained with real datasets often reveal DC percentages < 100%. Such decreases in DC percentage can be derived from various origins, including uncertainties in source parameters due to limited station azimuthal coverage, lower signal-to-noise ratios of the observed waveforms, inaccurate waveform predictions due to unaccounted for 3D heterogeneity, or complex source properties (e.g., slip on a non-planar fault) (Julian et al., 1998). Under the same condition in dataset and source-receiver pairs, the meaningful increases in DC components with the 3-D regional velocity model here indicate that portions of a non-DC component of source parameters can be reduced by accounting for lateral velocity variations. Relatively large increases in DC components (15–25%) were observed for earthquakes in the offshore southeastern continental margin, where large lateral velocity variations (> 10%) in the crust existed for the eastern continental margin of the KP. The structures reflect transitions from the continental to oceanic crust, or thick sedimentary basins formed by late Cretaceous to Cenozoic rifting processes (Cho et al., 2004; Hong, 2010; Kim et al., 2019). The present results show that these complex structures were well reflected in the regional 3D velocity model (Figure 2B), thereby improving the depiction of seismic full waveforms by accurately constraining moment tensors for offshore events.
Even with datasets of clear waveforms and good azimuthal coverage, the mainshock (Mw = 5.4) of the earthquake sequences in the Pohang area (Figure 3, top of the blue box), consistently showed low DC percentage in both models (1D ∼ 35%, 3D ∼ 45%). Notably, this event has been reported to be the first non-DC event in South Korea (Song et al., 2018; Lee et al., 2020). Further, there are general increments in DC percentage with overall high DC values for nearby earthquakes when the 3D velocity model was used, indicating that the origin of a high non-DC component for the Pohang mainshock could be attributable to its source properties. Previously, the large non-DC component was explained by the slip motions on two intersecting faults (Grigoli et al., 2018; Son et al., 2020; Woo et al., 2020). Similar to the Pohang mainshock, there was a moderate-sized (Mw ∼5) earthquake with a relatively lower DC percentage (∼65%) offshore of Uljin in the eastern continental margin (Figure 1A). This event occurred on a deep-seated (> 10 km) pre-existing feature that was expressed on the surface as the basement escarpment along the western slope of the Ulleung Basin (Kim G. B. et al., 2018). Given that other adjacent earthquakes generally showed increases in DC percentages for the 3D velocity model (producing overall high DC values > 80%), the relatively high non-DC fraction of this earthquake could be due to complex source processes (e.g., non-planar fault slips). Structures of curved dipping faults (i.e., listric faults) have been found on the eastern continental shelf (e.g., Han et al., 2019; Moon et al., 2022). There were formed by tectonic processes associated with back-arc rifting and breakup in the East Sea during the late Oligocene to early Miocene (Chough et al., 2018) and perhaps being reactivated by an east-west compressional stress regime in the late Cenozoic (Kim et al., 2006; Choi et al., 2012). Pre-existing fault structures with curvature could accommodate slips that could not be represented by those on a single planar fault, potentially generating high non-DC components (Julian et al., 1998). Relatively small decreases (5–10%) in DC percentages were observed in the 3D velocity model, especially for those of small magnitudes (Mw < 4). This could be due to uncertainties in source parameters constrained by datasets with limited azimuthal (or distance) coverages maintaining low signal-to-noise ratios, or the inaccuracy of 3D velocity structures due to limited resolutions at model boundaries; however, complex rupture characteristics cannot be ruled out for moderate-sized (Mw ∼ 4–5) earthquakes in the Yellow Sea or southern offshore region of the continental margin.
It was also noticed that the proportion of DC components increased by 15–20% for the offshore earthquakes (Figure 3C), where there were large lateral velocity gradients in the crust (dlnVs/Horizontal distance ∼ 10%/50 km; Figure 2A). The reduced waveform misfits between the observed and synthetic values, together with decreases in DC fractions of focal mechanisms, strongly supported the efficacy of using the 3D velocity model for reproducing more accurate seismic wave propagations with improved constraints of source parameters (Hejrani et al., 2017). The improvements in waveform fitting are likely attributable to a better depiction of marginal structures in the 3D velocity model (Figure 2), and the more accurate reproductions of seismograms leading to improvements in the focal mechanism solutions (Figure 3B). A similar example showing waveform complexity that can be reproduced by the 3D velocity model was found for a Yellow Sea event (Figure 5B) occurring at a very shallow depth (∼2 km), adjacent to a sedimentary basin with a thickness of > 1 km (Figure 1A). Surface waves originating from this event were strongly dispersed while propagating through the sedimentary basin with low shear wave velocity (< 2 km s−1; Figure 5B, cross-section b-b’; Feng and Ritzwoller, 2017), which were successfully reproduced in the 3D model.
The variations of centroid depths were meaningful, while lateral locations were not significantly changed compared to initial values. Previous studies have found increases in crustal velocity from the eastern margin of the KP towards the East Sea correlated with decreasing crustal thickness (Kim et al., 2003). Since the regional 1D velocity model was constructed for the continental KP (Kim et al., 2011), this model exhibited relatively slower velocities than the 3D model at the continental margin. Accordingly, using the 1D velocity model for the analysis of initial source mechanisms could create biases towards shallower depths by predicting delayed arrival times. The crust thins out towards the east and reached ∼20–25 km (Figure 2C). Seismogenic depths ≤ 19 km potentially indicate that pre-existing features extend down to lower crusts (as suggested by previous studies—Kim et al., 2006; Moon et al., 2022), along with rheological condition changes (Prieto et al., 2017; Tape et al., 2018), or crustal thickening due to more mafic lower crustal compositions (Albaric et al., 2009). There were slight decreases (∼0.1–0.6 km) in centroid depths from 2–7 km to 1.4–6.7 km for the Pohang area earthquake sequences. These results are consistent with hypocenters determined via travel time calculations using local 3D velocity structures (Jung et al., 2022). Earthquake depths in the KP inland generally ranged from 1.4 to 15 km, corresponding to the upper to middle crust (Kim et al., 2011). Events at comparably shallow depths (< 2 km) were mostly found adjacent to sedimentary basins in oceanic regions.
A clear 1:1 correlation between the moment magnitudes estimated from the 1D and 3D velocity models indicates that the event magnitudes can be determined consistently by both models, which agrees with previous findings indicating that the moment magnitude was less dependent on the velocity model (Hejrani et al., 2017). Relatively large discrepancies (∼0.05–0.1) between the two magnitudes found for those occurred in the offshore continental margin, possibly due to the effects of 3D heterogeneity, which can cause non-radial seismic energy propagation from the source due to refraction (Koketsu and Kikuchi, 2000) or waveguide effects (Denolle et al., 2014). These effects could lead to the variable intensity and magnitude estimates depending on station locations. Other effects of 3D heterogeneity include seismic attenuation, where a portion of seismic energies can be dissipated via anelastic properties of the medium, resulting in apparently lower magnitudes if left unaccounted for (Hong, 2010). For more detailed analyses of event magnitudes, further investigations are needed accounting for attenuation effects with precise information of event locations, and constrained by 3D velocity models.
The results here show that the combination of improved source parameters and accurate wave propagation calculations in 3D mediums can reproduce synthetic waveforms that are more comparable to observations. Improvements in moment tensor solution quality via 3D waveform simulations have been reported for other geographic regions. For example, a new centroid moment tensor catalog based on a 3D Earth model for northern Australia (Hejrani et al., 2017; Hejrani and Tkalčić, 2020) produced a meaningful increase in the DC percentage (up to 70%) compared to the Global Centroid Moment Tensor solutions (Ekström et al., 2012), with a source mechanism that was in better accordance with local tectonic features. In addition, studies that analyzed source parameters of earthquakes in Southern California found that waveform simulations with a high-resolution 3D velocity model yielded substantial reductions in the uncertainties and non-DC components by reproducing the observed waveforms with reduced misfits (Liu et al., 2004; Wang and Zhan, 2020). Similar results obtained in this study support the use of a regional 3D velocity model for more accurate constraints on the source mechanism and seismic waveforms. Compared to the 1D velocity model, we found significant differences in waveform shapes and amplitudes when a 3D velocity effect was considered, particularly for earthquakes adjacent to coastal and offshore areas. From 2003 to 2021, > 50% of the events with Mw > 3.3 occurred in offshore regions. Placing accurate constraints on source parameters and the resultant ground shaking calculated via the high-resolution regional 3D velocity model, can thereby contribute to improved assessments of potential seismic hazards from these earthquakes to major cities with high populations or nuclear power plants adjacent to the coastal regions (Figure 1A).
Conclusion
We determined the regional moment tensor and locations of seismic events that occurred in and around the southern KP based on the spectral element moment tensor inversion method with a regional 3D crustal and upper mantle model. The recent development of a high-resolution 3D velocity model in this region, together with a high-performance computing system, allowed for the calculation of full waveforms and their derivatives with respect to source parameters in the 3D velocity model. The 3D model depicted lateral variation in seismic velocity that accords with surface geological and tectonic features. Synthetic waveforms and their derivatives were accurately calculated for source parameters using the spectral element method and 3D velocity model at periods ≥ 6 s. Ultimately, improvements in waveform fitting between synthetic and observation values were observed, particularly for events that occurred in the offshore areas when the moment tensor solutions and wave propagations were determined with the regional 3D velocity model. The results indicated the importance of employing a 3D velocity model for accurately constraining source parameters and the resultant ground shaking. Accordingly, we anticipate that the accurate wave simulations, together with improved source mechanisms determined via the 3D velocity model, can be applied for the reliable assessment of seismic hazards in regions with complex velocity structures (e.g., continental margin, sedimentary basins).
Data Availability Statement
The original contributions presented in the study are included in the article/Supplementary Material, further inquiries can be directed to the corresponding author.
Author Contributions
J-HS was responsible for data acquisition, processing, and writing of the original manuscript. SK and JR conceptualized the study and participated in writing the manuscript. DP helped analyze the results and review the original draft. All authors have read and approved the final version of the submitted manuscript.
Funding
This work was funded by the Korea Meteorological Institute under Grant KMI 2021-02010.
Conflict of Interest
Author DP was employed by Korea Hydro & Nuclear Power Co., Ltd.
The remaining authors declare that the research was conducted in the absence of any commercial or financial relationships that could be construed as a potential conflict of interest.
Publisher’s Note
All claims expressed in this article are solely those of the authors and do not necessarily represent those of their affiliated organizations, or those of the publisher, the editors and the reviewers. Any product that may be evaluated in this article, or claim that may be made by its manufacturer, is not guaranteed or endorsed by the publisher.
Acknowledgments
We thank KMA, KIGAM, KHNP, NIED, and JMA for providing continuous waveform data. Most figures were generated using Generic Mapping Tools (Wessel et al., 2013). We acknowledge Jeong-Ung Woo for instructing numerical mesh generation, and Hwa Sung Cheon for installing SPECFEM3D with GPUs.
Supplementary Material
The Supplementary Material for this article can be found online at: https://www.frontiersin.org/articles/10.3389/feart.2022.945022/full#supplementary-material
Reference
Albaric, J., Déverchère, J., Petit, C., Perrot, J., and Le Gall, B. (2009). Crustal Rheology and Depth Distribution of Earthquakes: Insights from the Central and Southern East African Rift System. Tectonophysics 468, 28–41. doi:10.1016/j.tecto.2008.05.021
Bird, P. (2003). An Updated Digital Model of Plate Boundaries. Geochem. Geophys. Geosyst. 4, 1027. doi:10.1029/2001GC000252
Chang, S.-J., and Baag, C.-E. (2007). Moho Depth and Crustal Vp/Vs Variation in Southern Korea from Teleseismic Receiver Functions: Implication for Tectonic Affinity between the Korean Peninsula and China. Bull. Seismol. Soc. Am. 97, 1621–1631. doi:10.1785/0120050264
Cho, H.-M., Kim, H.-J., Jou, H.-T., Hong, J.-K., and Baag, C.-E. (2004). Transition from Rifted Continental to Oceanic Crust at the Southeastern Korean Margin in the East Sea (Japan Sea). Geophys. Res. Lett. 31, L07606. doi:10.1029/2003GL019107
Choi, H., Hong, T.-K., He, X., and Baag, C.-E. (2012). Seismic Evidence for Reverse Activation of a Paleo-Rifting System in the East Sea (Sea of Japan). Tectonophysics 572-573, 123–133. doi:10.1016/j.tecto.2011.12.023
Chough, S. K., Shinn, Y. J., and Yoon, S. H. (2018). Regional Strike-Slip and Initial Subsidence of Korea Plateau, East Sea: Tectonic Implications for the Opening of Back-Arc Basins. Geosci. J. 22, 533–547. doi:10.1007/s12303-018-0017-0
Christensen, N. I., and Mooney, W. D. (1995). Seismic Velocity Structure and Composition of the Continental Crust: a Global View. J. Geophys. Res. 100, 9761–9788. doi:10.1029/95JB00259
Conte, S. D., and Boor, C. (1980). Elementary Numerical Analysis: An Algorithm Approach. New York: McGraw-Hill.
Denolle, M. A., Dunham, E. M., Prieto, G. A., and Beroza, G. C. (2014). Strong Ground Motion Prediction Using Virtual Earthquakes. Science 343, 399–403. doi:10.1126/science.1245678
Dreger, D. S., and Helmberger, D. V. (1993). Determination of Source Parameters at Regional Distances with Three-Component Sparse Network Data. J. Geophys. Res. 98, 8107–8125. doi:10.1029/93JB00023
Ekström, G., Nettles, M., and Dziewoński, A. M. (2012). The Global CMT Project 2004-2010: Centroid-Moment Tensors for 13,017 Earthquakes. Phys. Earth Planet. Interiors 200-201, 1–9. doi:10.1016/j.pepi.2012.04.002
Feng, L., and Ritzwoller, M. H. (2017). The Effect of Sedimentary Basins on Surface Waves that Pass through Them. Geophys. J. Int. 211, 572–592. doi:10.1093/gji/ggx313
Fichtner, A., and Tkalčić, H. (2010). Insights into the Kinematics of a Volcanic Caldera Drop: Probabilistic Finite-Source Inversion of the 1996 Bárdarbunga, Iceland, Earthquake. Earth Planet. Sci. Lett. 297, 607–615. doi:10.1016/j.epsl.2010.07.013
Ford, S. R., Dreger, D. S., and Walter, W. R. (2009). Identifying Isotropic Events Using a Regional Moment Tensor Inversion. J. Geophys. Res. 114, 11. doi:10.1029/2008JB005743
Gallovič, F., Valentová, Ľ., Ampuero, J. P., and Gabriel, A. A. (2019). Bayesian Dynamic Finite‐Fault Inversion: 2. Application to the 2016 M W 6.2 Amatrice, Italy, Earthquake. J. Geophys. Res. Solid Earth 124 (7), 6970–6988. doi:10.1029/2019JB017512
Grigoli, F., Cesca, S., Rinaldi, A. P., Manconi, A., López-Comino, J. A., Clinton, J. F., et al. (2018). The November 2017 M W 5.5 Pohang Earthquake: a Possible Case of Induced Seismicity in South Korea. Science 360, 1003–1006. doi:10.1126/science.aat2010
Han, M., Kim, H.-J., Kang, S. Y., Kim, K.-H., Yoon, S.-H., and Kyung, J. B. (2019). Detection of Microearthquakes and Identification of Their Causative Structures in the Eastern Offshore Region of South Korea. Tectonophysics 750, 36–44. doi:10.1016/j.tecto.2018.11.003
Hejrani, B., Tkalčić, H., and Fichtner, A. (2017). Centroid Moment Tensor Catalogue Using a 3‐D Continental Scale Earth Model: Application to Earthquakes in Papua New Guinea and the Solomon Islands. J. Geophys. Res. Solid Earth 122, 5517–5543. doi:10.1002/2017JB014230
Hejrani, B., and Tkalčić, H. (2020). Resolvability of the Centroid‐Moment‐Tensors for Shallow Seismic Sources and Improvements From Modeling High‐Frequency Waveforms. J. Geophys. Res. Solid Earth 125, e2020JB019643. doi:10.1029/2020JB019643
Hingee, M., Tkalčić, H., Fichtner, A., and Sambridge, M. (2011). Seismic Moment Tensor Inversion Using a 3-D Structural Model: Applications for the Australian Region. Geophys. J. Int. 184, 949–964. doi:10.1111/j.1365-246X.2010.04897.x
Hong, T.-K., and Choi, H. (2012). Seismological Constraints on the Collision Belt between the North and South China Blocks in the Yellow Sea. Tectonophysics 570-571, 102–113. doi:10.1016/j.tecto.2012.08.034s
Hong, T.-K. (2010). Lg Attenuation in a Region with Both Continental and Oceanic Environments. Bull. Seismol. Soc. Am. 100, 851–858. doi:10.1785/0120090057
Hong, T.-K., Park, S., Lee, J., Chung, D., and Kim, W. (2020). One-off Deep Crustal Earthquake Swarm in a Stable Intracontinental Region of the Southwestern Korean Peninsula. Phys. Earth Planet. Interiors 308, 106582. doi:10.1016/j.pepi.2020.106582
Huo, Y., Zhang, W., and Zhang, J. (2021). Centroid Moment Tensor of the 2019 MW 5.7 Changning Earthquake Refined Using 3D Green's Functions Considering Surface Topography. Front. Earth Sci. 9, 642721. doi:10.3389/feart.2021.642721
Julian, B. R., Miller, A. D., and Foulger, G. R. (1997). Non-double-couple Earthquake Mechanisms at the Hengill-Grensdalur Volcanic Complex, Southwest Iceland. Geophys. Res. Lett. 24, 743–746. doi:10.1029/97GL00499
Julian, B. R., Miller, A. D., and Foulger, G. R. (1998). Non-double-couple Earthquakes 1. Theory. Rev. Geophys. 36, 525–549. doi:10.1029/98RG00716
Jung, Y., Woo, J.-U., and Rhie, J. (2022). Enhanced Hypocenter Determination of the 2017 Pohang Earthquake Sequence, South Korea, Using a 3-D Velocity Model. Geosci. J. 26 , 1–13. doi:10.1007/s12303-021-0043-1
Kim, G. B., Yoon, S.-H., Kim, S.-S., and So, B.-D. (2018). Transition from Buckling to Subduction on Strike-Slip Continental Margins: Evidence from the East Sea (Japan Sea). Geology 46, 603–606. doi:10.1130/G40305.1
Kim, H.-J., Jou, H.-T., Cho, H.-M., Bijwaard, H., Sato, T., Hong, J.-K., et al. (2003). Crustal Structure of the Continental Margin of Korea in the East Sea (Japan Sea) from Deep Seismic Sounding Data: Evidence for Rifting Affected by the Hotter Than Normal Mantle. Tectonophysics 364, 25–42. doi:10.1016/S0040-1951(03)00048-9
Kim, H.-J., Kim, C.-H., Hao, T., Liu, L., Kim, K.-H., Jun, H., et al. (2019). Crustal Structure of the Gunsan Basin in the SE Yellow Sea from Ocean Bottom Seismometer (OBS) Data and its Linkage to the South China Block. J. Asian Earth Sci. 180, 103881. doi:10.1016/j.jseaes.2019.103881
Kim, K. H., Ree, J.-H., Kim, Y., Kim, S., Kang, S. Y., and Seo, W. (2018). Assessing whether the 2017 M W 5.4 Pohang Earthquake in South Korea Was an Induced Event. Science 360, 1007–1009. doi:10.1126/science.aat6081
Kim, S., Dettmer, J., Rhie, J., and Tkalčić, H. (2016a). Highly Efficient Bayesian Joint Inversion for Receiver-Based Data and its Application to Lithospheric Structure beneath the Southern Korean Peninsula. Geophys, J. Int. 206, 328–344. doi:10.1093/gji/ggw149
Kim, S., Rhie, J., and Kim, G. (2011). Forward Waveform Modelling Procedure for 1-D Crustal Velocity Structure and its Application to the Southern Korean Peninsula. Geophys. J. Int. 185, 453–468. doi:10.1111/j.1365-246X.2011.04949.x
Kim, S., Tkalčić, H., Rhie, J., and Chen, Y. (2016b). Intraplate Volcanism Controlled by Back-Arc and Continental Structures in NE Asia Inferred from Transdimensional Bayesian Ambient Noise Tomography. Geophys. Res. Lett. 43, 8390–8398. doi:10.1002/2016GL069483
Kim, S., Tkalčić, H., and Rhie, J. (2017). Seismic Constraints on Magma Evolution beneath Mount Baekdu (Changbai) Volcano from Transdimensional Bayesian Inversion of Ambient Noise Data. J. Geophys. Res. Solid Earth 122, 5452–5473. doi:10.1002/2017JB014105
Kim, W. Y., Noh, M. H., and Choi, H. S. (2006). The 29 May 2004 Offshore Southeast Coast of Korea Earthquake Sequence: Shallow Earthquakes in the Ulleung Back-Arc Basin, East Sea (Sea of Japan). J. Korean Geophys. Soc. 9, 249–262.
Kim, Y., Lee, C., and Kim, S.-S. (2015). Tectonics and Volcanism in East Asia: Insights from Geophysical Observations. J. Asian Earth Sci. 113, 842–856. doi:10.1016/j.jseaes.2015.07.032
Kim, Y., Rhie, J., Kang, T.-S., Kim, K.-H., Kim, M., and Lee, S.-J. (2016). The 12 September 2016 Gyeongju Earthquakes: 1. Observation and Remaining Questions. Geosci. J. 20, 747–752. doi:10.1016/j.jseaes.2015.07.03210.1007/s12303-016-0033-x
Koketsu, K., and Kikuchi, M. (2000). Propagation of Seismic Ground Motion in the Kanto Basin, Japan. Science 288, 1237–1239. doi:10.1126/science.288.5469.1237
Komatitsch, D., Erlebacher, G., Göddeke, D., and Michéa, D. (2010). High-order Finite-Element Seismic Wave Propagation Modeling with MPI on a Large GPU Cluster. J. Comput. Phys. 229, 7692–7714. doi:10.1016/j.jcp.2010.06.024
Komatitsch, D., Liu, Q., Tromp, J., Suss, P., Stidham, C., and Shaw, J. H. (2004). Simulations of Ground Motion in the Los Angeles Basin Based upon the Spectral-Element Method. Bull. Seismol. Soc. Am. 94, 187–206. doi:10.1785/0120030077
Komatitsch, D., and Tromp, J. (2003). A Perfectly Matched Layer Absorbing Boundary Condition for the Second-Order Seismic Wave Equation. Geophys. J. Int. 154, 146–153. doi:10.1046/j.1365-246X.2003.01950.x
Komatitsch, D., and Tromp, J. (1999). Introduction to the Spectral Element Method for Three-Dimensional Seismic Wave Propagation. Geophys. J. Int. 139, 806–822. doi:10.1046/j.1365-246x.1999.00967.x
Komatitsch, D., and Tromp, J. (2002). Spectral-element Simulations of Global Seismic Wave Propagation-I. Validation. Valid. Geophys. J. Int. 149, 390–412. doi:10.1046/j.1365-246X.2002.01653.x
Lee, J., Kim, S., and Marija, M. (2020). Uncertainty Estimation of Moment Tensor Solutions for the 2017 Mw 5.5 Pohang Earthquake Using Hierarchical Bayesian Inversion Method. Abstr. retrieved Abstr. Am. Geophys. Union Fall Meet. 2020, S011–S0001.
Lee, J., Song, J.-H., Kim, S., Rhie, J., and Song, S. G. (2022). Three-Dimensional Seismic-Wave Propagation Simulations in the Southern Korean Peninsula Using Pseudodynamic Rupture Models. Bull. Seismol. Soc. Am. 112, 939–960. doi:10.1785/0120210172
Lee, S.-J., Rhie, J., Kim, S., Kang, T.-S., and Kim, G. B. (2015). Ambient Seismic Noise Tomography of the Southern East Sea (Japan Sea) and the Korea Strait. Geosci. J. 19, 709–720. doi:10.1007/s12303-015-0012-7
Lee, S. J., Huang, B. S., Liang, W. T., and Kou-Cheng, C. (2010). Grid-based Moment Tensor Inversion Technique by Using 3-D Green’s Functions Database: a Demonstration of the 23 October 2004 Taipei Earthquake. Terr. Atmos. Ocean. Sci. 21, 5. doi:10.3319/TAO.2010.01.25.02(TH)
Li, J., Zheng, Y., Thomsen, L., Lapen, T. J., and Fang, X. (2018). Deep Earthquakes in Subducting Slabs Hosted in Highly Anisotropic Rock Fabric. Nat. Geosci. 11, 696–700. doi:10.1038/s41561-018-0188-3
Liu, Q., Polet, J., Komatitsch, D., and Tromp, J. (2004). Spectral-element Moment Tensor Inversions for Earthquakes in Southern California. Bull. Seismol. Soc. Am. 94, 1748–1761. doi:10.1785/012004038
Maggi, A., Tape, C., Chen, M., Chao, D., and Tromp, J. (2009). An Automated Time-Window Selection Algorithm for Seismic Tomography. Geophys. J. Int. 178, 257–281. doi:10.1111/j.1365-246X.2009.04099.x
Moon, S., Kim, H.-J., Kim, K.-H., Yoo, D.-G., Lee, S.-H., Son, W.-H., et al. (2022). Correlation of Seismicity with Geologic Structures at the Middle Eastern Korean Margin in the East Sea (Japan Sea) and Seismic Hazard Assessment. Mar. Geophys Res. 43, 1–11. doi:10.1007/s11001-022-09479-9
Mustać, M., Hejrani, B., Tkalčić, H., Kim, S., Lee, S.-J., and Cho, C.-S. (2020). Large Isotropic Component in the Source Mechanism of the 2013 Democratic People's Republic of Korea Nuclear Test Revealed via a Hierarchical Bayesian Inversion. Bull. Seismol. Soc. Am. 110, 166–177. doi:10.1785/0120190062
Park, D., Song, S. G., and Rhie, J. (2020). Sensitivity Analysis of Near-Source Ground Motions to Pseudo-dynamic Source Models Derived with 1-point and 2-point Statistics of Earthquake Source Parameters. J. Seismol. 24, 397–422. doi:10.1007/s10950-020-09905-8
Prieto, G. A., Froment, B., Yu, C., Poli, P., and Abercrombie, R. (2017). Earthquake Rupture below the Brittle-Ductile Transition in Continental Lithospheric Mantle. Sci. Adv. 3, e1602642. doi:10.1126/sciadv.1602642
Rhie, J., and Kim, S. (2010). Regional Moment Tensor Determination in the Southern Korean Peninsula. Geosci. J. 14, 329–333. doi:10.1007/s12303-010-0038-9
Rhie, J., Kim, S., Woo, J. U., and Song, J. H. (2016). Three-dimensional Velocity Model of Crustal Structure in the Southern Korean Peninsula and its Full-Waveform Validations. Am. Geophys. Union Fall Meet. 2016, S43B–S2861.
Saikia, C. K. (1994). Modified Frequency-Wavenumber Algorithm for Regional Seismograms Using Filon's Quadrature: Modelling ofLgwaves in Eastern North America. Geophys. J. Int. 118, 142–158. doi:10.1111/j.1365-246X.1994.tb04680.x
Son, M., Cho, C. S., Lee, H. K., Han, M., Shin, J. S., Kim, K., et al. (2020). Partitioned Fault Movement and Aftershock Triggering: Evidence for Fault Interactions during the 2017 M W 5.4 Pohang Earthquake, South Korea. JGR Solid Earth 125, e2020JB020005. doi:10.1029/2020JB020005
Son, Y. O., Seo, M.-S., and Kim, Y. (2021). Measurement of Seismometer Misorientation Based on P-Wave Polarization: Application to Permanent Seismic Network in South Korea. Geosci. J. 26, 235–247. doi:10.1007/s12303-021-0031-5
Song, J. H., Woo, J. U., Rhie, J., Kim, S., and Kang, T. S. (2018). “Source Analysis of November 15, 2017 Pohang Earthquake Sequences: the First Non-double Couple Event Reported in South Korea,” in Geosciences Union General Assembly Conference, Vienna, Austria, 4-13 April, 2018, 12279. Abstract retrieved from Abstracts in European.
Straume, E. O., Gaina, C., Medvedev, S., Hochmuth, K., Gohl, K., Whittaker, J. M., et al. (2019). GlobSed: Updated Total Sediment Thickness in the World's Oceans. Geochem. Geophys. Geosyst. 20, 1756–1772. doi:10.1029/2018GC008115
Takemura, S., Okuwaki, R., Kubota, T., Shiomi, K., Kimura, T., and Noda, A. (2020). Centroid Moment Tensor Inversions of Offshore Earthquakes Using a Three-Dimensional Velocity Structure Model: Slip Distributions on the Plate Boundary along the Nankai Trough. Geophys. J. Int. 222, 1109–1125. doi:10.1093/gji/ggaa238
P. Talwani (Editor) (2014). Intraplate Earthquakes. 1st ed. (New York: Cambridge University Press). doi:10.1017/CBO9781139628921
Tape, C., Holtkamp, S., Silwal, V., Hawthorne, J., Kaneko, Y., Ampuero, J. P., et al. (2018). Earthquake Nucleation and Fault Slip Complexity in the Lower Crust of Central Alaska. Nat. Geosci. 11, 536–541. doi:10.1038/s41561-018-0144-2
Tape, C., Liu, Q., Maggi, A., and Tromp, J. (2009). Adjoint Tomography of the Southern California Crust. Science 325, 988–992. doi:10.1126/science.1175298
Tape, C., Liu, Q., Maggi, A., and Tromp, J. (2010). Seismic Tomography of the Southern California Crust Based on Spectral-Element and Adjoint Methods. Geophys. J. Int. 180, 433–462. doi:10.1111/j.1365-246X.2009.04429.x
Vavryčuk, V. (2011). Detection of High-Frequency Tensile Vibrations of a Fault during Shear Rupturing: Observations from the 2008 West Bohemia Swarm. Geophys. J. Int. 186, 1404–1414. doi:10.1111/j.1365-246X.2011.05122.x
Wang, X., and Zhan, Z. (2020). Moving from 1-D to 3-D Velocity Model: Automated Waveform-Based Earthquake Moment Tensor Inversion in the Los Angeles Region. Geophys. J. Int. 220, 218–234. doi:10.1093/gji/ggz435
Wessel, P., Smith, W. H. F., Scharroo, R., Luis, J., and Wobbe, F. (2013). Generic Mapping Tools: Improved Version Released. Eos Trans. AGU 94, 409–410. doi:10.1002/2013EO450001
Willacy, C., van Dedem, E., Minisini, S., Li, J., Blokland, J. W., Das, I., et al. (2018). Application of Full-Waveform Event Location and Moment-Tensor Inversion for Groningen Induced Seismicity. Lead. Edge 37 (2), 92–99. doi:10.1190/tle37020092.1
Woo, J.-U., Kim, M., Rhie, J., and Kang, T.-S. (2020). Aftershock Sequence and Statistics of the 2017 Mw 5.5 Pohang, South Korea, Earthquake: Implications of Fault Heterogeneity and Postseismic Relaxation. Bull. Seismol. Soc. Am. 110, 2031–2046. doi:10.1785/0120200059
Keywords: earthquake source parameters, seismic waveform simulation, 3D velocity model, spectral-element method, Southern Korean Peninsula
Citation: Song J-H, Kim S, Rhie J and Park D (2022) Moment Tensor Solutions for Earthquakes in the Southern Korean Peninsula Using Three-Dimensional Seismic Waveform Simulations. Front. Earth Sci. 10:945022. doi: 10.3389/feart.2022.945022
Received: 16 May 2022; Accepted: 14 June 2022;
Published: 05 July 2022.
Edited by:
Mourad Bezzeghoud, Escola de Ciência e Tecnologia, Universidade de Évora, PortugalReviewed by:
Rohtash Kumar, Banaras Hindu University, IndiaBouhadad Youcef, National Earthquake Engineering Center (CGS), Algeria
José Borges, University of Evora, Portugal
Copyright © 2022 Song, Kim, Rhie and Park. This is an open-access article distributed under the terms of the Creative Commons Attribution License (CC BY). The use, distribution or reproduction in other forums is permitted, provided the original author(s) and the copyright owner(s) are credited and that the original publication in this journal is cited, in accordance with accepted academic practice. No use, distribution or reproduction is permitted which does not comply with these terms.
*Correspondence: Seongryong Kim, c2VvbmdyeW9uZ2tpbUBrb3JlYS5hYy5rcg==