 Xiaoming Xu
 Zhifeng Ding
 Huili Guo1,2
 Xinfu Li
- 1Institute of Geophysics, China Earthquake Administration, Beijing, China
- 2Key Laboratory of Earthquake Source Physics, China Earthquake Administration, Beijing, China
- 3School of Geophysics and Information Technology, China University of Geosciences, Beijing, China
We present a high-resolution S wave velocity model of the Trans-North China Orogen (TNCO) and its adjacent areas derived from S wave traveltime residuals of teleseismic waveforms recorded by the dense ChinArray seismic network. Our model reveals S wave velocity anomalies beneath the study area, suggesting the strong lateral heterogeneities of the upper mantle structures. The upper mantle of the Datong volcano is dominated by the significant low velocity anomalies. In addition to the low-velocity zone rooted in the mantle transition zone beneath the Datong volcano region, two low velocity layers extend northwestward to the Hetao graben and southwestward to the southern TNCO within depths of 100–300 km, respectively. Based on these low-velocity anomalies, we provide new insights into the origin of the Datong volcano, which may be related to the asthenospheric upwelling originated from the water-rich mantle transition zone and horizontal mantle flows driven by the extrusion northeastward of the Tibetan plateau. A clear velocity contrast in the upper mantle above 300 km depth beneath the Ordos block and the TNCO implies that the Ordos block still preserves thick cratonic root while the lithosphere of the TNCO is modified. We propose that the asthenospheric upwelling and northeastward push of the Tibetan plateau account for the lithospheric deformation of the TNCO and its adjacent areas.
Introduction
The Trans-North China Orogen (TNCO) is an important part of the North China Craton (NCC), formed by the collision between the eastern NCC and western NCC in the Late Paleoproterozoic (Zhao et al., 2001). The TNCO mainly consists of the Taihang mountain, Lüliang mountain and a series of extensional grabens in-between, such as the Weihe graben and Fenhe graben (Figure 1). In contrast to the stable Ordos block with the thick and refractory Archean continental nucleus (Zhao et al., 2001), the TNCO has experienced intense tectonic deformation and magmatic activities since the Mesozoic, accompanied by the strong earthquakes (Liu and Wang, 2012). As the largest Quaternary intraplate volcanic group in the NCC (Xu et al., 2005; Fan et al., 2015), the Datong volcano is located in the northern TNCO (Figure 1). According to the surface topography, lithospheric thickness (Zhang et al., 2019) and gravity anomalies (Deng et al., 2014), the TNCO is considered as a transition zone between the eastern NCC undergone the dramatic rejuvenation and the western NCC remaining stable cratonic lithosphere. Therefore, the TNCO and its adjacent areas are ideal places to study the lithospheric deformation and tectonic evolution.
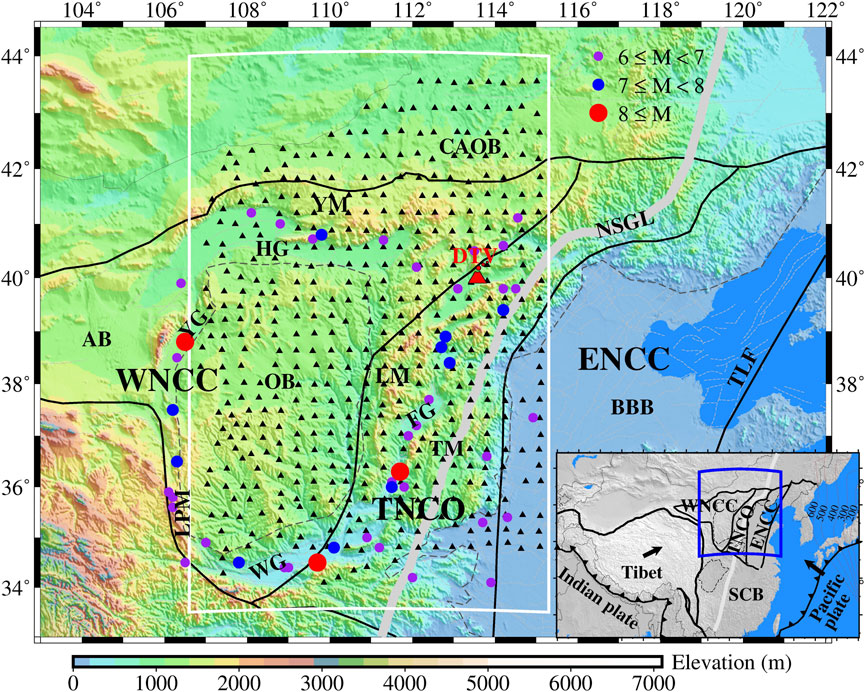
FIGURE 1. Distribution of seismic stations used in this study. The black triangles represent the seismic stations deployed by ChinArray project. The red volcanic symbol indicates the location of the Datong volcano (DTV). The color circles denote the large historic earthquakes of M ≥ 6 (Liu and Wang, 2012). The thick black lines outline the main tectonic units: the eastern NCC (ENCC), the western NCC (WNCC) and the Trans-North China Orogen (TNCO). The dashed black lines present the boundaries of the Ordos block (OB) and the Bohai bay basin (BBB). The thick gray line indicates the North-South Gravity Line (NSGL). The white rectangle outlines the study area. AB, the Alax black; CAOB, the Central Asia Orogenic Belt; YG, the Yinchuan graben; HG, the Hetao graben; WG, the Weihe graben; FG, the Fenhe graben; LPM, the Liupan mountain; YM, the Yin mountain; LM, the Lüliang mountain; TM, the Taihang mountain; TLF, the Tanlu fault. Inset shows the tectonic setting of the TNCO and its adjacent areas. SCB, the south China block. The black thick arrowhead indicates the absolute plate motion direction from GSRM v2.1 model (Kreemer et al., 2014).
Geochemical and geological studies have suggested that the lithospheric thinning and transformation occurred in the NCC (Xu et al., 2005; Zhu et al., 2011; Wu et al., 2019). In the western NCC, Xu et al. (2005) and Wu et al. (2019) believed that the mantle lithosphere still preserved the oldest crotonic root with a thickness up to 200 km. By comparison, the eastern NCC is characterized by the extensional basin and thinned lithosphere (<80 km) in response to the crustal and deep mantle deformations (Zhang et al., 2019; Zhu et al., 2021). It has been widely accept that these deformations in the eastern NCC were caused by the slab rollback associated with the subduction of the Pacific plate (Zhu et al., 2011; Wu et al., 2019). However, the debates continue regarding the mechanism of the lithospheric deformation in the TNCO. The previous tomographic images suggested that the dehydration of the Pacific stagnant slab resulted in the lithospheric thinning under the TNCO (Zhao, 2004; Huang and Zhao, 2006). Another hypothesis is the horizontal mantle flow escaping northeastward derived from the mantle materials of the Tibetan plateau (Liu et al., 2004). Recently, many observations revealed the existence of the mantle flow driven by the extrusion northeastward of the Tibetan plateau (e.g., Yu and Chen, 2016; Zhang et al., 2016; Gao et al., 2018; Chang et al., 2021). It is essential to obtain the detailed mantle structure of the TNCO and its adjacent areas to further understand the mechanism and dynamic process of the lithospheric deformation.
Seismic tomography is a powerful tool to image the Earth’s interior structure. In the past 2 decades, a number of seismic tomography inversions have been performed to construct the 3-D velocity models, focusing on the crustal and upper mantel structures of the TNCO and its adjacent areas (e.g., Zhao, 2004; Huang and Zhao, 2006; Lei, 2012; Xu et al., 2018b; Tao et al., 2018; Dong et al., 2021). Due to the differences in the used data and methods, there are still some contradictions between these models, such as the constraints on the origin of the Datong volcano and lithospheric thinning beneath the TNCO and its adjacent areas. Based on the resolved depth of the low velocity, the upwelling magma of the Datong volcano was attributed to the asthenospheric flow (Liu et al., 2004), lower mantle plum (Lei, 2012) and the dehydration of the Pacific stagnant slab (Zhao, 2004). In addition, the lithospheric thinning is revealed to be spatially heterogeneous under the TNCO and its adjacent areas (Tian et al., 2009; Xu et al., 2018b). The thinning mechanisms is still debated between the lithospheric delamination and mechanical erosion (Zhu et al., 2011; Wu et al., 2019). Thus, it is important to observe the detached lithosphere or large-scale mantle flow in the asthenosphere. The high-resolution velocity model of the crustal and upper mantle beneath the TNCO and its adjacent areas can help us clarify these aforementioned arguments. As the seismic array (Figure 1), the densest seismic network in the study area so far, was deployed by the ChinArray project (ChinArray-Himalaya, 2011), the great opportunity is provided to perform seismic tomography inversion and construct the high-resolution 3-D S wave velocity model.
In this paper, we plan to investigate the lithospheric deformation by obtaining the high-resolution 3-D S wave velocity model of the crustal and upper mantle beneath the TNCO and its adjacent areas. At present, a large amount of the high-quality seismic waveforms has been accumulated from the dense seismic array deployed in the TNCO and its adjacent areas (Figure 1), which has the highest spatial resolution compared to that used in the previous studies. By picking up the teleseismic S wave traveltime residuals, we perform the seismic tomography inversion to determine the 3-D S wave velocity model of the TNCO and its adjacent areas. Our tomographic results can provide new insights into the mechanism of the lithospheric deformation and improve the understanding on the tectonic evolution of the TNCO and its adjacent areas.
Data and Methods
To measure S wave traveltime residuals, we collected the teleseismic waveforms recorded by 464 portable seismic stations from ChinArray phase III deployment (Figure 1). The ChinArray project has operated since August 2011 (ChinArray-Himalaya, 2011), which plans to roll over the whole of mainland China with a dense seismic array consisting of more than 1,000 broadband seismographs. The phase III deployment of ChinArray project conducted from April 2016 to January 2019 covered well the TNCO and its adjacent areas with a station spacing of ∼30–40km (Figure 1). Each seismograph was equipped with a Guralp CMG-3ESP or CMG-3ESPC seismometer with a corner period of 120 s and a Reftek 130 data logger with a sampling rate of 100 Hz. This array is currently available with the highest station density in this study area.
All earthquake events were selected by the magnitude greater than Ms 5.0 and epicentral distance range of 30°–85°. Then, we rotated the two horizontal components into the radial (R) and transverse (T) directions after removing the means, trends and instrument responses of all seismograms. The waveform correlation method (Rawlinson and Kennett, 2004) was employed to pick up the relative S wave traveltime residuals on the rotated T component within the frequency band range of 0.02–0.2 Hz. In order to obtain the final accurate traveltime residuals, we first trashed the waveforms with low signal-to-noise ratio that were difficult for us to identify the S phases. At least 20 S wave arrival time picks were required for each selected earthquake event. Finally, our dataset used for the final inversion contained a total of 55,935 high-quality relative S wave traveltime residuals from 280 earthquakes. An example showing part of the picked S wave seismograms was demonstrated in Supplementary Figure S1. As shown in Figure 2, we also plotted the epicenter locations of all used earthquakes. Although most of the teleseismic events come from inside the western Pacific subduction zone and the Java trench, the overall coverages in backazimuth and epicentral distance are reasonably good to provide a crossed and dense distribution of the ray path.
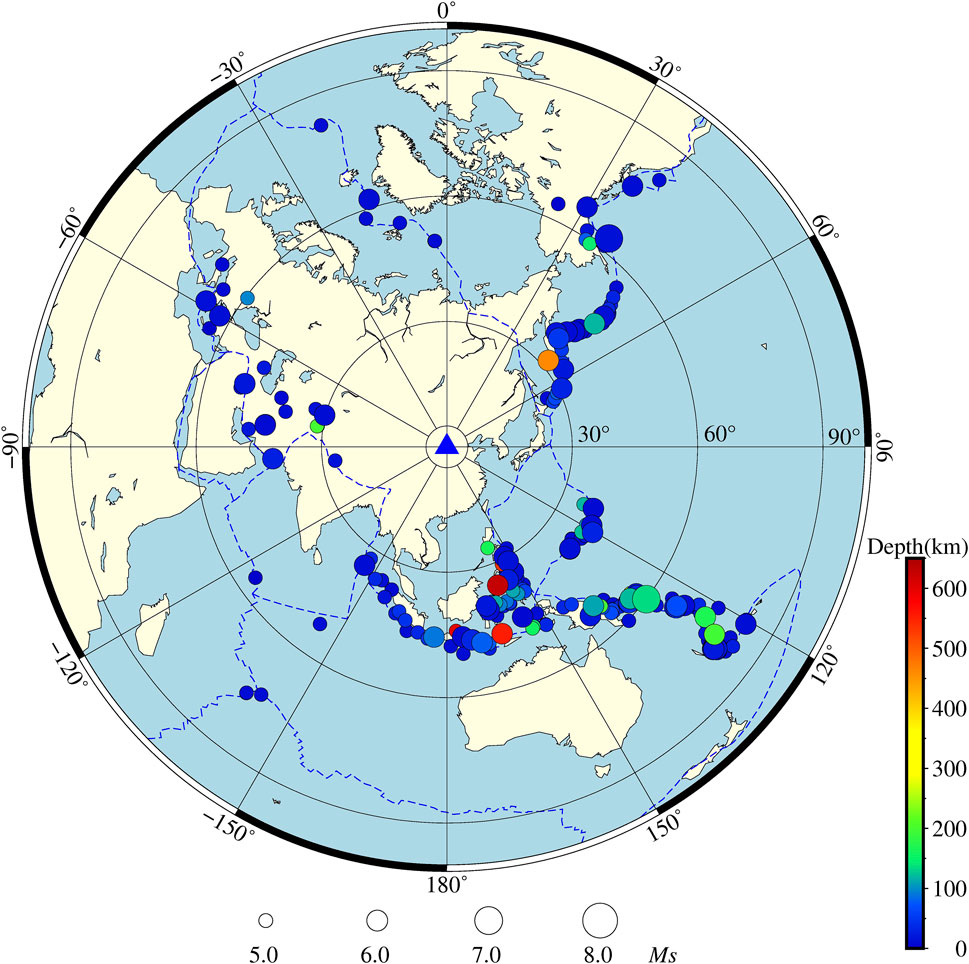
FIGURE 2. Locations of 280 earthquakes used in this study. The color filed circles show the epicenters. The size of the circles represents the earthquake magnitude and the color indicates event depth. Note that although some events are located inside the 30° circle, all the seismograms we used have an epicentral distance between 30° and 85°.
We used the teleseismic tomographic method proposed by Zhao et al. (1994) to perform the 3-D inversion by using the relative S wave traveltime residuals beneath the TNCO and its adjacent areas. The ray paths and traveltimes were calculated accurately by an efficient ray tracing technique (Zhao et al., 1992). The LSQR algorithm (Paige and Saunders, 1982) was used to solve the large and sparse observation equations with damping and smoothing regularizations. We adopted the 1-D modified slightly IASP91 model (Kennett and Engdahl, 1991) by linearly interpolating to compute the velocity perturbation at each grid node set up as shown in Supplementary Figure S2. In addition, referring to the Moho depth variation revealed by receiver functions (Li et al., 2014; Xu et al., 2018a; Xu et al., 2021),.the Moho discontinuity was constructed in the initial model (Supplementary Figure S2B).
Robustness Analysis
The quality and quantity of relative S wave traveltime residuals determine the reliability of tomographic results. To improve the accuracy of picking up the S wave arrival time, the method of P wave particle motions with teleseismic waveforms at period band of 5–50 s (Niu and Li, 2011) was used to estimate the true orientation for each station before rotated the two horizontal components. Then, the waveform correlation method (Rawlinson and Kennett, 2004) was used to further pick up the relative S wave traveltime residuals (Supplementary Figure S1). All measured residuals vary between −2.0 and 2.0 s (Supplementary Figure S3A). The corresponding error estimates of the relative traveltime residuals is shown in Supplementary Figure S3B. We find that most of the error estimates are less than 0.3 s, which indicates the accuracy of our measured S wave traveltime residuals. We also plotted the average traveltime residual and ray path from four directions of northeast, southeast, southwest and northwest for each station (Supplementary Figure S4). The directions of the ray path have little effect on the average traveltime residual except for the southeast direction due to the large number of earthquake distribution (Figure 2). Generally, the resolution of tomographic inversion depends on the crossed and dense S wave ray paths. Supplementary Figure S4 and S5 show the distribution of S wave ray paths used in this study. We find that the study area is covered by the dense and crossed ray paths in both horizontal (Supplementary Figure S4E) and vertical (Supplementary Figure S5) directions. The ray path density at each grid node is all more than 1,000 at different depths for most of the study area (Supplementary Figure S6). Thus, our tomographic results are reliable according to the aforementioned accurate measurements of relative S wave traveltime residuals (Supplementary Figure S1 and S3) and dense ray coverage (Supplementary Figure S4–6).
For a tomographic inversion, synthetic checkerboard test is usually used to assess the resolution of the inversion results. In this study, we applied the same ray paths as the final tomographic inversion using the real data but different grid size in parameterization of the initial model to perform our checkerboard test with the input velocity perturbation of ±3%. The random noises with a variance of 0.1 s were also added to the synthetic traveltime residuals for simulating the data picking errors. After checking the testing results, we found that the velocity anomalies were well reconstructed at different depths when the horizontal grid spacing was set to 0.5°×0.5° in the synthetic test (Figure 3). Therefore, our actual results are robust for the optimal grid spacing of 0.5°×0.5°. In addition, the damping factor is an important parameter to balance the smoothness of the final velocity model and the reduction of the root-mean-square (RMS) traveltime residual. To select a proper damping factor, we conducted many tomographic inversion tests using different values of the damping factor to evaluate the corresponding model smoothness and RMS traveltime residual. Supplementary Figure S7 displays the trade-off curves between the model smoothness and RMS traveltime residual. The optimal damping factor of 35 was chosen for the final tomographic inversion, which can almost minimize simultaneously the model smoothness and RMS traveltime residual (Supplementary Figure S7).
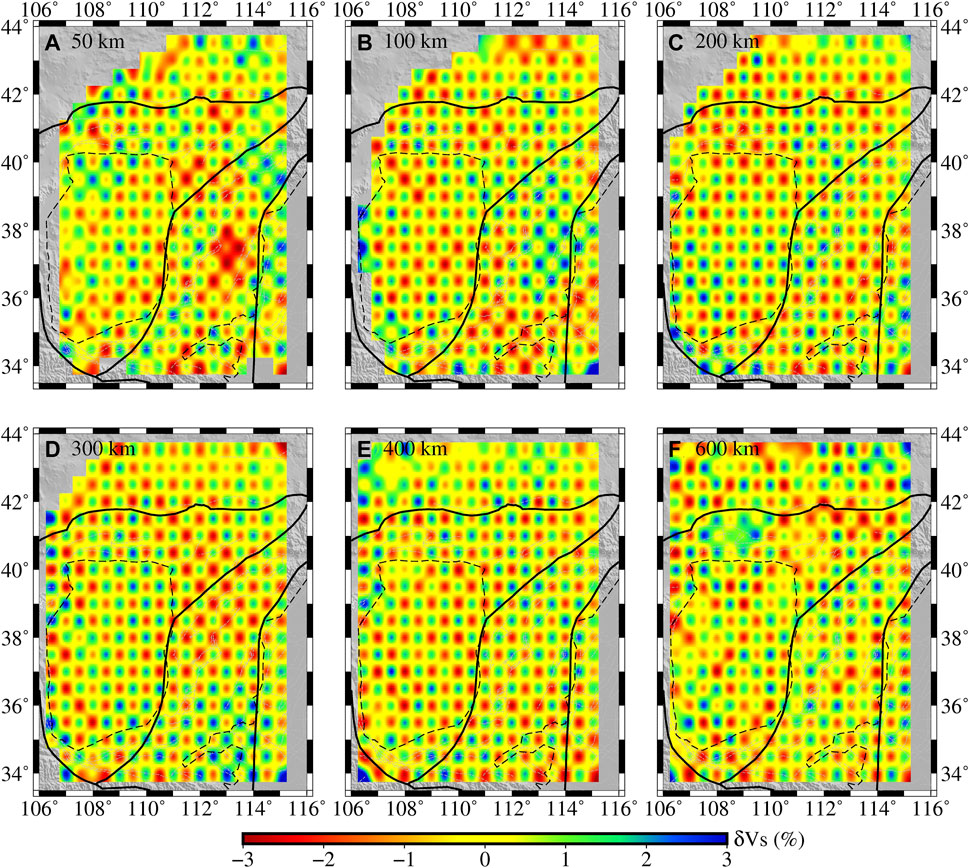
FIGURE 3. The checkerboard resolution test for the S wave velocity inversion (A–F) The recovered results at depths of 50, 100, 200, 300, 400, and 600 km.
Restoring resolution test is another procedure to further verify the reliability of our tomographic results. According to the distribution of S wave velocity anomalies shown in Figure 4, we constructed a synthetic model (Supplementary Figure S8A) consisting of the high velocity anomaly beneath the Ordos block and inverted L-shaped low velocity anomaly beneath its surrounding rift grabens on the north and east, respectively. We set the perturbation of −3% and 3% with respect to the low and high velocity anomalies within the depth of 0−200 km. Then, the same ray paths and parameters of the initial model as the real data were adopted to estimate the traveltime residuals of the synthetic model. Supplementary Figure S8B shows the results of our restoring resolution test. Although the recovered amplitudes decrease slightly in some regions, the input high and low velocity anomalies are well restored. This means that our tomographic inversion is able to resolve the anomalies beneath the Ordos block and its surrounding regions.
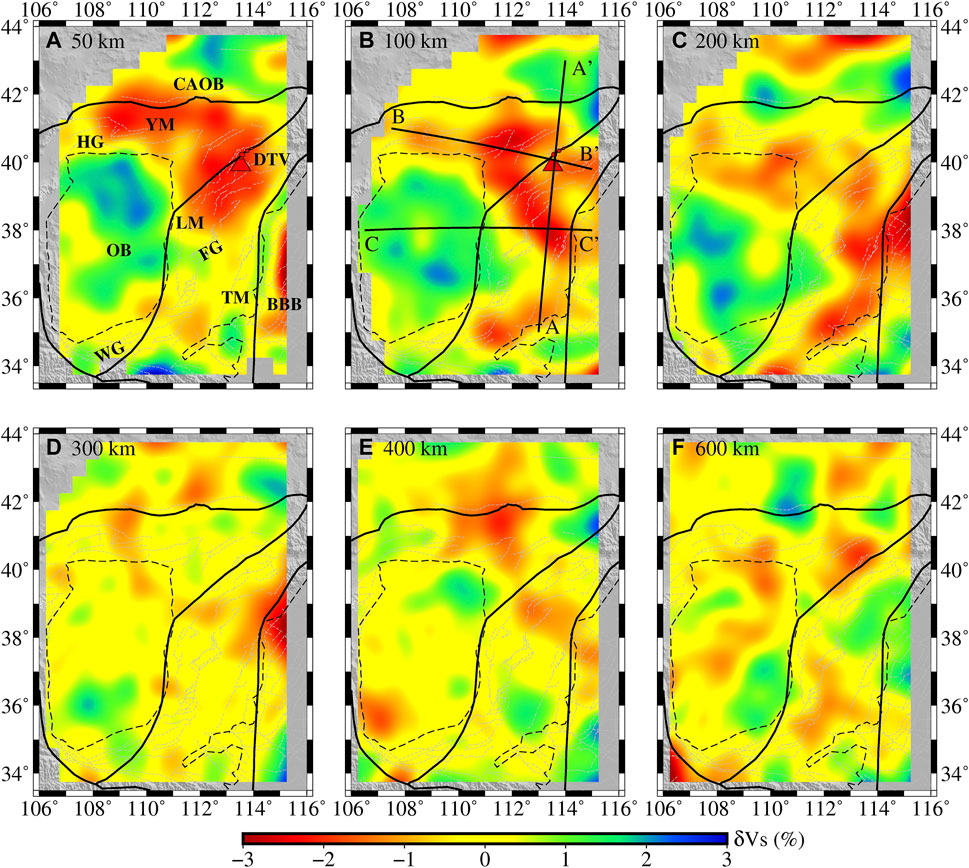
FIGURE 4. Horizontal slices (A–F) of S wave velocity from the seismic tomographic inversion. The depth of each layer is shown in top left corner of each figure. The abbreviations are the same as those defined in the caption of Figure 1. The black lines labeled AA′, BB′ and CC′ in figure (B) represent the locations of the vertical sections shown in Figure 5.
Results
We construct a high-resolution 3-D S wave velocity model of the crustal and upper mantle beneath the TNCO and its adjacent areas from tomographic inversion using the teleseismic relative traveltime residuals. Our obtained velocity model can resolve well the scale of velocity anomaly of about 0.5°. Figure 4 and Figure 5 show the six horizontal slices at depths of 50, 100, 200, 300, 400, and 600 km and three vertical sections of AA′, BB′ and CC’, respectively. The distribution of S wave velocity presents the significant lateral and vertical variations, indicating the strong structure heterogeneity beneath the study area. In the following sections, we only focus on the upper mantle structures and its implications. The crustal structures are ignored due to the lack of the traveltime data derived from the local and regional earthquakes for the tomographic inversion in this study.
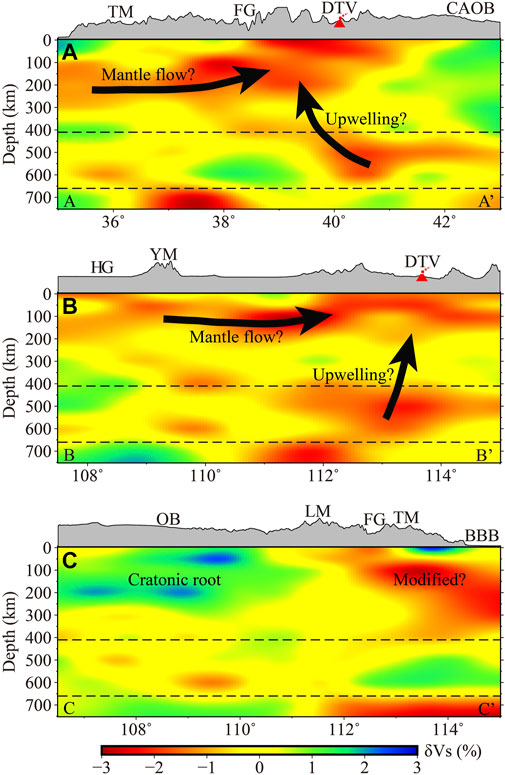
FIGURE 5. Vertical sections (A–C) of S wave velocity along the profiles shown in Figure 4B. The surface topography of each section is plotted on the top of each figure. The black thick arrows suggest the possible asthenospheric upwelling and mantle flows. The dashed lines indicate the 410 and 660 km discontinuities. The abbreviations are the same as those defined in the caption of Figure 1.
In the horizontal slices of Figure 4, the distribution of S wave velocity structure exhibits the quite different patterns between 50–200 km and 300–600 km depths. In particular, the similar characteristics of the velocity structures are shown above 200 km depth although the shapes and amplitudes of the velocity anomalies are slightly different (Figures 4A–C). The velocity anomalies are unevenly distributed at depths of 300–600 km (Figures 4D–F), which suggests the obvious lateral heterogeneity. We find that the rigid Ordos block is dominated by the prominent high velocity anomalies within 50–200 km depth (Figures 4A–C). However, these high velocity anomalies are not completely correlated with the surface tectonic boundary of the Ordos block, accompanied by the low velocity intrusion occurred at the block edge. The significant low velocity anomalies exist under the north and east of the Ordos block above 200 km depth (Figures 4A–C), connecting at the Datong volcano region, which suggests the approximate inverted L-shape of the low velocity anomalies. The inverted L-shaped low velocity anomalies are nearly parallel to the strikes of the grabens and orogenic belts, such as the Hetao graben, Fenhe graben, Yin mountain and Taihang mountain. The northern TNCO is characterized by the obvious low velocity anomalies in Figures 4A–C, while the elongated low velocity anomalies with a NE-SW trend can be found in the southern TNCO. Especially, the Lüliang mountain is dominated by an alternate distribution of low and high velocity anomalies shown in Figures 4A–C. The central Asia orogenic belt is revealed by a complex structure based on our S wave velocity model at depths of 50–600 km.
The vertical sections of AA′ and BB′ are almost perpendicular at the Datong volcano (Figures 5A,B), with the strikes of NWW-SEE and NNE-SSW shown in Figure 4B, respectively. These two vertical sections are characterized by the prominent low S wave velocity anomaly under the Datong volcano. We find that the prominent low velocity anomaly can be traced down to the mantle transition zone. Besides, two remarkable low velocity layers can be found in the vertical sections of AA′ and BB′ within the depth of about 100–300 km (Figures 5A,B), which converge from northwest and southwest below the Datong volcano. The vertical section of CC’ crosses the Ordos block and TNCO, and then ends eastward at the western Bohai bay basin (Figure 4B). In Figure 5C, the obvious high S wave velocity anomaly exists under the Ordos block above the depth of 200 km, while the low velocity anomaly down to about 400 km is located beneath the Taihang mountain and the western Bohai bay basin. This distinct contrast of S wave velocity reflects the difference of the upper mantle structure. In our results, it is absent that the high velocity anomalies were explained by Liu et al. (2017) and Tao et al. (2018) as representing the subducted Pacific plate.
Discussion
Comparisons With Previous Studies
Recently, many velocity models have been constructed by the different tomographic inversions to investigate the structures of the NCC (Huang and Zhao, 2006; Tian et al., 2009; Lei, 2012; Guo et al., 2016; Tao et al., 2018; Xu et al., 2018b; Ai et al., 2019; Yao et al., 2020). However, most of these previous models were estimated based on the permanent stations from the seismic network of China Earthquake Administration with a large station spacing and uneven distribution, which led to their relative low-resolution results. Recently, Cai et al. (2021) and Huang et al. (2021) published the S wave velocity models using the same seismic array as in this study but paid more attention to the shallow structures of the TNCO (<120 km). Compared with these previous studies, our results with high resolution provide new constraints on the deep structures of the TNCO and its adjacent areas.
Our tomographic model illustrates the similar structure patterns revealed by the previous models (Huang and Zhao, 2006; Tian et al., 2009; Lei, 2012; Tao et al., 2018; Xu et al., 2018b), such as the high velocity anomaly beneath the Ordos block and low velocity anomaly under the Datong volcano. However, our results present some different details. For example, the high velocity anomaly in this study, indicating the cratonic root of the Ordos block, is shallower than those in the models of Tian et al. (2009) and Lei (2012), with about 300 and 400 km, respectively. The depth of this high velocity anomaly (∼200 km) is roughly consistent with the recent results of the temperature inversion (Guo et al., 2016) and full waveform tomography (Tao et al., 2018), which indicates the Ordos block still preserves the thick and cold cratonic root. However, the outer edge of the high velocity anomaly beneath the Ordos block was invaded by the surrounding low velocity anomalies in a certain extent (Figure 4). This phenomenon was also demonstrated by the previous finite-frequency tomography (Xu et al., 2018b) and magnetotelluric inversion (Dong et al., 2014). In addition, the low velocity anomaly suggesting the asthenospheric upwelling shows a complex pattern and is obviously different from the Y-shaped (Lei, 2012) and sloping banded (Tian et al., 2009) anomalies under the Datong volcano region. We find that this low velocity anomaly not only extends down to the mantle transition zone, but also connects with two low velocity layers within about 100–300 km depths from northwest and southwest, respectively. These detailed improvements can be observed mainly due to the high-quality waveforms recorded by the dense seismic array.
Origin of the Datong Volcano
The Datong volcano is one of the most important Quaternary volcanic groups in the NCC, consisting of more than 30 volcanic cones and lava platforms (Fan et al., 2015). Potassium-Argon dating suggested that the last eruption of the Datong volcano ended in the late Pleistocene (0.4 Ma) (Xu et al., 2005). Recently, the high-resolution S wave velocity models delineated that the magma chamber is overlaid by the upper crust with the prominent high velocity anomaly (Cai et al., 2021; Huang et al., 2021), which agrees with the fact that the Datong volcano is inactive at present. The magma of the Datong volcano originated from deep asthenosphere has been revealed by studies on alkali basalt and volcanic debris (Xu et al., 2005; Fan et al., 2015). The large-scale tomographic images demonstrated that the low velocity anomaly under the Datong volcano rooted in the mantle transition zone (Huang and Zhao, 2006; Tian et al., 2009; Tao et al., 2018; Xu et al., 2018b). In fact, the origin and its mechanism of the Datong volcano are still unclear.
Many recent studies have reached a consensus on the hypothesis of the on-going asthenospheric upwelling under the Datong volcano (Ai et al., 2019; Yao et al., 2020; Cai et al., 2021). However, whether the low velocity anomaly indicating this asthenospheric upwelling is related to the dehydration of the Pacific stagnant slab (Zhao, 2004; Huang and Zhao, 2006), lower mantle plum (Lei, 2012) or mantle flows from the Tibetan plateau (Liu et al., 2004) remains controversial. Recent finite-frequency tomography (Xu et al., 2018b) and full waveform tomography (Tao et al., 2018) reported that the western edge of the subducted Pacific slab stagnates at 118–120° E in the mantle transition zone and is far away from the Datong volcano (Figure 1). This phenomenon goes against the speculation of the low velocity anomaly caused by the dehydration of the Pacific stagnant slab. Based on most previous tomographic images (Tian et al., 2009; Liu et al., 2017; Xu et al., 2018b; Tao et al., 2018), the low velocity anomaly under the Datong volcano derives from the depth of about 400–600 km and dose not pass down the mantle transition zone, which is obviously contradictory to the hypothesis of the lower mantle plum proposed by Lei (2012). In contrast, the mantle flows within the depth of 100–300 km from the Tibetan plateau was supported to be the main source of the Datong volcanic magma by the conductivity model (Zhang et al., 2016), surface wave (Tang et al., 2013) and P wave (Gao et al., 2018) tomographic images. The results of SKS wave splitting (Yu and Chen, 2016; Chang et al., 2021) also revealed the clockwise turning asthenospheric flow along the Weihe graben driven by the eastward extrusion of the Tibetan upper mantle. Overall, these aforementioned arguments on the origin of the Datong volcano are attributed to the lack of constraints from the regional high-resolution velocity models.
In our high-resolution S wave velocity model (Figure 4 and Figure 5), the complex distribution of the low S wave velocity anomalies is shown under the Datong volcano region. Specifically, the low velocity layers within about 100–300 km depths from northwest (Figure 5B) and southwest (Figure 5A) connect the vertical low velocity zone rooted in the mantle transition zone beneath the Datong volcano. The NE-SW trending low velocity layer can be observed from the Datong volcano to the southern TNCO, which is roughly consistent with the mantle flow shown in the previous magnetotelluric (Dong et al., 2014), temperature (Guo et al., 2016) and S wave velocity (Tang et al., 2013; Yao et al., 2020) models. Another branch of the low velocity layer spans from the Datong volcano to the Yin mountain and Hetao graben. This mantle flow extended northwestward was also confirmed by the anomalies of the low resistivity (Dong et al., 2014), high temperature (Guo et al., 2016) and low velocity (Yao et al., 2020; Cai et al., 2021). Therefore, these evidences suggest that the origin of the Datong volcano is likely to be related to the two mantle flows from the north and east of the Ordos block, respectively. Next, it is important to understand the formation mechanism of these two mantle flows. Under the effect of the continuous collision between the Indian plate and Eurasia plate since the early Cenozoic (Molnar and Tapponnier, 1975; England and Houseman, 1986), the crustal and upper mantle materials of the Tibetan plateau have escaped to its surrounding areas (Clark and Royden, 2000; Tapponnier et al., 2001; Royden et al., 2008). The lateral extrusion northeastward of the Tibetan plateau has attracted extensive studies (e.g., Meyer et al., 1998; Clark, 2012; Ye et al., 2015; Tian et al., 2021) due to the strong surface deformation in the northeastern margin of the Tibetan plateau. This northeastward movements of the Tibetan plateau have been observed by the GPS measurements and Ps and SKS wave splitting (Xu et al., 2018a; Wang and Shen, 2020; Chang et al., 2021). Especially, the asthenospheric flows from the Tibetan plateau to the Hetao graben and Weihe graben were revealed by the previous seismological observations (Tang et al., 2013; Yu and Chen, 2016; Gao et al., 2018; Chang et al., 2021). Combined with these previous studies, we propose that these two mantle flows shown in Figure 5 may be the sources for on-going asthenospheric upwelling under the Datong volcano.
In addition, we observe the vertical low velocity zone down into the mantle transition zone under the Datong volcano (Figures 5A,B), which can be also found in the previous models (Liu et al., 2017; Xu et al., 2018b; Tao et al., 2018). This vertical low velocity zone coincides with the upwelling of the deep hot mantle materials (Xu et al., 2005; Zhu et al., 2011). However, the cause and mechanism of this asthenospheric upwelling are still unclear. Previous studies indicated that the mantle transition zone could be a major repository for water and have a key role in terrestrial magmatism and plate tectonics (Bercovici and Karato, 2003; Pearson et al., 2014). Besides, the temperature and water content were believed to be the primary causes for the thickness variation of the mantle transition zone (Litasov et al., 2005). Following the equations proposed by Suetsugu et al. (2010), the temperature and water content in the mantle transition zone, approximately −18.4 K and 0.3 wt%, respectively, were calculated using the average S wave velocity of this study and the thickness of the mantle transition zone estimated by Zuo et al. (2020) under the Datong volcano. Considering the deeper 410-km discontinuity of about 422.0 km corresponding to the higher temperature (Zuo et al., 2020), our estimated temperature of −18.4 K may indicate the relative cold lower mantle transition zone, whereas the water content of 0.3 wt% leads to the water-rich mantle transition zone. This water-rich mantle transition zone beneath the Datong volcano maybe help to materialize the partial melting and the origin of the asthenospheric upwelling. The asthenospheric source also accords with petrological and geochemical analyses on the alkali basalts of the Datong volcano (Xu et al., 2005; Fan et al., 2015). Therefore, the Quaternary Datong volcano is likely to jointly arise from the asthenospheric upwelling rooted in the mantle transition zone and mantle flows driven by the northeastward escape of the upper mantle material from the Tibetan plateau.
Implications for Lithospheric Thinning of the Trans-North China Orogen and Its Adjacent Areas
Since the Mesozoic, the NCC has experienced significant tectonic rejuvenation, accompanied by the widespread magmatism and intense extension (Zhu et al., 2011; Wu et al., 2019). The mantle lithosphere tended to vary from the old cratonic-type to the modified and unstable types from west to east in the NCC (Xu et al., 2018b; Tang et al., 2021), which was confirmed by the gradual thinning of the lithosphere (Chen, 2010; Tang et al., 2013; Zhang et al., 2019). In the eastern NCC, many previous studies have reach the consensus that the lithospheric thinning is mainly relevant to the continental extension caused by the subduction of Pacific plate (e.g., Chen, 2010; Wu et al., 2019; Zhang et al., 2019; Tang et al., 2021). However, the dynamic processes and mechanisms of the lithospheric thinning beneath the TNCO and its adjacent areas are still not fully understood.
In fact, recent tomographic images have illustrated that the mantle lithosphere has been modified partially under the TNCO and its adjacent areas (Xu et al., 2018b; Yao et al., 2020; Dong et al., 2021). The lithospheric delamination and mechanical erosion assumed to account for the mechanisms of the lithospheric modification are still under debate (Wang et al., 2018; Wu et al., 2019). However, these speculation were all based on the asthenosphere-derived upwelling of the hot mantle materials (Dong et al., 2014; Guo et al., 2016; Cai et al., 2021). In this study, we provide a high-resolution S wave velocity model (Figure 4 and Figure 5) to constrain the mantle lithospheric modification beneath the TNCO and its adjacent areas. In contrast to the prominent high S wave velocity anomaly beneath the Ordos block, the inverted L-shaped low velocity anomaly are observed under its surrounding areas in the north and east (Figures 4A–C and Figure 5). The large-scale low velocity anomaly can be found from the Hetao graben to the Datong volcano region, which agrees well with the thinned lithosphere with the thickness of 80–100 km (Zhang et al., 2019). The low velocity anomalies under the TNCO are locally divided into two parts in the south and north TNCO, respectively. The lithospheric thickness also suggested the coexistence of the thinned lithosphere and remnant cratonic mantle root beneath the TNCO (Zhang et al., 2019). Thus, our observed low velocity anomalies may be in accord with the weak lithosphere where the mantle lithosphere has been modified by the underlying hot asthenospheric materials. Moreover, we find that the low velocity anomalies intrude laterally into the interior of the Ordos block (Figures 4A–C). This phenomenon implies the modification of the thick cold lithospheric root occurred beneath the outer edge of the Ordos block. The results of magnetotellric data (Dong et al., 2014) and SKS splitting (Yu and Chen, 2016; Chang et al., 2021) also supported the reginal modification of the cratonic lithosphere under the north and south of the Ordos block. Our model suggests less velocity anomalies below 300 km, which means the mantle structure is close to the reference velocity model. We did not observe the high velocity anomalies beneath the TNCO and its adjacent areas, similar to those interpreted as the delaminated lithosphere by Tian et al. (2009) and Xu et al. (2018b) in deep mantle of the eastern NCC.
According to our obtained high-resolution S wave velocity model, the thinned lithosphere is shown under the TNCO and its adjacent areas (Figure 4 and Figure 5). By analyzing comprehensively our observed S wave velocity anomalies and previous results, we can infer the possible dynamic processes for the lithospheric thinning of the TNCO and its adjacent areas. The two mantle flows driven by the extrusion northeastward of the Tibetan plateau, mentioned in previous section, is likely to erode the thick cratonic lithospheric root beneath the margin of the Ordos block and cause the modifications of the overlying lithosphere. This lithospheric deformation suggests that the effect of the continental collision between the Indian plate and Eurasian plate has far reached northeastward the TNCO region. Besides, the asthenospheric upwelling originated from the water-rich mantle transition zone is also responsible for the lithospheric thinning of the northern TNCO. In general, the asthenospheric upwelling and mantle flows maybe result in the lithospheric thinning under the TNCO and its adjacent areas, and then cause the superficial crustal deformation in response, such as the extensional grabens, strong earthquakes and volcanic activities.
Conclusion
A high-resolution 3-D S wave velocity model of the TNCO and its adjacent areas is built by seismic tomography inversion using the teleseismic traveltime residual data recorded by the dense seismic array. Our model shows a prominent lateral heterogeneity of the upper mantle structure across the study area. The Ordos block is featured by significant high velocity anomaly in depths of 0–300 km. We interpret this high velocity anomaly as the preserved thick cratonic root. Two low velocity layers, forming an inverted L-shape, appear in the north and east of the Ordos block. These two low velocity layers are likely to be related to the mantle flows driven by the extrusion northeastward of the Tibetan plateau. We find that the two low velocity anomalies intrude locally into the interior of the Ordos block, which implies the modification of the cratonic root around the outer edge of the Ordos block. An obvious low velocity zone can be found down into the mantle transition zone under the Datong volcano. We infer that this low velocity zone is caused by the hot asthenospheric upwelling originated from the water-rich mantle transition zone. This upward low velocity zone is connected to the two horizontal low velocity layers beneath the Datong volcano. We infer that the asthenospheric upwelling and mantle flows could be responsible for the origin of the Datong volcano and lithospheric thinning beneath the TNCO and its adjacent areas.
Data Availability Statement
The original contributions presented in the study are included in the article/Supplementary Material, further inquiries can be directed to the corresponding author.
Author Contributions
XX collected the waveform data, plotted the figures used in this study and wrote the manuscript. ZD provided the raw data and guided this work. HG picked up the traveltime residuals and performed the tomography inversion. XL provided useful suggestions. All authors contributed to the article and approved the submitted version.
Funding
This work was supported by the National Natural Science Foundation of China (Grant Nos 41974100) and the Special Fund of the Institute of Geophysics, China Earthquake Administration (Grant Nos DQJB16A03, DQJB17A01).
Conflict of Interest
The reviewer ZG declared a shared affiliation with the authors XX, ZD, HG to the handling editor at the time of review.
Publisher’s Note
All claims expressed in this article are solely those of the authors and do not necessarily represent those of their affiliated organizations, or those of the publisher, the editors and the reviewers. Any product that may be evaluated in this article, or claim that may be made by its manufacturer, is not guaranteed or endorsed by the publisher.
Acknowledgments
Waveform data for this study are provided by China Seismic Array Data Management Centre at Institute of Geophysics, China Earthquake Administration (doi: 10.12001/ChinArray.Data). All figures are plotted by Generic Mapping Tools (http://gmt.soest.hawaii.edu/home).
Supplementary Material
The Supplementary Material for this article can be found online at: https://www.frontiersin.org/articles/10.3389/feart.2022.948040/full#supplementary-material
References
Ai, S., Zheng, Y., Riaz, M. S., Song, M., Zeng, S., and Xie, Z. (2019). Seismic Evidence on Different Rifting Mechanisms in Southern and Northern Segments of the Fenhe‐Weihe Rift Zone. J. Geophys. Res. Solid Earth 124 (1), 609–630. doi:10.1029/2018jb016476
Bercovici, D., and Karato, S.-i. (2003). Whole-mantle Convection and the Transition-Zone Water Filter. Nature 425, 39–44. doi:10.1038/nature01918
Cai, Y., Wu, J., Rietbrock, A., Wang, W., Fang, L., Yi, S., et al. (2021). S Wave Velocity Structure of the Crust and Upper Mantle Beneath Shanxi Rift, Central North China Craton and its Tectonic Implications. Tectonics 40 (4), e2020TC006239. doi:10.1029/2020tc006239
Chang, L., Ding, Z., and Wang, C. (2021). Upper Mantle Anisotropy and Implications beneath the Central and Western North China and the NE Margin of Tibetan Plateau. Chin. J. Geophys. (in Chinese) 64 (1), 114–130. doi:10.6038/cjg2021O0315
Chen, L. (2010). Concordant Structural Variations from the Surface to the Base of the Upper Mantle in the North China Craton and its Tectonic Implications. Lithos 120 (1-2), 96–115. doi:10.1016/j.lithos.2009.12.007
ChinArray-Himalaya (2011). China Seismic Array Waveform Data of Himalaya Project. Beijing: Institute of Geophysics, China Earthquake Administration. doi:10.12001/ChinArray.Data
Clark, M. K., and Royden, L. H. (2000). Topographic Ooze: Building the Eastern Margin of Tibet by Lower Crustal Flow. Geology 28 (8), 703–706. doi:10.1130/0091-7613(2000)028<0703:tobtem>2.3.co;2
Clark, M. K. (2012). Continental Collision Slowing Due to Viscous Mantle Lithosphere rather Than Topography. Nature 483, 74–77. doi:10.1038/nature10848
Deng, Y., Fan, W., Zhang, Z., and Liang, K. (2014). The Gravity and Isostatic Moho in North China Craton and Their Implications to Seismicity. Earthq. Sci. 27 (2), 197–207. doi:10.1007/s11589-013-0019-y
Dong, H., Wei, W., Ye, G., Jin, S., Jones, A. G., Jing, J., et al. (2014). Three-dimensional Electrical Structure of the Crust and Upper Mantle in Ordos Block and Adjacent Area: Evidence of Regional Lithospheric Modification. Geochem. Geophys. Geosyst. 15 (6), 2414–2425. doi:10.1002/2014gc005270
Dong, X., Yang, D., Niu, F., Liu, S., and Tong, P. (2021). Adjoint Traveltime Tomography Unravels a Scenario of Horizontal Mantle Flow beneath the North China Craton. Sci. Rep. 11 (1), 12523. doi:10.1038/s41598-021-92048-8
England, P., and Houseman, G. (1986). Finite Strain Calculations of Continental Deformation: 2. Comparison with the India-Asia Collision Zone. J. Geophys. Res. 91 (B3), 3664–3676. doi:10.1029/JB091iB03p03664
Fan, Q., Zhao, Y., Chen, S., Li, N., and Sui, J. (2015). Quaternary Volcanic Activities in the West of the Daxing'anling-Taihangshan Gravity Lineament. Bulletin of Mineral. Petrol. Geochem. 34, 674–681. doi:10.3969/j.issn.1007-2802.2015.04.001
Gao, X., Guo, B., Chen, J., Liu, Q., Li, S., and Li, Y. (2018). Rebuilding of the Lithosphere beneath the Western Margin of Ordos: Evidence from Multiscale Seismic Tomography. Chinese J. Geophys. (in Chinese) 61 (7), 2736–2749. doi:10.6038/cjg2018L0319
Guo, Z., Afonso, J. C., Qashqai, M. T., Yang, Y., and Chen, Y. J. (2016). Thermochemical Structure of the North China Craton from Multi-Observable Probabilistic Inversion: Extent and Causes of Cratonic Lithosphere Modification. Gondwana Res. 37, 252–265. doi:10.1016/j.gr.2016.07.002
Huang, J., and Zhao, D. (2006). High-resolution Mantle Tomography of China and Surrounding Regions. J. Geophys. Res. 111 (B9), B09305. doi:10.1029/2005jb004066
Huang, X., Ding, Z., Ning, J., Niu, F., Li, G., Wang, X., et al. (2021). Sedimentary and Crustal Velocity Structure of Trans-North China Orogen from Joint Inversion of Rayleigh Wave Phase Velocity and Ellipticity and Some Implication for Syn-Rift Volcanism. Tectonophysics 819, 229104. doi:10.1016/j.tecto.2021.229104
Kennett, B. L. N., and Engdahl, E. R. (1991). Traveltimes for Global Earthquake Location and Phase Identification. Geophys. J. Int. 105, 429–465. doi:10.1111/j.1365-246X.1991.tb06724.x
Kreemer, C., Blewitt, G., and Klein, E. C. (2014). A Geodetic Plate Motion and Global Strain Rate Model. Geochem. Geophys. Geosyst. 15, 3849–3889. doi:10.1002/2014GC005407
Lei, J. (2012). Upper-mantle Tomography and Dynamics beneath the North China Craton. J. Geophys. Res. 117 (B6), B06313. doi:10.1029/2012jb009212
Li, Y., Gao, M., and Wu, Q. (2014). Crustal Thickness Map of the Chinese Mainland from Teleseismic Receiver Functions. Tectonophysics 611, 51–60. doi:10.1016/j.tecto.2013.11.019
Litasov, K. D., Ohtani, E., Sano, A., and Suzuki, A. (2005). Wet Subduction versus Cold Subduction. Geophys. Res. Lett. 32, L13312. doi:10.1029/2005gl022921
Liu, M., and Wang, H. (2012). Roaming Earthquakes in China Highlight Midcontinental Hazards. Eos Trans. AGU 93 (45), 453–454. doi:10.1029/2012eo450001
Liu, M., Cui, X., and Liu, F. (2004). Cenozoic Rifting and Volcanism in Eastern China: a Mantle Dynamic Link to the Indo-Asian Collision? Tectonophysics 393 (1-4), 29–42. doi:10.1016/j.tecto.2004.07.029
Liu, X., Zhao, D., Li, S., and Wei, W. (2017). Age of the Subducting Pacific Slab beneath East Asia and its Geodynamic Implications. Earth Planet. Sci. Lett. 464, 166–174. doi:10.1016/j.epsl.2017.02.024
Meyer, B., Tapponnier, P., Bourjot, L., Métivier, F., Gaudemer, Y., Peltzer, G., et al. (1998). Crustal Thickening in Gansu-Qinghai, Lithospheric Mantle Subduction, and Oblique, Strike-Slip Controlled Growth of the Tibet Plateau. Geophys. J. Int. 135, 1–47. doi:10.1046/j.1365-246X.1998.00567.x
Molnar, P., and Tapponnier, P. (1975). Cenozoic Tectonics of Asia: Effects of a Continental Collision: Features of Recent Continental Tectonics in Asia Can Be Interpreted as Results of the India-Eurasia Collision. Science 189 (4201), 419–426. doi:10.1126/science.189.4201.419
Niu, F., and Li, J. (2011). Component Azimuths of the CEArray Stations Estimated from P-Wave Particle Motion. Earthq. Sci. 24 (1), 3–13. doi:10.1007/s11589-011-0764-8
Paige, C. C., and Saunders, M. A. (1982). LSQR: an Algorithm for Sparse Linear Equations and Sparse Least Squares. ACM Trans. Math. Softw. 8 (1), 43–71. doi:10.1145/355984.355989
Pearson, D. G., Brenker, F. E., Nestola, F., McNeill, J., Nasdala, L., Hutchison, M. T., et al. (2014). Hydrous Mantle Transition Zone Indicated by Ringwoodite Included within Diamond. Nature 507 (7491), 221–224. doi:10.1038/nature13080
Rawlinson, N., and Kennett, B. L. N. (2004). Rapid Estimation of Relative and Absolute Delay Times across a Network by Adaptive Stacking. Geophys. J. Int. 157 (1), 332–340. doi:10.1111/j.1365-246X.2004.02188.x
Royden, L. H., Burchfiel, B. C., and van der Hilst, R. D. (2008). The Geological Evolution of the Tibetan Plateau. Science 321, 1054–1058. doi:10.1126/science.1155371
Suetsugu, D., Inoue, T., Obayashi, M., Yamada, A., Shiobara, H., Sugioka, H., et al. (2010). Depths of the 410-km and 660-km Discontinuities in and Around the Stagnant Slab beneath the Philippine Sea: Is Water Stored in the Stagnant Slab? Phys. Earth Planet. Inter. 183 (1-2), 270–279. doi:10.1016/j.pepi.2010.09.004
Tang, Y., Chen, Y. J., Zhou, S., Ning, J., and Ding, Z. (2013). Lithosphere Structure and Thickness beneath the North China Craton from Joint Inversion of Ambient Noise and Surface Wave Tomography. J. Geophys. Res. Solid Earth 118 (5), 2333–2346. doi:10.1002/jgrb.50191
Tang, Y., Ying, J., Zhao, Y., and Xu, X. (2021). Nature and Secular Evolution of the Lithospheric Mantle beneath the North China Craton. Sci. China Earth Sci. 64 (9), 1492–1503. doi:10.1007/s11430-020-9737-4
Tao, K., Grand, S. P., and Niu, F. (2018). Seismic Structure of the Upper Mantle Beneath Eastern Asia from Full Waveform Seismic Tomography. Geochem. Geophys. Geosyst. 19 (8), 2732–2763. doi:10.1029/2018gc007460
Tapponnier, P., Zhiqin, X., Roger, F., Meyer, B., Arnaud, N., Wittlinger, G., et al. (2001). Oblique Stepwise Rise and Growth of the Tibet Plateau. Science 294, 1671–1677. doi:10.1126/science.105978
Tian, Y., Zhao, D., Sun, R., and Teng, J. (2009). Seismic Imaging of the Crust and Upper Mantle beneath the North China Craton. Phys. Earth Planet. Inter. 172 (3-4), 169–182. doi:10.1016/j.pepi.2008.09.002
Tian, X., Bai, Z., Klemperer, S. L., Liang, X., Liu, Z., Wang, X., et al. (2021). Crustal-scale Wedge Tectonics at the Narrow Boundary between the Tibetan Plateau and Ordos Block. Earth Planet. Sci. Lett. 554, 116700. doi:10.1016/j.epsl.2020.116700
Wang, M., and Shen, Z. K. (2020). Present‐Day Crustal Deformation of Continental China Derived from GPS and its Tectonic Implications. J. Geophys. Res. Solid Earth 125, e2019JB018774. doi:10.1029/2019jb018774
Wang, K., Zhao, L., Xu, X., and Yang, J. (2018). Heterogeneous Destruction of the North China Craton: Coupled Constraints from Seismology and Geodynamic Numerical Modeling. Sci. China Earth Sci. 61 (5), 515–526. doi:10.1007/s11430-017-9142-1
Wu, F.-Y., Yang, J.-H., Xu, Y.-G., Wilde, S. A., and Walker, R. J. (2019). Destruction of the North China Craton in the Mesozoic. Annu. Rev. Earth Planet. Sci. 47 (1), 173–195. doi:10.1146/annurev-earth-053018-060342
Xu, Y.-G., Ma, J.-L., Frey, F. A., Feigenson, M. D., and Liu, J.-F. (2005). Role of Lithosphere-Asthenosphere Interaction in the Genesis of Quaternary Alkali and Tholeiitic Basalts from Datong, Western North China Craton. Chem. Geol. 224 (4), 247–271. doi:10.1016/j.chemgeo.2005.08.004
Xu, X., Niu, F., Ding, Z., and Chen, Q. (2018a). Complicated Crustal Deformation beneath the NE Margin of the Tibetan Plateau and its Adjacent Areas Revealed by Multi-Station Receiver-Function Gathering. Earth Planet. Sci. Lett. 497, 204–216. doi:10.1016/j.epsl.2018.06.010
Xu, X., Zhao, L., Wang, K., and Yang, J. (2018b). Indication from Finite-Frequency Tomography beneath the North China Craton: The Heterogeneity of Craton Destruction. Sci. China Earth Sci. 61 (9), 1238–1260. doi:10.1007/s11430-017-9201-y
Xu, X., Ding, Z., Li, L., and Niu, F. (2021). Crustal Anisotropy Beneath the Trans-North China Orogen and its Adjacent Areas from Receiver Functions. Front. Earth Sci. 9, 753612. doi:10.3389/feart.2021.753612
Yao, Z., Eric, S., Wang, C., Ding, Z., and Chen, Y. (2020). Asthenospheric Upwelling beneath Northeastern Margin of Ordos Block: Constraints from Rayleigh Surface-Wave Tomography. Tectonophysics 790, 228548. doi:10.1016/j.tecto.2020.228548
Ye, Z., Gao, R., Li, Q., Zhang, H., Shen, X., Liu, X., et al. (2015). Seismic Evidence for the North China Plate Underthrusting beneath Northeastern Tibet and its Implications for Plateau Growth. Earth Planet. Sci. Lett. 426, 109–117. doi:10.1016/j.epsl.2015.06.024
Yu, Y., and Chen, Y. J. (2016). Seismic Anisotropy beneath the Southern Ordos Block and the Qinling-Dabie Orogen, China: Eastward Tibetan Asthenospheric Flow Around the Southern Ordos. Earth Planet. Sci. Lett. 455, 1–6. doi:10.1016/j.epsl.2016.08.026
Zhang, H., Huang, Q., Zhao, G., Guo, Z., and Chen, Y. J. (2016). Three-Dimensional Conductivity Model of Crust and Uppermost Mantle at the Northern Trans North China Orogen: Evidence for a Mantle Source of Datong Volcanoes. Earth Planet. Sci. Lett. 453, 182–192. doi:10.1016/j.epsl.2016.08.025
Zhang, Y., Chen, L., Ai, Y., and Jiang, M. (2019). Lithospheric Structure beneath the Central and Western North China Craton and Adjacent Regions from S-Receiver Function Imaging. Geophys. J. Inter. 219 (1), 619–632. doi:10.1093/gji/ggz322
Zhao, D., Hasegawa, A., and Horiuchi, S. (1992). Tomographic Imaging ofPandSwave Velocity Structure beneath Northeastern Japan. J. Geophys. Res. 97 (B13), 19909–19928. doi:10.1029/92jb00603
Zhao, D., Hasegawa, A., and Kanamori, H. (1994). Deep Structure of Japan Subduction Zone as Derived from Local, Regional, and Teleseismic Events. J. Geophys. Res. 99 (B11), 22313–22329. doi:10.1029/94jb01149
Zhao, G., Wilde, S. A., Cawood, P. A., and Su, M. (2001). Archean Blocks and Their Boundaries in the North China Craton: Lithological, Geochemical, Structural and P–T Path Constraints and Tectonic Evolution. Precambrian Res. 107 (1-2), 45–73. doi:10.1016/S0301-9268(00)00154-6
Zhao, D. (2004). Global Tomographic Images of Mantle Plumes and Subducting Slabs: Insight into Deep Earth Dynamics. Phys. Earth Planet. Inter. 146 (1-2), 3–34. doi:10.1016/j.pepi.2003.07.032
Zhu, R., Chen, L., Wu, F., and Liu, J. (2011). Timing, Scale and Mechanism of the Destruction of the North China Craton. Sci. China Earth Sci. 54 (6), 789–797. doi:10.1007/s11430-011-4203-4
Zhu, Y., Liu, S., Zhang, B., Gurnis, M., and Ma, P. (2021). Reconstruction of the Cenozoic Deformation of the Bohai Bay Basin, North China. Basin Res. 33 (1), 364–381. doi:10.1111/bre.12470
Keywords: trans-north China orogen, datong volcano, seismic tomography, S wave velocity, upper mantle structure
Citation: Xu X, Ding Z, Guo H and Li X (2022) Seismic Tomography of the Trans-North China Orogen and Its Dynamic Implications. Front. Earth Sci. 10:948040. doi: 10.3389/feart.2022.948040
Received: 19 May 2022; Accepted: 16 June 2022;
Published: 07 July 2022.
Edited by:
Weijia Sun, Institute of Geology and Geophysics (CAS), ChinaReviewed by:
Dongliang Liu, Chinese Academy of Geological Sciences (CAGS), ChinaZhi Guo, China Earthquake Administration, China
Copyright © 2022 Xu, Ding, Guo and Li. This is an open-access article distributed under the terms of the Creative Commons Attribution License (CC BY). The use, distribution or reproduction in other forums is permitted, provided the original author(s) and the copyright owner(s) are credited and that the original publication in this journal is cited, in accordance with accepted academic practice. No use, distribution or reproduction is permitted which does not comply with these terms.
*Correspondence: Xiaoming Xu, eHV4aWFvbWluZ0BjZWEtaWdwLmFjLmNu