 Shangwu Song
 Yuhang Li1*
 Ming Hao
- 1The Second Monitoring and Application Center, China Earthquake Administration, Xi’an, China
- 2Southern Laboratory of Ocean Science and Engineering Guangdong Laboratory (Zhuhai), Zhuhai, China
The Fen–Wei rift zone (FWRZ) of North China is an important zone of active crustal deformation representing a transition from extrusion tectonics related to the Tibetan Plateau to subduction tectonics related to the potential far-field influence of the west Pacific plate. In this study, we determined the kinematic constraints of active crustal deformation in the FWRZ, which are fundamental for forecasting seismicity. NeoKinema, a kinematic finite-element model, was employed to estimate the long-term fault slip rates, distributed crustal deformation field, and on- and off-fault strain-rate fields in the FWRZ by fitting updated geological fault slip rate, geodetic GPS velocity, and principal compressive stress direction datasets. Our results show that the FWRZ is a characteristic low-strain kinematic setting, with most active faults exhibiting slip rates of less than 1 mm/a. The total sinistral shear rate from the southern Ordos block to the Qinling Mountains is approximately 1 mm/a, indicating limited tectonic extrusion along the EW-trending Qinling Mountains. Additionally, the central Shanxi rift exhibits prominent dextral shear of ∼0.5 mm/a that decreases toward its north and south ends, corresponding to crustal extension of 1.1–1.2 mm/a in the Datong and Yuncheng basins, respectively. However, this significant crustal extension cannot be solely attributed to terminal effects caused by dextral shear in the central Shanxi rift. A comparison between predicted seismicity and historical earthquake records reveals some remarkable seismic gaps, particularly in the Datong, Hancheng, and Yuncheng basins, indicating higher seismic potential in these locations. This study provides insights into the long-term crustal deformation processes and regional seismic potential of the FWRZ.
1 Introduction
According to the active-block theory of tectonics in continental interiors (Deng et al., 2003; Zhang et al., 2003), active crustal deformation is the product of long-term (on a timescale of 104 years) tectonic loading since the Late Quaternary. This not only includes discontinuous deformation on the boundaries of active blocks (terranes) recorded by river/land offsets but also the motion and internal deformation of the terrane itself (Deng et al., 2003; Zhang et al., 2003). Determining the detailed kinematic constraints of active crustal deformation is key for understanding continental dynamics (Zhang et al., 2004; Bird, 2009) and predicting the long-term risk of strong earthquakes, which can then contribute to providing quantitative seismic risk assessments (Bird and Kagan, 2004).
The Fen–Wei rift zone (FWRZ) in North China, which extends for approximately 1,200 km, is a famous Cenozoic intra-continental rift zone within the Asian continent (Figure 1). The FWRZ lies between two latitudinal active tectonic belts: the Qinling Mountains to the south and the Yanshan Mountains to the north (Figure 1). The former is recognized as the important pathway of “extrusion tectonics” induced by eastward expansion of the Tibetan Plateau (Zhang et al., 1995; Tapponnier et al., 2001). Conversely, the latter is part of the roughly EW-trending Zhang-Bo seismic zone caused by the far-field effects of western Pacific subduction (Zhang et al., 2018; Hao et al., 2020). Thus, constraining active crustal deformation in the FWRZ can provide insights into the transition between these two tectonic domains. Moreover, previous studies have shown that the FWRZ corresponds to transtensional tectonics during the Late Quaternary (Xu et al., 1993; Deng et al., 1999). However, the spatial pattern of strain partitioning has not been clarified, resulting in substantial debate over the dynamic tectonic mechanism (Xu et al., 1992; Deng et al., 1999; Zuza and Yin, 2016; Qiu and Qiao, 2017; Liu et al., 2021). Furthermore, intense continuous tectonic loading since the Late Quaternary has induced frequent and intense seismicity in the FWRZ (Figure 1), indicating the potential for strong earthquakes in this region (Work Group of M7, 2012). Thus, constraining active crustal deformation in the FWRZ can help elucidate several important issues.
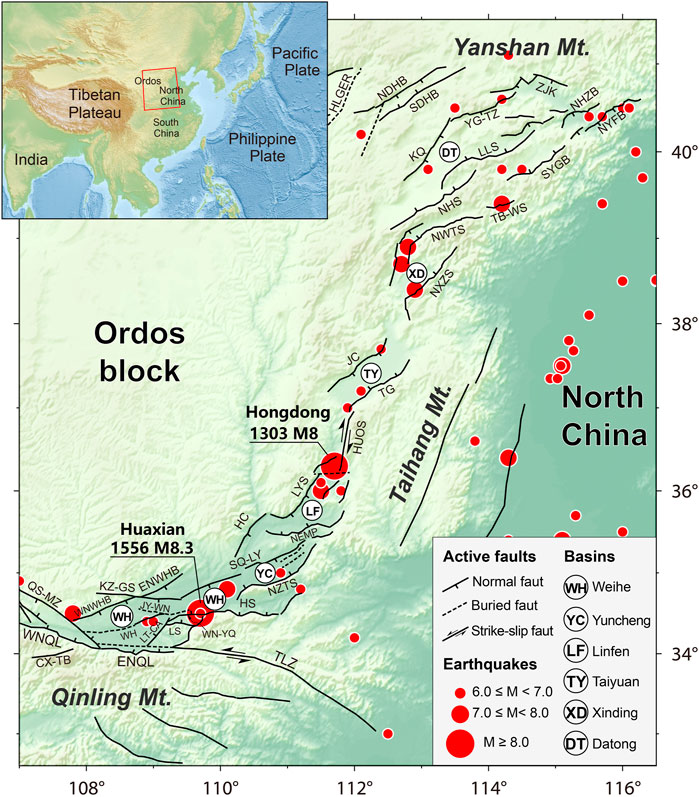
FIGURE 1. Distribution of active faults and strong earthquakes in the FWRZ and its adjacent regions. The fault data mainly refer to Deng et al. (2002) and Xu et al. (2016). And the seismic data is cited from the National Earthquake Data Center (http://data.earthquake.cn). Fault abbreviations are CX-TB, the Chengxian-Taibai Fault; QS-MZ, the Qishan-Mazhao Fault; WNQL, the Western segment of North Qinling Fault; ENQL, the Eastern segment of North Qinling Fault; HS, the Huashan Fault; NZTS, the North Zhongtiaoshan Fault; HC, the Hancheng Fault; TLZ, the Tieluzi Fault; LT-CA, the Lintong-Changan Fault; WH, the Weihe Fault; WN-YQ, the Weinan-Yuanqian Fault; JY-WN, the Jingyang-Weinan Fault; LS, the Lishan Fault; NEMP, the North Fault of Emei Platform; SQ-LY, the Shuangquan-Linyi Fault; KZ-GS, the Kouzhen-Guanshan Fault; WNWHB, the Western segment of North Weihe Basin Fault; ENWHB, the Eastern segment of North Weihe Basin Fault; LYS, the Luoyunshan Fault; HUOS, the Huoshan Fault; JC, the Jiaocheng Fault; TG, the Taigu Fault; NXZS, the North Xizhoushan Fault; NWTS, the North Wutaishan Fault; NHS, the North Hengshan Fault; LLS, the Liulengshan Fault; KQ, The Kouquan Fault; YG-TZ, the Yanggao-Tianzhen Fault; ZJK, the Zhangjiakou Fault; NHZB, the North Huaizhuo Basin Fault; NYFB, the North Yangfan Basin Fault; SYGB, the South Yuguang Basin Fault; TB-WS, the Taibai-Weishan Fault; NDHB, the North Daihai Basin Fault; SDHB, the South Daihai Basin Fault; DQS, the Daqingshan Fault; HLGER, the Helinge’er Fault.
Typical kinematic data used to constrain crustal deformation include fault slip rates, GPS velocity fields, and principal stress directions. Although the geological fault slip rate represents the average rate of long-term crustal deformation across an active fault, measurement errors related to river/land offsets and chronology increase the uncertainty of estimates. Moreover, it is difficult to quantitatively describe block (terrane) motion and internal deformation using only traditional geological methods. Alternatively, geodetic GPS data can provide high-precision constraints of crustal deformation with flexible spatial scales and can be a useful supplement in active tectonic studies in the FWRZ (Wang and Shen, 2020; Hao et al., 2021). However, it is uncertain whether present-day crustal deformation revealed by geodetic GPS (on the timescale of several decades or within one seismic cycle) can represent long-term crustal deformation processes (on a timescale of 104 years or several seismic cycles). Furthermore, geodetic GPS limited in its ability to precisely determine the activity for a single fault with a low slip rate (<1 mm/a) because low slip rates may be concealed by the GPS observational error (Mazzotti and Gueydan, 2018). This is pertinent to the FWRZ because active tectonic surveys have revealed a large number of active faults with a slip rate of <1 mm/a (Deng et al., 1994; Xu, 2002; Xu et al., 2011; Luo et al., 2020).
Previous studies have shown that the interseismic GPS velocity field is approximately equivalent to the long-term crustal deformation (Zhang et al., 2004; Liu and Bird, 2008; Carafa et al., 2020; Gan et al., 2021). Furthermore, Middleton et al. (2017) demonstrated that the long-term crustal extension rate across the northern Shanxi rift constrained by geological fault slip rates is consistent with regional GPS data. Thus, joint fitting of the various kinematic constraints on crustal deformation in the FWRZ, such as geological and geodetic datasets, could provide an optimal solution of active crustal deformation that includes the long-term fault slip rate, distributed crustal deformation field, and strain-rate field (Bird, 2009). Such a method can exploit the advantages of different datasets in revealing long-term crustal deformation. That is, geological fault slip rates can compensate for the inability of GPS to detect faults with a low slip rate (<1 mm/a), whereas GPS compensates for the inability of geological data to precisely detect crustal deformation on a regional scale (Khodaverdian et al., 2016; Yang et al., 2021). Moreover, this joint fitting method has been successfully applied to continental active tectonic zones, including low-strain active rifting belts in central Italy, which have a similar active tectonic background to the FWRZ (Carafa et al., 2020).
Therefore, in this study, we employed NeoKinema (Bird and Liu, 2007), a kinematic finite-element model, to integrate various kinematic datasets of the FWRZ, including updated geological fault slip rates, geodetic GPS velocity fields, and principal compressive stress directions. These data were then used to construct a detailed active crustal deformation model of the FWRZ, which comprises long-term slip rates of the most active faults, the long-term crustal deformation field, and strain-rate fields (including on-fault and off-fault fields). The following specific questions were addressed in this study: 1) What are the overall characteristics of long-term fault activity in the FWRZ? 2) Does significant tectonic extrusion exist along the EW-trending Qinling Mountains? 3) What is the distribution of shear and extensional strain along the Shanxi rift? 4) Which areas exhibit strong earthquake potential in the FWRZ?
2 Active tectonic background
The NE–NEE trending FWRZ comprises a series of linear rifted basins with a left-stepping en-echelon distribution (Figure 1). The results of deep geophysical exploration, such as the uplifted Moho surface and high heat flow, indicate that the FWRB exhibits clear characteristics of intra-continental rifting (Jing et al., 2005; Tang et al., 2010; Li et al., 2014). The FWRZ predominantly consists of the Weihe and Shanxi rifts (Figure 1). The former is located between the southern margin of the Ordos block and the Qinling Mountains and is connected to the east with the Linfen Basin of the Shanxi rift (Figure 1). Previous studies have illustrated that the North Qinling Fault controls activity along the Weihe rift (Jing et al., 2005; Li et al., 2016). The North Qinling Fault has shown strong normal dip-slip activity since the Late Quaternary, with stronger faulting on its eastern segment than on its western segment (Figure 1). To the east, the Huashan Fault is considered to represent the seismogenic structure of the 1,556 Huaxian M8¼ earthquake (Shaanxi Earthquake Agency, 1996). Although a series of normal dip-slip faults have also developed in the northern margin of the Weihe rift, their activity is generally weaker than that of the North Qinling Fault (Xu et al., 1988). According to left-lateral river/land offsets along the Tieluzi Fault in the eastern Qinling Mountains (Figure 1), the Qinling Mountains have been interpreted as a pathway of eastward lateral extrusion of the Tibetan Plateau (Zhang et al., 1995; Tapponnier et al., 2001). However, previous estimates of the left-lateral strike-slip rate on the Tieluzi Fault show notable discrepancies (Zhang et al., 1995; Zhou et al., 2001). For example, Yang et al. (2005) reported that the left-lateral strike-slip rate of the Tieluzi Fault varied from 0.5 to 1.25 mm/a in the Late Pleistocene.
The NE-trending Shanxi rift marks the eastern boundary of the Ordos block, which consists of the Yuncheng Basin, the Linfen Basin, the Taiyuan Basin, the Xinding Basin, and the Datong Basin (Research Group on Active Fault System around the Ordos, 1988; Wang, 1996) (Figure 1). Xu et al. (1993) emphasized that transtensional tectonics since the Late Quaternary explains the dynamic deformation background of fault activity and the frequent occurrence of strong earthquakes in the Shanxi rift (Figure 1). This kinematic model shows that the central part of the Shanxi rift is dominated by right-lateral shear, which contributes to normal faulting and crustal extension in the north and south ends of the Shanxi rift, respectively (Figure 1). According to historical records, seven destructive earthquakes with M ≥ 7 have occurred in the Shanxi rift, including the Hongdong 1303 M 8.0 earthquake, which caused the death of 20 million people (Xu and Deng, 1990; Song, 2011; Xu et al., 2018). Previously reported normal dip-slip rates for the most active faults in the Shanxi rift are generally <1 mm/a for the Late Quaternary or Holocene (Deng et al., 1994; Dou and Yu, 1996; Jing et al., 2005; Xu et al., 2013; Middleton et al., 2017; Sun, 2018; Luo et al., 2020), and right-lateral strike-slip rates do not typically exceed 2 mm/a (Xu et al., 2014; Sun, 2018). Furthermore, the estimated horizontal extensional rate in the NW-trending Datong Basin (less than 1–2 mm/a, Zhao et al., 2017) is approximately compatible with the long-term extension rate determined by geological data (Middleton et al., 2017).
3 Kinematic model
3.1 Model theory
In this study, we used NeoKinema, a kinematics finite-element program (Bird and Liu, 2007; Carafa et al., 2020) to jointly fit the most recent kinematic datasets (geological slip rate, geodetic velocity, and stress direction) using a weighted least-squares method and then determine the optimal long-term fault slip rates and horizontal deformation field in the FWRZ and its surrounding areas. The objective function of the NeoKinema model is expressed as
In the first term,
In NeoKinema, some constraints (geological slip rates) are considered to apply along the fault traces, whereas other constraints (minimization of strain rate and isotropy) are applied across the unfaulted (continuum) elements. In the equation,
Because the long-term predicted fault slip rates and deformation field are derived from the joint inversion of three independent observation systems (geological fault slip rate, geodetic GPS velocity, and horizontal principal compressive stress direction), NeoKinema embeds three different weighting parameters (L0, A0, and μ) to obtain the best fitting model in the acceptable solution space. Among them, L0 is the reference length, which represents the unit length weight of the fault trace relating to the long-term slip rate, and A0 is the reference area, which represents the unit area weight under the micro-block structure and isotropic constraints. The fitting quality of the model is governed by different dimensional tuning parameter combinations of L0 and A0. In NeoKinema, it is assumed that the target value of the strain rate in the unfaulted continuum elements is zero. However, the possibility of buried or undiscovered active faults in these regions cannot be ruled out. Moreover, no strain rates are known in the first calculation. Therefore, a small strain-rate uncertainty, μ, must be assigned for reconciliation. A detailed description of the selection of the two tuning parameters (L0 and A0) and the uncertainty (μ) is presented below.
3.2 Input data: Kinematic modeling constraints
3.2.1 Active fault traces
The active fault database of the FWRZ (Deng et al., 2002; Xu et al., 2016) was employed to collect the latest constraints of active faults and construct the fault geometry, as shown in Figure 2A. The resulting model involves 80 active faults, all of which have clear surface traces and dip angles. To construct a fault geometry that most closely resembles the realistic distribution of faults and highlight the major active faults, the fault geometry included as many active faults as possible. However, some secondary faults were excluded according to the following considerations: 1) secondary faults without a historical record of strong earthquakes and 2) faults lacking explicit morphological evidence of strong earthquakes in the Late Quaternary.
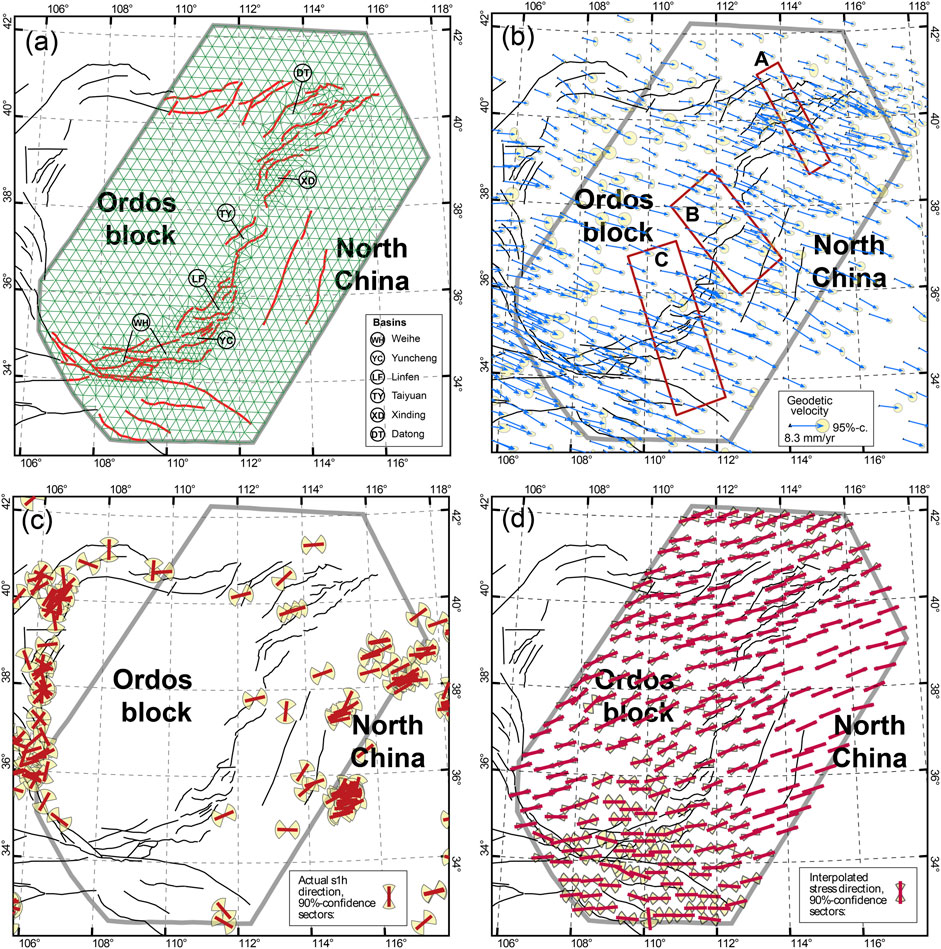
FIGURE 2. (A) Traces of active faults and finite-element grids used in this study. The solid red lines signify the active faults involved in the model. Thin green lines represent the finite-element grid. The model includes 1,069 nodes and 540 triangular elements. The length of the grid side is between 20 and 100 km. (B) GPS benchmark velocity field. The blue vectors represent GPS velocity constraints from Hao et al., 2021. The error ellipse represents 95% confidence. All velocities are with respect to the stable Eurasia plate. The red rectangle boxes with capital letters show the locations of GPS profiles which will be discussed in the next text. (C) The directions of the principal compressive horizontal principal stress from the World Stress Map (WSM database release 2016) (Heidbach et al., 2009; http://www.world-stress-map.org/). (D) Interpolated directions of the principal compressive horizontal principal stress by NeoKinema. For legibility, only one-quarter of the interpolated directions are shown. The heavy grey polygonal area signifies the simulation scope. The solid black lines represent the major active faults in the area.
Table 1 lists the Late Quaternary geological slip rates of the 32 faults used as the model input in this study. The fault slip rates, together with their standard deviations (STD), were taken as prior constraints in NeoKinema. We determined the STD of the fault slip rates according to the following conventions (Liu and Bird, 2008; Khodaverdian et al., 2016): 1) if a range of geological slip rates was available, the median value was used as an a priori constraint, and the width of the range was assigned to be equal to ±2 mm/a; 2) if a unique value was given rather than a range, its corresponding STD was assumed to be one half of the available slip rates; 3) if no slip rate was available, a zero target rate was assigned with a large STD of approximately 5 mm/a. According to the above principles, fault slip rates with large uncertainties were assigned less weight than other kinematic constraints (geodetic velocities and stress direction) when predicting the slip rates.

TABLE 1. Geological fault slip rates used in the model.
3.2.2 GPS velocity field
In this study, we used the GPS horizontal velocities of Hao et al. (2021), which were mainly collected from the following: 1) 1999–2019 observation data from the Crustal Motion Observation Network of China (CMONOC-Ⅰ/Ⅱ); 2) three-epoch campaign observations implemented during 1999–2019 from the National GPS Geodetic Control Network of China; and 3) 2006–2015 observation data from the regional GPS network in the FWRZ. During data processing, the co-seismic and post-earthquake deformation of the 2008 Wenchuan Ms 8.0 earthquake and the 2011 Japan Tohoku-Oki Ms 9.0 earthquake were effectively excluded to obtain the latest regional long-term horizontal velocity field with the highest density of GPS stations and longest time span. For details on the data processing method, refer to Hao et al. (2021).
To improve the calculation accuracy, GPS velocities with large errors and obvious outliers were excluded from this study. Considering the uncertainty of fault traces, all GPS sites located within 2 km of the fault trace with slip rates of over 1 mm/a were deleted in the preprocessing program of NeoKinema (Bird and Liu, 2007). After careful station selection, 468 GPS benchmark velocities were used in the simulation (Figure 2B). Moreover, the velocity predicted by NeoKinema represents the long-term (steady-state) crustal deformation. Therefore, GPS velocities near the faults, which are affected by interseismic fault locking, were corrected by the negative dislocation model for elastic deformation, with a uniform locking depth of 1–15 km (Wang et al., 2011). The velocities derived by the model after eliminating elastic deformation caused by interseismic fault locking are shown in Supplementary Figure S1.
3.2.3 Principal compressive stress directions
The principal compressive stress direction data, which were primarily obtained from focal mechanism solutions, indicate crustal deformation characteristics with a seismic period of up to 103 years. Therefore, adding the principal compressive stress direction undoubtedly provides a beneficial constraint for obtaining the long-term crustal deformation. We used principal compressive stress direction data from the World Stress Map Project (Heidbach et al., 2009; http://www.world-stress-map.org/). Specifically, two types of highly reliable principal compressive stress direction data were employed in the model: data derived from the focal mechanism solution and borehole breakout data. A total of 541 original principal compressive stress field directions (Figure 2C) were collected.
As mentioned above, NeoKinema assumes that the principal strain rate directions should be consistent with the principal stress directions in unfaulted continuum elements. These discretely observed stress directions were interpolated to all unfaulted continuum elements using a clustering algorithm (Bird and Li, 1996). The interpolated principal compressive stress direction then serves as the relaxed constraint of the principal direction of the strain rate in the unfaulted continuum elements which has limited impact on the solutions (Figure 2D).
3.3 Multi-parameter optimization
In NeoKinema, the joint fitting quality is controlled by adjusting three tuning parameters (strain rate uncertainty,
Referring to the method of Liu and Bird (2008), we calculated the L1-norm and L2-norm [root mean square (RMS) of misfit errors] of the continuum-stiffness, principal compressive stress direction, fault slip rate, and geodetic data. The results show that the misfit errors of different constraints, including the fault slip rates, geodetic velocities, and stress direction data, tend to decrease with μ, indicating that the flexibility of the finite-element grid increases with μ. Therefore, a large value of μ can hinder convergence of the NeoKinema model. Moreover, the prior μ should be consistent with the posterior
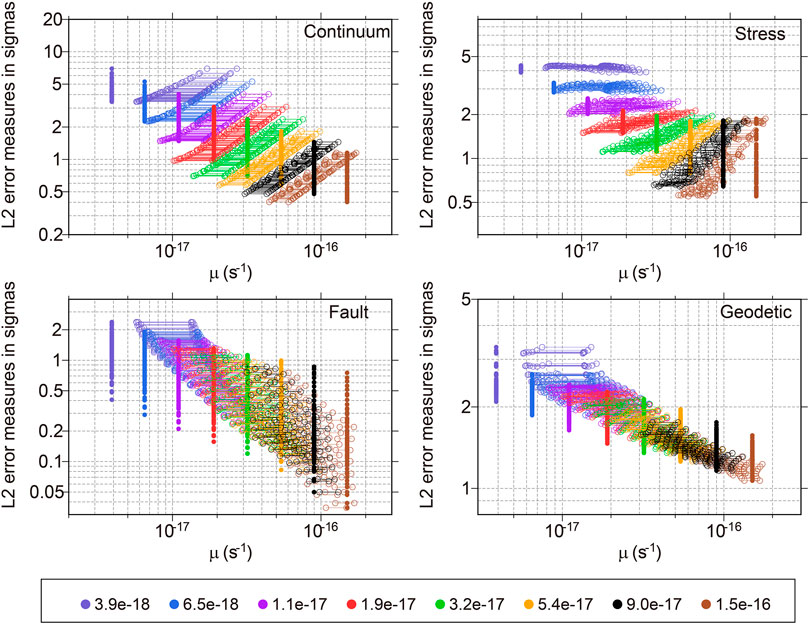
FIGURE 3. Different μ as a priori versus L2-norm errors (RMS prediction errors in units of standard deviations) of continuum-stiffness, stress direction, geological slip rate and geodetic velocity. (For each μ, L2 misfit errors of 64 models with various combinations of
Thus, after fixing μ at 3.2 × 10⁻¹⁷, we further searched for the optimal combination of L0 and A0. Figure 4A illustrates the relationship between L0 and the corresponding L2 norm within the variation range of L0 after setting different A0 values. When L0 is larger than 1.65 m × 104 m, the fitting results of the continuum-stiffness, stress direction, and geodetic data were not notably improved; however, the fitting quality of the predicted quality of the fault slip rate was reduced. Therefore, L0 cannot be too large. Figure 4B shows the relationship between A0 and the corresponding L2 norm within the variation range of A0 for different L0 values. When A0 exceeds 2.2 × 10⁹ m2, the misfit error of the geodetic data and fault slip rate were reduced, whereas the misfit error of the continuum-stiffness and principal compressive stress direction data were increased. Combining the results in Figures 4A,B revealed that, if μ is fixed at 3.2 × 10⁻¹⁶ s−1, the combination of L0 = 1.65 × 10⁴ m and A0 = 2.2 × 10⁹ m2 leads to reasonable misfit errors. Thus, the L2 norm (normalized RMS error) of geological fault slip rates, GPS velocities, and interpolated principal compressive stress directions were restricted to STDs of 0.384, 1.608, and 1.372, respectively.
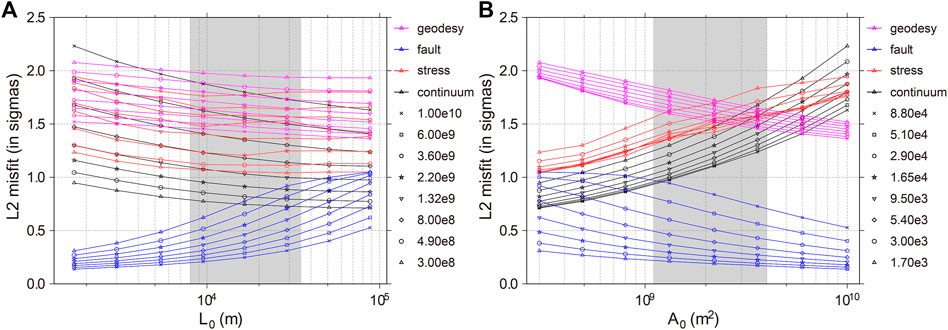
FIGURE 4. The L2-norm misfit errors of continuum strain rate, stress direction, fault slip rate and geodetic velocity under the model with different combinations of L0 and A0. (A) Reference length L0 versus the L2-norm misfit errors; (B) Reference length L0 versus the L2-norm misfit errors. Continuum strain-rate, stress direction, fault slip rate and geodetic velocity errors are represented by symbols and connected lines in black, red, blue and magenta, respectively. Different symbols represent misfit errors versus L0 at different A0. Grey shadow shows the preferred range of L0.
Consequently, the fixed μ (μ = 2.5 × 10⁻¹⁶ s−1), L0, and A0 (L0 = 1.65 × 10⁴ m, A0 = 2.20 × 10⁹ m2) values were used as the optimal parameter combination to obtain the optimal model. Figure 5 shows the predicted and published long-term fault slip rates, and details of this comparison are presented in Table 2. The model-derived long-term velocities at GPS benchmarks and the most-compressive strain-rate axes (i.e., the horizontal principal compressive stress directions) from our optimal model are shown in Supplementary Figures S2, S3, respectively. In Figure 5, the relationship between the model offset rates and geological fault slip rates falls along the reference line with a slope of one. We then fitted a linear regression for the relationship between the offset rates of the preferred model and the geological result, except for the Tieluzi Fault, Jiaocheng Fault, and North Xizhoushan Fault (with discrepancy above 1mm/a). The coefficient of determination (R2), which is a statistical measure in regression models, quantifies the goodness of fit. R2 ranges between 0 and 1, with values closer to one indicating a stronger correlation. Thus, the R2 value of 0.97 obtained in our regression model indicated a very strong correlation between the offset rates of the preferred model and the geological result. It is worth noting that the left-lateral geological strike-slip rate of the Tieluzi Fault is 0.5–1.25 mm/a (Yang et al., 2005), which is significantly larger than the model result of 0.13 ± 0.11 mm/a. In addition, the model slip rates of the Jiaocheng Fault and North Xizhoushan Fault bounding the Shanxi rift were lower than the geological constraints (Figure 5; Table 2). Furthermore, the model slip rates exhibited a large fitting error, reflecting a significant discrepancy between prior geological constraints and other constraints (especially the GPS velocity). This discrepancy does not exclude the influence of GPS observation uncertainties and the distribution of GPS stations but indicates a potential for overestimating the geological slip rate through uncertainty of the geochronological constraints. The discussion above also illustrates the importance of the joint inversion of geological and geodetic measurements.
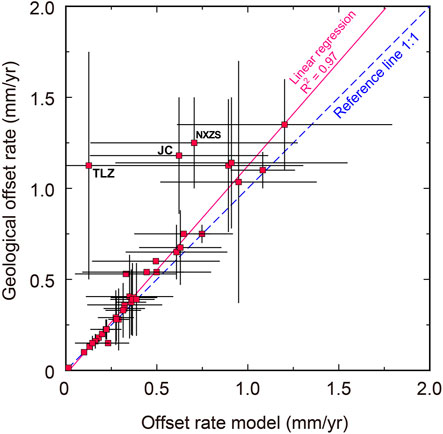
FIGURE 5. Offset rates of preferred model versus geological fault slip rate. (The vertical and horizontal black error bars represent uncertainties of published slip rates and preferred model, respectively. The dash line is the reference line with slope of 1. The pink line represents the linear regression result of model offset rate sand geological rate, except for the Tieluzi Fault (TLZ), the Jiaocheng Fault (JC) and the North Xizhoushan Fault (NXZS).
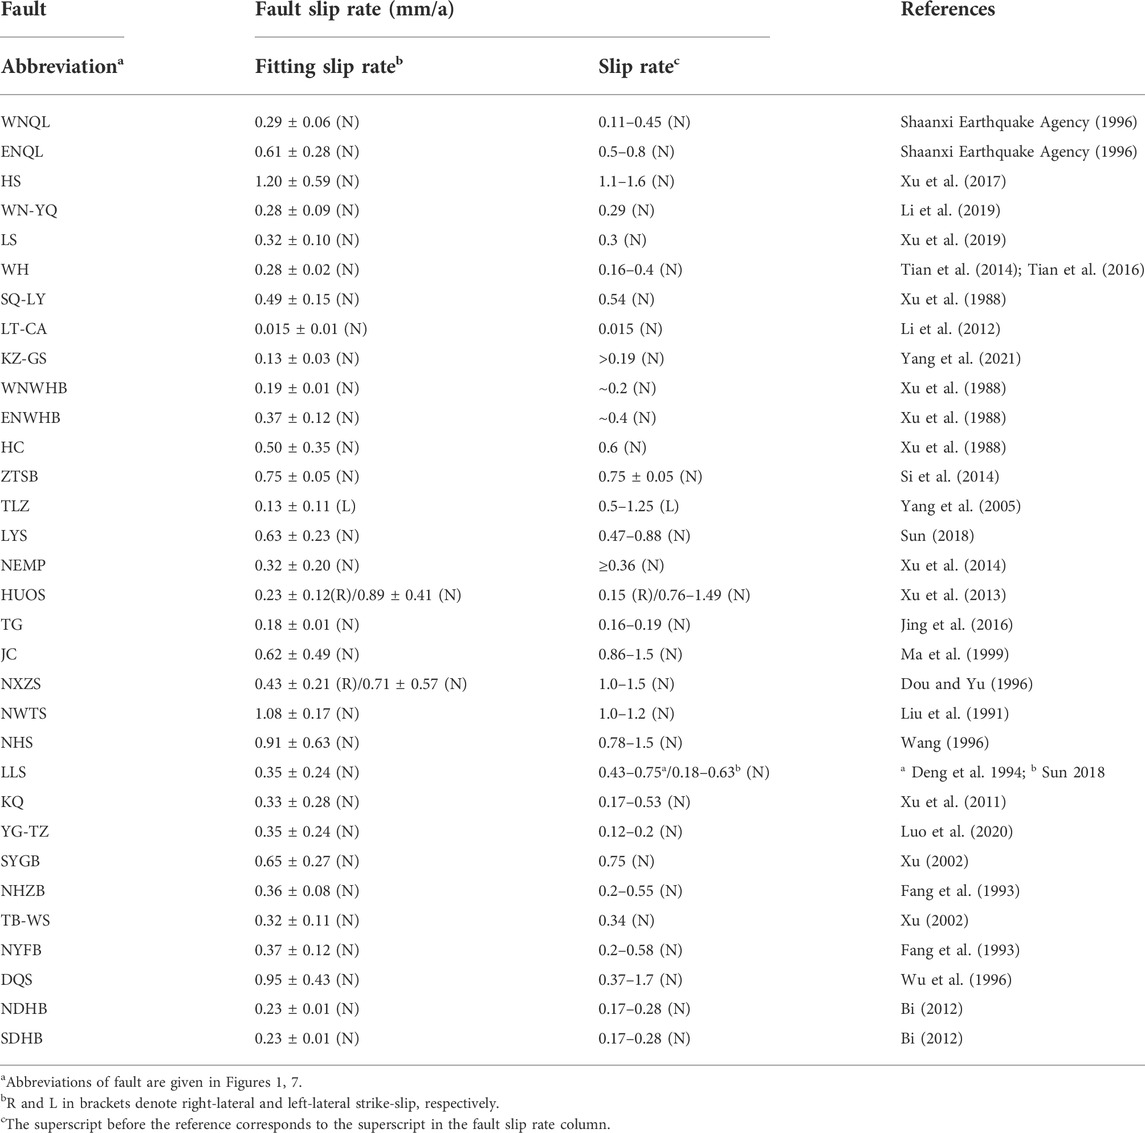
TABLE 2. Comparison of predicted fault slip rates with published studies.
4 Results
4.1 Long-term fault slip rate
As shown in Figure 6 and Table 2, the optimal model provides detailed fault slip rates for the most active faults in the FWRZ (Figure 6; Table 2). The predicted slip rates on most active faults are less than 1 mm/a, generally implying a low-strain kinematic background in the Late Quaternary. For the Weihe rift (Figure 1), the predicted normal dip-slip rate on the western segment of North Qinling Fault is 0.29 ± 0.06 mm/a, which is lower than that of the eastern segment of the North Qinling Fault (0.61 ± 0.28 mm/a) and the Huashan Fault (1.20 ± 0.59 mm/a) (Figure 6A). Moreover, the normal dip-slip rate on the western segment of North Weihe Basin Fault (0.19 ± 0.01 mm/a) is slightly lower than that on the eastern segment of North Weihe Basin Fault (0.37 ± 0.12 mm/a) (Figure 6A). Thus, normal faulting activities along the south and north margins of the Weihe rift tend to increase in an eastward direction (Li et al., 2016).
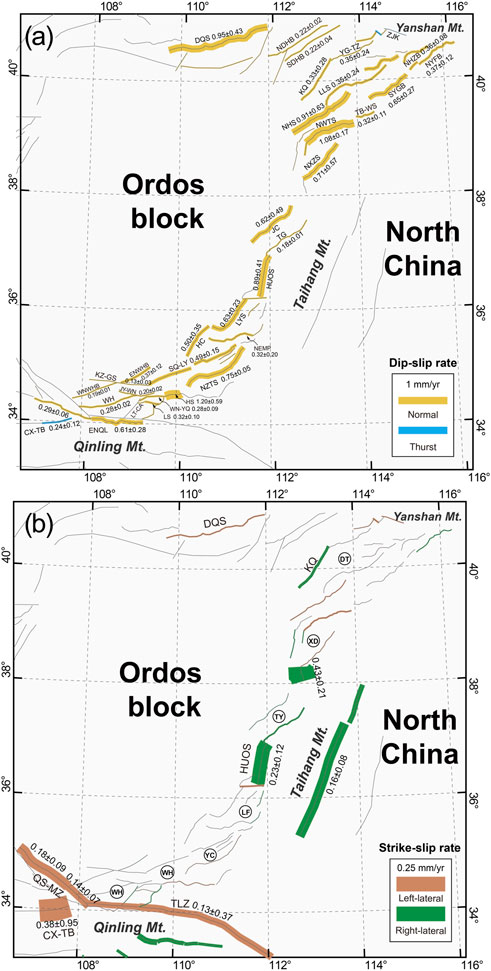
FIGURE 6. Predicted dip-slip (A) and strike-slip (B) rates. Abbreviations of faults are given in Figure 1.
Notably, the left-lateral strike-slip rate on the Tieluzi Fault is only 0.13 ± 0.11 mm/a (Figure 6B), which is substantially lower than the estimates derived from geological offsets in the Late Quaternary (0.5–1.25 mm/a) (Yang et al., 2005). Although the modeled long-term velocity field supports the existence of left-lateral strike-slip motion in the EW direction between the Ordos block and the Qinling Mountains (Figure 7), the left-lateral shearing zone is diffuse and not localized on individual faults. Therefore, further studies are required to determine whether this discrepancy is caused by time-varying fault motion or by observational errors in geodetic and/or geological measurements of dislocation and/or chronology.
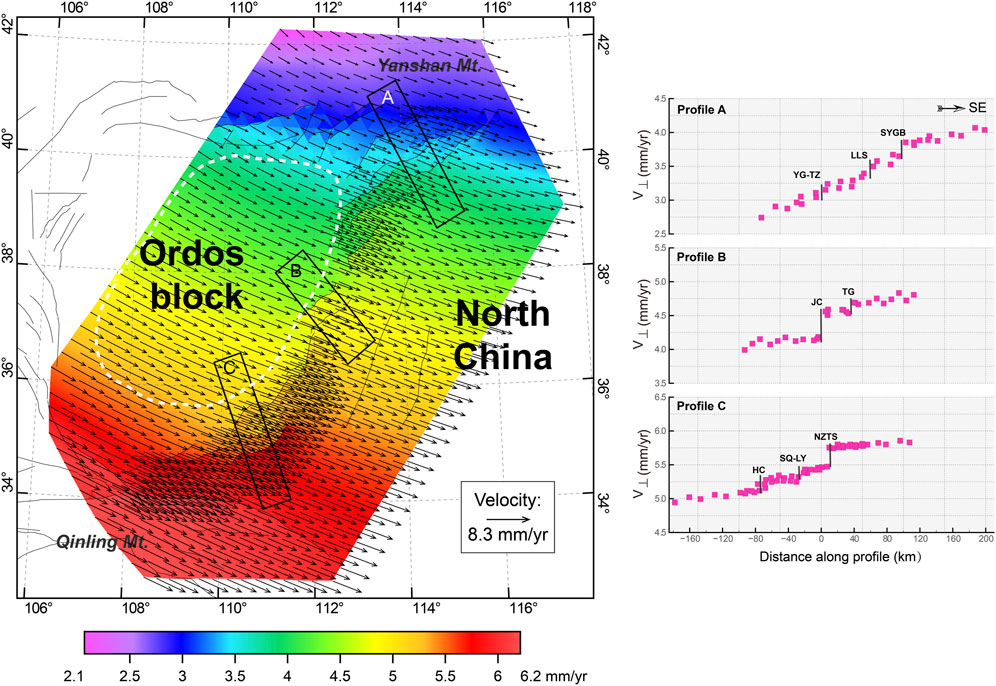
FIGURE 7. Modeled (nodal solution) long-term horizontal velocity field with respect to the stable Eurasia. Profiles A, B, and C are three velocity profiles across the Datong, Taiyuan, and Yuncheng basins, respectively. The black rectangle boxes with capital letters show the locations of velocity profiles, which are plotted in the right plane. The vertical axes of the profiles represent the velocity component perpendicular to the trending of major active faults, so it shows the variations of horizontal extensional rate across the basin. Abbreviations of faults are given in Figure 1.
Similar to the Weihe rift, the normal dip-slip rate on most faults in the Shanxi rift are assigned geological constraints (Figure 1; Table 1). The overall low post-fit uncertainties of predicted slip rates (Table 2) illustrate relatively significant consistency between the geological results and other kinematic constraints (GPS and principal stress direction). Our predicted fault slip rates on the Shanxi rift reveal that rifting/crustal extension at its southern and northern ends are considerably higher than those in the central part of the rift (Figure 6A). Previous studies have highlighted the dextral strike-slip nature of N–S-trending active faults in the middle part of the Shanxi rift but disagreed on the magnitude of the slip rate (Xu et al., 1993). For cross-validation, we did not assign any prior constraint in our model. Therefore, the derived strike-slip rates in the middle part of the Shanxi rift are the results constrained with GPS and principal stress direction datasets. The results of the optimal model (Figure 6B) confirm that NNE-trending active faults exhibit relatively right-lateral strike-slip motion in the middle part of the Shanxi rift. The predicted right-lateral strike-slip rates of the Huoshan Fault and North Xizhoushan Fault are 0.23 ± 0.12 mm/a and 0.43 ± 0.21 mm/a, respectively, which are very low compared to their normal dip-slip components (accounting for approximately 26% of the dip-slip) and in good agreement with a recent geological study (Xu et al., 2013).
4.2 Velocity and strain-rate fields
The predicted long-term average horizontal crustal motion velocities and strain rates are shown in Figure 7 and Figure 8, respectively. According to Figure 7, the long-term horizontal velocity is characterized by movement in the SEE–SE direction, and the velocities gradually decrease from the north to south of the entire model domain with respect to the stable Eurasia plate. The magnitude of the velocity vector in the Ordos block varies smoothly, with a velocity gradient of only approximately 1–1.5 mm/a over more than 400 km in the N–S direction (area outlined with a white dotted line in Figure 7). This result is consistent with the rigidity and stability of the Ordos block and compatible with its lower strain rate (1 × 10–17.0 s−1—1 × 10–16.6 s−1/3.1536 × 10–10 a−1—3.1536 × 10–9.6 a−1) obtained by our joint inversion. In contrast, the velocity gradient of the FWRZ, which is located between the Ordos block and North China, varies significantly and exhibits horizontal extensional motion perpendicular to the strikes of the primary active faults. In particular, the northern and southern parts are consistent with the development of many active faults with a large strain rate (approximately 1 × 10–14.9 s−1/3.1536 × 10–7.9 a−1). As shown in Figure 7, the horizontal extensional rate across the Datong Basin is 1.0–1.2 mm/a (Profile A, Figure 7), which is larger than extensional rate of ∼0.8 mm/a across the Yuncheng Basin (Profile C, Figure 7). For the middle part of the FWRZ, the extensional rate across the Taiyuan Basin is lower than that across the Datong and Yuncheng basins, and extensional deformation is predominantly localized at the Jiaocheng Fault, which borders the Taiyuan Basin to its west (Profile B, Figure 7). Furthermore, a left-lateral velocity gradient of ∼1 mm/a exists between the southern margin of the Ordos Block and the Qinling Mountains across the Weihe rift. However, this differential movement is diffusely distributed over 100–150 km in the N–S direction. As such, it is hard to identify whether the sinistral strike-slip rate on the Tieluzi Fault is greater than 1 mm/a.
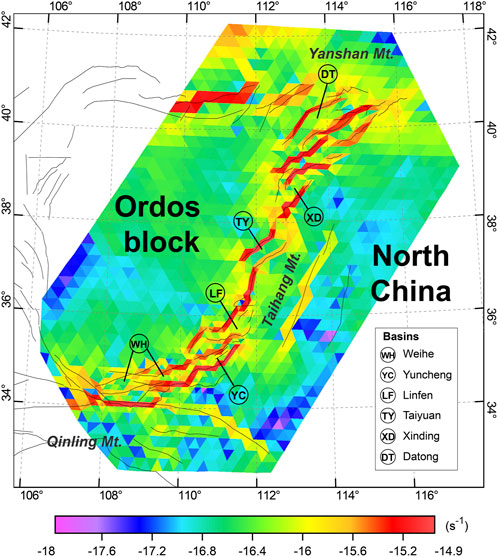
FIGURE 8. Long-term average horizontal strain-rate field of the preferred model (in logarithmic scale). Abbreviations of faults are given in Figure 1.
5 Discussion
In this study, we integrated geological, geodetic GPS, and principal compressive stress direction datasets to obtain refined long-term (steady-state) fault slip rates, the long-term distributed horizontal velocity field, and the strain-rate field in the FWRZ. Although our results represent a trade-off among various kinematic constraints controlled by a set of weights, the posterior variances of multiple datasets approximate their respective variances, indicating that the different datasets are mutually consistent. The long-term crustal deformation results (timescale of 104 years or over several seismic cycles) are consistent with the regional crustal deformation revealed by present-day interseismic geodetic GPS (timescale of decades or within one seismic cycle). This kinematic model of long-term deformation provides primary constraints for seismic risk assessments and research on active regional tectonics in the FWRZ.
5.1 Reference model
Previous studies have shown that the interseismic GPS crustal deformation field is approximately consistent with the long-term crustal deformation (Zhang et al., 2004; Liu and Bird, 2008; Middleton et al., 2017; Gan et al., 2021), which forms the basis of our joint fitting inversion. However, the consistency between the regional crustal deformation characteristics revealed by interseismic GPS data and the geological fault slip rates of the FWRZ should still be carefully checked.
Therefore, we constructed a reference model without any GPS priorities but constrained by the fault geological slip rates and principal compressive stress directions. Thus, the fitting results of this model represent the reference long-term crustal deformation. Furthermore, the same systematic optimization method shown in Section 3.3 was used to determine the optimal parameter combination (μ = 3.2 × 10⁻¹⁷, L0 = 1.65 × 10⁴ m, A0 = 2.20 × 10⁹ m2) (Figure 9). After fixing these optimal parameters, we obtained the fitting results and compared the modeled velocity field of the reference model (Supplementary Figure S4) with the original GPS results (Figure 2B). Three different regions of the FWRZ, the Datong Basin, the Taiyuan Basin, and the Yuncheng Basin, were selected to represent three velocity profiles with the same locations (Figure 2B; Supplementary Figure S4).
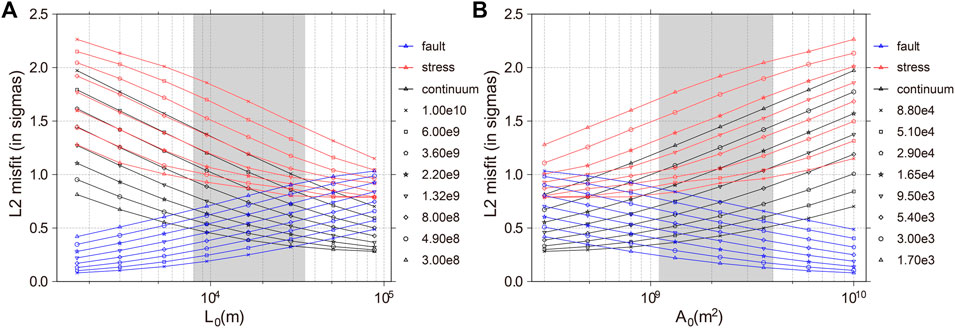
FIGURE 9. The L2-norm misfit errors of continuum strain-rate, stress direction, and fault slip rate under the reference model with different combinations of L0 and A0. (A) Reference length L0 versus the L2-norm misfit errors; (B) Reference length L0versus the L2-norm misfit errors; Continuum strain-rate, stress direction, and fault slip rate errors are represented by symbols and connected lines in black, red, and blue, respectively. Different symbols represent misfit errors versus L0 at different A0 (in m2). Gray shadow shows the preferred range of L0 and A0.
We projected the velocity components within the corresponding profile domains perpendicular to the relative fault strikes and approximately perpendicular to the predicted horizontal principal stress directions (most-compressive strain-rate axes) of the preferred model (Supplementary Figure S3). Eventually, we derived the velocity profiles shown in Figure 10. The horizontal velocities derived from the reference model show extension of 1.0–1.2 mm/a across the Datong Basin (Figure 10A), which is consistent with the far-field extensional rate of 1.0–1.2 mm/a revealed by GPS observations (Figure 10B), as well as our optimal model of joint fitting inversion described in Section 3 (Figure 7). Similarly, the results for Yuncheng Basin show that the long-term crustal deformation derived from the reference model (Figure 10E) is compatible with the results revealed by interseismic GPS measurements (Figure 10F).
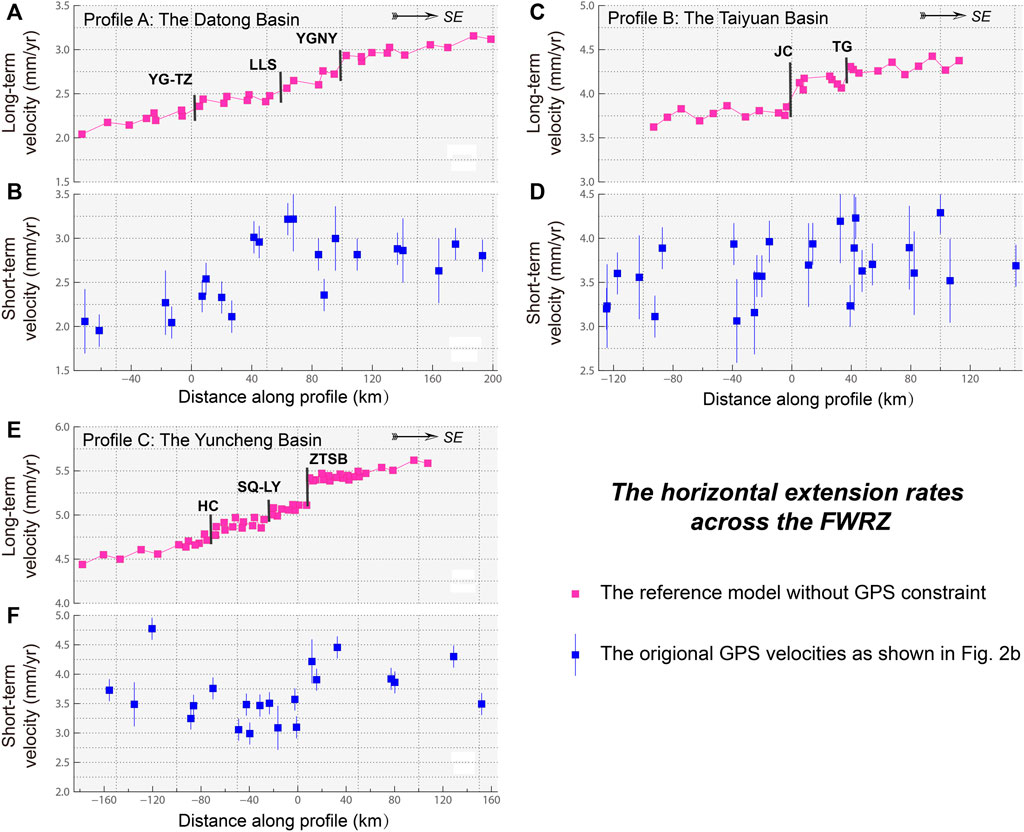
FIGURE 10. The long-term horizontal velocity profiles (pink square dots, see Figure 7 for the profile location) from our reference model and GPS (short-term) velocity profiles (blue square dots, see Figure 2B for the profile location) perpendicular to the striking direction of primary active faults. (A, B): the long-term and short-term velocity profile of the Datong Basin; (C, D): the long-term and short-term velocity profile of the Taiyuan Basin; (E, F): the long-term and short-term velocity profile of the Yuncheng Basin; Abbreviations of faults are given in Figure 1.
Previous studies have shown that significant normal dip faulting and seismic activity occurred since the Late Quaternary to the Holocene in the Taiyuan Basin (Ma et al., 1999; Xie et al., 2004, 2008; Jing et al., 2016). Notably, as shown in Figure 10D, it is difficult to determine the significant extensional signal across the Taiyuan Basin using only present-day GPS observations. However, obvious extensional movement is revealed in the corresponding horizontal velocity profile (Figure 10C) derived from the reference model. Therefore, it is necessary to apply joint inversion objectively to recover the long-term deformation field.
The above comparison suggests that the long-term and short-term interseismic crustal deformation results for the FWRZ are approximately compatible. It also indicates that, in a low-strain region such as the FWRZ, geodetic GPS can accurately define the total far-field rate across some active tectonic zones and constrain blocks (terranes) far from the active boundaries. However, where GPS is not sensitive to very slight motion on individual faults, the geological slip rate can compensate for the limitations of GPS and recover more objective long-term deformation and strain-rate fields.
5.2 Seismic hazard forecasting
The FWRZ is famous for strong earthquakes within mainland China. According to historical records, there have been numerous earthquakes with M ≥ 7, including the Huaxian 1556 M 8.3 earthquake, which caused the most deaths from any earthquake in human history. According to the long-term (steady-state) fault slip rate (Figure 5) and the long-term strain-rate field (Figure 7) inferred from the optimal model, we employed the tectonic-dependent SHIFT (Seismic Hazard Inferred from Tectonic) model to calculate long-term seismicity in the FWRZ. The calculation included two steps: 1) calculation of the seismic moment rate of each deformation unit using the long-term strain rates coupled with the seismogenic layer thickness (
In this study, the magnitude threshold of long-term shallow earthquakes (depth <70 km) was specified as M 6 according to the following considerations: 1) M 6 is greater than the lower boundary of the minimum magnitude predicted by the SHIFT model (Bird and Kagan, 2004), which can ensure a high accuracy of calculation; 2) although some studies have proposed that the minimum magnitude of completeness for the 500-year historical earthquake catalog in this region is M5 (Xu and Gao, 2014), for a large number of non-instrumentally recorded earthquakes, the magnitude and location are relatively high. To further determine the magnitude threshold, we plotted the relationship between the historical earthquake magnitude (M 5–M 7) and cumulative number of earthquakes (> M 4) (Figure 11A). In contrast to the fitting line, Figure 11A shows a remarkably steep slope between M 5 and M 6, implying that the seismic catalog of M 5–M 6 is incomplete. The histogram (Figure 11B) also shows a loss of earthquake records between M 5 and M 6 (Figure 11). Finally, M 6 was determined using the magnitude threshold of seismic activity, and the SHIFT model was used to predict regional long-term seismic activity in the FWRZ and adjacent areas.
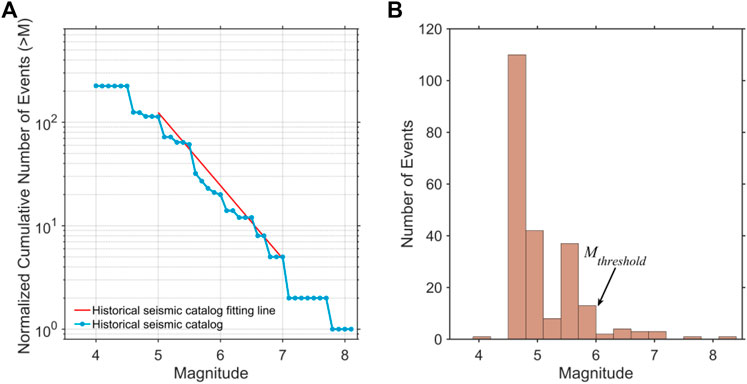
FIGURE 11. (A) The G-R magnitude frequency relation of historical earthquakes in the FWRZ. (B) Frequency as a function of magnitude corresponding to the historical earthquake catalog in (A). Mthreshold represents the magnitude threshold of long-term shallow earthquakes for calculating the long-term seismicity in the FWRZ. The historical earthquakes data are after the National Earthquake Data Center (http://data.earthquake.cn).
As a developed area of ancient civilization, the FWRZ has sufficient historical earthquake records. Studies have shown that most areas have relatively complete earthquake catalogs of destructive earthquakes of M ≥ 5 since 1,500 (Xu and Gao, 2014), which facilitates the analysis of regional strong earthquake potential through a comparison with seismicity data calculated by the SHIFT model. Based on the regional long-term seismicity calculation (Figure 12), we further divided the FWRZ into 10 sub-seismic activity zones (Figure 12A; Supplementary Figure S5) according to previous seismic structure partitioning (Li et al., 2020) and compared the calculated seismicity with the actual earthquake records of M ≥ 6 (Figure 12B; Supplemantary Table S1) from 1,500 to 2022 (522 years). According to the statistical results, calculated earthquake activity of M ≥ 6 for the Datong Basin and adjacent areas in the northern FWRZ is 3.96/522 a−1, whereas the actual record is 2/522 a−1. For the western FWRZ, the calculated seismicity is 2.27/522 a−1, compared to the actual record of 1/522 a−1. Thus, the relatively significant seismicity deficit in the Datong Basin indicates a background of high seismic risk. In addition, the Yuncheng and Hancheng basins, which are closely related both spatially and tectonically, also indicate a seismicity deficit. This seismicity deficit also characterizes the Linfen Basin; however, the M 8.0 earthquake in 1,303 (Figure 12B) occurred close to the lower boundary year (1,500) used for the calculation. Therefore, the strong seismic risk in the Linfen Basin should be lower than that in the aforementioned regions and is worthy of further study.
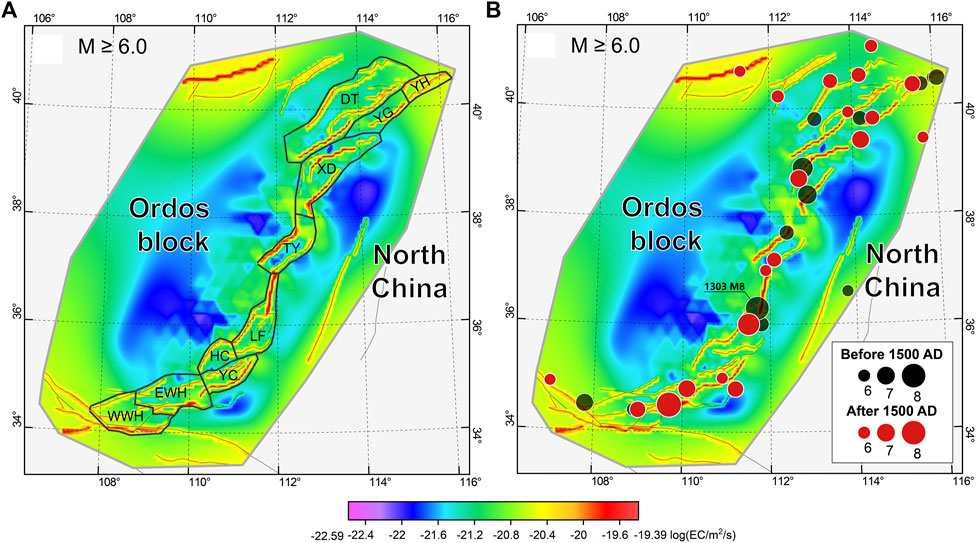
FIGURE 12. (A) The forecast of shallow seismicity rate (in epicenters per square meter per second) in the FWRZ for a threshold M 6.0, evaluated on a 0.0625°×0.0625°grid. The black polygonal areas represent the partition boundaries used to count seismicity. Abbreviations are: WWH, the Western Weihe Basin; EWH, the Eastern Weihe Basin; YC, the Yuncheng Basin; HC, the Hancheng Basin; LF, the Linfen Basin; TY, the Taiyuan Basin; XD, the Xinding Basin; DT, the Datong Basin; YG, the Yuguang Basin; YH, the Yanhuai Basin. (B) Consistent with (A),the red and black dots represent the epicenter distribution of historical earthquake occurred in the FWRZ before and after 1,550, respectively.
5.3 Tectonic implications
Previous studies have indicated that the Shanxi rift, as the main body of the FWRZ (Figure 1), exhibits the characteristic strain partitioning pattern of transtensional tectonics. At its southern (the Yuncheng Basin) and northern (the Datong Basin) ends, horizontal extension is predominantly controlled by fault-tip transtension of the right-lateral shearing localized on the Huoshan Fault and the North Xizhoushan Fault in the central Shanxi rift (Xu and Ma, 1992). The results of our optimal model are generally consistent with this spatial pattern of strain partitioning (Figures 6, 7). However, the predicted right-lateral shearing of ∼0.5 mm/a on the N–S-trending faults located in the central Shanxi rift is incompatible with the high extensional rates of 1–1.2 mm/a in the southern and northern Shanxi rift. Thus, we cannot rule out the hypothesis that the deep Earth participates in crustal extension through material exchange in the vertical direction (Deng et al., 1999; Zhu et al., 2011; Lei, 2012; Zhang et al., 2016). It is possible that the far-field effect of Pacific subduction might be superimposed on the horizontal crustal extension (Hao et al., 2021).
Our predicted results do not support significant extrusion of the Tibetan Plateau along the E–W-trending Qinling Mountains (Zhang et al., 1995; Tapponnier et al., 2001). Specifically, the estimated sinistral strike-slip rate of the Tieluzi Fault within the eastern part of the Qinling Mountains is very low (∼0.2 mm/a) (Figure 6). Although this result could be attributed to the sparse GPS stations or observation errors, the total sinistral shear rate across the southern Ordos block and Qinling Mountains determined from the predicted long-term velocity field is approximately 1 mm/a (Figure 7). Furthermore, a recent study revealed that eastward crustal extrusion of the Tibetan Plateau is resisted by the rigid Ordos block and transformed into thrust faulting and crustal folding in the southwestern corner of the Ordos block (Zheng et al., 2013). The remaining sinistral shear strain is ∼1 mm/a, which is accommodated by the NW-trending Qishan–Mazhao Fault in the southwestern end of the Weihe rift (Figure 1) (Li et al., 2018). Thus, it is inferred that sinistral shear induced by “extrusion tectonics” decreases in an eastward direction because of accommodation of depression activity in the Weihe rift, which appears to be consistent with our results.
6 Conclusion
In this study, we constructed a detailed active crustal deformation model of the FWRZ, which consists of the long-term slip rates of most active faults, the long-term crustal deformation field, and the strain-rate field (including on-fault and off-fault fields). This model was constructed by joint fitting of the most recent geological fault slip rate, GPS velocity field, and principal compressive stress direction datasets. The major conclusions of this study are as follows:
1) The majority of predicted long-term fault slip rates in the FWRZ are less than 1 mm/a, which implies a low-strain kinematic background. Furthermore, normal dip-slip faulting in the Weihe rift, which represents the south part of the FWRZ, gradually increases in an eastward direction. The predicted sinistral strike-slip rate of the Tieluzi Fault is very low (∼0.2 mm/a), indicating limited tectonic extrusion along the E–W-trending Qinling Mountains. Indeed, the total sinistral shear rate from the southern Ordos block to the Qinling Mountains is only approximately 1 mm/a.
2) Although the FWRZ is dominated by normal dip-slip faulting, dextral shear of ∼0.5 mm/a exists on the N–S-trending faults in the central Shanxi rift, which decreases from the central Shanxi rift to its northern and southern ends. Conversely, normal dip-slip faulting is enhanced in these regions, with relatively large crustal extensional rates of 1.1–1.2 mm/a across the Datong and Yuncheng basins. However, this significant crustal extension cannot be solely attributed to the terminal effects caused by limited dextral shear in the central Shanxi rift.
3) A comparison of historical earthquake records and predicted seismicity based on calculated long-term strain rates reveals some prominent areas of seismicity deficit, where the predicted seismicity is much higher than that in the record, including the Datong, Hancheng, and Yuncheng basins, indicating there higher seismic potential and being worthy of further study.
Data availability statement
The raw data supporting the conclusion of this article will be made available by the authors, without undue reservation.
Author contributions
SS performed the experiment and contributed significantly to manuscript preparation; YL contributed to the conception of the study, performed the data analyses, and wrote the manuscript. MH helped perform the analysis and provided constructive discussions.
Funding
This research was jointly supported by the National Key Research and Development Program of China (2017YFC1500100), the National Natural Science Foundation of China (42072243, 41874017), and the Continental Rift Valley Dynamics State Observatory of Taiyuan (NORSTY 2021-05).
Acknowledgments
We thank Peter Bird for providing the program NeoKinema. The figures in this paper were created using GMT tools (Wessel and Smith, 1995).
Conflict of interest
The authors declare that the research was conducted in the absence of any commercial or financial relationships that could be construed as a potential conflict of interest.
Publisher’s note
All claims expressed in this article are solely those of the authors and do not necessarily represent those of their affiliated organizations, or those of the publisher, the editors and the reviewers. Any product that may be evaluated in this article, or claim that may be made by its manufacturer, is not guaranteed or endorsed by the publisher.
Supplementary material
The Supplementary Material for this article can be found online at: https://www.frontiersin.org/articles/10.3389/feart.2022.964800/full#supplementary-material
References
Bi, M. (2012). The study of fault activity and seismic hazard in Daihai fault zone (in Chinese). Beijing: China University of Geosciences.
Bird, P., and Kagan, Y. Y. (2004). Plate-tectonic analysis of shallow seismicity: Apparent boundary width, beta, corner magnitude, coupled lithosphere thickness, and coupling in seven tectonic settings. Bull. Seismol. Soc. Am. 94, 2380–2399. doi:10.1785/0120030107
Bird, P., and Li, Y. (1996). Interpolation of principal stress directions by nonparametric statistics: Global maps with confidence limits. J. Geophys. Res. 101, 5435–5443. doi:10.1029/95jb03731
Bird, P., and Liu, Z. (2007). Seismic hazard inferred from tectonics: California. Seismol. Res. Lett. 78, 37–48. doi:10.1785/gssrl.78.1.37
Bird, P. (2009). Long-term fault slip rates, distributed deformation rates, and forecast of seismicity in the Western United States from joint fitting of community geologic, geodetic, and stress direction data sets. J. Geophys. Res. 114. doi:10.1029/2009jb006317
Carafa, M. M. C., Galvani, A., Di Naccio, D., Kastelic, V., Di Lorenzo, C., Miccolis, S., et al. (2020). Partitioning the ongoing extension of the central Apennines (Italy): Fault slip rates and bulk deformation rates from geodetic and stress data. J. Geophys. Res. Solid Earth 125, 2169–9313. doi:10.1029/2019jb018956
Deng, Q., Cheng, S., Wei, M., Yang, G., and Dianwei, R. (1999). Discussion on cenozoic tectonics and dunamics of Ordos block (in Chinese). J. Geomechanics 5 (3), 9.
Deng, Q., Ryok, N., Xu, X., Suzuki, Y., Wang, C., Zhu, N., et al. (1994). Study on the Late Quaternary kinematics of the northern piedmont fault of the Liuleng mountain (in Chinese). Seismol. Geol. 16, 339–343.
Deng, Q., Zhang, P., Ran, Y., Yang, X., Min, W., and Chen, L. (2003). Active tectonics and earthquake activities in China. Earth science frontiers (in Chinese). Earth Sci. Front. 10, 66–73.
Deng, Q., Zhang, P., Ran, Y., Yang, X., Min, W., and Chun, Q. (2002). Basic characteristics of active tectonics in China (in Chinese). Sci. China (Earth Sci. 32.
Dou, S., and Yu, S. (1996). The relation between Quanternary volcano and earthquake activity in the Datong Basin (in Chinese). Res. Act. Faults 1996, 104–115.
Fang, Z., Cheng, Z., and Ran, Y. (1993). Yanhuai basin-ridge structure and some features of Late Quaternary fracture movement (in Chinese). Prog. Geophys. 1993, 274–275.
Gan, W., Molnar, P., Zhang, P., Xiao, G., Liang, S., Zhang, K., et al. (2021). Initiation of clockwise rotation and eastward transport of southeastern tibet inferred from deflected fault traces and GPS observations. GSA Bull. 134, 1129–1142. doi:10.1130/b36069.1
Hao, M., Li, Y., Wang, Q., Zhuang, W., and Qu, W. (2020). Present-day crustal deformation within the western qinling Mountains and its kinematic implications. Surv. Geophys. 2020, 1–19. doi:10.1007/s10712-020-09621-5
Hao, M., Wang, Q., Zhang, P., Li, Z., Li, Y., Zhuang, W., et al. (2021). Frame wobbling" causing crustal deformation around the Ordos block. Geophys. Res. Lett. 48. doi:10.1029/2020gl091008
Heidbach, O., Tingay, M., Barth, A., Reinecker, J., Kurfeß, D., Müller, B., et al. (2009). The World stress Map database.
Jing, Z., Liu, F., Du, Y., and Xie, F. (2016). The activity characteristics of the southern section of the Taigu fault in Shanxi since the Late Pleistocene (in Chinese). Geol. Bull. China 35, 1559–1569.
Jing, Z., Zhao, B., and Tu, M. (2005). The formation of the Fenwei rift valley (in Chinese). Earth Sci. Front. 12, 247–262.
Khodaverdian, A., Zafarani, H., and Rahimian, M. (2016). Long term fault slip rates, distributed deformation rates and forecast of seismicity in the Iranian Plateau. Tectonics 34, 2190–2220. doi:10.1002/2014tc003796
Lei, J. (2012). Upper-mantle tomography and dynamics beneath the north China craton. J. Geophys. Res. 117. doi:10.1029/2012jb009212
Li, B., Sørensen, M. B., Atakan, K., Li, Y., and Li, Z. (2020). Probabilistic seismic hazard assessment for the Shanxi rift system, north China. Bull. Seismol. Soc. Am. 110, 127–153. doi:10.1785/0120190099
Li, G., Li, C., Li, X., and Ma, J. (2019). Late quaternary paleoearthquake research of weinan plateau front fault (in Chinese). South China J. Seismol. 39, 65–70.
Li, X., Feng, X., Ren, J., Dai, W., and Shi, Y. (2012). Exploration on lintong-chang’an Fault for its activities since quaternary period (in Chinese). Northwest. Seismol. J. 34, 398–404.
Li, X., Zhang, P., Zheng, W., Feng, X., Li, C., Xu, H., et al. (2018). Kinematics of late quaternary slip along the qishan-Mazhao Fault: Implications for tectonic deformation on the southwestern Ordos, China. Tectonics 37 (9–10), 2983–3000. doi:10.1029/2018tc005043
Li, Y., Wang, Q., Cui, D., and Hao, M. (2016). Analysis on the faulting origin of kouzhen-Guanshan Fault in Weihe Basin (in Chinese). J. Geodesy Geodyn. 36, 669–673.
Li, Z., Liu, B., Yuan, H., Feng, S., Chen, W., Li, W., et al. (2014). Fine crustal structure and tectonics of Linfen Basin-from the results of seismic reflection profile (in Chinese). Chin. J. Geophys. 57, 1487–1497.
Liu, G., Yu, S., and Zhang, S. (1991). The relation between quanternary volcano and earthquake activity in the Datong Basin (in Chinese). Res. Act. Faults 1991, 118–130.
Liu, L., Liu, Y., Zhu, L., and Ji, L. (2021). Influence of the 1947 Dari M7.7 earthquake on stress evolution along the boundary fault of the Bayan Har block: insights from numerical simulation. Chin. J. Geophys. 64 (7), 2221–2231 [in Chinese]. doi:10.6038/cjg2021P0194
Liu, Z., and Bird, P. (2008). Kinematic modelling of neotectonics in the Persia-Tibet-Burma orogen. Geophys. J. Int. 172, 779–797. doi:10.1111/j.1365-246x.2007.03640.x
Luo, Q., Li, C., Ren, G., Li, X., Ma, Z., and Dong, J. (2020). The late Quaternary activity features and slip rate of the Yanggao-Tianzhen fault (in Chinese). Seismol. Geol. 42, 399–413.
Ma, B., Xu, G., Sheng, X., Cao, D., Zhang, S., and Mu, X. (1999). A study on the tectonogeomorphology along the Jiaocheng fault, Shanxi Province (in Chinese). Bull. Inst. Crustal Dyn. 9.
Mazzotti, S., and Gueydan, F. (2018). Control of tectonic inheritance on continental intraplate strain rate and seismicity. Tectonophysics 746, 602–610. doi:10.1016/j.tecto.2017.12.014
Middleton, T. A., Elliott, J. R., Rhodes, E. J., Sarah, S., Walker, R. T., Wang, W., et al. (2017). Extension rates across the northern Shanxi Grabens, China, from Quaternary geology, seismicity and geodesy. Geophys. J. Int. 2017, ggx031. doi:10.1093/gji/ggx031
Qiu, J., and Qiao, X. (2017). A study on the seismogenic structure of the 2016 Zaduo, Qinghai Ms6. 2 earthquake using InSAR technology [J]. Geod. Geodyn. 8 (5), 342–346. doi:10.1016/j.geog.2017.04.008
Research Group On Active Fault System around Ordos Massif, State Seismological Bureau (1988). Latest crust movement and earthquakes in and around capital region (in Chinese). Beijing: Seismological Press.
Shaanxi Earthquake Agency (1996). Active fault zone in the northern margin of Qinling mountains (in Chinese). Beijing: Seismological Press.
Si, S., Li, Y., Lv, S., and Wang, Y. R. (2014). Holocene slip rate and paleoearthquake records of the salt lake segment of the northern Zhongtiaoshan Fault, Shanxi province (in Chinese). Sci. China (Earth Sci. 44, 1958–1967.
Song, Z. (2011). Global earthquake catalog(9999B.C.∼2010A.D.)(in Chinese). Beijing: Seismological Press.
Sun, C. (2018). Activity research on the typical faults in the northwestern and southeastern margin of Ordos since late Pleistocene (in Chinese). Beijing: China University of Geosciences.
Tang, Y., Feng, Y., Chen, Y., Zhou, S., and Wang, H. (2010). Receiver function analysis at Shanxi rift (in Chinese). Chin. J. Geophys. 53, 2102–2109.
Tapponnier, P., Zhiqin, X., Roger, F., Meyer, B., Arnaud, N., Wittlinger, G., et al. (2001). Oblique stepwise rise and growth of the Tibet Plateau. Science 294, 1671–1677. doi:10.1126/science.105978
Tian, Q., Zhou, B., Li, X., Shi, J., Wei, Q., and Bina, J. (2016). Distribution of Yangjia village-Yaodian section of Weihe fault and the characteristics of its Late Quaternary activity (in Chinese). Seismol. Geol. 38, 141–151.
Tian, Q., Zhou, B., Rui, D., Bian, J., and Wei, Q. (2014). Activity rate of the east section of Weihe Fault in late middle Pleistocene (in Chinese). J. Catastrophology 29, 76–81.
Wang, H., Liu, M., Cao, J., Shen, X., and Zhang, G. (2011). Slip rates and seismic moment deficits on major active faults in mainland China. J. Geophys. Res. 116, B02405. doi:10.1029/2010jb007821
Wang, M., and Shen, Z. (2020). Present-day crustal deformation of continental China derived from GPS and its tectonic implications. J. Geophys. Res. Solid Earth 125, e2019JB018774. doi:10.1029/2019JB018774
Wang, N. (1996). Cenozoic sedimentation and tectonic geomorphology of Shanxi Graben System (in Chinese). Beijing: Science Press.
Wessel, P., and Smith, W. H. F. (1995). New version of the generic mapping tools. Eos Trans. AGU. 76 (47), 329. doi:10.1029/95eo00198
Work Group of M7 (2012). Study on the mid- to long-term potential of large earthquakes on the Chinese continent (in Chinese). Beijing: Seismological Press.
Wu, W., Li, K., Ma, B., Sheng, X., Yang, F., Guo, W., et al. (1996). Study on the Late Quaternarty slip rate of the piedmont fault of Mt. Daqingshan (in Chinese). Bull. Inst. Crustal Dyn. 10.
Xie, X., Jiang, W., Sun, C., Yan, C., and Feng, X. (2008). Comparison study on Holocene paleoseismic activities among multi-trenches along the Jiaocheng Fault zone, Shanxi (in Chinese). Seismol. Geol. 30, 412–430.
Xie, X., Jiang, W., Wang, H., and Feng, X. (2004). Holocene activities of the Taigu Fault zone, Shanxi Province‚in relation to the 1303 Hongdong M=8 earthquake (in Chinese). Acta Seismol. Sin. 26, 281–293.
Xu, L., Bian, J., Hu, N., Tian, Q., Tian, W., and Duan, R. (2019). The activity of Western Lishan Fault since the late Pleistocene. Seismol. Geol. 41, 15.
Xu, W., and Gao, M. (2014). Statistical analysis of the completeness of earthquake catalogs in China mainland (in Chinese). Chin. J. Geophys. 57, 2802–2812.
Xu, W., Gao, Z., and Yang, Y. (2014). Late quaternary activity research of the northern marginal fault of Emei platform, Shanxi province (in Chinese). Seismol. Geol. 36, 1043–1052.
Xu, W., Yang, Y., Yuan, Z., Liu, Z., and Gao, Z. (2017). Late quaternary faulted landforms and fault activity of the Huashan piedmont fault (in Chinese). Seismol. Geol. 39, 587–604.
Xu, X., and Deng, Q. (1990). The features of Late Quaternary activity of the piedmont fault of Mt. Huoshan, Shanxi province and 1303 Hongdong earthquake(Ms=8)(in Chinese). Seismol. Geol. 12, 11.
Xu, X., Han, Z., and Yang, X. (2016). Seismotectonic Map of China and its adjacent regions (in Chinese). Beijing: Seismological Press.
Xu, X. (2002). Latest crust movement and earthquakes in and around capital region. Beijing, China: Science Press.
Xu, X., Liu, X., and Zhang, S. (2011). Late Quaternary faulted landforms and determination of slip rates of the middle part of Kouquan fault (in Chinese). Seismol. Geol. 33, 335–346.
Xu, X., Ma, X., and Deng, Q. (1993). Neotectonic activity along the Shanxi rift system, China. Tectonophysics 219, 305–325. doi:10.1016/0040-1951(93)90180-r
Xu, X., and Ma, X. (1992). Geodynamics of the Shanxi rift system, China. Tectonophysics 208, 325–340. doi:10.1016/0040-1951(92)90353-8
Xu, Y., He, H., Deng, Q., Allen, M. B., Sun, H., Bi, L., et al. (2018). The CE 1303 Hongdong earthquake and the huoshan piedmont fault, Shanxi graben: Implications for magnitude limits of normal fault earthquakes. J. Geophys. Res. Solid Earth 123, 3098–3121. doi:10.1002/2017jb014928
Xu, Y., He, H., Deng, Q., Wei, Z., Bi, L., and Sun, H. (2013). Quantitative river geomorphic parameters surrounding MTS. Huoshan, Shanxi province and their tectonic implications (in Chinese). Quat. Sci. 33, 746–759.
Xu, Y., Shentu, B., and Wang, Y. P. (1988). A preliminary study of the characteristics of the activity of the northern boundary fault belt of Weihe Basin (in Chinese). Seismol. Geol. 1998, 77–88.
Yang, X., Deng, Q., and Feng, X. (2005). The Tieluzi Fault interior eastern-qinling mountains——An active strike-slip fault (in Chinese). Earthq. Res. China 21, 172–183.
Yang, C., Li, X., Feng, X., Zhu, M., Li, M., and Zhang, E. (2021). The Late Quaternary and present-day activities of the Kouzhen-Guanshan fault on the northern boundary of Weihe graben basin, China (in Chinese). Seismol. Geol. 43, 504–520.
Zhang, H., Huang, Q., Zhao, G., Guo, Z., and Chen, Y. (2016). Three-dimensional conductivity model of crust and uppermost mantle at the northern Trans North China Orogen: Evidence for a mantle source of Datong volcanoes. Earth Planet. Sci. Lett. 453, 182–192. doi:10.1016/j.epsl.2016.08.025
Zhang, P., Deng, Q., Zhang, G., Ma, J., Gan, W., Wang, M., et al. (2003). Active tectonic blocks and strong earthquakes in continental China (in Chinese). Sci. China (Earth Sci. 33, B04.
Zhang, P., Shen, Z., Wang, M., Gan, W., BüRgmann, R., Molnar, P., et al. (2004). Continuous deformation of the Tibetan Plateau from global positioning system data. Geol. 32, 809. doi:10.1130/g20554.1
Zhang, Y., Vergely, P., and Mercier, J. (1995). Active faulting in and along the Qinling Range (China) inferred from SPOT imagery analysis and extrusion tectonics of south China. Tectonophysics 243, 69–95. doi:10.1016/0040-1951(94)00192-c
Zhang, Y., Zheng, W., Wang, Y., Zhang, D., Tian, Y., Wang, M., et al. (2018). Contem-porary deformation of the North China plain from global positioning system data. Geophys. Res. Lett. 45, 1851–1859. doi:10.1002/2017gl076599
Zhao, B., Zhang, C., Wang, D., Huang, Y., Tan, K., Du, R., et al. (2017). Contemporary kinematics of the Ordos block, North China and its adjacent rift systems constrained by dense GPS observations. J. Asian Earth Sci. 135, 257–267. doi:10.1016/j.jseaes.2016.12.045
Zheng, W., Zhang, P., He, W., Yuan, D., Shao, Y., Zheng, D., et al. (2013). Transformation of displacement between strike-slip and crustal shortening in the northern margin of the Tibetan Plateau: Evidence from decadal GPS measurements and late Quaternary slip rates on faults. Tectonophysics 584, 267–280. doi:10.1016/j.tecto.2012.01.006
Zhou, H., Han, M., and Hou, J. (2001). Characteristics of recent activity of the Tieluzi Fault in the east qinling Mountains (in Chinese). Seismol. Geol.
Zhu, R., Cheng, L., Wu, F., and Liu, J. (2011). Timing, scale and mechanism of the destruction of the North China Craton (in Chinese). Sci. China (Earth Sci. 41, 583–592.
Keywords: Fen-Wei rift zone, long-term fault slip rate, strain partitioning, seismicity forecast, neokinema
Citation: Song S, Li Y and Hao M (2022) Active crustal deformation model of the Fen–Wei rift zone, North China: Integration of geologic, geodetic, and stress direction datasets. Front. Earth Sci. 10:964800. doi: 10.3389/feart.2022.964800
Received: 09 June 2022; Accepted: 01 July 2022;
Published: 22 July 2022.
Edited by:
Wenjun Zheng, Sun Yat-sen University, Zhuhai Campus, ChinaReviewed by:
Hua Wang, Guangdong University of Technology, ChinaLi Yujiang, Ministry of Emergency Management, China
Copyright © 2022 Song, Li and Hao. This is an open-access article distributed under the terms of the Creative Commons Attribution License (CC BY). The use, distribution or reproduction in other forums is permitted, provided the original author(s) and the copyright owner(s) are credited and that the original publication in this journal is cited, in accordance with accepted academic practice. No use, distribution or reproduction is permitted which does not comply with these terms.
*Correspondence: Yuhang Li, bGl5dWhhbmdkekAxNjMuY29t