 Liang Zhang
 Sheng Zhang1
- 1College of Civil Engineering, Hunan City University, Yiyang, China
- 2School of Civil Engineering, Changsha University of Science and Technology, Changsha, China
The analysis of time-frequency variation and energy refinement characteristics of blasting vibration signals has contributed to understanding the propagation law of blasting vibration wave and reducing the possible losses. Combined with the measured data of tunnel blasting excavation and based on the newly constructed wavelet function, the spectrum distribution and energy refinement characteristics of tunnel blasting vibration signals are deeply explored and studied. The results demonstrated that compared to the Fourier spectrum, the innovative method of scale energy spectrum can not only acquire the dominant frequency of the blasting vibration signals, but also the obtained spectrum curve is smoother and can clearly reflect the change trend of the signal spectrum. The newly constructed biorthogonal wavelet has the characteristics of high vanishing moment, high regularity and matching with the waveform variation of the measured blasting vibration signals, and can describe the subtle variation characteristics of blasting vibration signal frequency. The continuous wavelet transform energy spectrum can reflect the three-dimensional energy distribution of blasting vibration signal in the time-scale domain, and the occurrence time of frequency, the frequency duration interval and time range of blasting vibration signal can also be acquired. Wavelet packet algorithm can precisely calculate the energy distribution of each frequency component in the signal, the tunnel blasting vibration signals (YBJ1, YBJ2) generated near the power tower presents low frequency, while the signals (YBF3,YBF4) far away from the power tower presents relatively high frequency. Measures should be taken to control the vibration and resonance of power tower caused by tunnel blasting. This research is of great significance for recognizing the propagation law of vibration waves, reducing the impact of blasting on surrounding buildings, and ensuring the safety of tunnel construction and surrounding buildings.
Introduction
Drilling and blasting method is the main tunneling method in tunnel construction, which is especially suitable for the excavation of solid rock and sub-solid rock mountain tunnels (Koopialipoor et al., 2019; Sharafat et al., 2021; Li, et al., 2022; Ma et al., 2022). Drilling and blasting will not only cause damage and disturbance to the surrounding rock of the tunnel, but also the seismic wave effect caused by blasting will affect the stability and safety of the buildings around the tunnel (Singh et al., 2020; Kan et al., 2022). Energy and frequency are the main parameter indexes to measure the performance of blasting vibration signal. Among them, energy is the most direct quantity reflecting the strength of blasting vibration signal, and the harm to the tunnel is more intuitive, while the impact of blasting vibration signal frequency on structures is more subtle, but it is also the main factor threatening and damaging the stability of buildings (Chen et al., 2022; Mehboob et al., 2022; Wang et al., 2022; Wu et al., 2022). The principle of the effect of the frequency characteristics of the blasting vibration wave on the structure is that when the blasting vibration wave groups with different periods are transmitted from the blasting source to the structure, the structure will amplify some frequency wave groups consistent with or close to the natural period of the structure and act on the structure, while some frequency waves that are inconsistent with the natural period of the structure are reduced or filtered. It is precisely because of the amplification of the frequency close to the structure that the blasting vibration frequency is more harmful to the structure.
For a long time, confined to the development of theory, the Fourier transform method is often used to process the blasting vibration signal. The Fast Fourier transform (FFT) technology is quite effective for the analysis of periodic stationary signals and can obtain high accuracy and good results. However, Fourier theory is a global transformation theory, which can only determine the overall nature of the singularity of a function, lacking the positioning function of time and frequency (Robustelli and Pugliano, 2018; Tyrtaiou and Elenas, 2020; Zhang et al., 2022), so as that it has great limitations in analyzing blasting vibration signals. As an improvement of FFT method, short-time Fourier transform (STFT) can perform time localization analysis to a certain extent, but it cannot take into account the needs of frequency and time resolution, that means high time resolution and frequency resolution cannot be achieved simultaneously (Jing et al., 2018; Khodja et al., 2019). Wavelet analysis is a research method developed and evolved from the traditional Fourier transform theory. Due to the constant Q property and multiresolution analysis, it can meet the requirements of time subdivision at high frequency and frequency subdivision at low frequency (Quaye-Ballard et al., 2020; Babouri et al., 2021). It has great advantages in the processing of complex, nonlinear and nonstationary signals. Wavelet (packet) analysis has the property of spatial localization and has dual analysis characteristics of frequency and time, which can reveal and reflect the propagation law of signal frequency and energy over time (Hamid et al., 2019; Shahryari et al., 2019; Tian et al., 2019).
The key lies in the selection or construction of the optimal wavelet basis when performing wavelet analysis on blasting vibration signals (Hafiz et al., 2018; Graf et al., 2019; Zhang S. et al., 2021). Usually a general basic wavelet is selected from MATLAB wavelet library for engineering signal analysis. The construction of an existing general wavelet basis often only starts from the basic conditions and mathematical theorems satisfied by the wavelet function, and not consider the problem of matching with the structural characteristics of specific engineering signals. Therefore, the existing general wavelet basis is generally not targeted and matched when analyzing specific engineering signals. The wavelet basis function should not only meet the basic requirements of tight support and attenuation, but also consider the problem of matching with specific engineering signals. In this study, the continuous wavelet transform and wavelet packet theories are applied to concretely analyze the time-frequency localization property, frequency spectrum characteristics, frequency band energy refinement characteristics of the blasting vibration signals generated from different excavation positions of tunnel on the basis of constructing the biorthogonal wavelet function for blasting vibration signal analysis, to accurately obtain the frequency spectrum information and propagation law of blasting vibration wave, evaluate the safety impact of blasting vibration on the power tower around the tunnel, and provide references and guidelines for the research on the impact of related drilling and blasting excavation on the surrounding buildings.
Engineering situation
This project is the construction of DN2000 raw water pipeline from Yanshan Pumping Station to Yuanhang Waterworks. The raw water management project is constructed to meet the water consumption of residents and enterprises in Changle City. The raw water pipeline in this design starts from Yanshan Water Pumping Station and ends at Changle Yuanhang water plant. The design scope of this project is divided into five sections, in which the starting and ending pile numbers of the tunnel are EK0+000∼EK1+964.
The diameter of the raw water pipeline is DN 2000, and the length of the whole pipeline is nearly 9.0 km, of which the length of the raw water pipeline in the tunnel is 2.1 km. The tunnel area is mainly composed of tuff of Jurassic Upper Nanyuan Formation (J3n), with simple lithology and geological structural conditions, and poor groundwater development. There are no other adverse geological phenomena except for the possible collapse of the local tunnel section due to the development of fault structures. Most of the surrounding rocks in the tunnel site are grades II∼III. The tunnel location of the project is shown in Figure 1. The green line in the figure indicates the tunnel excavation route and an electric power tower is close to the tunnel site. The tunnel excavation method is drilling and blasting. The geological plan of the study area is shown in Figure 2. The blasting vibration meter is placed under the power tower, and the sensor of the blasting vibration meter is put on the concrete base of the power tower, and is closely connected with the base surface (see Figure 3). Each time the tunnel is blasted, the sensor receives the vibration wave data of the power tower and records it into the memory of the blasting vibration meter. The panorama near the entrance of the tunnel is shown in Figure 4.
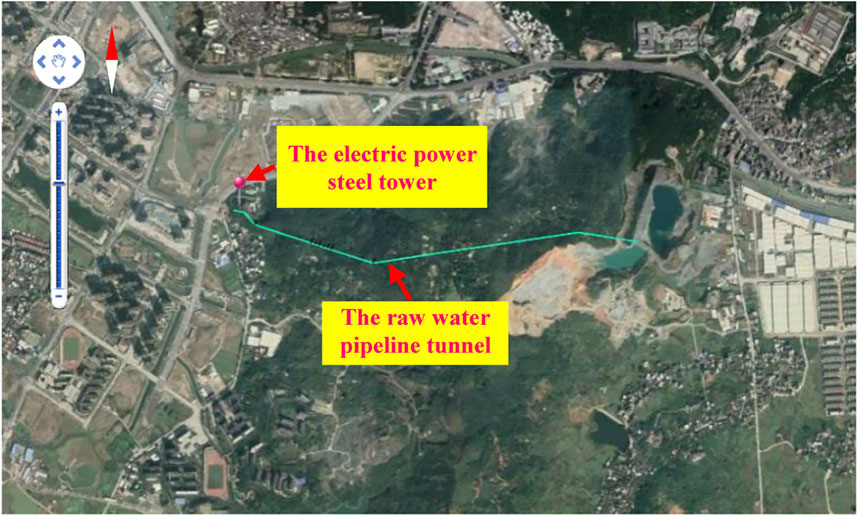
FIGURE 1. Plane location map of the raw water pipeline tunnel.
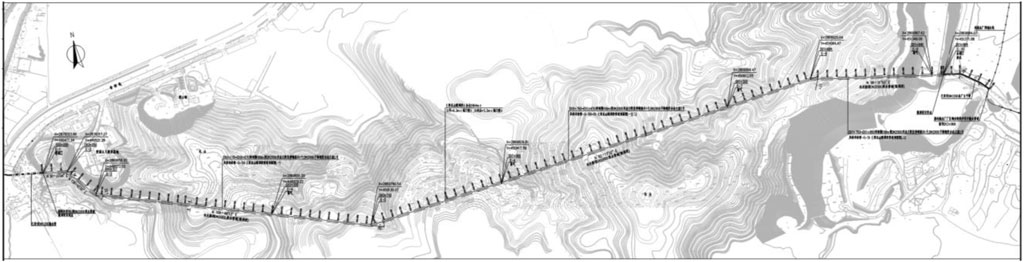
FIGURE 2. Geological plan of tunnel area.
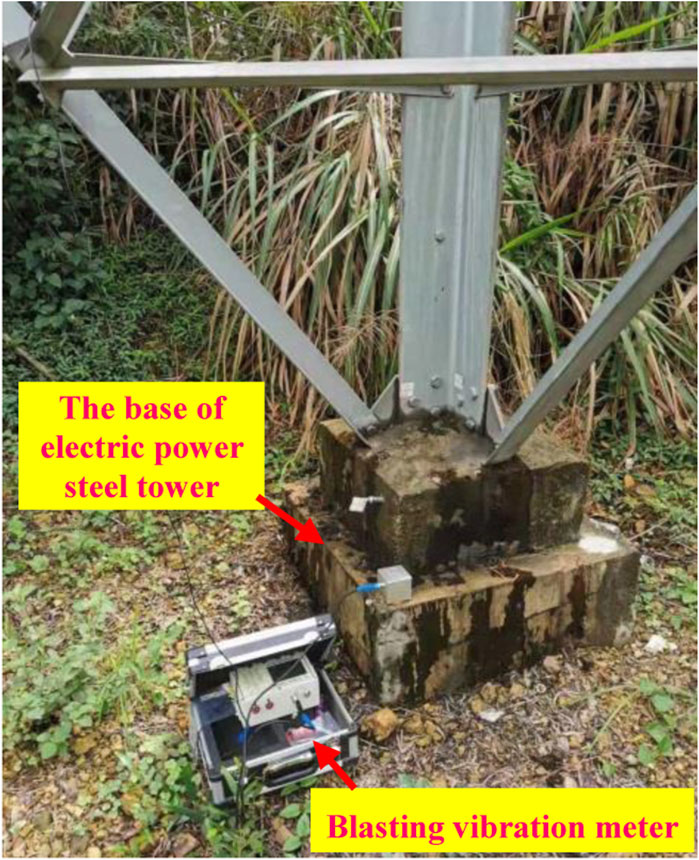
FIGURE 3. Electric power tower base and blasting vibration meter.
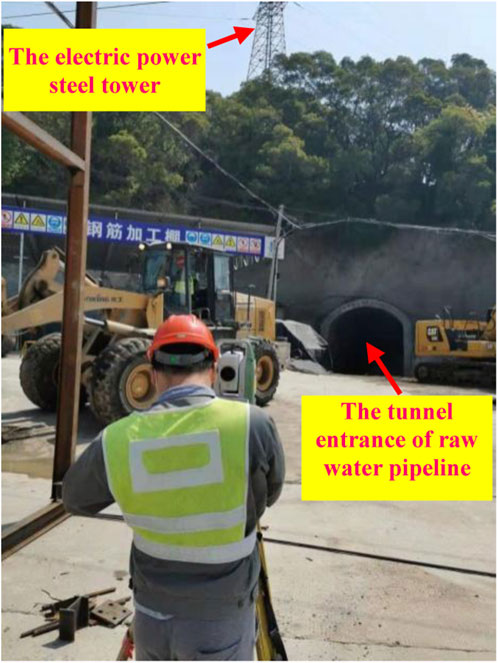
FIGURE 4. Panorama of tunnel entrance section.
Biorthogonal wavelet construction based on second generation lifting method
The blasting vibration signal has nonlinear and nonstationary characteristics. The effective method to analyze the blasting vibration signal is wavelet analysis. Selecting or constructing the wavelet basis function corresponding to the structural characteristics of the analyzed blasting signal is of great significance to improve the effect of wavelet analysis and accurately extract the characteristic information of the target signal (Zhang L. et al., 2021). The biorthogonal wavelet basis matching the structural characteristics of the blasting vibration signal is constructed by using the second generation lifting scheme wavelet theory and particle swarm optimization algorithm (Daubechies and Sweldens, 1998; Tomiyama and Kawamura, 2016). Let
where
Assuming that the initial wavelet is a lazy wavelet, the vanishing moments of the dual wavelet and the main wavelet after one-step alternating lifting are 2 and 4, respectively. Firstly, the dual lifting is performed on the initial filter bank with dual lifting operator
where
The new filter bank is transformed into
i.e.
where
Through simplification, it can be obtained as
The new filter bank can be transformed as
The biorthogonal wavelet function (Blas2.4 wavelet), which matches the structural characteristics of blasting vibration signals, can be achieved by iterative operation.
Algorithm and principles
Continuous wavelet transform
Wavelet transform is the development and extension of Fourier analysis. Continuous wavelet transform breaks through the limitation of Fourier transform base, which uses the translation and expansion of a function as the base to study the spectrum of the function (signals). For any square integrable function
where
This can be called a wavelet basis function. where a is the scale parameter (dilation factor), b is the translation factor, with a, b∈R, and a≠0.
Let
Which is a continuous wavelet transform on the basis wavelet
Formula of inverse continuous wavelet transform can be exhibited as
Continuous wavelet transform maps the original one-dimensional time-domain function to the two-dimensional “time-scale” domain to analyze the time-frequency characteristics of the signal. Wavelets with different time-frequency widths can be obtained to match any position of the original signal by adjusting the expansion factor a and the translation factor b, to achieve the purpose of the signal’s time-frequency localization analysis.
Scale energy spectrum and time-scale energy spectrum of blasting vibration signals
The amplitude square of the continuous wavelet transform coefficient of blasting vibration signal f(x) with the scale parameter a and translation factor b is called time-scale energy spectrum, i.e.
The total energy of the signal f(x) in the time-scale domain is as follows
If the energy spectrum density on the time-scale two-dimensional plane is integrated with the translation factor b, the wavelet energy spectrum on the scale axis can be obtained
The integration of time-frequency energy spectrum of blasting vibration signal with the time factor is the scale energy spectrum, which reflects the energy distribution of blasting vibration signal on different scales. Since the scale factor corresponds to the frequency of the signal in a certain sense, the scale energy spectrum can be used to characterize and research the energy variation of blasting vibration signals in different frequency intervals.
Wavelet packet analysis
Wavelet packet analysis, which can divide the signal frequency band into multiple levels and further decompose the high-frequency components that are not subdivided in wavelet analysis, is a more refined signal processing method. In multiresolution analysis, for the scale subspace Vj and wavelet subspace Wj, there exists an orthogonal decomposition Vj+1=Vj+Wj. If a unified subspace
Define subspace
where the two coefficients gk and hk have an orthogonal relationship, that is,
A three-layer wavelet packet decomposition tree structure is shown in Figure 5.
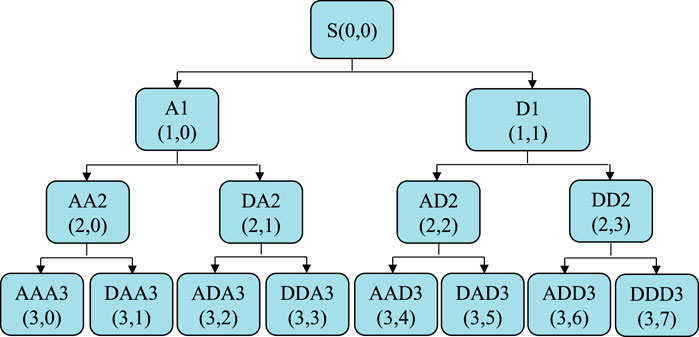
FIGURE 5. Tree structure of three-layer wavelet packet decomposition.
Assuming that the wavelet packet algorithm is used to decompose the blasting vibration signal in layer i, the original signal can be expressed as
where si,j represents the wavelet packet decomposition subsignal. The energy of the subsignal si,j can be expressed as
where fj,k represents the amplitude of the discrete points of the reconstructed subsignal si,j (
Then the total energy of blasting vibration signal is
The percentage of energy in each frequency band to the total energy of blasting vibration signal can be expressed as
Analysis process of time-frequency characteristics of blasting vibration signals
The continuous wavelet transform and wavelet packet methods are proposed to analyze the blasting vibration signals from the perspective of time-frequency and energy refinement characteristics. First, select and determine the optimal basis wavelet used in the continuous wavelet transform and wavelet packet decomposition according to the reconstruction error of Db orthogonal wavelets, Bior series biorthogonal wavelet and blas2.4 new wavelet on the measured blasting vibration signals, and calculate the center frequency of the optimal wavelet basis. Second, the scale energy spectrum and wavelet packet energy spectrum of the original vibration signals at different excavation positions are analyzed, and moreover, the possible safety impact of blasting is explored in combination with the actual situation of buildings around the tunnel excavation site. The analysis flow is shown in Figure 6.
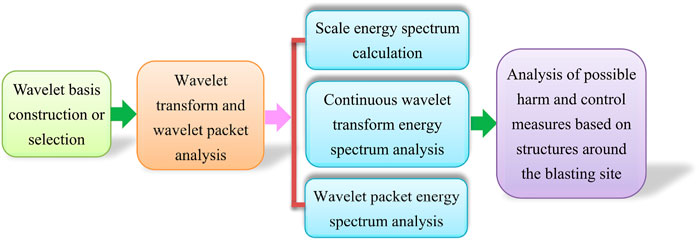
FIGURE 6. Flow chart of time-frequency characteristic analysis of blasting vibration signals.
Spectrum analysis of blasting vibration signals
To analyze the propagation law of blasting vibration signals and the impact of blasting vibration on buildings around the city, especially the power tower, a blasting vibration meter is fixed at the power tower to test and record the blasting vibration signals under the tunnel construction at different positions. A total of four complete blasting vibration signals monitored were extracted for analysis, and the signal numbers were YBJ1, YBJ2, YBF3, and YBF4, respectively. Signals of YBJ1, YBJ2 are the seismic signals monitored by the blasting excavation of the tunnel close to the power tower, the corresponding tunnel excavation mileages are EK0+060 and EK0+100, and the plane distances from the blasting site to the power tower are approximately 32m and 72 m respectively; the tunnel excavation mileages corresponding the signals of YBF3, YBF4 are EK1+450 and EK1+570, the distances from the power tower are approximately 1,350 and 1480 m respectively. The tunnel excavation position corresponding to YBJ1 signal is closest to the power tower. The millisecond blasting technology is used for tunnel excavation. The four blasting charges were all 72 kg. The waveforms of the original blasting vibration signals are illustrated in Figure 7 and the power spectrum calculation results are shown in Figure 8 based on the fast Fourier transform theory.
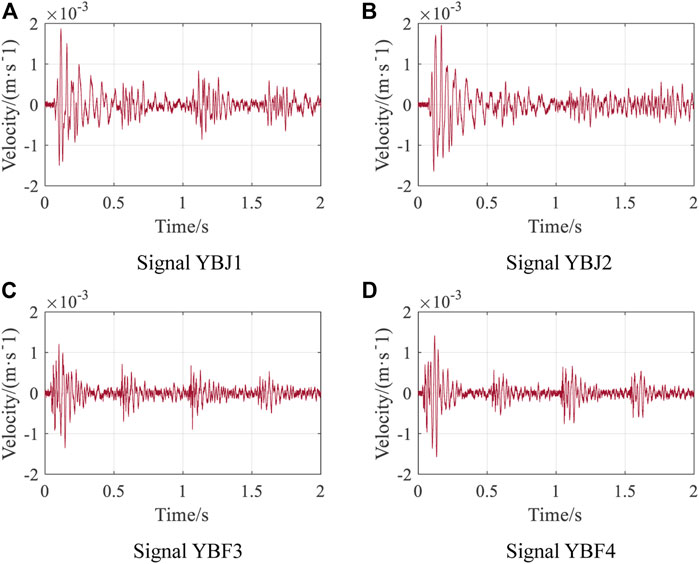
FIGURE 7. Waveforms of original blasting vibration signals generated by different excavation positions of the tunnel.
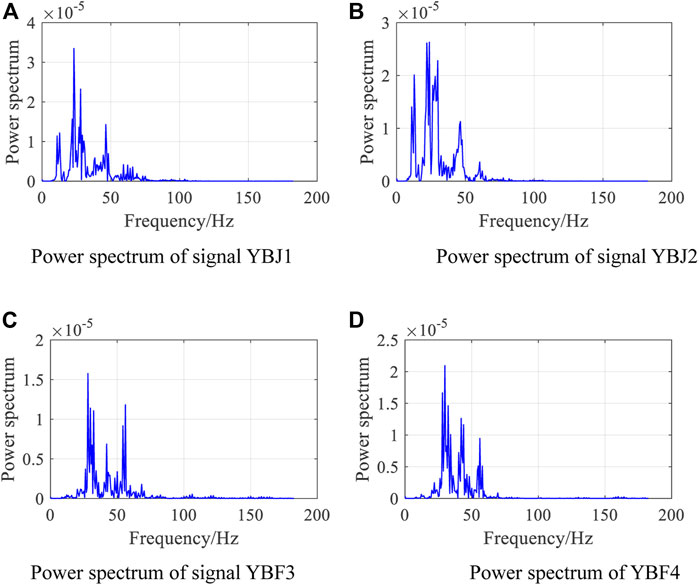
FIGURE 8. Spectrum analysis of different original blasting vibration signals.
From the power spectrum, the frequency range of each signal is below 200Hz, and the spectrum distribution is relatively dispersed, showing multiple local peaks of the spectrum. The dominating vibration frequency of blasting vibration signals can be determined from the figures, which are 23.19 Hz, 23.80 Hz, 28.08 Hz, and 29.91 Hz, respectively. Among them, the subdominant frequencies of YBJ2 and YBF3 signals are also prominent. The subdominant frequency of YBJ2 signal is 21.97 Hz, and that of YBF3 signal is 56.15 Hz. The dominant frequency of YBJ1 and YBJ2 signals generated by blasting excavation near the power tower is lower than that of YBF3 and YBF4 signals. The spectrum distribution of blasting vibration signal shows a sharp peak, and Fourier transform can only provide the result of signal spectrum distribution, but cannot provide the detailed information of signal time-frequency distribution and energy distribution.
Time-frequency characteristics analysis for blasting vibration signals
Selection of wavelet basis for blasting vibration signal analysis
Wavelet analysis is an applied mathematical method with fixed window size but variable shape (time window and frequency window are variable), which has multiresolution analysis characteristics and automatically adapts to the requirements of time-frequency signal and it is suitable for nonstationary signal processing of blasting vibration. The wavelet functions used in wavelet transform are nonuniqueness and diverse. An important task in wavelet analysis is to select the optimal wavelet basis according to the characteristics of the blasting vibration signal. Daubechies series wavelets have orthogonality and compact support and Bior series wavelets have symmetry and high vanishing distance (Dai and Cao, 2017; Zhao et al., 2018). They are commonly used to process the measured blasting vibration signals. The center frequency of Daubechies wavelet series, Bior biorthogonal wavelet series, and the constructed Blas2.4 wavelet and the reconstruction error of the measured blasting vibration signals have been calculated and analyzed respectively to select the best wavelet basis suitable for the analysis of blasting vibration signals. In Daubechies wavelet basis, the smoothness of Db1 and Db2 wavelets is too poor to be used for blasting vibration signal processing, Db5 and Db8 wavelets have a small center frequency, which are suitable for wavelet decomposition and reconstruction of blasting vibration signals, and Db5 wavelet has a lower signal reconstruction error as seen in Table 1, so the Db5 wavelet is selected in Daubechies series to analyze the blasting vibration signals. The newly constructed Blas2.4 wavelet among the biorthogonal wavelets has the highest reconstruction accuracy and smaller central frequency value. Therefore, Blas2.4 wavelet and db5 wavelet are preliminarily selected to analyze the measured blasting vibration signals.
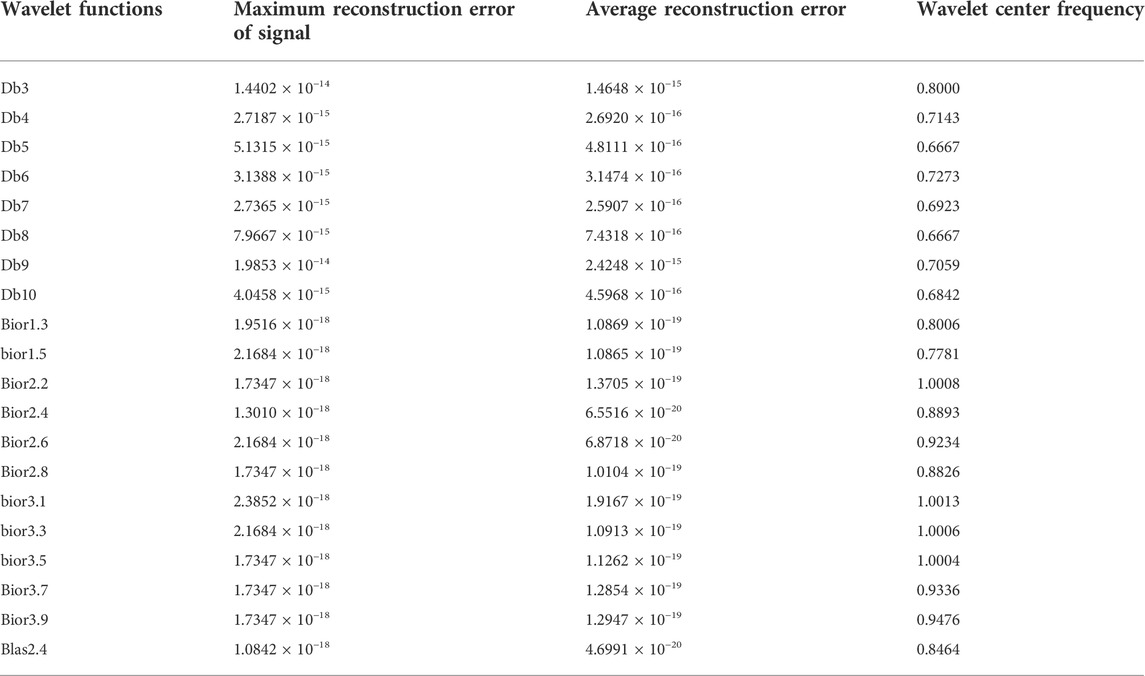
TABLE 1. Signal reconstruction error and center frequency of different wavelet basis.
Scale energy spectrum of blasting vibration signals
Scale is a parameter applied to represent the expansion of the basic wavelet and it corresponds to the frequency of the signal in the time-frequency analysis. The scale energy spectrum characterizes the energy of the signal on different scales. By calculating the center frequency of the wavelet function and converting the scale parameters to the actual frequency, the scale energy spectrum can be applied to measure and master the frequency variation law of the blasting vibration signals from the perspective of wavelet transform. Based on Eqs. 6, 8, 10, the obtained signal scale energy spectrum is shown in Figure 9 by taking the constructed Blas2.4 as the basic wavelet.
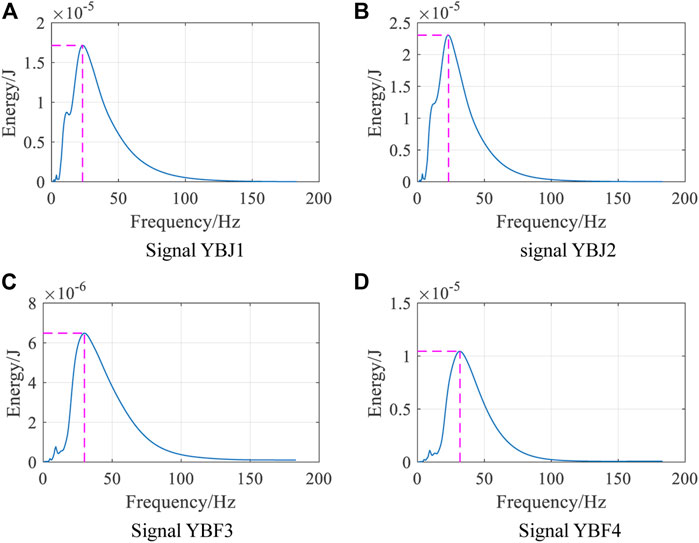
FIGURE 9. Scale energy spectrum of blasting vibration signals based on Blas2.4 wavelet.
The signal spectrogram obtained by the Fourier method is in the shapes of local spike. When the dominant frequency is almost the same as the subdominant frequency value, it is difficult to judge the dominant frequency of the signal directly from the spectrogram. The scale factor in the scale energy spectrum corresponds to the actual frequency of the signal through the length of the scale sequence and the center frequency of the wavelet function used. Different from the sawtooth waveform of the Fourier operation, the scale energy spectrum has smoothness and transition and can reflect the frequency variation of the blasting vibration signals concretely and continuously. Since the basis function used in the scale energy spectrum is compatible with the waveform change of the specific engineering signal, the dominant frequency of the signal can be accurately extracted and obtained. It can be seen from the above figures that the frequencies corresponding to the maximum energy of the four blasting signals YBJ1, YBJ2, YBF3, and YBF4 are 23.19 Hz, 23.80 Hz, 29.91 Hz, and 31.74 Hz respectively, which are basically consistent with the dominant vibration frequencies (23.19 Hz, 23.8 Hz, 28.08 Hz, and 29.91 Hz) obtained by Fourier spectrum. The sum of the relative error between the signal dominant frequency calculated by Blas2.4 wavelet and the Fourier spectrum results is only 11.89%, by accurate calculation, it can be seen that the scale energy spectrum can accurately represent the signal dominant frequency. And compared with the Fourier spectrum, the shape of the scale energy spectrum distribution curve is smoother, which can better reflect the spectrum change law and the trend of blasting vibration signal.
Taking the Db5 orthogonal wavelet, which is commonly used to analyze blasting vibration signals, as the basic wavelet, the calculated scale energy spectra of the blasting vibration signals are showed in Figure 10.
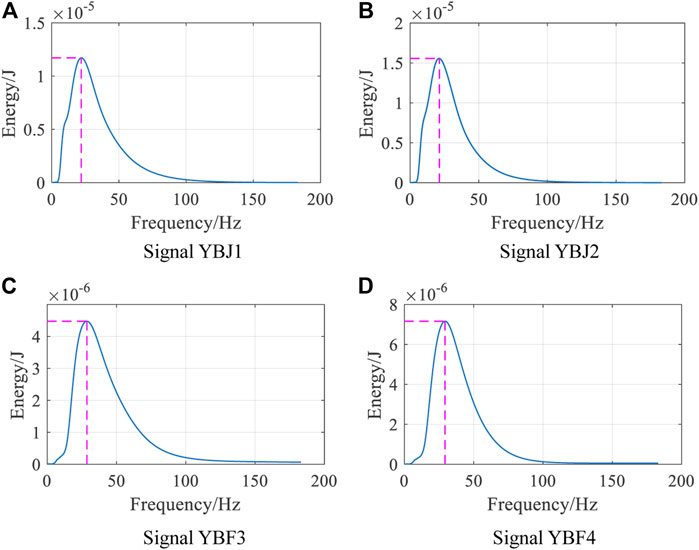
FIGURE 10. Scale energy spectrum of blasting vibration signals based on Db5 general wavelet.
From the figure that the scale energy spectrum method based on db5 general wavelet can also obtain the dominant frequency of the signal, and the obtained scale energy spectrum curve is relatively smooth. The dominant frequency is 21.97 Hz, 21.36 Hz, 28.69 Hz, and 29.29 Hz, respectively, and the total relative error is 19.75% compared with the frequency values of Fourier spectrum. The calculated results show a large inconsistency with the Fourier spectrum relative to the frequency results of Blas2.4 new wavelet. And the scale energy spectrum curves of the blasting vibration signals acquired by db5 general wavelet are basically the same in shape, which cannot reflect the difference of signal spectrum distribution. That is, due to the lack of matching with the blasting vibration signals, the traditional general wavelet cannot accurately analyze and characterize the measured blasting vibration signals, nor can distinguish the difference between the signals, and the spectral calculation results are relatively low accuracy.
Continuous wavelet transform energy spectrum and wavelet packet energy analysis
According to the principles of Eqs. 6, 8, the continuous wavelet transform energy spectrum, which represents the change law of blasting vibration signal energy with time and frequency of signal can be calculated. The essence of wavelet transform is to represent any function f(t) in
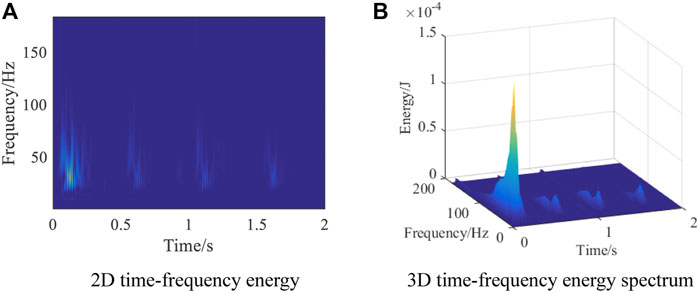
FIGURE 11. Time frequency energy diagram of continuous wavelet transform for blasting vibration signal.
The wavelet packet theory is applied to analyze the energy refinement characteristics of blasting vibration and to explore the energy ratio of each frequency band in the signal. According to Shannon’s sampling theorem, the sampling frequency of the signal is fs=5,000 Hz, so the Nyquist analysis frequency is fs/2=2,500 Hz, the signal can be decomposed into 10 layers, with a total of 210=1,024 wavelet packets, so the original blasting vibration signal in the frequency domain can be divided into 1,024 frequency bands, each sub-band width is 2.44 Hz, the minimum sub-band range is 0∼2.44 Hz. In wavelet packet decomposition, the new constructed Blas2.4 wavelet is used as the wavelet basis, and the calculation program is compiled according to the formulas. The energy percentage of the reconstructed subsignals in each frequency band is shown in Table 2, and the energy percentage distribution of each frequency band is illustrated in Figure 12. Since the blasting vibration signal frequency is mainly in the range of 0∼70 Hz, the energy distribution of the first 70 Hz sub-band signals is mainly calculated and analyzed.
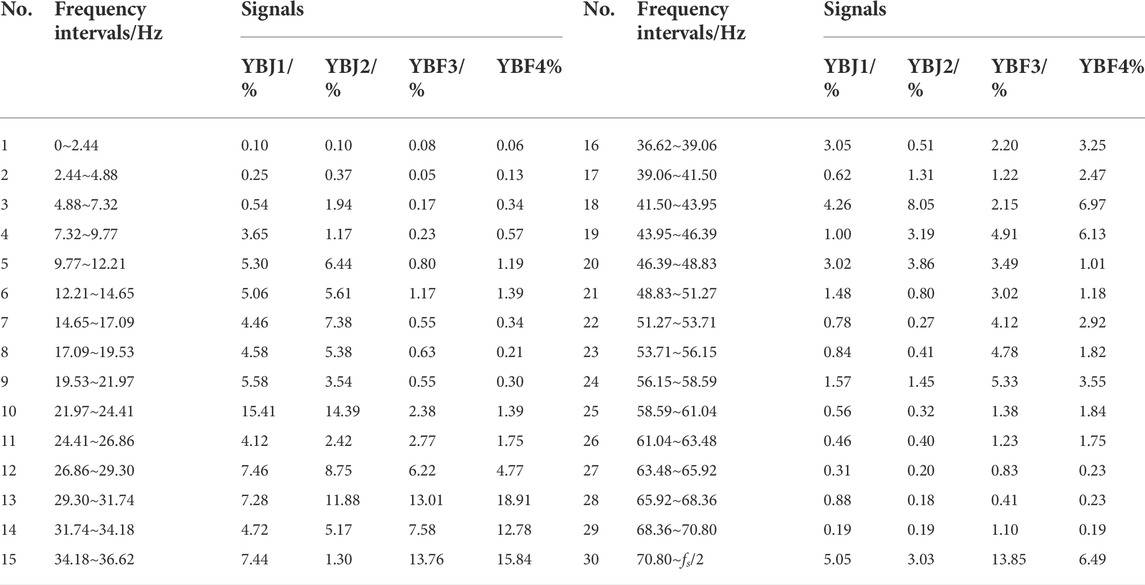
TABLE 2. Percentage of energy distribution in different frequency bands.
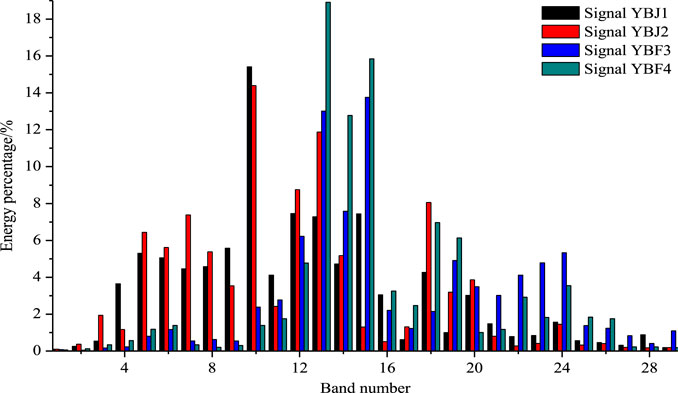
FIGURE 12. The percentage of energy distribution in each frequency band of blasting vibration signals.
Table 2 shows that the dominant frequencies of YBJ1 and YBJ2 are concentrated in frequency band 10, and the corresponding frequency range is 21.97∼24.41 Hz, while the dominant frequencies of YBF3 and YBF4 signals far from the power tower are located in frequency bands 15 and 13, respectively, and the corresponding frequency ranges are 34.18∼36.62 Hz and 29.30∼31.74 Hz. From the Figure that before the frequency band 11 (24.41∼26.86 Hz ), the energy proportion of signals YBJ1 and YBJ2 is much larger than that of YBF3 and YBF4. The closer to the power tower, the lower the main vibration frequency of the blasting vibration signal, and the farther away from the power tower, the higher the main vibration frequency of the signal. The energy proportion of each signal in the low frequency band (0∼12.21 Hz) is 9.84%, 10.01%, 1.33%, and 2.30%, respectively, the energy proportion in the medium frequency band (12.21∼51.27 Hz) is 79.51%, 83.54%, 65.63% and 78.69% respectively, and the energy proportion in the high frequency band (51.27∼2500 Hz) is 10.65%, 6.45%, 33.04% and 19.01% respectively. Since the natural vibration frequency of engineering structures is generally low (about 0∼10Hz), the YBJ1 and YBJ2 signals generated by excavation near the power tower contain more low-frequency signals. Therefore, from the perspective of dynamic response analysis, it should take note of the resonance effect of tunnel blasting on the power tower when the excavation is close to that.
Conclusion
Analyzing and acquiring the time-frequency characteristics and energy distribution law of blasting vibration signal are of great importance in judging the harm caused by blasting vibration, formulating preventive and control measures, and ensuring the safety of blasting construction. On the basis of the constructed high-performance blas2.4 biorthogonal wavelet, the spectrum distribution and energy characteristics of the measured blasting vibration signals are deeply explored and compared from the aspects of continuous wavelet and wavelet packet transform, and the impact of blasting vibration on the buildings around the city, especially the power tower, is analyzed. The main conclusions are drawn as follows:
(1) An biorthogonal wavelet basis (namely Blas2.4 wavelet) with high vanishing moment, high regularity and matching with the waveform characteristics of the measured blasting vibration signals by using the improved second-generation lifting scheme wavelet theory and optimization algorithm were constructed. The wavelet basis has excellent tight support, smoothness and symmetry, and has high precision in the decomposition and reconstruction of blasting vibration signals, which can provide a solid theoretical basis for the subsequent continuous wavelet transform and wavelet packet analysis of blasting vibration signals.
(2) The method of scale energy spectrum was creatively proposed to study the spectrum characteristics of measured blasting vibration signals on the basis of wavelet analysis. The dominant frequency of the blasting vibration signals can be obtained by the scale energy spectrum method, and the obtained spectrum curve is smoother, which can clearly reflect the change trend of the signal spectrum.
(3) The energy distribution of blasting vibration signals in the two-dimensional “time-scale” domain can be obtained by using the continuous wavelet transform method, and the frequency duration interval and the main time range of blasting vibration signal can be acquired, also the occurrence time corresponding to the frequency can be determined. The energy refinement characteristics of the blasting vibration signals were calculated by using wavelet packet theory. The blasting vibration signal generated by tunnel excavation near the power tower has more low-frequency components, while the signal far away from the power tower contains more medium and high-frequency components.
(4) The measures such as pre-splitting blasting, controlling one-time excavation footage of the tunnel, limiting the amount of primary explosive, uncoupled charging and interval charging are suggested to optimize the blasting design and reduce the impact of blasting vibration on nearby electric power steel tower. The next step is to study the active control of blasting vibration to achieve the ideal vibration reduction effect. By changing the millisecond delay time, controlling the maximum charge per delay and the total charge, explore the relationship between the millisecond delay time, charge amount and the peak velocity, dominant frequency of the blasting vibration signals.
Data availability statement
The original contributions presented in the study are included in the article/supplementary material, further inquiries can be directed to the corresponding author.
Author contributions
Conceptualization, LZ; methodology, LZ and SZ; software, LZ and SZ.; validation, LZ and TL; formal analysis, SZ and ZD; investigation, LZ; resources, SZ, LZ, and TL; data curation, LZ and ZD; writing—original draft preparation, LZ and SZ; writing—review and editing, LZ and SZ; visualization, LZ; supervision, TL; project administration, LZ, SZ, and TL; funding acquisition, LZ, SZ, and TL. All authors have read and agreed to the published version of the manuscript.
Funding
The research described in this paper was financially supported by the National Natural Science Foundation of China (Nos. 51878074 and 52078061), the Natural Science Foundation of Hunan Province in China (Nos. 2018JJ3022 and 2020JJ5588) and the Outstanding Youth Project of Hunan Provincial Department of Education (21B0725).
Conflict of interest
The authors declare that the research was conducted in the absence of any commercial or financial relationships that could be construed as a potential conflict of interest.
Publisher’s note
All claims expressed in this article are solely those of the authors and do not necessarily represent those of their affiliated organizations, or those of the publisher, the editors and the reviewers. Any product that may be evaluated in this article, or claim that may be made by its manufacturer, is not guaranteed or endorsed by the publisher.
Reference
Babouri, M. K., Ouelaa, N., Kebabsa, T., and Djebala, A. (2021). Diagnosis of mechanical defects using a hybrid method based on complete ensemble empirical mode decomposition with adaptive noise (CEEMDAN) and optimized wavelet multi-resolution analysis (OWMRA): Experimental study. Int. J. Adv. Manuf. Technol. 112, 2657–2681. doi:10.1007/s00170-020-06496-z
Chen, H., Qiu, X., Shi, X., Zhang, J., Huo, X., and Li, D. (2022). Experimental study on fracturing characteristics of double-hole blasting under static stresses. Front. Earth Sci. 9, 829258. doi:10.3389/feart.2021.829258
Dai, H., and Cao, Z. (2017). A wavelet support vector machine-based neural network metamodel for structural reliability assessment. Computer-Aided Civ. Infrastructure Eng. 32 (4), 344–357. doi:10.1111/mice.12257
Daubechies, I., and Sweldens, W. (1998). Factoring wavelet transforms into lifting steps. J. Fourier Anal. Appl. 4 (3), 247–269. doi:10.1007/BF02476026
Graf, R., Zhu, S., and Sivakumar, B. (2019). Forecasting river water temperature time series using a wavelet–neural network hybrid modelling approach. J. Hydrol. X. 578 (11), 124115. doi:10.1016/j.jhydrol.2019.124115
Hafiz, F., Swain, A., Naik, C., Abecrombie, S., and Eaton, A. (2018). Identification of power quality events: Selection of optimum base wavelet and machine learning algorithm. IET Sci. Meas. &. Technol. 13 (2), 260–271. doi:10.1049/iet-smt.2018.5044
Hamid, M., Usman, M., Haq, R. U., Khan, Z. H., and Wang, W. (2019). Wavelet analysis of stagnation point flow of non-Newtonian nanofluid. Appl. Math. Mech. 40 (8), 1211–1226. doi:10.1007/s10483-019-2508-6
Jing, F., Zhang, C., Si, W., Wang, Y., and Jiao, S. (2018). Polynomial phase estimation based on adaptive short-time fourier transform. Sensors 18 (2), 568. doi:10.3390/s18020568
Kan, J., Dou, L., Li, J., Li, X., Bai, J., and Wang, M. (2022). Characteristics of microseismic waveforms induced by underground destress blasting: Comparison with those induced by ground blasting and coal mining. Front. Earth Sci. 10, 797358. doi:10.3389/feart.2022.797358
Khodja, M. E. A., Aimer, A. F., Boudinar, A. H., Benouzza, N., and Bendiabdellah, A. (2019). Bearing fault diagnosis of a PWM inverter fed-induction motor using an improved short time Fourier transform. J. Electr. Eng. Technol. 14 (3), 1201–1210. doi:10.1007/s42835-019-00096-y
Koopialipoor, M., Armaghani, D. J., Haghighi, M., and Ghaleini, E. N. (2019). A neuro-genetic predictive model to approximate overbreak induced by drilling and blasting operation in tunnels. Bull. Eng. Geol. Environ. 78 (2), 981–990. doi:10.1007/s10064-017-1116-2
Kulak, Ö., and Aydin, İ. (2020). Inverse continuous wavelet transform in weighted variable exponent amalgam spaces. Commun. Fac. Sci. Univ. 69 (2), 177–189. doi:10.31801/cfsuasmas.710208
Lee, W. K., Ratnam, M. M., and Ahmad, Z. A. (2017). Detection of chipping in ceramic cutting inserts from workpiece profile during turning using fast Fourier transform (FFT) and continuous wavelet transform (CWT). Precis. Eng. 47, 406–423. doi:10.1016/j.precisioneng.2016.09.014
Li, H., Wang, Q., and Wu, L. (2001). A novel design of lifting scheme from general wavelet. IEEE Trans. Signal Process. 49 (8), 1714–1717. doi:10.1109/78.934141
Li, S., Zhang, Y., Cao, M., and Wang, Z. (2022). Study on excavation sequence of pilot tunnels for a rectangular tunnel using numerical simulation and field monitoring method. Rock Mech. Rock Eng. 55, 3507–3523. doi:10.1007/s00603-022-02814-x
Ling, T., Zhang, L., Liu, H., Huang, F., Gu, D., and Yu, B. (2019). Quantitative identification and analysis of tunnel lining defect based on the wavelet lifting scheme theory. China J. Highw. Transp. 32 (12), 197–204. doi:10.19721/j.cnki.1001-7372.2019.12.020
Ma, L., Lin, F., Liu, R., Liu, P., Xia, G., and Chen, L. (2022). Disturbance and control of national strategic gas storage induced by adjacent tunnel blasting. Front. Earth Sci. 9, 807073. doi:10.3389/feart.2021.807073
Mehboob, S., Khan, Q. U. Z., Ahmad, S., and Anwar, S. M. (2022). Health assessment of RC building subjected to ambient excitation: Strategy and application. Earthq. Struct. 22 (2), 185–201. doi:10.12989/eas.2022.22.2.185
Quaye-Ballard, J. A., Okrah, T. M., Andam-Akorful, S. A., Awotwi, A., Osei-Wusu, W., Antwi, T., et al. (2020). Assessment of vegetation dynamics in Upper East Region of Ghana based on wavelet multi-resolution analysis. Model. Earth Syst. Environ. 6 (3), 1783–1793. doi:10.1007/s40808-020-00789-8
Rhif, M., Ben Abbes, A., Farah, I. R., Martínez, B., and Sang, Y. (2019). Wavelet transform application for/in non-stationary time-series analysis: A review. Appl. Sci. (Basel). 9 (7), 1345. doi:10.3390/app9071345
Robustelli, U., and Pugliano, G. (2018). GNSS code multipath short‐time fourier transform analysis. J. Inst. Navig. 65 (3), 353–362. doi:10.1002/navi.247
Shah, F. A., and Tantary, A. Y. (2018). Polar wavelet transform and the associated uncertainty principles. Int. J. Theor. Phys. 57 (6), 1774–1786. doi:10.1007/s10773-018-3703-9
Shahryari, H., Karami, M. R., and Chiniforush, A. A. (2019). Summarized IDA curves by the wavelet transform and bees optimization algorithm. Earthq. Struct. 16 (2), 165–175. doi:10.12989/eas.2019.16.2.165
Sharafat, A., Khan, M. S., Latif, K., and Seo, J. (2021). BIM-based tunnel information modeling framework for visualization, management, and simulation of drill-and-blast tunneling projects. J. Comput. Civ. Eng. 35 (2), 04020068. doi:10.1061/(ASCE)CP.1943-5487.0000955
Singh, C. P., Agrawal, H., and Mishra, A. K. (2020). A study on influence of blast-induced ground vibration in dragline bench blasting using signature hole analysis. Arab. J. Geosci. 13 (13), 522–529. doi:10.1007/s12517-020-05562-w
Tian, L., Dong, X., Pan, H., and He, X. (2019). The critical angle of seismic incidence of transmission tower-line system based on wavelet energy method. Earthq. Struct. 17 (4), 387–398. doi:10.12989/eas.2019.17.4.387
Tomiyama, K., and Kawamura, A. (2016). Application of lifting wavelet transform for pavement surface monitoring by use of a mobile profilometer. Int. J. Pavement Res. Technol. 9 (5), 345–353. doi:10.1016/j.ijprt.2016.08.007
Tyrtaiou, M., and Elenas, A. (2020). Seismic damage potential described by intensity parameters based on Hilbert-Huang Transform analysis and fundamental frequency of structures. Earthq. Struct. 18 (4), 507–517. doi:10.12989/eas.2020.18.4.507
Wang, X., Li, J., Zhao, X., and Liang, Y. (2022). Propagation characteristics and prediction of blast-induced vibration on closely spaced rock tunnels. Tunn. Undergr. Space Technol. 123, 104416. doi:10.1016/j.tust.2022.104416
Wu, H., Zhao, G., and Ma, S. (2022). Failure behavior of horseshoe-shaped tunnel in hard rock under high stress: Phenomenon and mechanisms. Trans. Nonferrous Metals Soc. China 32 (2), 639–656. doi:10.1016/S1003-6326(22)65822-9
Zhang, L., Ling, T. H., Yu, B., Huang, F., and Zhang, S. (2021). Intensive interferences processing for GPR signal based on the wavelet transform and F-K filtering. J. Appl. Geophy. 186, 104273. doi:10.1016/j.jappgeo.2021.104273
Zhang, S., Zhang, L., He, W., Ling, T., Deng, Z., and Fu, G. (2022). Three-dimensional quantitative recognition of filler materials ahead of a tunnel face via time–energy density analysis of wavelet transforms. Minerals 12 (2), 234. doi:10.3390/min12020234
Zhang, S., Zhang, L., Ling, T., Fu, G., and Guo, Y. (2021). Experimental research on evaluation of soil water content using ground penetrating radar and wavelet packet-based energy analysis. Remote Sens. 13 (24), 5047. doi:10.3390/rs13245047
Keywords: blasting vibration, continuous wavelet transform, wavelet packet, spectrum distribution, energy refinement characteristics
Citation: Zhang L, Zhang S, Ling T and Deng Z (2022) Frequency spectrum and energy refinement characteristics of blasting vibration signals in raw water pipeline tunnel excavation. Front. Earth Sci. 10:966222. doi: 10.3389/feart.2022.966222
Received: 10 June 2022; Accepted: 06 July 2022;
Published: 22 August 2022.
Edited by:
Fengqiang Gong, Southeast University, ChinaReviewed by:
Quan Jiang, Institute of Rock and Soil Mechanics (CAS), ChinaAnnan Jiang, Dalian Maritime University, China
Chang'An Qin, Beijing University of Civil Engineering and Architecture, China
Copyright © 2022 Zhang, Zhang, Ling and Deng. This is an open-access article distributed under the terms of the Creative Commons Attribution License (CC BY). The use, distribution or reproduction in other forums is permitted, provided the original author(s) and the copyright owner(s) are credited and that the original publication in this journal is cited, in accordance with accepted academic practice. No use, distribution or reproduction is permitted which does not comply with these terms.
*Correspondence: Liang Zhang, emhhbmdsaWFuZ0BobmN1LmVkdS5jbg==