 Sen Zhang
 Qigang Jiang1*
 Xitong Xu
- 1College of Geo-exploration Science and Technology, Jilin University, Changchun, China
As a supplement to empirical-statistical methods, physically based methods can be employed to define rainfall thresholds for triggering landslides in areas lacking records of landslides. The transient rainfall infiltration and grid-based regional slope-stability model (TRIGRS), as a physically based model, has been applied to define rainfall thresholds at the basin, slope unit, and grid cell scales. However, as far as we know to date, the influence of soil mechanical and hydraulic parameters on defining rainfall thresholds at various scales has not been comprehensively evaluated. In this study, TRIGRS was used to define rainfall intensity (I) and duration (D) thresholds at various scales for Buzhe village, Pu’an county, Guizhou province, China, under the conditions of different soil physical parameters. The results show that the number of rainfall thresholds decreased with cohesion (
Introduction
Rainfall-induced shallow landslides mainly occur on slopes covered by a layer of colluvium or residual soil (Salciarini et al., 2006; Montrasio and Valentino, 2007; Montrasio and Valentino, 2008). Rainfall infiltration in slopes increases the pore-water pressure and decreases the shear strength, thereby triggering landslides (Lim et al., 1996; Vanapalli et al., 1996). Thus, rainfall is recognized as the primary trigger of shallow landslides (Campbell, 1975; Keefer et al., 1987; Wilson, 2005), and rainfall thresholds are the most used tools to forecast landslides (Caine, 1980; Aleotti, 2004; Guzzetti et al., 2007; Guzzetti et al., 2008; Li et al., 2017; He et al., 2020). Guizhou province is located in the mountainous area of southwest China. As one of the landslide-prone provinces in China, shallow landslides frequently occur in Guizhou province (Yu et al., 2016; Zhang et al., 2017; Lin and Wang, 2018; Ma et al., 2020). However, only few defined rainfall thresholds or landslide early warning systems (LEWSs) exist in this area to address the risk of shallow landslides.
Empirical-statistical and physically based methods can be used to define rainfall thresholds (Aleotti, 2004; Guzzetti et al., 2007; Park et al., 2019). Empirical-statistical rainfall methods define rainfall thresholds through the statistical analysis of rainfall conditions that have triggered landslides (Brunetti et al., 2010; Peruccacci et al., 2012; Melillo et al., 2018). Currently, empirical-statistical rainfall thresholds have become the most common landslide model (i.e., the functional relationship between weather conditions and landslide events) in LEWSs (Calvello, 2017; Piciullo et al., 2018; Guzzetti et al., 2020). However, empirical-statistical methods mainly rely on the availability and quality of landslide records (Peres and Cancelliere, 2014). They are severely limited for the areas with incomplete or unavailable landslide records. In this case, physically based methods are the ideal alternative.
Physically based methods define rainfall thresholds by simulating the hydrological process of soil and slope stability during rainfall infiltration (Salciarini et al., 2008; Salciarini et al., 2012). TRIGRS is a physically based model for shallow landslide prediction (Baum et al., 2002; Baum et al., 2008; Baum et al., 2010; Alvioli and Baum, 2016). Thus, TRIGRS is widely used in modeling the timing and distribution of shallow landslides (Vieira et al., 2010; Lee et al., 2017; Tran et al., 2018; He et al., 2021; Ip et al., 2021) and landslide susceptibility mapping (Baum et al., 2005; Park et al., 2013; Marin and Mattos, 2020). In addition to these widespread applications, TRIGRS is applied in defining physically based rainfall thresholds given its ability to describe the scaling behavior of rainfall thresholds (Alvioli et al., 2014).
The Sendai Framework for Disaster Risk Reduction proposes the goal of substantially increasing the availability and access to multi-hazard early warning systems and disaster risk information and assessments to people by 2030 (UNISDR, 2015). Guzzetti et al. (2020) proposed that LEWSs can be deployed and operated worldwide, and suggested increasing the rate of LEWS deployment for landslide-prone areas. In some landslide-prone areas of China, the quality of records of landslides is poor. Although this situation has improved in recent years, the time span and quality of existing landslide records are insufficient to support the definition of empirical-statistical rainfall thresholds. For these areas, physically based methods can extend the application scenarios of LEWS based on rainfall thresholds, which is important for LEWS deployment.
TRIGRS can be employed to define rainfall thresholds at three scales, namely, basin, slope unit, and grid cell scales. At the basin scale, the rainfall threshold is defined for the whole area. Rainfall conditions exceeding the defined rainfall threshold can trigger several landslides in the entire area. Alvioli et al. (2018) used TRIGRS to define the rainfall event-duration (E-D) threshold for Upper Tiber River Basin in Italy. Bordoni et al. (2019) used TRIGRS to define the E-D threshold for an area of Oltrepò Pavese in Italy. Marin and Velásquez (2020) used TRIGRS to define the I-D thresholds for the Envigado Basin of Colombia under the conditions of different soil hydraulic properties. Marin et al. (2020) used TRIGRS to define the I-D thresholds for 93 small basins in Colombian Andes and analyzed the effect of basin morphometric parameters on defined I-D thresholds. Marin et al. (2021) used TRIGRS to define the I-D thresholds for La Arenosa and La Liboriana Basins in Colombian Andes. At the slope unit scale, rainfall thresholds are defined for slope units with critical rainfall. Rainfall conditions exceeding the defined rainfall thresholds can trigger landslides in the corresponding slope units. Alvioli et al. (2014) used TRIGRS to define the I-D thresholds for several sub-basins of the Upper Tiber River Basin. Zhang et al. (2022) divided Dabang village, Pu’an County, Guizhou Province, China, into several slope units and used TRIGRS to define the I-D thresholds for the slope units with critical rainfall. At the grid cell scale, rainfall thresholds are defined for grid cells with critical rainfall. Rainfall conditions exceeding the defined rainfall thresholds can trigger landslides in the area of the corresponding grid cells. Marin (2020) used TRIGRS to define the I-D thresholds for grid cells with critical rainfall in the Envigado Basin. Marin et al. (2021) used TRIGRS to define the I-D thresholds for grid cells with critical rainfall of La Arenosa and La Liboriana Basins.
Detailed and accurate soil parameters (e.g., soil depth, soil mechanical, and hydraulic parameters) are required to properly apply TRIGRS. However, obtaining substantial information on distributed soil properties at a large scale is a challenge, especially regarding soil physical properties (i.e., mechanical and hydraulic parameters) (Gariano and Guzzetti, 2016; Zhang et al., 2018). Uncertainties in soil parameters are caused by complex geological conditions, spatial variability, and laboratory measurement (Catani et al., 2010; Ho et al., 2012; Corominas et al., 2014; Bicocchi et al., 2015), which make it impossible to eliminate all uncertainties. In terms of using TRIGRS to predict the spatiotemporal information of shallow landslides and landslide susceptibility mapping, the influence of soil mechanical and hydraulic parameters on the prediction and mapping results has been extensively explored (Salciarini et al., 2006; Montrasio et al., 2011; Bordoni et al., 2015; Gioia et al., 2016; He et al., 2016; Ciurleo et al., 2017; de Lima Neves Seefelder et al., 2017; Weidner et al., 2018; Ciurleo et al., 2019). Some probabilistic approaches have been adopted with TRIGRS to quantitatively account for soil parameter uncertainties (Raia et al., 2014; Salciarini et al., 2017). In these probabilistic approaches, the input parameters are considered random variables, and the output is the probability of failure.
However, few studies have explored the influence of soil mechanical and hydraulic parameters on the definition of rainfall thresholds based on TRIGRS. Only Marin and Velásquez (2020) explored the effect of soil hydraulic parameters on the position of rainfall thresholds defined at the basin scale. The performance of the rainfall threshold requires evaluation before applying it in LEWSs (Piciullo et al., 2017; Segoni et al., 2018). Exploring the influence of soil physical parameters on the rainfall thresholds defined by using TRIGRS can facilitate the evaluation of the physically based rainfall thresholds.
In this study, Buzhe village, Pu’an county, Guizhou province of China was taken as the study area. The soil mechanical and hydraulic parameters measured by field sampling were taken as standard values. In each TRIGRS simulation, a parameter was varied by the given proportion and the rest remained constant. Then, the I-D thresholds at various scales were defined under the conditions of given physical parameters. Finally, the influence of soil physical parameters on the number and position of rainfall thresholds was explored by comparing the simulated
Study area
Pu’an county, which is located in southwest Guizhou province of China (Figure 1), has tremendous undulating terrains, and the dissolution and erosion of landforms are staggered. Moreover, soft rocks such as siltstone and sandstone are widespread. These soft rocks are easily weathered into the eluvium and slope wash. As for rainfall, the average annual precipitation of Pu’an county is 1,443 mm. Owing to the complex geological setting and rainy environment, Pu’an county is one of the landslide-prone counties in Guizhou province.
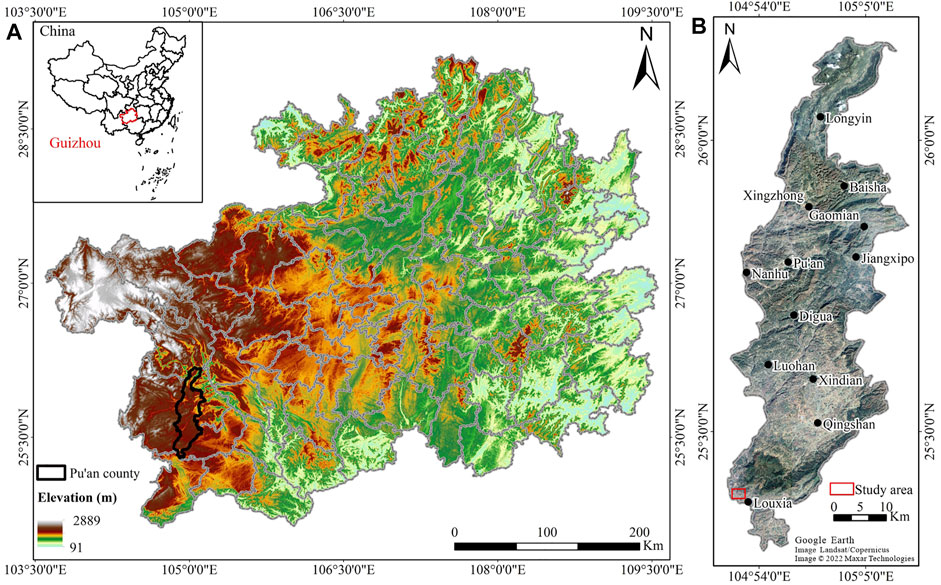
FIGURE 1. (A) Location of Pu’an county (image source: SRTM data) and (B) location of the study area.
Lower Triassic sandstone and clay rock, Upper Permian siltstone, sandstone, and clay rock, and Upper Permian limestone and siltstone are distributed in the study area (Figure 2A). The soil types in the study area are red loam and lime soil (Figure 2B). The distribution of each soil type is consistent with the corresponding soil parent material. Red loam is distributed on sandstone, siltstone, and clay rock. Lime soil is distributed on limestone.
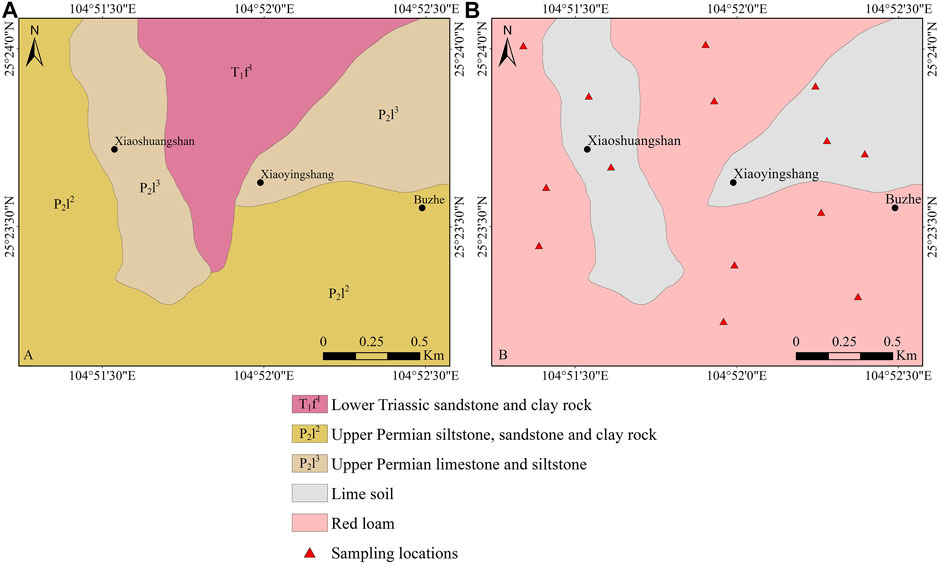
FIGURE 2. (A) Geology map of the study area and (B) spatial distribution of soil types.
Data
Digital elevation model
The input data for TRIGRS are topographic factors, soil parameters, soil thickness, and initial conditions for surface flux and groundwater table. As for topographic factors, the 10-m resolution DEM was taken as input. Other required input slopes and flow direction maps were generated using ArcGIS software based on the DEM data.
Soil parameters
The input soil mechanical parameters include
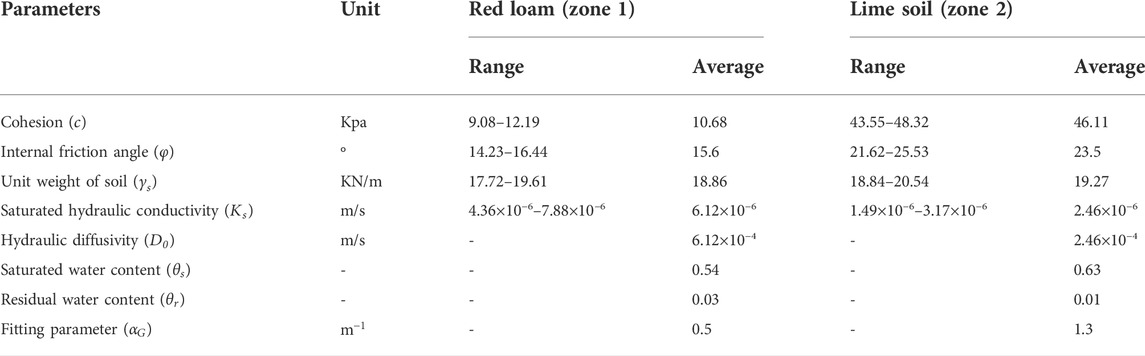
TABLE 1. The range and average of soil samples measurements in the study area.
Soil thickness significantly influences the simulation results of TRIGRS (Tran et al., 2018). Many studies have shown that the linear relation of slope angle and soil thickness to characterize the soil thickness map can obtain suitable simulation results of TRIGRS (Viet et al., 2017; Tran et al., 2018; He et al., 2021). The relationship assumes that soil thickness (
The input initial conditions include initial surface flux (
Methods
TRIGRS model
The TRIGRS model is designed for simulating the timing and distribution of shallow landslides by computing the transient pore-pressure changes and attendant changes in the factor of safety of slope caused by rainfall infiltration (Baum et al., 2002; Baum et al., 2008; Baum et al., 2010; Alvioli and Baum, 2016). Infiltration models include the models for saturated initial and unsaturated initial conditions. For saturated initial conditions, infiltration models in TRIGRS adopt Iverson’s linearized solution (Iverson, 2000) of the Richards equation (Richards, 1931). For unsaturated initial conditions, infiltration models in TRIGRS adopt the analytical solution of the Richards equation for unsaturated soil proposed by Srivastava and Yeh (1991) to approximate the infiltration process and the Gardner model to describe SWCC (Gardner, 1958). TRIGRS simulates the slope stability based on the infinite-slope model (Taylor, 1948). The slope stability is represented by
where
Definition of I-D thresholds at the basin scale
In this study, the method proposed by Marin and Velásquez (2020), Marin et al. (2020), and Marin et al. (2021) was used to define the I-D thresholds at the basin scale. This method proposed two ratios, namely, the critical failure area ratio (
Figure 3A shows the flowchart of the definition of I-D thresholds at the basin scale. TRIGRS was run with a set of I-D conditions to simulate. In the simulation, I was increased from 2 mm/h to 30 mm/h, with an increment step of 2 mm/h. D was increased from 2 to 60 h, ranging from 2 to 20 h with an increment step of 2 h and ranging from 20 to 60 h with an increment step of 4 h. For each I-D condition,
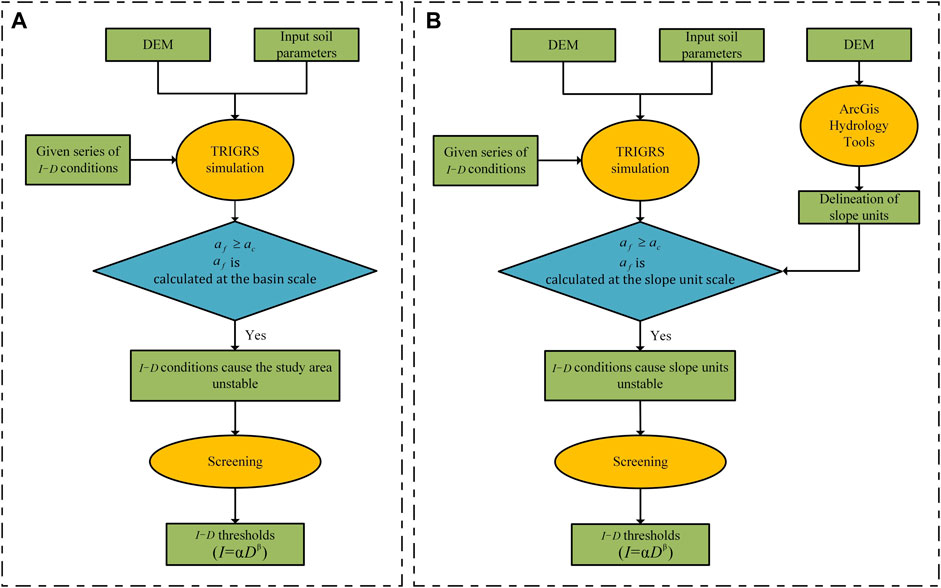
FIGURE 3. The flowchart of the definition of I-D thresholds based on TRIGRS (A) at the basin scale and (B) at the slope unit scale.
Before fitting, the I-D conditions that cause instability were screened to exclude the I-D conditions with the same I or D values (Zhang et al., 2022). Then, the screened I-D conditions were plotted in a log–log plot (log
where
Definition of I-D thresholds at the slope unit scale.
In this study, the method proposed by Zhang et al. (2022) was used to define I-D thresholds at the slope unit scale. The slope units were delineated based on ridge and valley lines obtained by using hydrology analysis tools in ArcGIS. (Xie et al., 2004; Wei et al., 2018).
The flowchart of the definition of I-D thresholds at the slope unit scale is shown in Figure 3B. The definition of rainfall thresholds at the slope unit scale involves defining rainfall thresholds for slope units with critical rainfall (i.e., under the given rainfall conditions, the slope units can reach instability). For each slope unit,
Definition of I-D thresholds at the grid cell scale.
In this study, the method proposed by Marin (2020) was used to define I-D thresholds at the grid cell scale. Defining rainfall thresholds at the grid cell scale involves defining rainfall thresholds for grid cells with critical rainfall, that is, under the given rainfall conditions, the grid cells can reach instability. At the grid cell scale, the rule for determining I-D conditions causing instability was
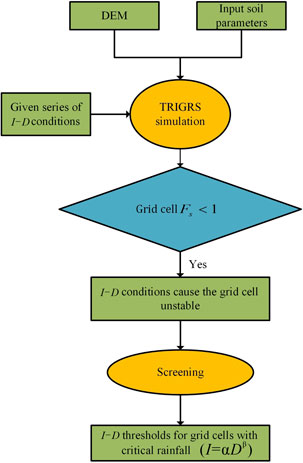
FIGURE 4. The flowchart of the definition of I-D thresholds based on TRIGRS at the grid cell scale.
Rainfall thresholds defined at any scale are not applicable to rainfall events of any rainfall duration. The defined rainfall thresholds are valid for a range of duration with initial and final durations. The initial duration is the duration that causes the whole study area or each slope unit unstable for the first time. The final duration is the maximum duration at which the increase in duration no longer affects the stability for the given range of intensities.
Results
Factor of safety maps
When I and D are at the maximum, that is,
Supplementary Video 1 (in the supplementary material) shows the distribution variation of grid cells with
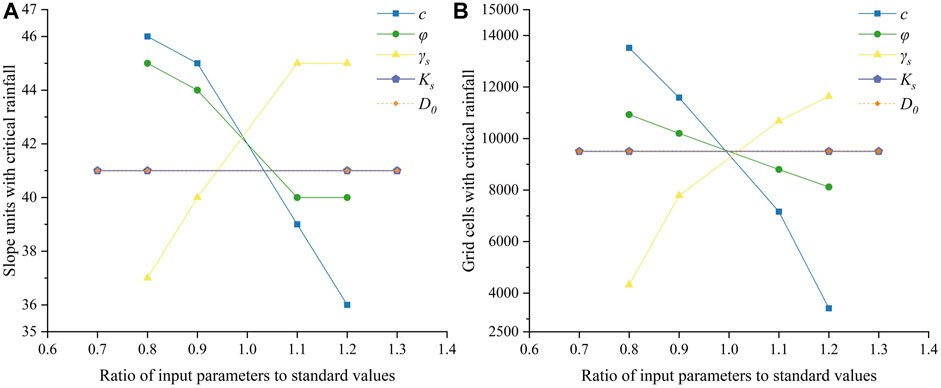
FIGURE 5. The number of objects with critical rainfall (A) slope units and (B) grid cells.
Supplementary Video 2 (in the supplementary material) shows the distribution variation of grid cells with
I-D thresholds at the basin scale
Supplementary Video 3 (in the supplementary material) show the variation of I-D thresholds defined at the basin scale when
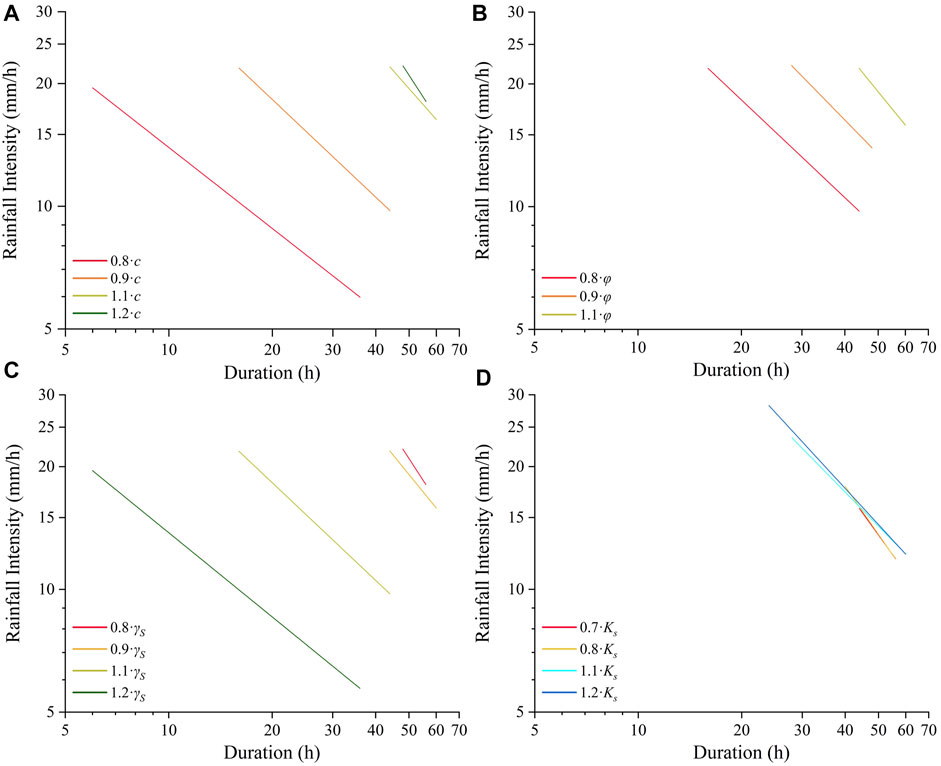
FIGURE 6. I-D thresholds defined at the basin scale under given soil mechanical and hydraulic parameters: (A)
Supplementary Video 4 (in the supplementary material) and Figure 7 show the variation of thresholds defined at the basin scale when
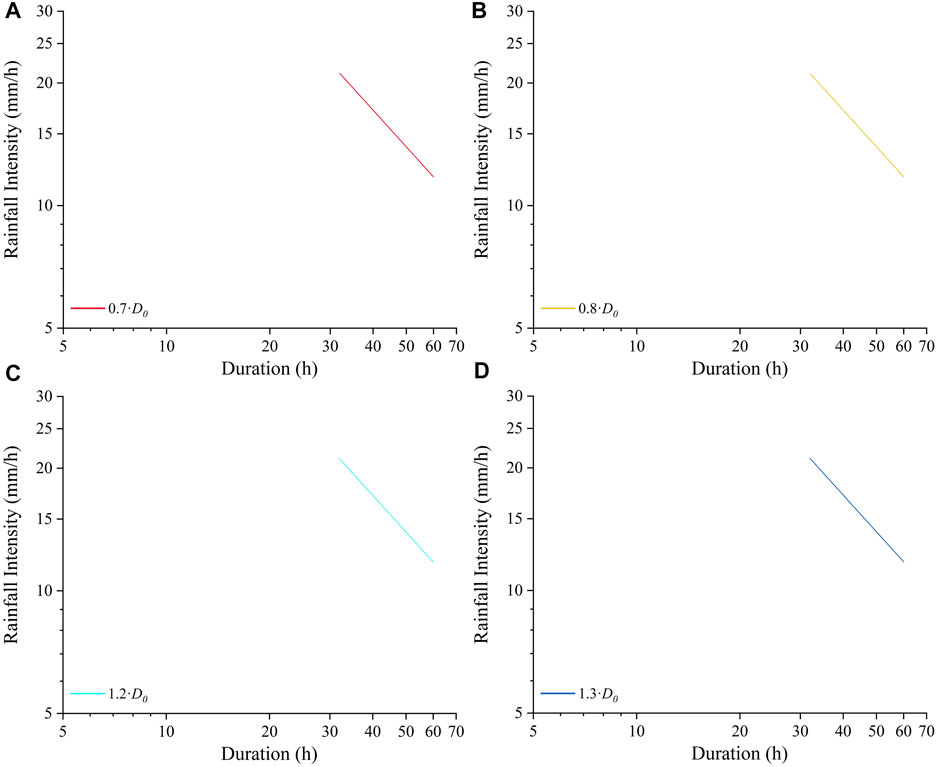
FIGURE 7. I-D thresholds defined at the basin scale under the conditions: (A) 0.8
I-D thresholds at the slope unit scale
Supplementary Video 5 (in the supplementary material) show the variation of I-D thresholds defined at the slope unit scale when
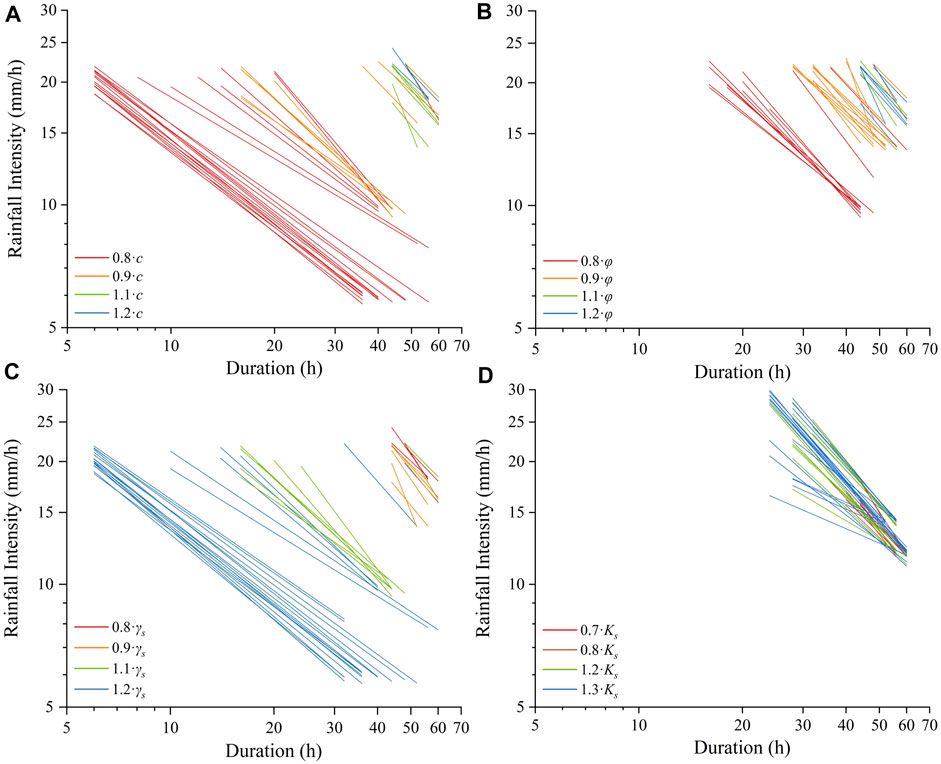
FIGURE 8. I-D thresholds defined at the slope unit scale under given soil mechanical and hydraulic parameters: (A)
Supplementary Video 6 (in the supplementary material) and Figure 9 show the variation of thresholds defined at the slope unit scale when
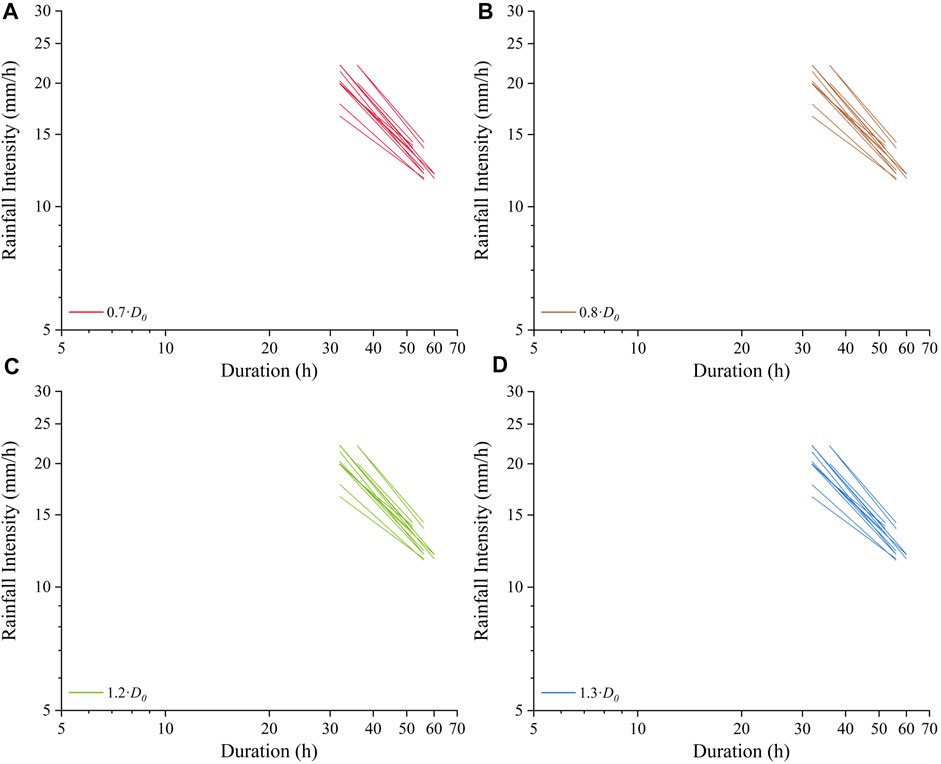
FIGURE 9. I-D thresholds defined at the slope unit scale under the conditions: (A) 0.8
I-D thresholds at the grid cell scale
A monitored unstable slope is located near a coal mine in the study area. A buffer zone was built with a radius of 50 m around the unstable slope (Figure 10). I-D thresholds were defined for the grid cells with critical rainfall in the buffer zone.
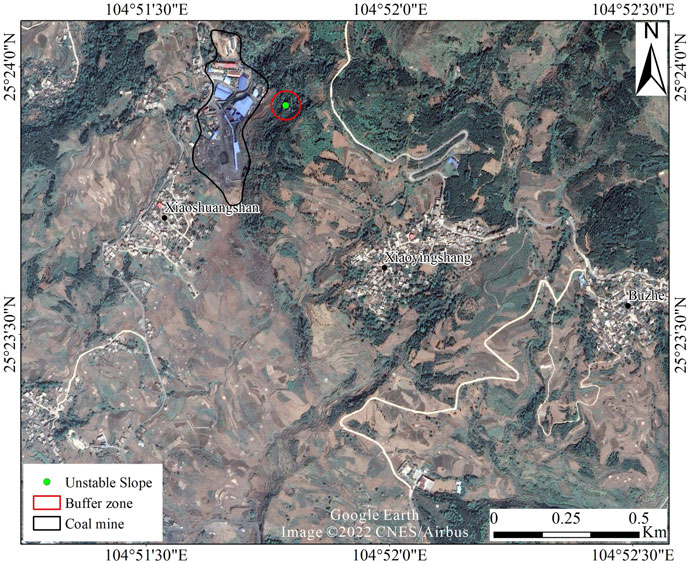
FIGURE 10. Location of the monitored unstable slope, coal mine, and built buffer zone.
Supplementary Video 7 (in the supplementary material) show the variation of I-D thresholds defined at the grid cell scale when
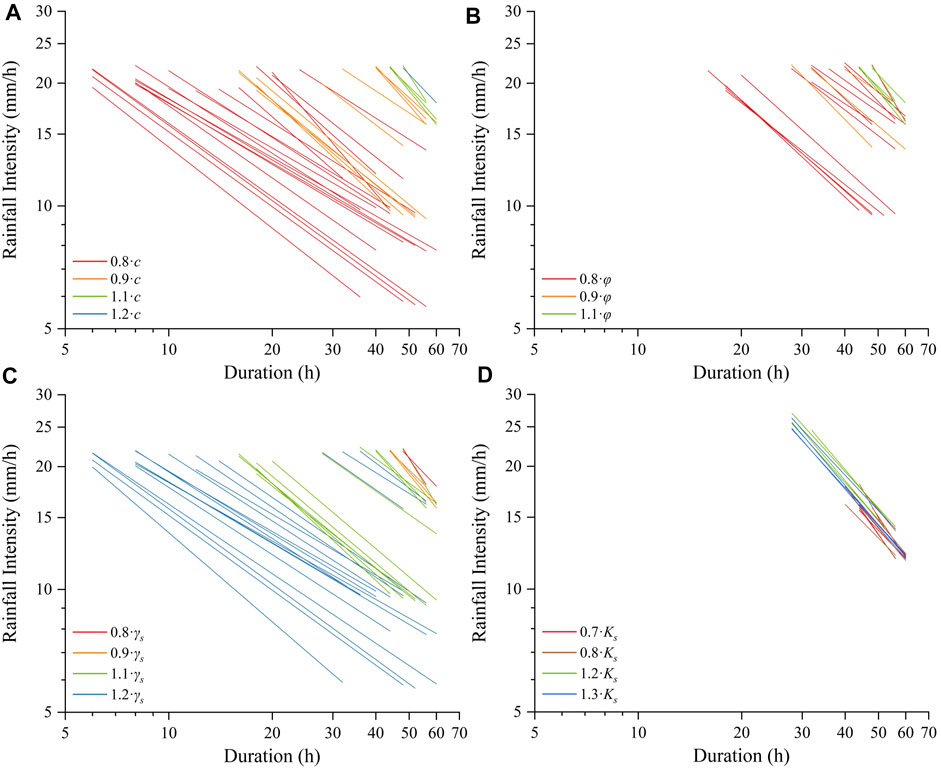
FIGURE 11. I-D thresholds defined at the grid cell scale under different soil mechanical and hydraulic parameters: (A)
Supplementary Video 8 (in the supplementary material) and Figure 12 show the variation of I-D thresholds defined at the grid cell scale when
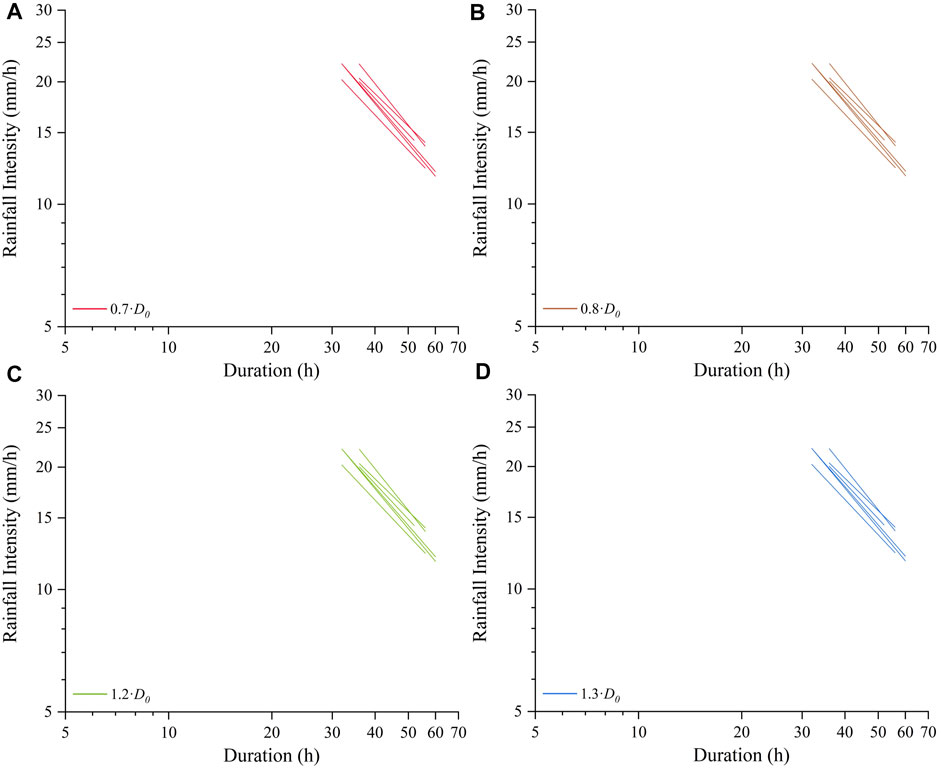
FIGURE 12. I-D thresholds defined at the grid cell scale under the conditions: (A) 0.8
Discussion
The methods of defining rainfall thresholds at different scales have their own characteristics. At the basin scale, given that the threshold is defined for the entire area, the process is the simplest. However, the defined threshold can only judge the occurrence of landslides and cannot provide detailed spatial information for landslide prediction. At the slope unit scale, given that the thresholds are defined for slope units with critical rainfall, the process is relatively complicated. The defined thresholds can provide spatial information specific to the range of slope units for prediction. At the grid cell scale, given that the thresholds are defined for grid cells with critical rainfall, the process is the most complicated. The defined thresholds can provide the most spatial information (i.e., specific to the range of grid cells) for prediction. When defining rainfall thresholds at the basin and slope unit scales, an additional condition is used to determine whether I-D conditions cause instability (
Soil physical parameters influence the number and position of rainfall thresholds defined at various scales. The number of rainfall thresholds is the number of objects warned by thresholds (i.e., the objects with critical rainfall). At the basin scale, the rainfall threshold was defined for the entire study area, and the entire study area had critical rainfall under the considered conditions in this study. At the slope unit and grid cell scales, the number of rainfall thresholds was positively correlated with
For threshold position, the position of thresholds varied positively with
TRIGRS does not have a function for defining rainfall thresholds. Rainfall thresholds are defined by analyzing the relationship between the output
Conclusion
The influence of soil mechanical and hydraulic parameters on the definition of I-D thresholds based on TRIGRS can be divided into the influence on the number of rainfall thresholds and threshold position.
The number of rainfall thresholds defined at the slope unit and grid cell scale decreased with
The position of rainfall thresholds varied positively with
Soil mechanical and hydraulic parameters have less effect on rainfall thresholds defined by analyzing the overall behavior of unstable grid cells (i.e., basin and slope unit scales) than the thresholds defined by analyzing the individual behavior of unstable grid cells (i.e., grid cell scale).
Data availability statement
The data analyzed in this study are subject to the following licenses/restrictions: The data presented in this research are available from the corresponding author by reasonable request. Requests to access these datasets should be directed to Qigang Jiang, jiangqigang@jlu.edu.cn.
Author contributions
SZ collected the soil samples, designed the analysis, performed the analysis, and wrote the original draft. XX developed a Python program for the definition of rainfall thresholds. The other authors helped to draft the manuscript.
Funding
This study was supported by The First Surveying and Mapping Institute of Guizhou Province under Grant number GZWH-2021-4536Y.
Acknowledgments
We thank The First Surveying and Mapping Institute of Guizhou Province for the assistance in the field sampling.
Conflict of interest
The authors declare that the research was conducted in the absence of any commercial or financial relationships that could be construed as a potential conflict of interest.
Publisher’s note
All claims expressed in this article are solely those of the authors and do not necessarily represent those of their affiliated organizations, or those of the publisher, the editors, and the reviewers. Any product that may be evaluated in this article, or claim that may be made by its manufacturer, is not guaranteed or endorsed by the publisher.
Supplementary material
The Supplementary Material for this article can be found online at: https://www.frontiersin.org/articles/10.3389/feart.2022.971655/full#supplementary-material
References
Aleotti, P. (2004). A warning system for rainfall-induced shallow failures. Eng. Geol. 73, 247–265. doi:10.1016/j.enggeo.2004.01.007
Alvioli, M., and Baum, R. L. (2016). Parallelization of the TRIGRS model for rainfall-induced landslides using the message passing interface. Environ. Model. Softw. 81, 122–135. doi:10.1016/j.envsoft.2016.04.002
Alvioli, M., Guzzetti, F., and Rossi, M. (2014). Scaling properties of rainfall induced landslides predicted by a physically based model. Geomorphology 213, 38–47. doi:10.1016/j.geomorph.2013.12.039
Alvioli, M., Melillo, M., Guzzetti, F., Rossi, M., Palazzi, E., von Hardenberg, J., et al. (2018). Implications of climate change on landslide hazard in Central Italy. Sci. Total Environ. 630, 1528–1543. doi:10.1016/j.scitotenv.2018.02.315
Baum, R. L., Coe, J. A., Godt, J. W., Harp, E. L., Reid, M. E., Savage, W. Z., et al. (2005)., Regional landslide-hazard assessment for Seattle, Washington, USA. Landslides 2, 266–279. doi:10.1007/s10346-005-0023-y
Baum, R. L., Godt, J. W., and Savage, W. Z. (2010). Estimating the timing and location of shallow rainfall-induced landslides using a model for transient, unsaturated infiltration. J. Geophys. Res. 115, F03013. doi:10.1029/2009JF001321
Baum, R. L., Savage, W. Z., and Godt, J. W. (2002). TRIGRS—a fortran program for transient rainfall infiltration and grid-based regional slope-stability analysis. Golden, Colorado: U. S. Geol. Surv. Open-File Rep. 424, 38.
Baum, R. L., Savage, W. Z., and Godt, J. W. (2008). Trigrs — a fortran program for transient rainfall infiltration and grid-based regional slope-stability analysis, version 2.0. Denver, Colorado, USA: US Geological Survey Open-File. Report 2008-1159.
Bicocchi, G., D’Ambrosio, M., Vannocci, P., Nocentini, M., Tacconi-Stefanelli, C., Masi, E., et al. (2015). “Preliminary assessment of the factors controlling the geotechnical and hydrological properties in the hillslope deposits of eastern Tuscany (Central Italy),” in IAMG 2015 proceedings, 867–874.
Bordoni, M., Corradini, B., Lucchelli, L., Valentino, R., Bittelli, M., Vivaldi, V., et al. (2019). Empirical and physically based thresholds for the occurrence of shallow landslides in a prone area of Northern Italian Apennines. WaterSwitzerl. 11, 2653. doi:10.3390/W11122653
Bordoni, M., Meisina, C., Valentino, R., Bittelli, M., and Chersich, S. (2015). Site-specific to local-scale shallow landslides triggering zones assessment using TRIGRS. Nat. Hazards Earth Syst. Sci. 15, 1025–1050. doi:10.5194/nhess-15-1025-2015
Brunetti, M. T., Peruccacci, S., Rossi, M., Luciani, S., Valigi, D., and Guzzetti, F. (2010). Rainfall thresholds for the possible occurrence of landslides in Italy. Nat. Hazards Earth Syst. Sci. 10, 447–458. doi:10.5194/nhess-10-447-2010
Caine, N. (1980). The rainfall intensity-duration control of shallow landslides and debris flows. Geogr. Ann. Ser. A Phys. Geogr. 62, 23–27. doi:10.1080/04353676.1980.11879996
Calvello, M. (2017). Early warning strategies to cope with landslide risk. Riv. Ital. Geotec. 2017, 63–91. doi:10.19199/2017.2.0557-1405.063
Campbell, R. H. (1975). Soil slips, debris flows, and rainstorms in the Santa Monica Mountains and vicinity, southern California. Washington, DC, USA: US Geological Survey Professional Paper, 851.
Catani, F., Segoni, S., and Falorni, G. (2010). An empirical geomorphology‐based approach to the spatial prediction of soil thickness at catchment scale. Water Resour. Res. 46, W05508. doi:10.1029/2008WR007450
Ciurleo, M., Cascini, L., and Calvello, M. (2017). A comparison of statistical and deterministic methods for shallow landslide susceptibility zoning in clayey soils. Eng. Geol. 223, 71–81. doi:10.1016/j.enggeo.2017.04.023
Ciurleo, M., Mandaglio, M. C., and Moraci, N. (2019). Landslide susceptibility assessment by TRIGRS in a frequently affected shallow instability area. Landslides 16, 175–188. doi:10.1007/s10346-018-1072-3
Corominas, J., van Westen, C., Frattini, P., Cascini, L., Malet, J. P., Fotopoulou, S., et al. (2014). Recommendations for the quantitative analysis of landslide risk. Bull. Eng. Geol. Environ. 73, 209–263. doi:10.1007/s10064-013-0538-8
de Lima Neves Seefelder, C., Koide, S., and Mergili, M. (2017). Does parameterization influence the performance of slope stability model results? A case study in rio de Janeiro, Brazil. Landslides 14, 1389–1401. doi:10.1007/s10346-016-0783-6
Gardner, W. R. (1958). Some steady-state solutions of the unsaturated moisture flow equation with application to evaporation from a water table. Soil Sci. 85, 228–232. doi:10.1097/00010694-195804000-00006
Gariano, S. L., and Guzzetti, F. (2016). Landslides in a changing climate. Earth. Sci. Rev. 162, 227–252. doi:10.1016/j.earscirev.2016.08.011
Gioia, E., Speranza, G., Ferretti, M., Godt, J. W., Baum, R. L., and Marincioni, F. (2016). Application of a process-based shallow landslide hazard model over a broad area in Central Italy. Landslides 13, 1197–1214. doi:10.1007/s10346-015-0670-6
Guzzetti, F., Gariano, S. L., Peruccacci, S., Brunetti, M. T., Marchesini, I., Rossi, M., et al. (2020). Geographical landslide early warning systems. Earth. Sci. Rev. 200, 102973. doi:10.1016/j.earscirev.2019.102973
Guzzetti, F., Peruccacci, S., Rossi, M., and Stark, C. P. (2007). Rainfall thresholds for the initiation of landslides in central and southern Europe. Meteorol. Atmos. Phys. 98, 239–267. doi:10.1007/s00703-007-0262-7
Guzzetti, F., Peruccacci, S., Rossi, M., and Stark, C. P. (2008). The rainfall intensity–duration control of shallow landslides and debris flows: An update. Landslides 5, 3–17. doi:10.1007/s10346-007-0112-1
He, J., Qiu, H., Qu, F., Hu, S., Yang, D., Shen, Y., et al. (2021). Prediction of spatiotemporal stability and rainfall threshold of shallow landslides using the TRIGRS and Scoops3D models. Catena 197, 104999. doi:10.1016/j.catena.2020.104999
He, S., Wang, J., and Liu, S. (2020). Rainfall event-duration thresholds for landslide occurrences in China. Water 12, 494. doi:10.3390/w12020494
He, X., Hong, Y., Vergara, H., Zhang, K., Kirstetter, P. E., Gourley, J. J., et al. (2016). Development of a coupled hydrological-geotechnical framework for rainfall-induced landslides prediction. J. Hydrol. X. 543, 395–405. doi:10.1016/j.jhydrol.2016.10.016
Ho, J.-Y., Lee, K. T., Chang, T.-C., Wang, Z.-Y., and Liao, Y.-H. (2012). Influences of spatial distribution of soil thickness on shallow landslide prediction. Eng. Geol. 124, 38–46. doi:10.1016/j.enggeo.2011.09.013
Ip, S. C. Y., Rahardjo, H., and Satyanaga, A. (2021). Three-dimensional slope stability analysis incorporating unsaturated soil properties in Singapore. Georisk Assess. Manag. Risk Eng. Syst. Geohazards 15, 98–112. doi:10.1080/17499518.2020.1737880
Iverson, R. M. (2000). Landslide triggering by rain infiltration. Water Resour. Res. 36, 1897–1910. doi:10.1029/2000WR900090
Keefer, D. K., Wilson, R. C., Mark, R. K., Brabb, E. E., Brown, W. M., Ellen, S. D., et al. (1987). Real-time landslide warning during heavy rainfall. Science 238, 921–925. doi:10.1126/science.238.4829.921
Kim, D., Im, S., Lee, S. H., Hong, Y., and Cha, K.-S. (2010). Predicting the rainfall-triggered landslides in a forested mountain region using TRIGRS model. J. Mt. Sci. 7, 83–91. doi:10.1007/s11629-010-1072-9
Lee, G., An, H., and Kim, M. (2017). Comparing the performance of TRIGRS and TiVaSS in spatial and temporal prediction of rainfall-induced shallow landslides. Environ. Earth Sci. 76, 315. doi:10.1007/s12665-017-6635-4
Li, W. Y., Liu, C., Scaioni, M., Sun, W. W., Chen, Y., Yao, D. J., et al. (2017). Spatio-temporal analysis and simulation on shallow rainfall-induced landslides in China using landslide susceptibility dynamics and rainfall I-D thresholds. Sci. China Earth Sci. 60, 720–732. doi:10.1007/s11430-016-9008-4
Lim, T. T., Rahardjo, H., Chang, M. F., and Fredlund, D. G. (1996). Effect of rainfall on matric suctions in a residual soil slope. Can. Geotech. J. 33, 618–628. doi:10.1139/t96-087
Lin, Q., and Wang, Y. (2018). Spatial and temporal analysis of a fatal landslide inventory in China from 1950 to 2016. Landslides 15, 2357–2372. doi:10.1007/s10346-018-1037-6
Ma, S., Xu, C., Xu, X., He, X., Qian, H., Jiao, Q., et al. (2020). Characteristics and causes of the landslide on july 23, 2019 in shuicheng, Guizhou province, China. Landslides 17, 1441–1452. doi:10.1007/s10346-020-01374-x
Marin, R. J., García, E. F., and Aristizábal, E. (2020). Effect of basin morphometric parameters on physically-based rainfall thresholds for shallow landslides. Eng. Geol. 278, 105855. doi:10.1016/j.enggeo.2020.105855
Marin, R. J., and Mattos, Á. J. (2020). Physically-based landslide susceptibility analysis using Monte Carlo simulation in a tropical mountain basin. Georisk Assess. Manag. Risk Eng. Syst. Geohazards 14, 192–205. doi:10.1080/17499518.2019.1633582
Marin, R. J. (2020). Physically based and distributed rainfall intensity and duration thresholds for shallow landslides. Landslides 17, 2907–2917. doi:10.1007/s10346-020-01481-9
Marin, R. J., Velásquez, M. F., García, E. F., Alvioli, M., and Aristizábal, E. (2021). Assessing two methods of defining rainfall intensity and duration thresholds for shallow landslides in data-scarce catchments of the Colombian Andean Mountains. Catena 206, 105563. doi:10.1016/j.catena.2021.105563
Marin, R. J., and Velásquez, M. F. (2020). Influence of hydraulic properties on physically modelling slope stability and the definition of rainfall thresholds for shallow landslides. Geomorphology 351, 106976. doi:10.1016/j.geomorph.2019.106976
Melillo, M., Brunetti, M. T., Peruccacci, S., Gariano, S. L., Roccati, A., and Guzzetti, F. (2018). A tool for the automatic calculation of rainfall thresholds for landslide occurrence. Environ. Model. Softw. 105, 230–243. doi:10.1016/j.envsoft.2018.03.024
Montrasio, L., and Valentino, R. (2008). A model for triggering mechanisms of shallow landslides. Nat. Hazards Earth Syst. Sci. 8, 1149–1159. doi:10.5194/nhess-8-1149-2008
Montrasio, L., and Valentino, R. (2007). Experimental analysis and modelling of shallow landslides. Landslides 4, 291–296. doi:10.1007/s10346-007-0082-3
Montrasio, L., Valentino, R., and Losi, G. L. (2011). Towards a real-time susceptibility assessment of rainfall-induced shallow landslides on a regional scale. Nat. Hazards Earth Syst. Sci. 11, 1927. doi:10.5194/nhess-11-1927-2011
Park, D. W., Nikhil, N. V., and Lee, S. R. (2013). Landslide and debris flow susceptibility zonation using TRIGRS for the 2011 Seoul landslide event. Nat. Hazards Earth Syst. Sci. 13, 2833–2849. doi:10.5194/nhess-13-2833-2013
Park, J. Y., Lee, S. R., Lee, D. H., Kim, Y. T., and Lee, J. S. (2019). A regional-scale landslide early warning methodology applying statistical and physically based approaches in sequence. Eng. Geol. 260, 105193. doi:10.1016/j.enggeo.2019.105193
Peres, D. J., and Cancelliere, A. (2014). Derivation and evaluation of landslide-triggering thresholds by a Monte Carlo approach. Hydrol. Earth Syst. Sci. 18, 4913–4931. doi:10.5194/hess-18-4913-2014
Peruccacci, S., Brunetti, M. T., Luciani, S., Vennari, C., and Guzzetti, F. (2012). Lithological and seasonal control on rainfall thresholds for the possible initiation of landslides in central Italy. Geomorphology 139–140, 79–90. doi:10.1016/j.geomorph.2011.10.005
Piciullo, L., Calvello, M., and Cepeda, J. M. (2018). Territorial early warning systems for rainfall-induced landslides. Earth. Sci. Rev. 179, 228–247. doi:10.1016/j.earscirev.2018.02.013
Piciullo, L., Gariano, S. L., Melillo, M., Brunetti, M. T., Peruccacci, S., Guzzetti, F., et al. (2017). Definition and performance of a threshold-based regional early warning model for rainfall-induced landslides. Landslides 14, 995–1008. doi:10.1007/s10346-016-0750-2
Raia, S., Alvioli, M., Rossi, M., Baum, R. L., Godt, J. W., and Guzzetti, F. (2014). Improving predictive power of physically based rainfall-induced shallow landslide models: A probabilistic approach. Geosci. Model Dev. 7, 495–514. doi:10.5194/gmd-7-495-2014
Richards, L. A. (1931). Capillary conduction of liquids through porous mediums. Physics 1, 318–333. doi:10.1063/1.1745010
Salciarini, D., Fanelli, G., and Tamagnini, C. (2017). A probabilistic model for rainfall—Induced shallow landslide prediction at the regional scale. Landslides 14, 1731–1746. doi:10.1007/s10346-017-0812-0
Salciarini, D., Godt, J. W., Savage, W. Z., Baum, R. L., and Conversini, P. (2008). Modeling landslide recurrence in Seattle, Washington, USA. Eng. Geol. 102, 227–237. doi:10.1016/j.enggeo.2008.03.013
Salciarini, D., Godt, J. W., Savage, W. Z., Conversini, P., Baum, R. L., and Michael, J. A. (2006). Modeling regional initiation of rainfall-induced shallow landslides in the eastern Umbria Region of central Italy. Landslides 3, 181–194. doi:10.1007/s10346-006-0037-0
Salciarini, D., Tamagnini, C., Conversini, P., and Rapinesi, S. (2012). Spatially distributed rainfall thresholds for the initiation of shallow landslides. Nat. Hazards 61, 229–245. doi:10.1007/s11069-011-9739-2
Segoni, S., Piciullo, L., and Gariano, S. L. (2018). A review of the recent literature on rainfall thresholds for landslide occurrence. Landslides 15, 1483–1501. doi:10.1007/s10346-018-0966-4
Srivastava, R., and Yeh, T. J. (1991). Analytical solutions for one‐dimensional, transient infiltration toward the water table in homogeneous and layered soils. Water Resour. Res. 27, 753–762. doi:10.1029/90WR02772
Tran, T. V., Alvioli, M., Lee, G., and An, H. U. (2018). Three-dimensional, time-dependent modeling of rainfall-induced landslides over a digital landscape: A case study. Landslides 15, 1071–1084. doi:10.1007/s10346-017-0931-7
United Nations International Strategy for Disaster Reduction (UNISDR) (2015). Sendai framework for disaster risk reduction 2015–2030. Available at: http://www.wcdrr.org/uploads/Sendai_Framework_for_Disaster_Risk_Reduction_2015-2030.pdf (Access June 6, 2015).
Van Genuchten, M. T. (1980). A closed‐form equation for predicting the hydraulic conductivity of unsaturated soils. Soil Sci. Soc. Am. J. 44, 892–898. doi:10.2136/sssaj1980.03615995004400050002x
Vanapalli, S. K., Fredlund, D. G., Pufahl, D. E., and Clifton, A. W. (1996). Model for the prediction of shear strength with respect to soil suction. Can. Geotech. J. 33, 379–392. doi:10.1139/t96-060
Vieira, B. C., Fernandes, N. F., and Filho, O. A. (2010). Shallow landslide prediction in the serra do mar, são paulo, Brazil. Nat. Hazards Earth Syst. Sci. 10, 1829–1837. doi:10.5194/nhess-10-1829-2010
Viet, T. T., Lee, G., Thu, T. M., and An, H. U. (2017). Effect of digital elevation model resolution on shallow landslide modeling using TRIGRS. Nat. Hazards Rev. 18, 04016011. doi:10.1061/(asce)nh.1527-6996.0000233
Wei, L. W., Huang, C. M., Chen, H., Lee, C. T., Chi, C. C., and Chiu, C. L. (2018). Adopting the <i>I</i><sub>3</sub>–<i>R</i><sub>24</sub> rainfall index and landslide susceptibility for the establishment of an early warning model for rainfall-induced shallow landslides. Nat. Hazards Earth Syst. Sci. 18, 1717–1733. doi:10.5194/nhess-18-1717-2018
Weidner, L., Oommen, T., Escobar-Wolf, R., Sajinkumar, K. S., and Samuel, R. A. (2018). Regional-scale back-analysis using TRIGRS: An approach to advance landslide hazard modeling and prediction in sparse data regions. Landslides 15, 2343–2356. doi:10.1007/s10346-018-1044-7
Wilson, R. C. (2005). The rise and fall of a debris‐flow warning system for the San Francisco Bay region, California. Chichester, England: Landslide hazard risk, 493–516. doi:10.1002/9780470012659.ch17
Wu, S. J., Hsiao, Y. H., Yeh, K. C., and Yang, S. H. (2017). A probabilistic model for evaluating the reliability of rainfall thresholds for shallow landslides based on uncertainties in rainfall characteristics and soil properties. Nat. Hazards 87, 469–513. doi:10.1007/s11069-017-2773-y
Xie, M., Esaki, T., and Zhou, G. (2004). GIS-based probabilistic mapping of landslide hazard using a three-dimensional deterministic model. Nat. Hazards (Dordr). 33, 265–282. doi:10.1023/B:NHAZ.0000037036.01850.0d
Yu, B., Wang, T., Zhu, Y., and Zhu, Y. (2016). Topographical and rainfall factors determining the formation of gully-type debris flows caused by shallow landslides in the Dayi area, Guizhou Province, China. Environ. Earth Sci. 75, 551–618. doi:10.1007/s12665-016-5243-z
Zhang, N., et al. (2017). A study of the instability mechanism and investigation methods of shallow bedrock landslides in karst mountain areas: Taking the jinxing landslide in dafang county as an example. Hydrogeol. Eng. Geol. 44, 142–146. (In Chinese).
Zhang, S., Jiang, Q., Wu, D., Xu, X., Tan, Y., and Shi, P. (2022). Improved method of defining rainfall intensity and duration thresholds for shallow landslides based on TRIGRS. Water 14, 524. doi:10.3390/w14040524
Zhang, S., Zhao, L., Delgado-Tellez, R., and Bao, H. (2018). A physics-based probabilistic forecasting model for rainfall-induced shallow landslides at regional scale. Nat. Hazards Earth Syst. Sci. 18, 969–982. doi:10.5194/nhess-18-969-2018
Keywords: shallow landslides, rainfall thresholds, I-D thresholds, TRIGRS, physically based method, soil mechanical and hydraulic parameters
Citation: Zhang S, Jiang Q, Xu X, Tao G, Zhang Z, Gao X and He C (2022) Influence of soil mechanical and hydraulic parameters on the definition of rainfall intensity and duration thresholds based on Transient rainfall infiltration and grid-based regional slope-stability model (TRIGRS). Front. Earth Sci. 10:971655. doi: 10.3389/feart.2022.971655
Received: 17 June 2022; Accepted: 31 August 2022;
Published: 27 September 2022.
Edited by:
Jia-wen Zhou, Sichuan University, ChinaCopyright © 2022 Zhang, Jiang, Xu, Tao, Zhang, Gao and He. This is an open-access article distributed under the terms of the Creative Commons Attribution License (CC BY). The use, distribution or reproduction in other forums is permitted, provided the original author(s) and the copyright owner(s) are credited and that the original publication in this journal is cited, in accordance with accepted academic practice. No use, distribution or reproduction is permitted which does not comply with these terms.
*Correspondence: Qigang Jiang, amlhbmdxaWdhbmdAamx1LmVkdS5jbg==