 Ludmila Maria Fonseca Teixeira
 Juliana Troch
 Julien Allaz
 Olivier Bachmann
- 1Institute of Geochemistry and Petrology, ETH Zürich, Zürich, Switzerland
- 2Department of Mineral Sciences, Smithsonian National Museum of Natural History, Washington, DC, United States
Fluid exsolution in magmas is a process that, in many silicic upper crustal reservoirs, starts at relatively low crystallinities (near liquidus), and precedes the precipitation of many ore bodies, including pegmatites. As any magmatic system approaches its solidus, the amount of the exsolved fluid phase increases and becomes progressively dominant over melt, allowing local over pressurization and the generation of pegmatitic pods/dykes. Such pegmatitic bodies show several features that point to both magmatic and hydrothermal environments, linking those realms and providing a unique opportunity to document and understand the magmatic-hydrothermal transition within silicic magmatic systems. We studied the 1.1 Ga classic A-type Pikes Peak granite (Colorado, United States) and one of its many internally-hosted pegmatites, the Wellington Lake pegmatite, to investigate the changes that occur within a granitic system as it crosses its theoretical water-saturated solidus and continues crystallizing beyond it. Textural and geochemical analyses of quartz, plagioclase, and K-feldspar minerals, as well as fluid inclusion studies, demonstrate this magmatic to hydrothermal transition in the granite and the pegmatite. Different thermometers (Ti-in-quartz, 2-feldspars, fluid inclusions) document the temperature evolution of the granitic system, from >850°C for the hottest magmatic minerals to <400°C for the pegmatite core. The magmatic-hydrothermal transition is recorded by plagioclase and quartz rims that yield temperatures well below the traditionally inferred haplogranite solidus. In the pegmatite, the magmatic-hydrothermal transition is observed between the graphic granite wall zone, which shows homogeneous quartz geochemical signatures at near-solidus conditions (700–670°C), and the intermediate zone, which crystallized at much colder temperatures (470–420°C). Although a significant process, our calculations suggest that subsolidus precipitation from exsolved, solute-rich magmatic fluids represent less than 20% of the total volume of the granite.
Introduction
Silicic magmas are the main building blocks of the Earth’s continental crust and are key for the enrichment of incompatible elements and the genesis of ore deposits e.g., W-Sn granites, LCT- and NYF-pegmatites, Cu porphyries (Richards, 2003; Černý and Ercit, 2005; Sillitoe, 2010). All magmas contain some dissolved volatile elements, which will ultimately exsolve into a magmatic volatile phase (MVP) as the magma cools towards its solidus and crystallizes. Hence, all systems could show textural, mineralogical, and/or geochemical evidence for fluid exsolution from the silicate melt, with this transition from a melt to a fluid-dominated environment (“magmatic-hydrothermal transition”) commonly documented by metasomatic bodies (e.g., Audétat et al., 2000; Campos et al., 2006; Peterková and Dolejš, 2019; Troch et al., 2021).
Fluid exsolution occurs during cooling and crystallization of a magmatic system, when the amount of H2O and CO2, the two most abundant volatile species in nearly all magmas, exceeds their solubility limit in the silicate melt. The magmatic-hydrothermal transition usually occurs as the system temperature cools below the solidus, leading to crystallization of the remaining melt volume and rapid increase in the fluid/melt ratio. In silicic magmas, the solidus is commonly assumed to occur at temperatures around 650–680°C (Tuttle and Bowen, 1958; Luth et al., 1964; Piwinskii, 1968), depending on the composition and water content of the melt. At 200 MPa, a simplified haplogranite system (Qz-Ab-Or) with 5.8 wt% of H2O has its solidus at 680°C (Ebadi and Johannes, 1991). However, there is growing evidence that the solidus temperature is not well constrained and complete crystallization may occur over a range of temperatures in different systems (Thompson et al., 2007; Dolejš and Zajacz, 2018). Experiments have demonstrated that the addition of flux elements (e.g., F, Cl, Li, C, and B) can lower the solidus significantly, allowing for crystallization at relatively cold temperatures near 500°C (Sowerby and Keppler, 2002; Veksler and Thomas, 2002). In natural examples, some systems have been suggested to record crystallization at temperatures below traditionally inferred solidus temperatures (hereafter abbreviated as TISol) of 650–680°C. As a notable example, the Tuolomne Intrusive Suite granitoids in California show evidence of crystallization 100–200°C below the TISol, and have been used as an argument for dominant magma storage at cold conditions (Ackerson et al., 2018). These examples illustrate the uncertainty regarding the behavior of silicic magmatic systems as they approach the solidus, especially with respect to the role of water and other solidus-lowering flux elements.
The most common systems to show evidence of crystallization at temperatures below the accepted solidus are pegmatites (Fenn, 1986; Thomas et al., 1988; Chakoumakos and Lumpkin, 1990; Morgan VI and London, 1999; Sirbescu and Nabelek, 2003; Colombo et al., 2012; London et al., 2020). These characteristically coarse-grained rocks of broadly granitic composition are often enriched in the flux elements mentioned above, and commonly show both magmatic and hydrothermal features. For instance, their common spatial and compositional correlations with host granites imply a common magmatic environment (Norton, 1966), but monomineralic quartz cores in zoned pegmatites rather resemble hydrothermal quartz veins (Burnham and Nekvasil, 1986; Alfonso and Melgarejo, 2008). This magmatic-hydrothermal dichotomy has been interpreted to reflect pegmatite crystallization across the magmatic-hydrothermal transition in classic pegmatite formation models, starting with crystallization from silicate melt and ending with precipitation from an aqueous fluid (Jahns and Burnham, 1969).
As a link between magmatic and hydrothermal realms, coupled pegmatite-granite systems provide the unique opportunity to investigate silicic magmatic systems as they approach the solidus and continue to crystallize below it. The zoned nature of many pegmatites allows one to compare and understand the system’s evolution across the magmatic-hydrothermal transition.
In this study, we explore the Pikes Peak granite and one of its many internal pegmatites, the Wellington Lake pegmatite, to investigate the magmatic-hydrothermal transition in A-type silicic systems. Using a pegmatite hosted within its source granite allows us to establish the magma reservoir’s evolution from a melt-dominated environment to the late-stage hydrothermal environment recorded in the quartz core of the pegmatite. Different thermometers (Ti-in-quartz, 2-feldspar, and fluid inclusion thermometry) as well as chemical analyses and textural observations in quartz and feldspar are used to assess the compositional changes coupled to the thermal history during crystallization of the Pikes Peak batholith. We use these findings to quantify crystallization volumes in the granitic body at different temperature intervals and provide insights into the continuously changing nature of the precipitating medium, in order to improve our understanding of the magmatic-hydrothermal transition within silicic magmatic systems.
Geological background
The Pikes Peak batholith is a 1.1 Ga granitic body emplaced within pre-1.4 Ga metapelites and other metamorphic rocks of the Idaho Springs Formation in the southern Colorado Front Range, US (Barker et al., 1975; Wobus, 1976; DePaolo, 1981; Smith et al., 1999a; Smith et al., 1999b). It has an elongated shape of 100 km in the long axis and is exposed over an area of 3,100 km2 (Barker et al., 1975). The batholith was one of the main examples used by Loiselle and Wones (1979) in their original definition of A-type granites as slightly alkaline anorogenic granites that contain high Fe/(Fe+Mg) and K2O/Na2O ratios, low proportions of CaO and Al2O3 and are often enriched in incompatible elements, including REE. In the Pikes Peak Batholith, high Fe contents are reflected in the mineral assemblage, with biotite being the only mica present in the granite (Simmons and Heinrich, 1980). The batholith is considered to be dominantly derived from a mantle source, with some crustal contamination (Barker et al., 1975; DePaolo, 1981; Patchett et al., 1982; Smith et al., 1999a; Guitreau et al., 2016).
The batholith hosts hundreds if not thousands of pegmatites, mostly barren, and over 50 concentrically zoned REE enriched pegmatites occur in the South Platte district and in the northern part of the batholith (Simmons et al., 1987). One of them is the Wellington Lake pegmatite, located in the northern portion of the batholith between Windy Peak and Green Mountain (Figure 1). The Wellington Lake pegmatite is described in detail by Raschke et al. (2021). It is subdivided into three main zones: a wall zone (fine grained biotite graphic granite), an intermediate zone (intergrowth of albite and quartz), and a core (pure blocky quartz), plus a mineralized zone. The three main zones represent respectively 20%, 69%, and 11% of the pegmatite. The mineralization occurs at the transition between the intermediate zone and the core, or within the core, and includes fluocerite, bastnäsite, samarskite and thorite. From the wall zone to the core zone, the average grain size increases progressively, starting at millimetric crystals within the graphic granite to the meter-sized quartz crystals in the core.
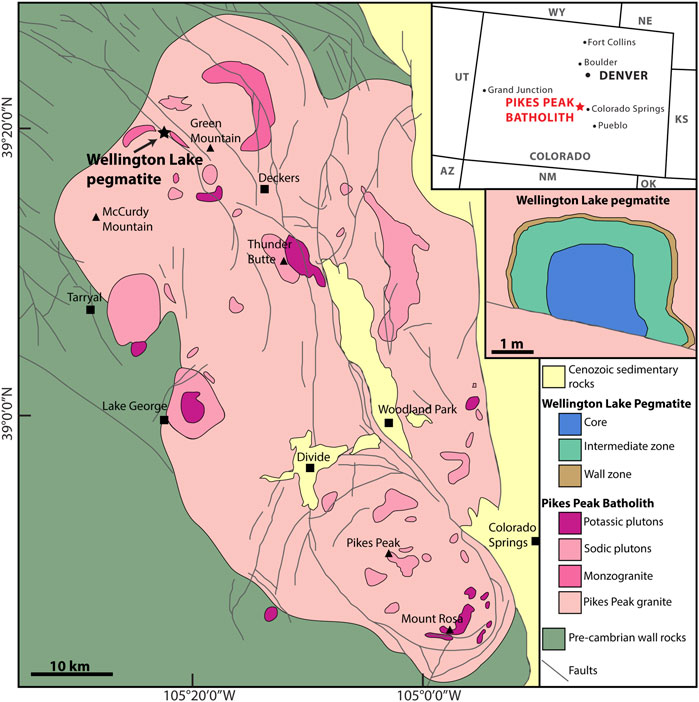
FIGURE 1. Simplified geological map of the Pikes Peak Batholith (from Scott et al., 1978; Smith et al., 1999a) and the Wellington Lake pegmatite (after Raschke et al., 2021).
At the SE margin of the batholith, the Keeton Porphyry subvolcanic body is exposed. Due to its age and geographic position, this 1.1-Ga rhyodacite has been suggested to be associated with the Pikes Peak granite (Sanders, 1999). The mineralogy of the porphyry consists mostly of phenocrystic K-feldspar, quartz, plagioclase, biotite, and hornblende (Murray, 1975).
Materials and Methods
Sample preparation
Thin section billets from the different zones (wall zone, intermediate zone, and quartz core) of the Wellington Lake pegmatite and surrounding granite were provided by Prof. Markus Raschke (CU Boulder), from which double-polished thick (150–200 µm) and normal thin (30 µm) sections were prepared at ETH Zurich.
Cathodoluminescence and Energy-dispersive X-ray spectroscopy elemental maps via scanning electron microscope
Cathodoluminescence (CL) and back-scattered electron (BSE) images, along with Energy-dispersive X-ray spectroscopy (EDS) quantitative analyses (standard-based) of silicates and hyperspectral element mapping were obtained on a JEOL JSM-6390 LA scanning electron microscope (SEM) equipped with a 30-mm2 Thermo-Fisher UltraDry SDD EDS detector at the Department of Earth Sciences, ETH Zürich (Switzerland). CL images were acquired on quartz crystals with a Centaurus panchromatic CL detector. Additional panchromatic CL images were obtained at the ScopeM microscopy center (ETH Zürich), using a Thermo-Fisher Scientific FEG-SEM Quanta 200 F with a GATAN miniCL detector. Color CL images were acquired on quartz and feldspar crystals with a Tescan Vega 4 SEM equipped with a Tescan Rainbow CL detector at the Géosciences Environnement Toulouse, Observatoire Midi-Pyrénés (Université Toulouse III-Paul Sabatier, France). All CL images were acquired at 15 keV, with a working distance varying from 16.5 to 22 mm. EDS element maps were acquired both for single plagioclase crystals and from whole thin sections, and the IGOR-based application iSpectra (Liebske, 2015) was used to extract An-content maps. Whole thin section maps were used to calculate phase proportions within the samples.
Fluid inclusions analyses
Fluid inclusion assemblages were identified in quartz from the wall and core zone of the pegmatite and classified as primary or secondary by matching petrographic observations in double-polished thick sections with corresponding CL images. Selected areas were cut out from the thick sections into small chips (3–4 mm diameter) for thermometric analysis. Microthermometry was performed with a Linkam THMSG600 heating and freezing stage system, attached to a Nikon stage. The stage was periodically calibrated by verifying pure H2O inclusions (ice melting and critical point at 0.0± 0.1°C and 374.1 ± 2°C, respectively) and CO2 inclusions (triple point at −56.6 ± 0.2°C). The inclusions were frozen and slowly heated up to obtain their salinity (ice melting temperature). To avoid decrepitation, this procedure was first carried out for all inclusions, which then were further heated up to retrieve the homogenization temperature. Salinities of the H2O-NaCl inclusions were calculated using the equation of Bodnar (1993), and isochores obtained with the software AqSo_NaCl (Bakker, 2018) were used to estimate entrapment temperatures at reported pegmatite crystallization pressures of 200–300 MPa (Taylor et al., 1979; London, 1984, 1986; Chakoumakos and Lumpkin, 1990; Sirbescu and Nabelek, 2003) and at 400 MPa (pressure calculated by rhyolite-MELTS in this study).
Feldspar compositions and thermometry
Wavelength dispersive spectroscopy (WDS) major element compositions of plagioclase and K-feldspar crystals from the granite, pegmatite wall and intermediate zone were obtained with a JEOL JXA-8230 electron probe microanalyzer (EPMA) at the Department of Earth Sciences, ETH Zürich. Samples were coated with 20 nm of carbon. The analyses were carried out at 15 keV acceleration voltage, 20 nA beam current, and 10 µm spot size. Peak counting times were 30 s for Si, Al, K, Sr, Fe, and Ba, and 60 s for Na and Ca. The Mean Atomic Number (MAN) background correction (Donovan and Tingle, 1996) was applied using the software Probe for EPMA. Combined EDS and WDS qualitative maps of Si, Al, Ca, Na, and K (by WDS) along with Fe, K, Mg, Na, P, and Ti (by EDS) in the granite and intermediate zone were acquired on the EPMA using the same conditions as the quantitative analyses. The qualitative element maps of the granite were used to get the modal proportions of orthoclase and perthitically exsolved albite, which were combined with average WDS compositions obtained by point analysis of both phases to estimate the original K-feldspar composition. Together with different plagioclase compositions, the pre-perthitic K-feldspar composition was then used as input for 2-feldspar thermometry via the software SolvCalc (Wen and Nekvasil, 1994) with a fixed pressure of 400 MPa (calculated by rhyolite-MELTS in this study), following the different methods available in the software (Ghiorso, 1984; Green and Usdansky, 1986; Nekvasil and Burnham, 1987; Fuhrman and Lindsley, 1988; Lindsley and Nekvasil, 1989).
Titanium in quartz concentrations and thermometry
Quartz crystals from different zones in the granite and the pegmatite were analyzed via laser-ablation inductively-coupled plasma mass spectrometry (LA-ICP-MS) with a Perkin Elmer NexION 2000 quadrupole ICP-MS at the Department of Earth Sciences, ETH Zürich. The analyses were carried out at a spot size of 30 µm diameter and repetition rate of 5 or 10 Hz. The data was reduced using the MATLAB-based application SILLS (Guillong et al., 2008).
Titanium was measured with the EPMA in quartz crystals to complement the LA-ICP-MS data. The analyses were performed at 15 kV acceleration voltage, 200 nA beam current, and with a focused beam. Counting times were 5 min to measure Ti only. The analytical procedure basically follows the one presented in Donovan et al. (2011): the MAN background correction was used along with the blank correction using a low-temperature quartz standard with no Ti detectable at the EPMA (<3 ppm). The blank correction is used to compensate for inaccuracies at ppm-level from the use of the MAN background correction and the “hole in the background” observed on PET monochromator at the Ti Kα X-ray line position. A synthetic rutile was used as a reference material for Ti. The uncertainty from the X-ray counting statistics on a single point is 5 ppm, but the average uncertainty from the measured quartz standard was 22 ppm. Average Ti contents in the low-Ti quartz standards (Ti < 5 ppm) over all EPMA sessions are 22 ± 30 ppm (2σ). Overall, the EPMA and LA-ICP-MS data matched within their respective uncertainties.
Crystallization temperatures were obtained for different growth zones in 25 quartz crystals of the Pikes Peak batholith, using the Ti concentration from LA-ICP-MS and EPMA and following the calibration of Huang and Audétat, 2012. LA-ICP-MS and EPMA uncertainties, propagated to include the uncertainty of the methodology (10°C), yield an uncertainty of 69°C at 2-sigma STD. The temperature points were overlain onto the corresponding SEM-CL images and the crystal subdivided into 4 different zones: high-temperature range (T >810°C, Ti >120 ppm), corresponding to the bright crystal cores observed within the CL images, medium-temperature range (T between 810 and 720°C, Ti 120–56 ppm), ending at the MELTS-predicted fluid exsolution temperature in the upper crust, near-solidus temperature range (T between 720 and 660°C, Ti 56–30 ppm), and low-temperature range (T <660°C, Ti <30 ppm). In order to give a proper estimate of volume of these zones in the whole granite, the averages were weighted by the absolute estimated volume of each crystal (in mm3), approximating the quartz crystals to spheres. These zones were defined based on the data range, the correlation of Ti concentrations with CL growth zones, and analytical limitations of the methodology. The relatively high error of the EPMA measurements (up to 20% relative in the lowest Ti concentrations) precluded the subdivision of the crystals into a larger number of zones with smaller temperature windows.
Results
Composition and crystallization of feldspar
The granite contains both plagioclase and perthitic alkali feldspar. In composition, granite-hosted plagioclase crystals range from anorthite contents of An18 to An8 in the crystal cores, with a positive correlation between An content and FeO (Figure 2). Many crystals have rims of nearly pure albite (An0-3) that generally show a sharp and abrupt contact with the more Ca-rich interior of the crystals (Figures 3,4), suggesting that the progression to the albitic rims did not occur gradually.
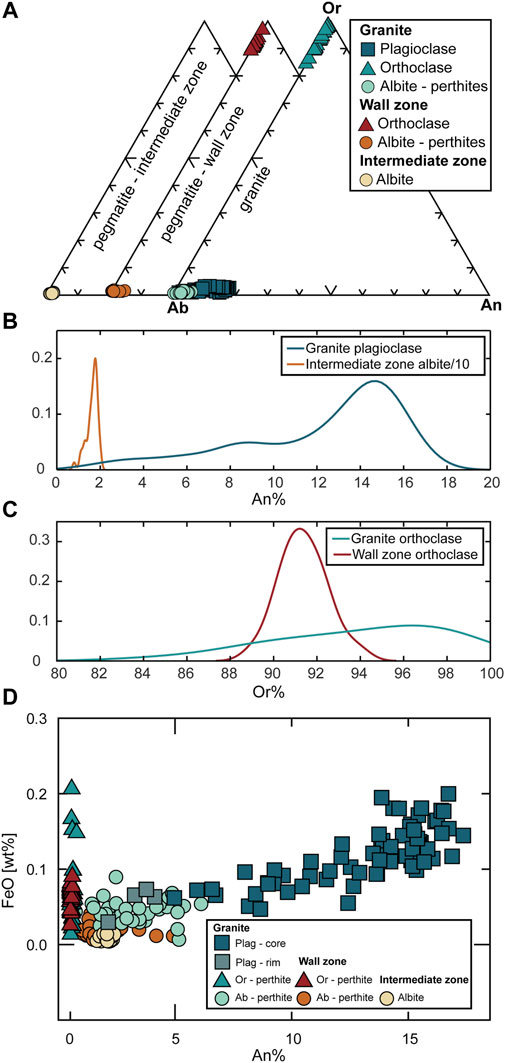
FIGURE 2. (A) Composition of the feldspars present in the granite, the wall zone, and the intermediate zone. (B) Frequency distribution of An contents of plagioclase in the granite and albite in the intermediate zone. Note that frequency values for albite in the intermediate zone are divided by a factor of 10 for better visibility. (C) Frequency distribution of Or contents of K-feldspar crystals in the granite and the wall zone. (D) FeO vs. An% in feldspars from the granite, and pegmatite wall and intermediate zones. Plag = plagioclase, Ab = albite, Or = orthoclase, An = anorthite.
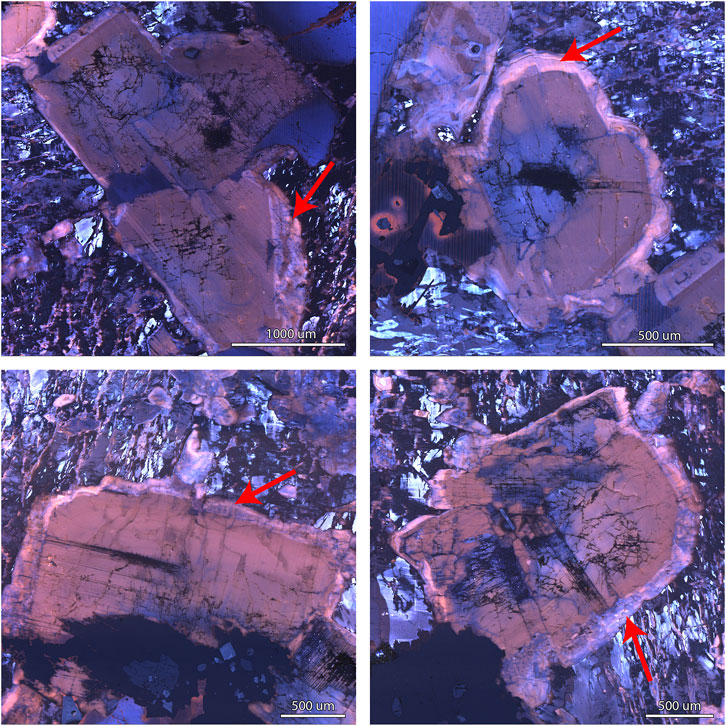
FIGURE 3. Color CL images of plagioclase crystals showing albitic rims (An3) in contrast with Ca-richer core (An8-18) in the granite.
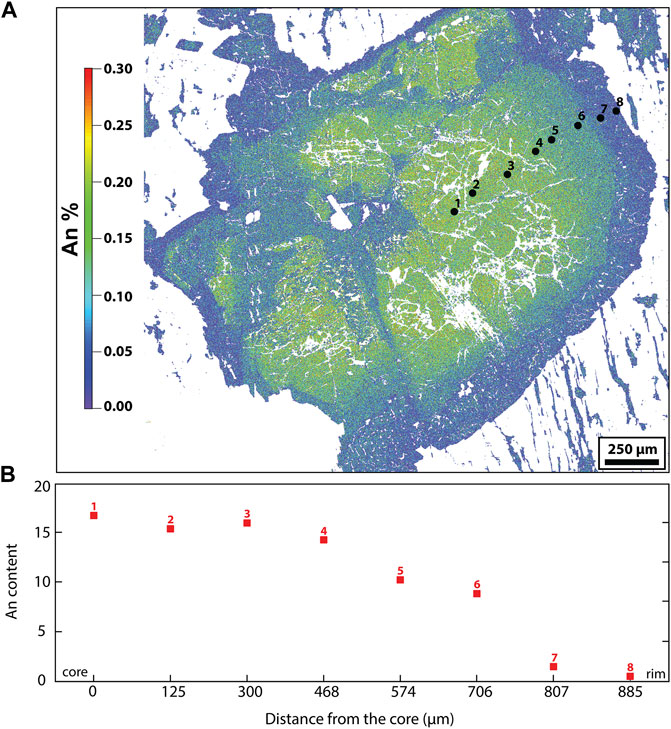
FIGURE 4. (A) An map of a plagioclase crystal in the granite, showing the range of compositions through the crystal. (B) An and Ab content profile from the plagioclase shown in (A).
The wall zone of the pegmatite contains only perthitic K-feldspar, with compositions being slightly more homogenous compared to the granite (Figure 2). The orthoclase endmember reaches slightly lower FeO in the pegmatite compared to the granite (Figure 2). In contrast, the intermediate zone exclusively contains nearly pure albite as the major feldspar phase. This albite is intergrown with quartz in a coarse graphic-like texture and is extremely homogenous, with An2 compositions (Figure 4). We emphasize the observation that true plagioclase with significant An-content (>An5-8) is absent in the pegmatite, both in the wall and the intermediate zones, and is only observed in the granite (Figure 2).
Crystallization temperatures can be calculated for the granite using the 2-feldspar thermometer “SolvCalc” of Wen and Nekvasil, 1994. Compositions of K-feldspar prior to perthitic exsolution (An<1, Ab48, and Or51) were calculated by mixing the Ab (albite) and Or (orthoclase) endmember compositions in average proportions determined from phase maps. These compositions were paired with the different growth zones in plagioclase. We obtain temperatures between 570 and 715°C, depending on the applied method and pairing (Table 1). For pairing plagioclase cores with the estimated average K-feldspar composition, estimated temperatures imply near-solidus conditions at 715 to 672 °C. Pairing the lowest-An contents before the observed albitic rim with K-feldspar results in calculated temperatures between 573 and 645°C. When pairing the given K-feldspar composition with the albitic rim, SolvCalc could not find a matching temperature, suggesting that this rim is likely not in equilibrium with the K-feldspar. Due to the lack of coexisting feldspar pairs in the pegmatite, such 2-feldspar temperatures cannot be determined for the wall zone or intermediate zone.
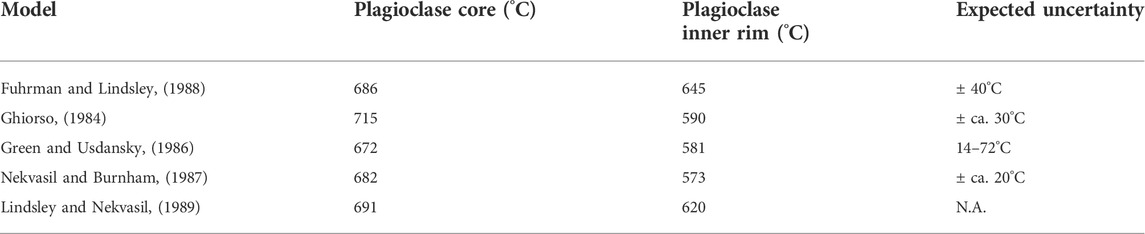
TABLE 1. Crystallization temperatures for 2-feldspar pairs based on different methods, calculated with SolvCalc (Wen and Nekvasil, 1994).
Quartz composition
Quartz crystals from the Pikes Peak granite contain variable concentrations of Ti and Al, which correlate with CL brightness (Figure 5). Ti contents are highest in the CL-bright cores of the crystals (up to 231 ppm) and progressively decrease towards the CL-dark rims of the crystals, where they reach concentrations below 30 ppm, a pattern similar to that observed by Larsen et al. (2009). Healed fractures (see dark CL features in the quartz crystals in Figure 5) show Ti contents down to 15 ppm. Concomitantly, Al concentrations reach 120 ppm in the quartz cores and 80 ppm in the later percolated fractures. Ge is also present in small quantities in the granitic quartz grains (1–2 ppm).
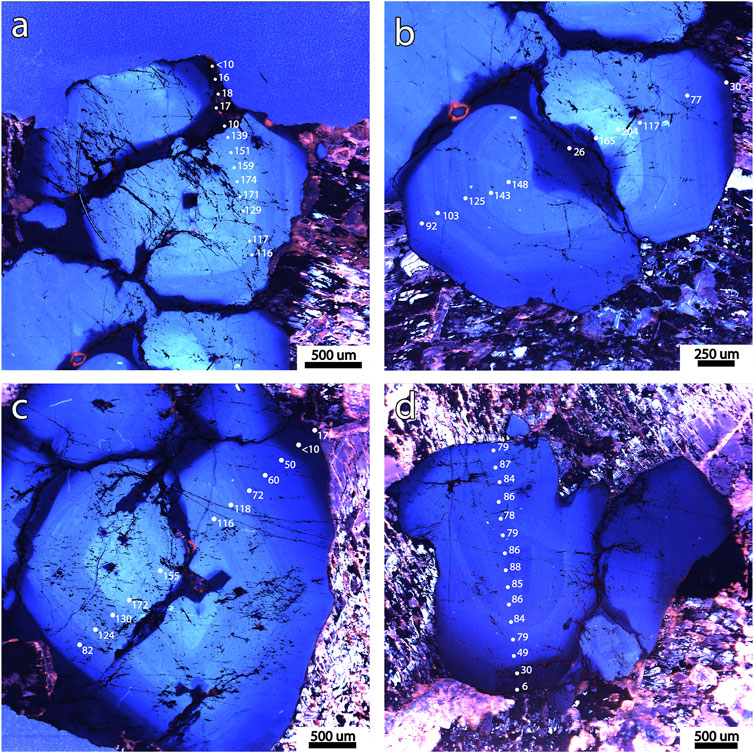
FIGURE 5. (A–D) Four catholuminescence images showing growth zones and dark later percolation fractures in quartz crystals of the Pikes Peak granite and corresponding Ti concentrations measured with the EPMA. (A–C) show crystals with a high-Ti (>120 ppm) core. Note that Ti concentrations decrease from core to rim and are the lowest (<30 ppm) at the dark fractures and at the dark rim.
Quartz crystals from the wall zone of the pegmatite exhibit homogeneous Ti contents (36–47 ppm), while Al is between 70 and 110 ppm and Ge 1–2 ppm. These trace element contents overlap with a small part of the granitic range (Figure 6A). No zoning or systematic variation of trace element contents was observed within the crystals, suggesting relatively homogeneous conditions of quartz precipitation.
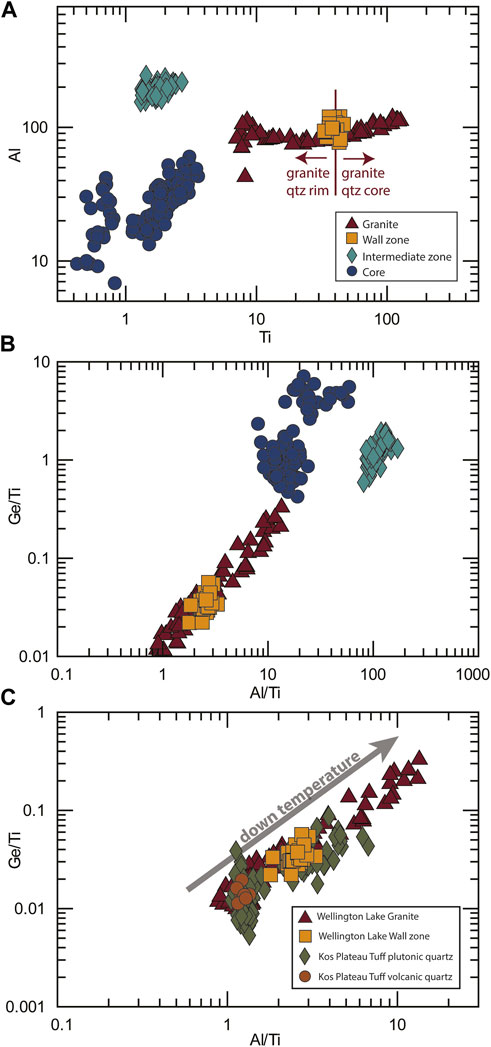
FIGURE 6. Trace elements in quartz crystals from the pegmatite wall, intermediate, and core zones, from the Pikes Peak granite, and reference Kos Plateau Tuff data (Fiedrich et al., 2020). (A) Al vs Ti; (B) Ge/Ti vs Al/Ti; (C) Ge/Ti vs Al/Ti in comparison with the Kos Plateau Tuff. Down temperature path reflects the decrease in the Ti content.
A noticeable compositional gap occurs between the wall zone and the intermediate zone of the pegmatite (Figures 6A,B); the intermediate zone shows much lower Ti concentrations (1–3 ppm) and higher Al (102–245 ppm). Ge is also slightly higher in this zone, with concentrations mostly between 2 and 3 ppm. In the core zone, Ti values are even lower, reaching contents below 0.5 ppm. Al concentrations also drop in this zone, showing values between 3 and 60 ppm. Ge values are similar to the intermediate zone between 1 and 3 ppm.
Using the Ti content in quartz, quartz crystallization temperatures were estimated using the TitaniumQ calibration at, or close to, rutile-saturated conditions (Huang and Audétat, 2012). Rutile was observed in the wall zone, constraining the Ti activity to ∼1.0 for this specific zone. Crystallization temperatures for the granite range from 890°C for bright-CL quartz cores to near 500°C in dark-CL crystal rims and fractures (Figures 5,7). Temperatures for core-to-inner-rim growth zones, just before the dark CL-rims, are generally near solidus (700–660°C). The wall zone of the pegmatite yields a narrow temperature range (700–670°C), partially concomitant with the TISol. Finally, the very low Ti contents of the quartz crystals in the 1) rims and healed fractures of the granitic grains, 2) the inner zones of the pegmatite and 3) the core record low temperatures of crystallization (below 500°C, as low as 370°C). The effect of a potentially lower Ti activity would be limited: at the highest calculated temperatures (>850°C), a 25% lower activity would result in a temperature ca. 40°C higher; at the lowest temperatures (<500°C) the difference would be less than 10°C. If a much lower activity (0.1) is considered for the final stages of the crystallization of the pegmatite (intermediate and core zones), the thermal gap between the wall and intermediate zone virtually disappears, bringing the highest temperatures in the intermediate and core zones near the TISol. Such low Ti activity is not geologically reasonable for the wall zone and the granite, as rutile is present in the former, and granite crystallization is partially concurrent with it.
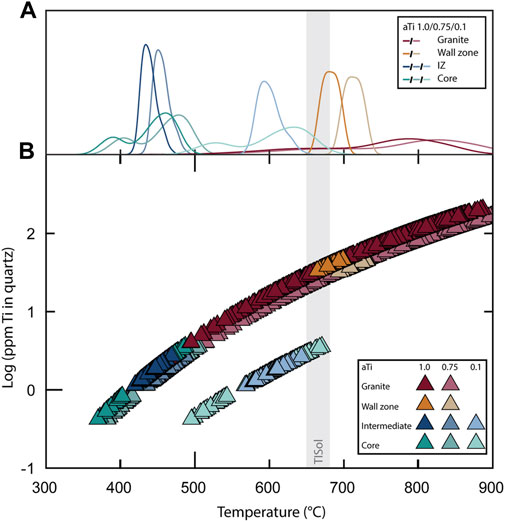
FIGURE 7. Ti-in-quartz crystallization temperatures for the different pegmatite zones (wall, intermediate and core) and the Pikes Peak granite, calibrated for aTi ∼1.0, aTi ∼0.75, and aTi∼0.1; aTi = Titanium activity. IZ = intermediate zone. TISol = traditionally inferred solidus. (A) Temperature density curves; (B) Temperature of each measured point.
Fluid inclusions in quartz
Fluid inclusions are rare within the quartz of the granite and the wall zone. When present, inclusions are remarkably small (<10 µm), occur along healed fractures as observed in CL and are therefore likely to be secondary or pseudo-secondary inclusions entrapped near or below the solidus. No evidence of entrapment of true primary fluid inclusions was observed within these samples.
In contrast, in the intermediate and core zones of the pegmatites, fluid inclusions are abundant. This abrupt change in the amount of fluid inclusions coincides with the compositional gap seen in the quartz chemistry (Figure 6). Fluid inclusions are nearly absent within high-Ti quartz from the granite and the wall zone, whereas they are abundant in low-Ti quartz from the intermediate and core zones of the pegmatite. The fluid inclusions in the internal zones of the pegmatites can occur with a range of sizes and shapes, which can be divided into 4 main groups (Table 2; Figure 8).

TABLE 2. Fluid inclusions assemblages (FIA) observed in quartz crystals of the intermediate and core zones.
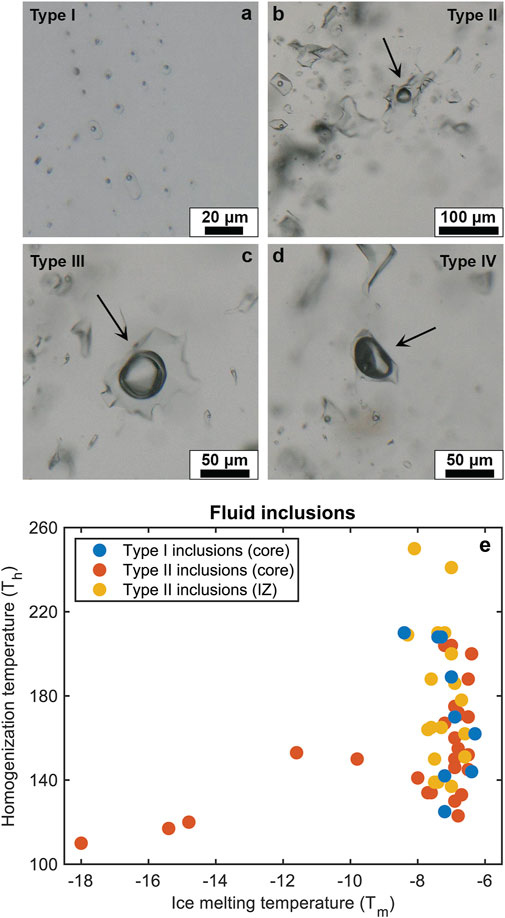
FIGURE 8. Fluid inclusions type I to IV observed in the intermediate and core zones of the pegmatite. (A) Primary brine inclusion, (B) secondary brine inclusions, (C) CO2 inclusion with characteristic double-bubble, and (D) a vapour inclusion. (E) Homogenization and ice melting temperature of fluid inclusions Type I and II in the intermediate and core zones of the pegmatite.
1. Type I corresponds to primary or pseudo-secondary brine inclusions. They tend to be small (<20 µm), show rectangular or polygonal shapes, and occur as trails parallel to the quartz growth zones observed in the CL images. The bubble phase (Fv) corresponds to ca. 10 vol%. Homogenization temperatures (Th) for these inclusions are 140–250°C in the intermediate zone and 125–200°C in the core. Salinity is ca. 10 wt% (NaCleq).
2. Type II inclusions are brine inclusions that occur in patches or in trails and always match dark CL fractures. These inclusions show more variability compared to primary inclusions, with: diverse shapes and sizes ranging from 10 to 90 μm, Fv from 10 to 30 vol%, Th from 110 to 200°C, and salinity ranging from 10 to 18 wt% NaCleq, Inclusions with lower salinity (10 wt%) generally produce higher Th (125–200°C) than inclusions with higher salinity (Th 117–153°C). These low-salinity Type II inclusions were not classified as type I as they occur within observed CL-dark fractures. However, they resemble primary inclusions with respect to their size, bubble phase, shape, Th and salinity, suggesting pseudo-secondary origin. The evolution from these low salinity Type II inclusions to the larger, irregular, and more saline (up to 18%) Type II inclusions is gradual, indicating that these pseudo-secondary inclusions formed closely after quartz crystallization.
3. Type III and IV inclusions are rare and generally scattered throughout the quartz crystals. Type III corresponds to double-bubble CO2 inclusions, which can be up to 80 µm in diameter with irregular or rounded shapes. Type IV are rounded vapor inclusions up to 60 µm in size and show a bubble phase that takes up to 80%–90% of the inclusion volume.
Crystallization temperatures were calculated for different pressures by extrapolating the maximum homogenization temperatures of the primary inclusions (i.e., the minimum entrapment temperature) by extending the calculated isochores. The results suggest minimum entrapment temperature between 300 and 430°C (Table 3) for crystallization pressures of 200–400 MPa in pegmatites, with temperatures ranging from 315 to 431°C for the intermediate zone, and 293–348°C for the core zone.
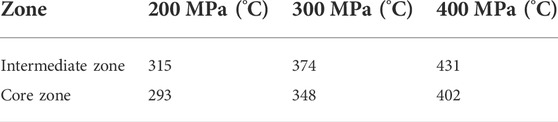
TABLE 3. Fluid inclusions entrapment temperatures calculated for pegmatite typical crystallization conditions based on homogenization temperatures.
Accessory phases
Iron oxides are present in the granite in euhedral to subhedral shapes (Figure 9). Ilmenite was detected as lamellae and as rims around magnetite. Biotite crystals are encountered both in the granite and in the graphic granite part of the pegmatite (border zone). Additionally, fluorite was identified in the granite (Figure 9). Fluorite crystals are seemingly primary, with euhedral crystals up to 1 mm.
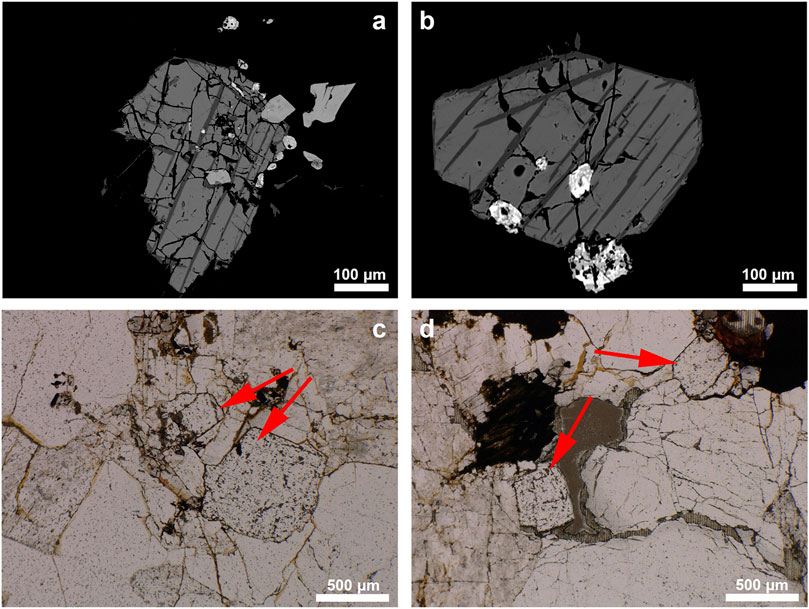
FIGURE 9. (A,B) SEM-BSE images showing magnetite with lamellae and rim of ilmenite, (C,D) Photomicrograph showing euhedral fluorite.
Discussion
Crystallization temperatures in the Pikes Peak granite-pegmatite system
Ti-in-quartz thermometry demonstrates that the crystallization of the Pikes Peak system started at high temperatures, above 850°C, and ended below the traditionally inferred solidus (TISol), reaching conditions below 400°C. This is confirmed by 2-feldspar thermometry in the granite and the fluid inclusion entrapment temperatures in the pegmatite. The highest Ti-in-quartz temperatures (∼890°C) do not necessarily correspond to the earliest stages of the crystallization in the magma chamber, as early high-temperature quartz may have re-equilibrated at lower temperatures. Nonetheless, our results show that quartz and feldspar record crystallization over a large temperature range, starting with temperatures that are well within the range of experimental constraints for A-type magmas (Clemens et al., 1986; Dall’agnol et al., 1999) and falling below the TISol of 650–700°C (Tuttle and Bowen, 1958; Luth et al., 1964; Piwinskii, 1968).
Temperatures recorded in the granite allow for correlation between the different mineral phases and between the granite and the pegmatite. Feldspars compositions in the granite imply a progressive change in crystallization conditions, from near-solidus pairs of K-feldspar and plagioclase (An18 plagioclase cores yield temperatures of ∼700°C) to temperatures below the granitic solidus (An8 plagioclase, ∼ 600°C). The temperatures obtained from the 2-feldspar thermometer in the granite (715–570°C) generally agree well with the temperature range recorded by Ti-in-quartz (890–500°C). The albitic plagioclase rims observed in the crystals represent an even lower-temperature stage, potentially concomitant with the crystallization of the dark rims observed in quartz grains (<620°C).
The compositions and thermometry results demonstrate that the wall zone of the pegmatite crystallized over a narrow temperature interval around the TISol. Although no direct temperature estimates are available for the secondary fluid inclusions in the granite and the pegmatite wall zone, Ti-contents of dark-CL fractures in quartz hosting the inclusions suggest temperatures of 640–590°C for these relatively early, higher-temperature fluid inclusions, hence partially concomitant with the formation of the quartz rims.
The temperatures calculated for the intermediate and core zones of the pegmatites are even lower, falling below 500°C, and below 600°C for lower Ti activities (Figure 7). For the intermediate zone, Ti-in-quartz temperatures overlap with those for some quartz rims/healed fractures in the granite, and some of the core zone of the pegmatite. The partial overlap in crystallization temperatures from intermediate and core zones could reflect either 1) the general uncertainty of the thermometer, 2) the thermometer is not well calibrated for the conditions in which these zones crystallized, or 3) kinetic effects during quartz growth (Acosta et al., 2020). The first point would be supported by the observation that the calculated temperatures (470–420°C for the intermediate zone; 490–370°C for the core) do not differ greatly from the fluid inclusions entrapment temperatures at 400 MPa (ca. 431 and 402°C for intermediate and core zones, respectively). As both thermometers are independent from each other, their similar temperatures generally confirm that crystallization of the intermediate and core zones occurred at temperatures near 400°C.
In summary, these thermometry results show that the Pikes Peak granite-pegmatite system documents nearly continuous crystallization from typical magmatic temperatures of 700–850°C to typical pegmatite-like temperatures of 400–600°C (Thomas et al., 1988; Chakoumakos and Lumpkin, 1990; Morgan VI and London, 1999; Colombo et al., 2012; London et al., 2020), and that this low-temperature crystallization is not only recorded in the pegmatite portion of the system, but also in dark-CL low-Ti rims in quartz and albitic rims in plagioclase in the granite itself.
Constraining crystallization volumes across the magmatic solidus
Traditionally, granite phase petrology implies that most crystallization in systems with near-haplogranitic compositions occurs close to the eutectic or minimum temperature, and thus close to the magmatic solidus temperature at 650–680 °C (e.g., Tuttle and Bowen, 1958; Luth et al., 1964; Piwinskii, 1968; Ebadi and Johannes, 1991). Recently, however, growing evidence has emerged for substantial crystallization of quartz and other minerals phases below this traditionally accepted magmatic solidus (Glazner and Johnson, 2013; Ackerson et al., 2018; Lundstrom, 2020). Based on Ti-in-quartz data and diffusion modelling on granites from the Tuolomne intrusive suite, Ackerson et al. (2018) argued that as much as 90% of quartz and feldspar may have crystallized below the traditionally-inferred solidus temperature (TISol). So far, however, this is the only study quantifying crystallization at pegmatite-like temperatures within a granitic system (from a subduction zone setting).
In the following, we couple growth zone thicknesses from CL images of quartz to Ti-in-quartz temperatures in the same growth zones to determine the volume proportions of quartz crystallizing at different temperatures in the Pikes Peak granite (set in an anorogenic setting). The volumes were obtained by assuming all quartz crystals as spherical. Our calculations (Table 4) suggest that no more than 20% of the granite crystallized under subsolidus conditions, and at least two thirds of the crystallization occurred at temperatures above 720°C (i.e., well above any TISol temperatures).
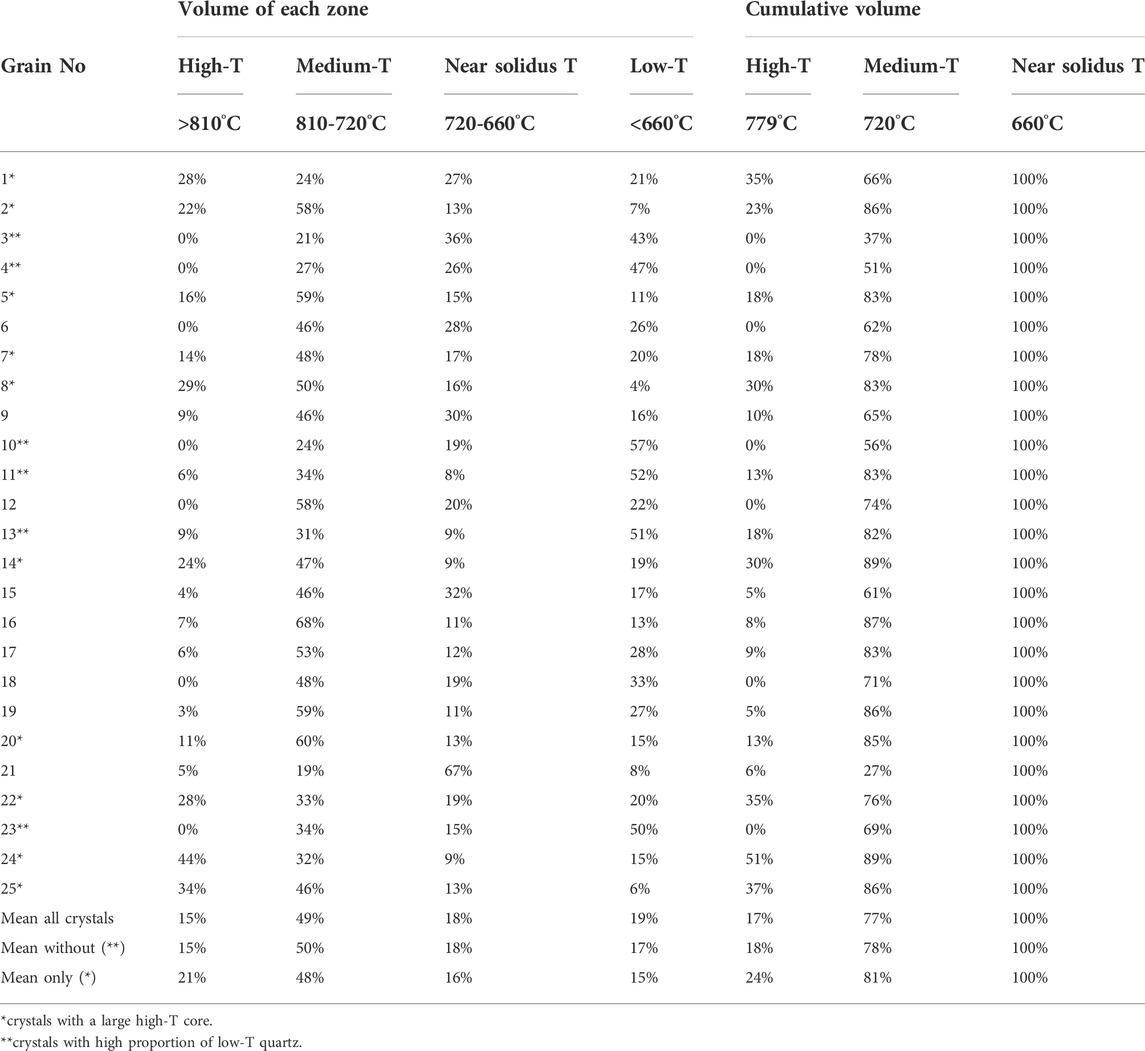
TABLE 4. Volume of quartz crystallized per temperature zone and cumulative volume of magmatic quartz crystallized until the solidus temperature. Means are weighted to the absolute volume of the crystals.
Our estimates assume that quartz sections represent a cut through the center of a spherical quartz grain, in order to accurately reflect the proportion of high-temperature quartz in the center in a 2D section. If the crystals are sectioned closer to the surface, low-temperature growth zones will be overrepresented and high-temperature growth zones underrepresented in the resulting 2D section. We therefore focus on grains capturing the largest temperature ranges in an attempt to reduce this sectioning effect as much as possible and we weigh the averages to the absolute volume (mm3) of approximated spheres. From the 25 measured crystals, 5 crystals have low-temperature zones that represent more than 40% of the crystal and may therefore not correspond to a cut through the center of the sphere. The exclusion of these crystals decreases the proportion of “sub-solidus” quartz slightly, resulting in ca. 17% of the quartz volume crystallizing below TISol temperatures. In both scenarios, less than 20% of the quartz would have crystallized at high temperatures (>810°C, corresponding to the bright cores observed within the CL images). We consider here that crystallization above the TISol corresponds to magmatic conditions, implying precipitation from a melt-dominated environment, in which fluids may be present, but are not dominant (and do not contribute significantly to quartz precipitation). As hydrothermal, we consider those conditions where quartz precipitation occurs only from remaining magmatic fluids. The near-solidus interval represents the intermediate temperature range of the magmatic-hydrothermal transition, or the moment in which the last fraction of melt crystallizes to form magmatic minerals.
The high temperature zone (>810°C) is well pronounced (>10%) in 10 out of 25 crystal, but nearly or completely absent in the remaining ones. If assumed that only these crystals represent a cut through the middle of the spheres, about 21% of the quartz would have crystallized at high temperatures, ∼48% at medium temperatures, ∼16% at near solidus temperatures and only 15% below 660°C. Hence, ∼85% would have crystallized from an unquestionably magmatic environment, and 15% at hydrothermal conditions below the TISol (Tuttle and Bowen, 1958; Luth et al., 1964; Piwinskii, 1968; Ebadi and Johannes, 1991).
Estimating the magmatic quartz component; Rhyolite-MELTS modelling
In order to test whether quartz volume estimates from our textural observations are consistent with thermodynamic phase equilibria at conditions relevant for the Pikes Peak batholith, we compare them with down-temperature quartz crystallization volumes predicted by rhyolite-MELTS (hence from silicate melts only). Down-temperature crystallization pathways were simulated with the thermodynamic software package Rhyolite-MELTS (Gualda et al., 2012; Ghiorso and Gualda, 2015), at pressures between 200 and 500 MPa, initial water contents between 6 and 2.5 wt% in 0.5 wt% intervals, and oxygen fugacity fixed at NNO conditions, as commonly reported for A-type granites (Vander Auwera et al., 2003; Zhu et al., 2016; Li et al., 2017). CO2 was not considered for the models. Three starting compositions were used: 1) a typical melt composition of a tonalite equilibrated at 400 MPa (Patiño Douce 1997), 2) the bulk composition of the Pikes Peak main granite, and 3) the bulk composition of the Keeton Porphyry (both based on in-house XRF measurements).
The data obtained from rhyolite-MELTS were used to constrain a likely solidus temperature for the Pikes Peak Batholith, which was used as the limit for the crystallization of magmatic quartz. It should be noted that rhyolite-MELTS is not calibrated to simulate subsolidus conditions and therefore we only use it for comparison with the supersolidus crystallization estimates in our data, by normalizing our proportion estimates to 100% at the solidus (660°C). At 400 MPa, Rhyolite-MELTS models produced comparable curves of quartz proportions for all three used compositions (Figure 10). Lower pressures (200–300 MPa) lead to an increase of the minimum temperature towards ca. 700°C, failing to recreate the volume-temperature trends observed in our samples. We note, however, that slightly high eutectic temperatures are a previously reported issue with rhyolite-MELTS (Evans et al., 2016). Using the Keeton Porphyry as a starting composition, an initial water content of ca. 2 wt% leads to similar proportions as observed in the natural samples. For both the tonalite and the Pikes Peak bulk composition, initial water concentrations need to be ∼3.0–3.5 wt% to produce the same results. Although detailed barometry and hygrometry estimates are not available for the Pikes Peak system, these conditions are generally consistent with conditions in comparable A-type systems (e.g., Cullers et al., 1992; Elliott, 2001; Frost et al., 2001). In all cases, most quartz crystallizes over a short temperature interval (710–720°C), reaching nearly 100% cumulative quartz volume at temperatures ∼700°C, as expected for a near-eutectic system.
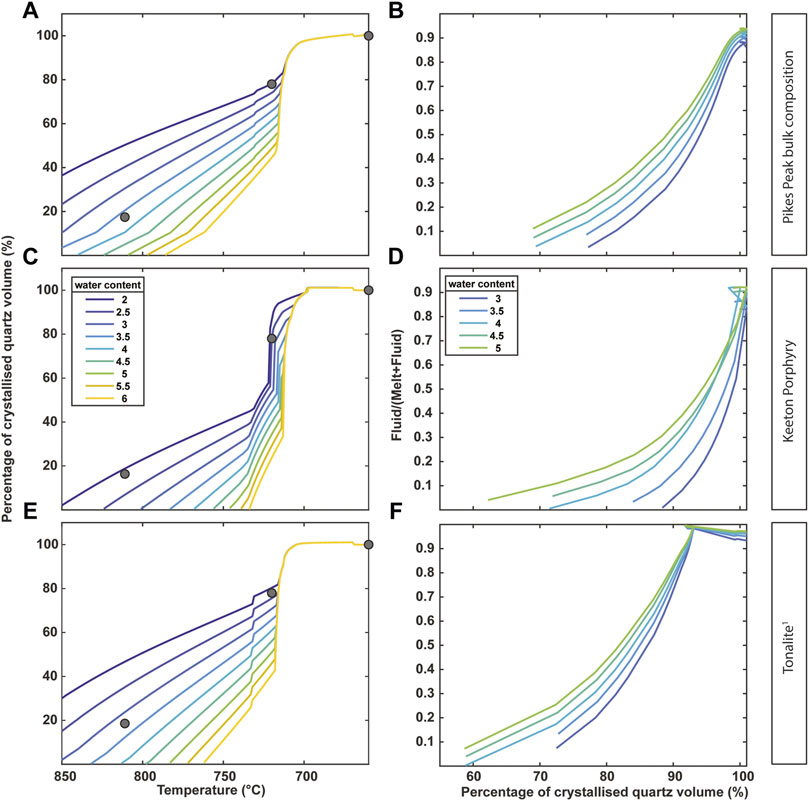
FIGURE 10. (A,C,E) MELTS-rhyolite calculated volume of crystallized quartz from silicate melts as a function of temperature and (B,D,F) exsolved fluid (MVP) volume fraction for the Pikes Peak bulk composition, Keeton Porphyry and Tonalite (1Patiño Douce, 1997) at 400 MPa. Fluid to melt ratio calculated as fluid volume/(melt volume+fluid volume). Round dots on left plots represent the calculated proportions of magmatic quartz at the respective temperatures as of Table 4, excluding the crystals with dark cores.
While future studies are required to understand whether large amounts of subsolidus crystallization in granitic systems correlate with specific magma sources or tectonic settings, these findings highlight that a plutonic system captures an integrated signal over its evolution, ranging from early crystallization at magmatic conditions to late low-temperature precipitation during extended cooling. These results indicate that crystallization at temperatures below the TISol is a substantial process in the Pikes Peak system, representing between 15 and 20% of the quartz volume of the batholith. These proportions are much lower than the 90% estimate suggested for the Tuolumne Intrusive Suite (Ackerson et al., 2018), but still represent a significant non-negligible fraction of the total volume.
Crystallization across the magmatic-hydrothermal transition: Pegmatite formation in granitic systems
Pegmatites are commonly associated with granitic systems, and often interpreted as residual melts from these plutons (Niggli, 1912; Jahns and Burnham, 1969; Shearer et al., 1992; Simmons and Webber, 2008). The granitic connection becomes apparent in the composition of pegmatites, most of them being composed of quartz and K-feldspar, and with a bulk composition that falls close to haplogranite (Norton, 1966; Stilling et al., 2006; London, 2018). Although there have been a few suggestions of metamorphic genesis of pegmatites in the literature (at least since Hess, 1933), most known pegmatites are geographically related to granitic bodies and they typically occur in the upper part of the related pluton (Goad and Cerny, 1981; London, 2018). In the Pikes Peak system, over 200 pegmatites are hosted within the batholith, and pegmatites and granite share similar chemical features, such as REE-enrichment (Vance Haynes, 1965; Simmons and Heinrich, 1980; Simmons et al., 1987). Trace elements in feldspar (Fe) and quartz (Ti, Al, Ge) from the studied pegmatite plot following the trend observed within the granitic samples, indicating that the pegmatite was indeed derived from the granite, and hence, from a magmatic source. This is especially notable when observing the Ge/Ti ratio (Figure 6), often used as an indicator for the evolution of granitic melts (Larsen et al., 2004).
Several observations in our samples suggest a pronounced shift in crystallization conditions throughout the crystallization of the pegmatite: 1) trace element compositions of quartz, 2) major element compositions of the feldspars, and 3) occurrences or absences of fluid inclusions.
Trace elements in quartz show a distinct difference between the wall zone and the intermediate zone of the pegmatite, as illustrated by their Ge/Ti and Al/Ti ratios (Figure 6) and a progressive change from the high-Ti quartz in the granite to the medium-Ti quartz in the wall zone. In trace element space, high-Ti high-temperature quartz from the granite overlaps with volcanic quartz from the Kos Plateau Tuff (Figure 6C; South Aegean Volcanic Arc; SAVA), which is used here as a volcanic fast-quenched reference sample of undisputedly magmatic origin. Quartz compositions from both granite and wall zone overlap with quartz in plutonic clasts co-erupted with the Kos Plateau Tuff (Fiedrich et al., 2020). This similarity suggests that these compositions reflect a common precipitating medium, and that quartz in the granite (except the rim) and wall zone may have dominantly crystallized from a silicate melt. In comparison with the wall zone, the intermediate and core zones (as well as the outermost parts/healed fractures of granitic quartz) plot at very distinct quartz Ge/Ti and Al/Ti ratios, hence suggesting a significant change in the chemistry of the precipitating medium within the pegmatite and granite crystallization history.
The wall and intermediate zone show intergrowth of quartz and feldspar. In the wall zone, feldspar is perthitic K-feldspar with compositions that are similar to those observed in the granite. In the intermediate zone, feldspar becomes an exceedingly homogenous albite, similar in composition to the albitic rims observed in granitic plagioclase. These zones can be correlated with major element variations in the granitic plagioclase and quartz: the plagioclase core (An18) represents crystallization from a silicate melt that gradually progresses to subsolidus conditions under which the core edges (An8) crystallize. This gradual progression is comparable with the same transition observed in the Ti contents in quartz crystals of the granite, ranging from ca. 230 to 45 ppm (before the observed rim). This behavior, as well as the near-solidus temperatures observed in both quartz and feldspar thermometry, suggest that the pegmatite wall zone may have crystallized concomitantly with plagioclase and quartz core edges in the granite. The albitic rims (An3) in plagioclase and low Ti rims/fractures in quartz are in abrupt contrast with the rest of the crystals, hinting at a pronounced change of the medium, and much colder temperatures, which could correspond to the same shift observed between the wall and intermediate zone. The fact that the albitic rims of the plagioclase and the albite crystals of the intermediate zone have the same composition supports this claim.
The abundance of fluid inclusions in the intermediate and core zones confirms that the intermediate and core zone of the pegmatite precipitated from a fluid-rich environment. In the granite and the wall zone, where primary fluid inclusions are absent, fluids may have been present, but should not be inferred as the precipitating medium.
Although models for pegmatite generation differ in many aspects, most of them agree that pegmatites have magmatic (granite-like compositions) as well as hydrothermal characteristics, such as large grain sizes, low crystallization temperatures, and an often monomineralic quartz core (Burnham and Nekvasil, 1986; Nabelek et al., 2010; London and Kontak, 2012; Thomas and Davidson, 2013). Many fluid-mobile elements that are commonly enriched in pegmatites (e.g., F, Li, and B) influence water solubility in the melt and silicate solubility in the fluid. Fluids and late-stage melts are not too dissimilar from each other in these systems and may even be become completely miscible again (“reverse solubility”; e.g., Sowerby and Keppler, 2002; Hack et al., 2007; Nabelek et al., 2010; Thomas and Davidson, 2013; Smirnov, 2015).
The rhyolite-MELTS models can provide an estimate of how much fluid can be expected to be exsolved at a given pressure (here set at 400 MPa), after crystallization of 60%–70% of the total quartz volume (Figure 10). Fluid exsolution is driven by second boiling, due to the crystallization of anhydrous minerals and concurrent reduction in melt fraction, and occurs at temperatures around 700–730°C for any of the starting compositions investigated in this study. As the system’s temperature drops and quartz crystallizes further, the fluid/melt ratio increases to a very high fraction (Figures 10B,D,F). At high degrees of quartz crystallization (>80–95%) the system contains much more fluid than melt, regardless of the initial water content. At pressures of 200–300 MPa, not unlikely for the Pikes Peak system (Baker et al., 1975), the fluid fraction would be even higher. Therefore, for any considered case, the system must have been strongly fluid-saturated near the traditionally inferred 660°C solidus temperature, when pegmatite extraction occurred, and wall zone precipitation commenced (Figure 11). This large amount of exsolved fluid can result in over-pressurization (Parmigiani et al., 2017) that may lead to pegmatite extraction (Troch et al., 2021). This fluid abundance, coupled with the flux enrichment, also reduces the overall viscosity of the liquids present in the system, allowing for injection of what would otherwise be an extremely viscous rhyolitic melt (with viscosities likely > 105 Pas; Scaillet et al., 1998) into small dykes and pods.
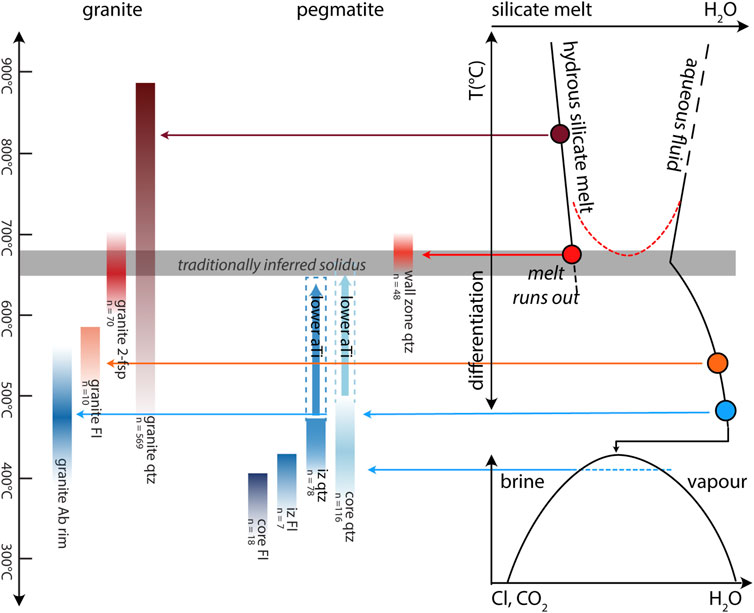
FIGURE 11. Summary of parallel crystallization histories of pegmatite and granite, as established by different methods. All quartz temperatures are calculated considering aTi =1.0, dashed extended areas (IZ qzt, core qtz) show temperature shift if lower activities are considered until aTi = 0.1. Dashed red line represents possible reimmiscibility between melt and aqueous fluids, due to increased concentration of flux elements. Dashed blue line represents the miscibility gap between brine and vapor phases. Arrows connect the estimated temperature ranges (on the left) to their respective relative position in the plots on the right. Granite fluid inclusions reflect indirect measurements (LA-ICP-MS and EPMA analysis of the zone) instead of direct measurements of the inclusion. FI = fluid inclusions; IZ = intermediate zone.
Euhedral fluorite in the granite provides further evidence of the importance of flux elements in the formation of pegmatites associated with silicic A-type systems. Flux elements (in particular F, but also Cl, Li, P) allow for a gradual transition from hydrous silicate melts to solute-rich aqueous fluids by reducing the miscibility gap between these liquids (Sowerby and Keppler, 2002). The presence of primary fluorite in the granite indicates that this magma was already enriched in F in early stages of the crystallization of the granitic magma, leading to higher concentrations towards the late stages near fluid saturation and hence sliding the solidus to lower temperatures than TISol. While complete miscibility between hydrous silicate melt and solute-rich aqueous fluid has been claimed for several pegmatite and mineralized granite systems (Veksler et al., 2002; Thomas and Davidson, 2013), it remains unclear whether this is a general phenomenon during pegmatite genesis (Troch et al., 2021). Incomplete miscibility between silicate melt and solute-rich fluid close to the critical point could explain the distinct differences between quartz compositions in the pegmatite wall zone and those in the intermediate zone (Figure 7). We speculate that, in this case, the temporal progression between crystallization of the wall zone from the hydrous silicate melt endmember and precipitation of the intermediate zone from solute-rich aqueous fluid endmember may be a consequence of the fact that normative granitic components were deposited in the wall zone, leaving the remaining liquid depleted in silicate melt material.
The analysis of the fluid inclusions of the granite and the different pegmatite zones demonstrates that the pegmatite-precipitating fluid becomes progressively more saline and evolves towards a brine, as crystallization conditions change (i.e., cooling and depressurization leading to unmixing of vapour and brine from a supercritical fluid; Driesner and Heinrich, 2007; Lowenstern, 2000). The Wellington Lake pegmatite displays multiple co-existing fluid inclusion types (brines, CO2 and vapour), which is a common characteristic of many pegmatite systems (London, 1986; Sirbescu and Nabelek, 2003; Ashworth et al., 2018) and may be the result of complex immiscibility relationships of different fluid phases (Veksler et al., 2002).
Conclusion
The Pikes Peak system documents a crystallization temperature progression that starts at unquestionably magmatic temperatures (>850°C) in the granite and ends at temperatures below 400°C in the pegmatites, as recorded by the different thermometers applied in this study (Ti-in-quartz, 2-feldspars, and fluid inclusions). This large temperature range, crossing and continuing well below the TISol, represents the transition of a silicate melt to the realm of solute-rich hydrothermal fluids, a process that can be tracked with observations in both the granite and the pegmatite. In the granite, this transition becomes apparent as rims (low Ti rims and healed fractures in quartz, as well as low An rims in plagioclase) that yield low crystallization temperatures (below ∼650°C), but coat crystals that otherwise have higher temperature cores. The transition from such cores to the mentioned rims therefore represents the textural record of the magmatic-hydrothermal transition in the granite. We consider subsolidus crystallization (or fluid precipitation) to be a significant process in the Pikes Peak batholith, but not volumetrically dominant, as we estimate that no more than 20% of the quartz in the granite crystallized at low-temperature hydrothermal conditions.
The magmatic-hydrothermal transition is clearly registered in the pegmatite, as a pronounced chemical change is observed between the quartz of the wall zone (which overlaps with quartz compositions in the granite) and the quartz of the intermediate zone. When it comes to temperature, wall zone quartz crystals fall near or slightly above the TISol, indicating this could have been the last portion to precipitate from a melt, despite the absence of true plagioclase component. As demonstrated by the rhyolite-MELTS models, at any starting composition, the system will become strongly fluid-saturated as the down-temperature paths approach the solidus and the crystal volume increases. Hence, although the pegmatite crystallization may start from the remaining melt, it certainly occurred in an environment in which fluids were already dominant in terms of volume, providing mechanical energy to forcefully emplace these pegmatites in the surrounding near-solidus granitic pluton. These fluids became the precipitating medium of the pegmatite intermediate and core zones, where precipitation occurred at temperatures below 600°C. Such cold crystallization conditions require large amounts of flux elements to keep the typical non-soluble granitic elements (Al, Si, Na, and K) dissolved in the fluid; the presence of primary fluorite in the granite indicates that this magma was strongly enriched in F in late stages of the crystallization of the granitic magma. Further crystallization led to an even greater concentration of this and potentially other flux elements, reducing viscosity and increasing diffusivity, allowing the typically giant pegmatitic crystals to grow. In summary, the paired analysis of the Pikes Peak granite and the Wellington Lake pegmatite demonstrates the textural, chemical, and thermal changes a typical A-type magma chamber undergoes as it transitions from a high-temperature magmatic world to a cold fluid-rich environment below the solidus.
Data availability statement
The original contributions presented in the study are included in the article/Supplementary Material, further inquiries can be directed to the corresponding author.
Author contributions
Data collection was carried out by LMFT. Calculations and rhyolite-MELTS models were conducted by LMFT, with the assistance of JT. The manuscript was prepared by LMFT with the help of JT, JA, and OB. All authors contributed to data evaluation and interpretation.
Funding
This research was supported by Swiss SNF grant no. 200021_185009 (covering LMFT). JT was supported by a Peter Buck postdoctoral fellowship. Open access funding was provided by ETH Zurich.
Acknowledgments
We thank Markus Raschke (CU Boulder) for providing us with the samples; Alejandro Cortes Calderon for the assistance with the EPMA; Marcel Guillong, Peter Tollan, and Lorenzo Tavazzani for the help with LA-ICP-MS analysis; Oscar Laurent (Géosciences Environnement Toulouse, Observatoire Midi-Pyrénées) and Karsten Kunze (ScopeM—ETH Zürich) for their support with SEM analyses. We are grateful for the feedback from two reviewers, and thank Fang-Zhen Teng for the editorial handling.
Conflict of interest
The authors declare that the research was conducted in the absence of any commercial or financial relationships that could be construed as a potential conflict of interest.
Publisher’s note
All claims expressed in this article are solely those of the authors and do not necessarily represent those of their affiliated organizations, or those of the publisher, the editors and the reviewers. Any product that may be evaluated in this article, or claim that may be made by its manufacturer, is not guaranteed or endorsed by the publisher.
Supplementary Material
The Supplementary Material for this article can be found online at: https://www.frontiersin.org/articles/10.3389/feart.2022.976588/full#supplementary-material
References
Ackerson, M. R., Mysen, B. O., Tailby, N. D., and Watson, E. B. (2018). Low-temperature crystallization of granites and the implications for crustal magmatism. Nature 559, 94–97. doi:10.1038/s41586-018-0264-2
Acosta, M. D., Watkins, J. M., Reed, M. H., Donovan, J. J., and DePaolo, D. J. (2020). Ti-in-quartz: Evaluating the role of kinetics in high temperature crystal growth experiments. Geochimica Cosmochimica Acta 281, 149–167. doi:10.1016/j.gca.2020.04.030
Alfonso, P., and Melgarejo, J. C. (2008). Fluid evolution in the zoned rare-element pegmatite field at Cap de Creus, Catalonia, Spain. Can. Mineralogist 46 (3), 597–617. doi:10.3749/canmin.46.3.597
Ashworth, L., Kinnaird, J. A., Nex, P. A. M., Erasmus, R. M., and Przybyłowicz, W. J. (2018). Characterization of fluid inclusions from mineralized pegmatites of the damara belt, Namibia: Insight into late-stage fluid evolution and implications for mineralization. Mineral. Pet. 112, 753–765. doi:10.1007/s00710-018-0569-8
Audétat, A., Günther, D., and Heinrich, C. A. (2000). Magmatic-hydrothermal evolution in a fractionating granite: A microchemical study of the Sn-W-F-mineralized mole granite (Australia). Geochimica Cosmochimica Acta 64, 3373–3393. doi:10.1016/S0016-7037(00)00428-2
Bakker, R. J. (2018). AqSo_NaCl: Computer program to calculate p-T-V-x properties in the H2O-NaCl fluid system applied to fluid inclusion research and pore fluid calculation. Comput. Geosci. 115, 122–133. doi:10.1016/j.cageo.2018.03.003
Barker, F., Wones, D. R., Sharp, W. N., and Desborough, G. A. (1975). The Pikes Peak batholith, Colorado front range, and a model for the origin of the gabbro-anorthosite-syenite-potassic granite suite. Precambrian Res. 2, 97–160. doi:10.1016/0301-9268(75)90001-7
Bodnar, R. J. (1993). Revised equation and table for determining the freezing point depression of H2O-Nacl solutions. Geochimica Cosmochimica Acta 57, 683–684. doi:10.1016/0016-7037(93)90378-A
Burnham, C. W., and Nekvasil, H. (1986). Equilibrium properties of granite pegmatite magmas. Am. Mineralogist 71, 239–263.
Campos, E. A., Touret, J. L. R., and Nikogosian, I. (2006). Magmatic fluid inclusions from the Zaldívar deposit northern Chile: The role of early metal-bearing fluids in a porphyry copper system. Resour. Geol. 56, 1–8. doi:10.1111/j.1751-3928.2006.tb00262.x
Černý, P., and Ercit, T. S. (2005). The classification of granitic pegmatites revisited. Can. Mineralogist 43, 2026. doi:10.2113/gscanmin.43.6.2005
Chakoumakos, B. C., and Lumpkin, G. R. (1990). Pressure-temperature constraints on the crystallization of the harding pegmatite, Taos County, New Mexico. Can. Mineral. 28, 287–298.
Clemens, J. D., Holloway, J. R., and White, A. J. R. (1986). Origin of an A-type granite: Experimental constraints. Am. Mineralogist 71, 317–324.
Colombo, F., Sfragulla, J., and del Tánago, J. G. (2012). The garnet - phosphate buffer in peraluminous granitic magmas: A case study from pegmatites in the pocho district, córdoba, Argentina. Can. Mineralogist 50, 1555–1571. doi:10.3749/canmin.50.6.1555
Cullers, R. L., Griffin, T., Bickford, M. E., and Anderson, J. L. (1992). Origin and chemical evolution of the 1360 Ma San Isabel batholith, Wet Mountains, Colorado: A mid-crustal granite of anorogenic affinities. Geol. Soc. Am. Bull. 104, 316–328. doi:10.1130/0016-7606(1992)104<0316:OACEOT>2.3.CO;2
Dall’agnol, R., Scaillet, B., and Pichavant, M. (1999). An experimental study of a lower proterozoic A-type granite from the Eastern amazonian craton, Brazil. J. Petrology 40, 1673–1698. doi:10.1093/petroj/40.11.1673
DePaolo, D. J. (1981). Neodymium isotopes in the Colorado front range and crust-mantle evolution in the proterozoic. Nature 291, 193–196. doi:10.1038/291193a0
Dolejš, D., and Zajacz, Z. (2018). Halogens in silicic magmas and their hydrothermal systems. Springer Geochem. doi:10.1007/978-3-319-61667-4_7
Donovan, J. J., Lowers, H. A., and Rusk, B. G. (2011). Improved electron probe microanalysis of trace elements in quartz. Am. Mineralogist 96, 274–282. doi:10.2138/am.2011.3631
Donovan, J. J., and Tingle, T. N. (1996). An improved mean atomic number background correction for quantitative microanalysis. Microsc. Microanal. 2, 1–7. doi:10.1017/S1431927696210013
Driesner, T., and Heinrich, C. A. (2007). The system H2O-NaCl. Part I: Correlation formulae for phase relations in temperature-pressure-composition space from 0 to 1000 °C, 0 to 5000 bar, and 0 to 1 XNaCl. Geochimica Cosmochimica Acta 71, 4880–4901. doi:10.1016/j.gca.2006.01.033
Ebadi, A., and Johannes, W. (1991). Beginning of melting and composition of first melts in the system Qz-Ab-Or-H2O-CO2. Contr. Mineral. Pet. 106, 286–295. doi:10.1007/BF00324558
Elliott, B. A. (2001). Crystallization conditions of the Wiborg rapakivi batholith, SE Finland: An evaluation of amphibole and biotite mineral chemistry. Mineralogy Petrology 72, 305–324. doi:10.1007/s007100170021
Evans, B. W., Hildreth, W., Bachmann, O., and Scaillet, B. (2016). In defense of magnetite-ilmenite thermometry in the Bishop Tuff and its implication for gradients in silicic magma reservoirs. Am. Mineralogist 101, 469–482. doi:10.2138/am-2016-5367
Fiedrich, A. M., Laurent, O., Heinrich, C. A., and Bachmann, O. (2020). Melt and fluid evolution in an upper-crustal magma reservoir, preserved by inclusions in juvenile clasts from the Kos Plateau Tuff, Aegean Arc, Greece. Geochimica Cosmochimica Acta 280, 237–262. doi:10.1016/j.gca.2020.03.038
Frost, C. D., Bell, J. M., Frost, B. R., and Chamberlain, K. R. (2001). Crustal growth by magmatic underplating: Isotopic evidence from the northern Sherman batholith. Geology 29, 515–518. doi:10.1130/0091-7613(2001)029<0515:CGBMUI>2.0.CO;2
Fuhrman, M. L., and Lindsley, D. H. (1988). Ternary-feldspar modeling and thermometry. Am. Mineralogist 73, 201–215.
Ghiorso, M. S. (1984). Activity/composition relations in the ternary feldspars. Contr. Mineral. Pet. 87, 282–296. doi:10.1007/BF00373061
Ghiorso, M. S., and Gualda, G. A. R. (2015). An H2O–CO2 mixed fluid saturation model compatible with rhyolite-MELTS. Contrib. Mineral. Pet. 169, 53. doi:10.1007/s00410-015-1141-8
Glazner, A. F., and Johnson, B. R. (2013). Late crystallization of K-feldspar and the paradox of megacrystic granites. Contrib. Mineral. Pet. 166, 777–799. doi:10.1007/s00410-013-0914-1
Goad, B. E., and Cerny, P. (1981). Peraluminous pegmatitic granites and their pegmatite aureoles in the Winnipeg River district, southeastern Manitoba. Can. Mineral. 19, 177–194.
Green, N. L., and Usdansky, S. I. (1986). Ternary-feldspar mixing relations and thermobarometry. Am. Mineral. 71, 1100–1108.
Gualda, G. A. R., Ghiorso, M. S., Lemons, R. v., and Carley, T. L. (2012). Rhyolite-MELTS: A modified calibration of melts optimized for silica-rich, fluid-bearing magmatic systems. J. Petrology 53, 875–890. doi:10.1093/petrology/egr080
Guillong, M., Meier, D. L., Allan, M. M., Heinrich, C. A., and Yardley, B. W. D. (2008). Appendix A6: Sills: A MATLAB-based program for the reduction of laser ablation ICP-ms data of homogeneous materials and inclusions. Mineral. Assoc. Can. Short. Course 40, 328–333.
Guitreau, M., Mukasa, S. B., Blichert-Toft, J., and Fahnestock, M. F. (2016). Pikes Peak batholith (Colorado, USA) revisited: A sims and LA-ICP-MS study of zircon U-Pb ages combined with solution Hf isotopic compositions. Precambrian Res. 280, 179–194. doi:10.1016/j.precamres.2016.05.001
Hack, A. C., Thompson, A. B., and Aerts, M. (2007). Phase relations involving hydrous silicate melts, aqueous fluids, and minerals. Rev. Mineralogy Geochem. 65, 129–185. doi:10.2138/rmg.2007.65.5
Huang, R., and Audétat, A. (2012). The titanium-in-quartz (TitaniQ) thermobarometer: A critical examination and re-calibration. Geochimica Cosmochimica Acta 84, 75–89. doi:10.1016/j.gca.2012.01.009
Jahns, R. H., and Burnham, C. W. (1969). Experimental studies of pegmatite genesis: I. A model for the derivation and crystallization of granitic pegmatites. Econ. Geol. 64, 843–864. doi:10.2113/gsecongeo.64.8.843
Larsen, R. B., Henderson, I., Ihlen, P. M., and Jacamon, F. (2004). Distribution and petrogenetic behaviour of trace elements in granitic pegmatite quartz from South Norway. Contrib. Mineral. Pet. 147 (5), 615–628. doi:10.1007/s00410-004-0580-4
Larsen, R. B., Jacamon, F., and Kronz, A. (2009). Trace element chemistry and textures of quartz during the magmatic hydrothermal transition of Oslo Rift granites. Mineral. Mag. 73 (4), 691–707. doi:10.1180/minmag.2009.073.4.691
Li, X., Chi, G., Zhou, Y., Deng, T., and Zhang, J. (2017). Oxygen fugacity of Yanshanian granites in South China and implications for metallogeny. Ore Geol. Rev. 88, 690–701. doi:10.1016/j.oregeorev.2017.02.002
Liebske, C. (2015). ISpectra: An open source toolbox for the analysis of spectral images recorded on scanning electron microscopes. Microsc. Microanal. 21, 1006–1016. doi:10.1017/S1431927615014336
Loiselle, M. C., and Wones, D. R. (1979). Characteristics and origin of anorogenic granites. Geol. Soc. Am. 12, 468.
London, D. (1984). Experimental phase equilibria in the system LiAlSiO4- SiO2-H2O: A petrogenetic grid for lithium-rich pegmatites. Am. Mineralogist 69, 995–1004.
London, D., Hunt, L. E., Schwing, C. R., and Guttery, B. M. (2020). Feldspar thermometry in pegmatites: Truth and consequences. Contrib. Mineral. Pet. 175, 8. doi:10.1007/s00410-019-1617-z
London, D., and Kontak, D. J. (2012). Granitic pegmatites: Scientific wonders and economic bonanzas. Elements 8, 257–261. doi:10.2113/gselements.8.4.257
London, D. (1986). Magmatic-hydrothermal transition in the tanco rare-element pegmatite: Evidence from fluid inclusions and phase-equilibrium experiments. Am. Mineralogist 71, 376–395.
London, D. (2018). Ore-forming processes within granitic pegmatites. Ore Geol. Rev. 101, 349–383. doi:10.1016/j.oregeorev.2018.04.020
Lowenstern, J. B. (2000). A review of the contrasting behavior of two magmatic volatiles: Chlorine and carbon dioxide. J. Geochem. Explor. 69-70, 287–290. doi:10.1016/S0375-6742(00)00075-3
Lundstrom, C. C. (2020). Continuously changing quartz-albite saturated melt compositions to 330 °C with application to heat flow and geochemistry of the ocean crust. J. Geophys. Res. Solid Earth 125. doi:10.1029/2019JB017654
Luth, W. C., Jahns, R. H., and Tuttle, O. F. (1964). The granite system at pressures of 4 to 10 kilobars. J. Geophys. Res. 69, 759–773. doi:10.1029/jz069i004p00759
Morgan VI, G. B., and London, D. (1999). Crystallization of the Little Three layered pegmatite-aplite dike, Ramona District, California. Contributions Mineralogy Petrology 136, 310–330. doi:10.1007/s004100050541
Murray, M. (1975). Late precambrian volcanic rocks of the southern front range, Colorado, the Keeton porphyry. Mt. Geol. 12, 127–132.
Nabelek, P. I., Whittington, A. G., and Sirbescu, M. L. C. (2010). The role of H2O in rapid emplacement and crystallization of granite pegmatites: Resolving the paradox of large crystals in highly undercooled melts. Contrib. Mineral. Pet. 160, 313–325. doi:10.1007/s00410-009-0479-1
Nekvasil, H., and Burnham, C. W. (1987). “The calculated individual effects of pressure and water content on phase equilibria in the granite system,” in Magmatic Processes: Physicochemical Principles. Editors B. O. Mysen (2nd ed.) (Geochem. Soc. Spec. Publ.) 1, 433–445.
Niggli, P. (1912). Die Gasmineralisatoren im Magma. I. Mitteilung. Z. Anorg. Chem. 75, 161–188. doi:10.1002/zaac.19120750117
Norton, J. J. (1966). Ternary diagrams of the quartz-feldspar content of pegmatites in Colorado. U. S Geol. Surv. Bull 1241, 1–20.
Parmigiani, A., Degruyter, W., Leclaire, S., Huber, C., and Bachmann, O. (2017). The mechanics of shallow magma reservoir outgassing. Geochem. Geophys. Geosyst. 18, 2887–2905. doi:10.1002/2017GC006912
Patchett, J. P., Kouvo, O., Hedge, C. E., and Tatsumoto, M. (1982). Evolution of continental crust and mantle heterogeneity: Evidence from Hf isotopes. Contr. Mineral. Pet. 78, 279–297. doi:10.1007/BF00398923
Patiño Douce, A. E. (1997). Generation of metaluminous A-type granites by low-pressure melting of calc-alkaline granitoids. Geology 25, 743–746. doi:10.1130/0091-7613(1997)025<0743:GOMATG>2.3.CO;2
Peterková, T., and Dolejš, D. (2019). Magmatic-hydrothermal transition of Mo-W-mineralized granite-pegmatite-greisen system recorded by trace elements in quartz: Krupka district, Eastern Krušné hory/Erzgebirge. Chem. Geol. 523, 179–202. doi:10.1016/j.chemgeo.2019.04.009
Piwinskii, A. J. (1968). Experimental studies of igneous rock series central sierra Nevada batholith, California. J. Geol. 76, 548–570. doi:10.1086/627359
Raschke, M. B., Stern, C. R., Anderson, E. J. D., Skewes, M. A., Farmer, G. L., Allaz, J. M., et al. (2021). Bulk composition of a zoned rare-earth minerals-bearing pegmatite in the Pikes Peak granite batholith near Wellington Lake, central Colorado. U.S.A. Rocky Mt. Geol. 56, 18. doi:10.24872/rmgjournal.56.1.1
Richards, J. P. (2003). Tectono-magmatic precursors for porphyry Cu-(Mo-Au) deposit formation. Econ. Geol. 98, 1515–1533. doi:10.2113/gsecongeo.98.8.1515
Sanders, R. (1999). Age of the Keeton Porphyry and clast lithologies within the Pennsylvanian Fountain Formation: Implications for the composition of the upper Pikes Peak Batholith, Front Range, Colorado.
Scaillet, B., Holtz, F., and Pichavant, M. (1998). Phase equilibrium constraints on the viscosity of silicic magmas: 1. Volcanic-Plutonic comparison. J. Geophys. Res. 103, 27257–27266. doi:10.1029/98jb02469
Scott, G. R., Taylor, R. B., Epis, R. C., and Wobus, R. A. (1978). Geological map of the Pueblo 1° by 2° quadrangle, south-central Colorado. U.S. Geological Survey Mischellaneous Investigations Map I-1022, scale 1:250 000, 2 sheets.
Shearer, C. K., Papike, J. J., and Jolliff, B. L. (1992). Petrogenetic links among granites and pegmatites in the Harney Peak rare-element granite-pegmatite system, Black Hills, South Dakota. Can. Mineral. 30, 3.
Sillitoe, R. H. (2010). Porphyry copper systems. Econ. Geol. 105, 3–41. doi:10.2113/gsecongeo.105.1.3
Simmons, W. B. S., and Webber, K. L. (2008). Pegmatite genesis: State of the art. Eur. J. Mineral. 20, 421–438. doi:10.1127/0935-1221/2008/0020-1833
Simmons, W., and Heinrich, E. (1980). Rare-earth pegmatites of the south Platte district, Colorado. Golden, Colorado: Colorado Geological Survey Resources.
Simmons, W., Lee, M. T., and Brewster, R. H. (1987). Geochemistry and evolution of the south Platte granite-pegmatite system, Jefferson county, Colorado. Geochimica Cosmochimica Acta 51, 455–471. doi:10.1016/0016-7037(87)90061-5
Sirbescu, M. L. C., and Nabelek, P. I. (2003). Crystallization conditions and evolution of magmatic fluids in the Harney Peak Granite and associated pegmatites, Black Hills, South Dakota - evidence from fluid inclusions. Geochimica Cosmochimica Acta 67, 2443–2465. doi:10.1016/S0016-7037(02)01408-4
Smirnov, S. Z. (2015). The fluid regime of crystallization of water-saturated granitic and pegmatitic magmas: A physicochemical analysis. Russ. Geol. Geophys. 56, 1292–1307. doi:10.1016/j.rgg.2015.08.006
Smith, D. R., Noblett, J., Wobus, R. A., Unruh, D., and Chamberlain, K. R. (1999a). A review of the Pikes Peak batholith, front range, central Colorado: A “type example” of A-type granitic magmatism. Rocky Mt. Geol. 34, 289–312. doi:10.2113/34.2.289
Smith, D. R., Noblett, J., Wobus, R. A., Unruh, D., Douglass, J., Beane, R., et al. (1999b). Petrology and geochemistry of late-stage intrusions of the A-type, mid-Proterozoic Pikes Peak batholith (Central Colorado, USA): Implications for petrogenetic models. Precambrian Res. 98, 271–305. doi:10.1016/S0301-9268(99)00049-2
Sowerby, J. R., and Keppler, H. (2002). The effect of fluorine, boron and excess sodium on the critical curve in the albite-H2O system. Contrib. Mineral. Pet. 143, 32–37. doi:10.1007/s00410-001-0334-5
Stilling, A., Černý, P., and Vanstone, P. J. (2006). The Tanco pegmatite at Bernic Lake, Manitoba. XVI. Zonal and bulk compositions and their petrogenetic significance. Can. Mineralogist 44, 599–623. doi:10.2113/gscanmin.44.3.599
Taylor, B. E., Foord, E. E., and Friedrichsen, H. (1979). Stable isotope and fluid inclusion studies of gem-bearing granitic pegmatite-aplite dikes. Contributions Mineralogy Petrology 68, 187–205. doi:10.1007/BF00371900
Thomas, A., Bray, C. J., and Spooner, E. T. C. (1988). A discussion of the Jahns–Burnham proposal for the formation of zoned granitic pegmatites using solid-liquid-vapour inclusions from the Tanco Pegmatite, S.E. Manitoba, Canada. Earth Sci. 79, 14292. doi:10.1017/S0263593300014292
Thomas, R., and Davidson, P. (2013). The missing link between granites and granitic pegmatites. J. Geosci. 58, 183–200. doi:10.3190/jgeosci.135
Thompson, A. B., Aerts, M., and Hack, A. C. (2007). Liquid immiscibility in silicate melts and related systems. Rev. Mineralogy Geochem. 65, 99–127. doi:10.2138/rmg.2007.65.4
Troch, J., Huber, C., and Bachmann, O. (2021). The physical and chemical evolution of magmatic fluids in near-solidus silicic magma reservoirs: Implications for the formation of pegmatites. Am. Mineral. 107, 190–205. doi:10.2138/am-2021-7915
Tuttle, O. F., and Bowen, N. L. (1958). Origin of granite in the light of experimental studies in the system NaAlSi3O8-KAlSi3O8-SiO 2-H2O. Mem. Geol. Soc. Am. 74. doi:10.1130/MEM74-p1
Vance Haynes, C. (1965). Genesis of the white cloud and related pegmatites, south Platte Area, Jefferson County, Colorado. Bull. Geol. Soc. Am. 76. doi:10.1130/0016-7606(1965)76[441:GOTWCA]2.0.CO;2
Vander Auwera, J., Bogaerts, M., Liégeois, J. P., Demaiffe, D., Wilmart, E., Bolle, O., et al. (2003). Derivation of the 1.0-0.9 Ga ferro-potassic A-type granitoids of southern Norway by extreme differentiation from basic magmas. Precambrian Res. 124 (2–4), 107–148. doi:10.1016/S0301-9268(03)00084-6
Veksler, I., Thomas, R., and Schmidt, C. (2002). Experimental evidence of three coexisting immiscible fluids in synthetic granitic pegmatite. Am. Mineralogist 87, 775–779. doi:10.2138/am-2002-5-621
Veksler, I. V., and Thomas, R. (2002). An experimental study of B-P- and F-rich synthetic granite pegmatite at 0.1 and 0.2 GPa. Contrib. Mineral. Pet. 143, 673–683. doi:10.1007/s00410-002-0368-3
Wen, S., and Nekvasil, H. (1994). Solvalc: An interactive graphics program package for calculating the ternary feldspar solvus and for two-feldspar geothermometry. Comput. Geosci. 20, 1025–1040. doi:10.1016/0098-3004(94)90039-6
Wobus, R. A. (1976). “New data on potassic and sodic plutons of the Pikes Peak batholith, central Colorado,”in Studies in Colorado field geology. Editor R. C. Weimer (Golden, Colorado: School of Mines), 57–67.
Keywords: magmatic-hydrothermal transition, granite, pegmatite, subsolidus, A-type
Citation: Fonseca Teixeira LM, Troch J, Allaz J and Bachmann O (2022) Magmatic to hydrothermal conditions in the transition from the A-type Pikes Peak granite (Colorado) to its related pegmatite. Front. Earth Sci. 10:976588. doi: 10.3389/feart.2022.976588
Received: 23 June 2022; Accepted: 11 August 2022;
Published: 08 September 2022.
Edited by:
Fang-Zhen Teng, University of Washington, United StatesReviewed by:
Ze-Zhou Wang, University of Washington, United StatesPura Alfonso, Universitat Politecnica de Catalunya, Spain
Copyright © 2022 Fonseca Teixeira, Troch, Allaz and Bachmann. This is an open-access article distributed under the terms of the Creative Commons Attribution License (CC BY). The use, distribution or reproduction in other forums is permitted, provided the original author(s) and the copyright owner(s) are credited and that the original publication in this journal is cited, in accordance with accepted academic practice. No use, distribution or reproduction is permitted which does not comply with these terms.
*Correspondence: Ludmila Maria Fonseca Teixeira, bHVkbWlsYS5mb25zZWNhQGVyZHcuZXRoei5jaA==